Embed Size (px)
Citation preview

A Megacity in a Changing Climate: Water-logging in Kolkata
Susmita Dasgupta
Asvani K. Gosain
Sandhya Rao
Subhendu Roy
Maria Sarraf
DECEE & SASDITHE WORLD BANK
January 2011

Presentation Outline
Background
Modeling of Urban Flooding
Inundation Area Estimates
Vulnerable Area & Population
Damage Assessment
Adaptation Deficit
Adaptation Strategy

Kolkata in a Changing Climate
An increase in the frequencies and intensitiesof climate extremes is expected in a changingclimate in the 21st century (IPCC, 2007).
Megacities in the low-lying deltas of Asia havebeen identified as “hotspots” (ADB, 2008).
In India, megacity Kolkata is particularlyvulnerable to climate risks.
Densely populated slums and shanties withlimited infrastructure and service delivery aremost susceptible.

Kolkata, India
Kolkata is the capital of the State of West Bengal in India; a KeyEconomic Center.
Kolkata Metropolitan area (KMA) features among the 30 largest mega-cities of the world having population in excess of 10 million.
The population of the KMA is 14.72 million (Census, 2001). Its populationis projected to rise to 17 million in 2011, 20 million in 2021, and 21.1million in 2025.
The KMA has a tropical wet-and-dry climate with an annual meantemperature of 26.80C and monthly mean temperatures in the range of19-300C. The region around KMA is subject to short, high intensityprecipitation, especially during the monsoon months between June andSeptember. The annual rainfall is about 1,600 mm and the highest rainfallusually occurs during the monsoon, in the month of August.
The elevation of KMA is within a range of 1.5 to 11 meters above the sea-level (masl) with an overall average of about 8 meters masl.
While the KMA is often perceived as a coastal city, in reality it is about 145km away from the Bay of Bengal.

KMA / KMC
Area Population Landuse
KMA 3 Municipal Corporation
including the KMC + 38
Municipalities+77 non-
Municipal Urban Towns + 16
Out Growths + 445 Rural
Areas
1,851
km2
14.7 million Urban built up
land accounts for
54.2%, of which
the share of
residential is
31.2%
KMC 141 wards 185 km2 4.6 million Residential and
mixed residential
area accounts for
68%
Kolkata Municipal Corporation (KMC) is the more urbanizedheart of KMA.
The KMC lies along the tidal reaches of the Hooghly River,and was once mostly a wetland area.

KMA / KMC: Geographical Context

Urban Flooding in Kolkata
Modest flooding in Kolkata is an annual feature during themonsoons, whenever intense rain is accompanied with majorstorms and high tide in the Hooghly River.
Three potential threats to KMC and KMA:
1. Natural factors: The flat topography and low relief of the area.
2. Developmental factors: These include unplanned andunregulated urbanization, low capacity drainage and sewerageinfrastructure that have not kept pace with the growth of the cityor demand for services, siltation in available channels,obstructions, mainly through uncontrolled construction in thenatural flow of the storm water, reclamation of and constructionin natural drainage areas (marshlands), etc.
3. Climate change aspects: Changes such as increase in theintensities of rainfall, sea level rise and the increase in the stormsurges that may increase the intensity and duration of theflooding event.

Modeling Climate Change
Baseline (without climate change) scenarios: Three baselinescenarios of flooding arising from historic precipitation level for 30year, 50 year, and 100 year occurrence were modeled assuming noclimate change effects. Historical rainfall data obtained from continuousrecording rain gauges, at each successive 15-minute interval, for themonsoon period (April to September) from 1976 to 2001 was used toestimate the return periods of precipitation events .
Climate Change Scenarios were modeled using projections providedby Japan Bank for International Cooperation (JICA, 2008). Patternscaling techniques were applied to 16 Atmospheric-Ocean GeneralCirculation Models used for the IPCC AR4. The scenario predictionsincluded a temperature increase in Kolkata of about 1.80C for A1F1scenario and 1.20C for B1 scenario. Precipitation predictions wereprovided as a fractional increase in the precipitation extremes of about16 percent for A1F1 and 11 percent for B1 scenario imposed above thebaseline distribution of precipitation. A sea level rise of 27 cm by 2050was added to the storm surge for the A1F1 and B1 climate.

Modeling Urban Flooding
Three models: hydrological, hydraulic and Urban Storm models were usedto capture the effect of all factors that lead to flooding in the KMC.
1. A hydrological model: Soil and Water Assessment Tool (SWAT) was usedto estimate the water flow in the Hooghly river system. The water flowwas modeled using the rainfall and temperature data obtained from theIndia Meteorological Department for the whole Hooghly River catchmentfor 35 years and water flow from diversions made into Hooghly fromGanga River upstream. This modeling generated daily flow series atvarious locations along the Hooghly River.
2. A hydraulic model: Hydrologic Engineering Centre – River AnalysisSystem (HEC-RAS) was then used to generate flood waves movingthrough the river channel. The tidal and storm surge effects were fed intothe HEC-RAS model as boundary conditions. Output from the modelprovided the water surface profiles all along the river coupled with changein flow depth during the flood period.
3. An urban storm model: Storm Water Management Model (SWMM) wasfinally used to simulate the flooding that will result once the river floodingis combined with local rainfall and drainage capability of the KMC area, byincorporating the prevailing urban characteristics such as the sewerage inplace, pumping capacity of drainage pumps, and the likely operation oflock gates during the flooding period etc.

SWAT Modeling: Spatial Data for Hooghly Basin

HECRAS Model: Input
Peak water level rise in the event of a 50 year storm for the coastal districts of West Bengal
: Source: Adopted from Jain et al. (in Press)
Return Period (year)
10 25 50 100
Maximum Wind
Speed (km/hr)
167 195 215 231
Maximum Storm
Surge height (m)
4.5 6.3 7.8 9.2
Maximum storm surge recorded along the coast of West Bengal

SWMM Model: Inputs
Drainage Basins of the KMA Pumping Stations in KMC

Model Calibration and Validation
The theoretical distribution of rainfall patterns for a 100 yearreturn period was compared with observed 15 minute rainfallintensities in the study area from 1976 to 2001. A comparisonwith the 1978 rainfall pattern on September 27, 1978 from5:03 PM to 8:00 PM, a period with the highest rainfall intensityin recent times, showed a good match with the theoretical 100year return period rainfall.
The flow obtained from the SWAT model for flood peaks wasalso matched with theoretically generated flow from a numberof distributions. The Gumbel Extreme Value Type I distribution,with a resultant R2 of 0.98 between the simulated flow usingSWAT and the synthetic flow from the statistical distributionshowed the best fit. The peak flow for all other return periodswere therefore based on the Gumbel distribution.

Inundation Area Estimates: 30 yr Flood
KMA outside KMC KMC
Flood depth range (m) 30 yr 30yr+
A1F1
30yr+
B1
30 yr 30r+
A1F1
30yr+
B1
0.00 - 0.10 56.5 46.7 49.1 1.0 0.3 0.3
0.10 - 0.25 21.4 22.1 22.4 4.7 1.7 1.7
0.25 - 0.50 9.4 15.8 14.4 13.6 7.3 8.5
0.50 - 0.75 1.6 3.6 3.0 9.3 12.1 9.9
0.75 - 1.00 0.0 1.1 0.6 2.7 6.3 5.1
1.00 - 1.50 0.0 0.1 0.0 2.2 3.5 3.6
1.50 - 3.00 0.0 0.0 0.0 1.1 1.5 1.3
> 3.0 0.0 0.1 0.1

Inundation Area Estimates: 50 yr Flood
KMA outside KMC KMC
Flood depth range (m) 50 yr 50yr+
A1F1
50yr+
B1
50 yr 50yr+
A1F1
50yr+
B1
0.00 - 0.10 47.8 38.7 41.2 0.7 0.3 0.3
0.10 - 0.25 22.2 24.1 23.8 3.9 1.5 1.4
0.25 - 0.50 14.9 16.6 16.7 11.3 6.4 6.9
0.50 - 0.75 3.1 6.9 5.4 11.9 11.9 12.2
0.75 - 1.00 0.8 2.2 1.9 4.0 8.2 7.4
1.00 - 1.50 0.0 0.9 0.4 2.5 4.4 3.9
1.50 - 3.00 0.0 0.0 0.0 1.4 1.8 1.7
> 3.0 0.0 0.3 0.2

Inundation Area Estimates: 100 yr Flood
KMA outside KMC KMC
Flood depth range (m) 100 yr 100yr+
A1F1
100yr+
B1
100 yr 100yr+
A1F1
100yr+
B1
0.00 - 0.10 40.6 29.4 34.1 0.3 0.2 0.2
0.10 - 0.25 23.8 26.8 24.5 2.8 1.9 2.2
0.25 - 0.50 16.7 16.0 16.4 10.4 7.6 8.1
0.50 - 0.75 5.4 10.5 9.2 15.5 13.9 15.1
0.75 - 1.00 1.9 3.7 2.9 7.2 11.1 10.0
1.00 - 1.50 0.4 2.2 1.6 4.1 5.9 5.3
1.50 - 3.00 0.0 0.2 0.1 2.0 2.2 2.1
> 3.0 0.2 0.4 0.3
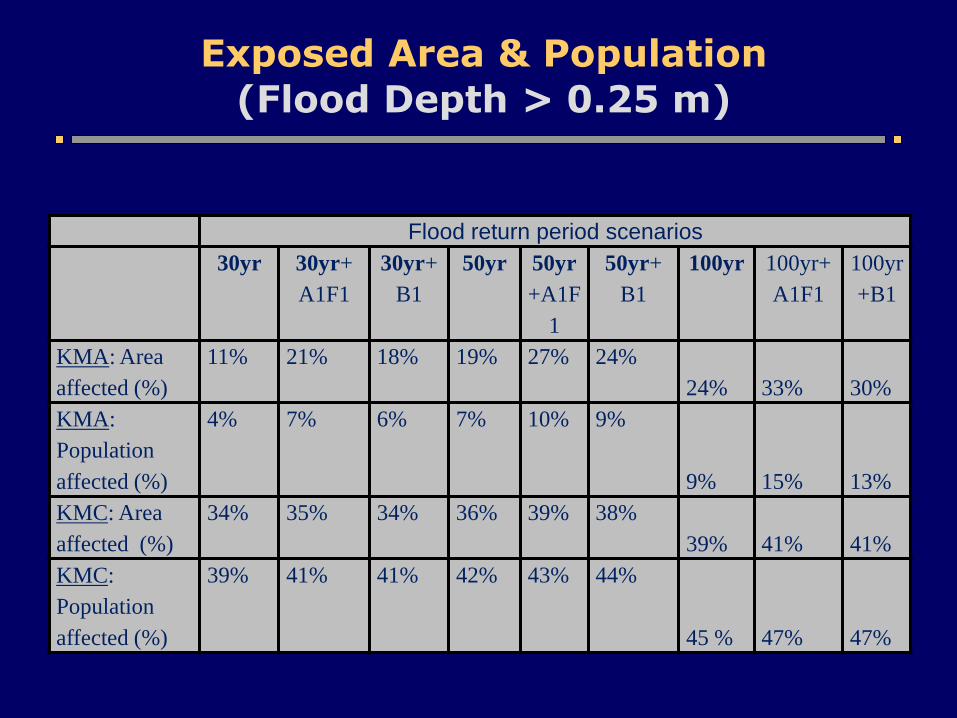
Exposed Area & Population
(Flood Depth > 0.25 m)
Flood return period scenarios
30yr 30yr+
A1F1
30yr+
B1
50yr 50yr
+A1F
1
50yr+
B1
100yr 100yr+
A1F1
100yr
+B1
KMA: Area
affected (%)
11% 21% 18% 19% 27% 24%
24% 33% 30%
KMA:
Population
affected (%)
4% 7% 6% 7% 10% 9%
9% 15% 13%
KMC: Area
affected (%)
34% 35% 34% 36% 39% 38%
39% 41% 41%
KMC:
Population
affected (%)
39% 41% 41% 42% 43% 44%
45 % 47% 47%

Inundation Depths in KMC: 100 Year and A1F1 Scenario

KMC: Ward-level Vulnerability Index
100 year +A1F1 Flooding
0
0.5
1
1.5
2
2.5
3
3.5
76 105 62 77 51 137 52 134 73 87
We
igh
ted
Flo
od
Vu
lne
arb
ility
In
de
x
KMC WARD
Top 10 Vulnerable wards
Index was computed as the weighted sum of % of area under 3 different flooddepth ( > 1.5 m, 0.75m-1.5m and 0.25m-0.75 m) for each consecutive day up to10th day of flooding.

KMC: Sub-ward Vulnerability
Urban Flooding: Damage Assessment
Damage during flooding results from submersion of building andproperty as well as disruption of livelihood among the floodaffected population.
The damage is further enhanced the longer the floodingpersists.
In general, both the depth and duration of a flood play a role inthe damage it causes.
The depth of an inundation has more effect on the physicalcapital; and if the depth exceeds a critical level then duration ofa flooding has greater impact on the day to day livelihood of thepopulation.
It is hard to quantify and monetize damages and losses from urban flooding.

Damage Assessment: KMC-2050
The focus is on the likely impact of flooding arising out of climate
change effects in the KMC in the year 2050.
Water Levels & Expected Impact: (0.25 – 0.75 m) leading to a lowimpact; (0.75 – 1.50 m) leading to a moderate impact, and (> 1.50 m)causing an extensive impact were identified. It has been found that adepth level below 0.25 m produces little damage in most affected areasas people in the KMC have learned to adapt to such level of flooding asa common occurrence every year.
Water level and associated damage severity was adopted fromhttp://www.srh.noaa.gov/mlb/ghls/index.php?threat=inland
Since the extent of flood damage also depends on the duration offlooding, the duration of flooding above 0.25 m level is analyzed up to10 days in order to examine the severity of flood damage. The cut-off of10 days was chosen as damage caused by flood water generally reachesthe upper threshold of damage caused if flooding persists that long. Inaddition, it was found that water starts receding rapidly from most areasin the KMC by that period even for the A1F1 scenario with the 100 yearflood.

Damage Assessment: Methodology
The damage is estimated separately for the following main sectorsof the economy: residential, commerce and industry, health, road,transport, electricity, telecommunication, and water -supply.
In each sector, efforts have been made to estimate the damage tophysical capital and the damage to earnings to get an estimate oftotal damage.
Damage to Physical Capital = Value of Physical Capital* Percentageof Physical capital Exposed to Flooding*Damage Factor
Damage factor is estimated based on the depth and duration offlooding.
Damage to Earning = Daily Value of Income/Output*AverageNumber of Days of Loss.

Illustrative Examples

Residential Damage & Income Loss
Residential Damage
Building Repair Cost
Building Clean-up
Cost
Property Damage

Residential Building Repair Cost : Methodology
Estimates of the repair costs are based on replacement costs of the damaged buildings.
Building Blocks:
The city residential buildings were classified into the three categories ofhousing: Economically Weaker Sections (EWS), Middle Income Groups (MIG)and High Income Groups (HIG) using Google Earth data .
The composition for 2050, EWS: 22%, MIG: 57% and HIG: 21% is assessedbased on a percentage estimate of EWS moving out of core city areas.
The average floor areas for EWS (25 sq m), MIG (75 sq m) and HIG (150 sq m)were determined upon consultation with the town planning authority in theKMC.
The building construction costs in Kolkata per sq m of floor area are found to beRs. 7,000 per sq m for EWS, Rs. 8,133 per sq m for MIG, and Rs. 11,200 per sqm for HIG based on the ACC Help Home Building Calculator at 2009 prices.
Using the floor area for each category of residential building, the constructioncosts for EWS, MIG and HIG buildings at 2009 prices are calculated.
The building construction costs are then extrapolated to 2050 costs using anannual growth rate in construction costs.

Residential Building Repair Cost : Methodology
(continued)
Past experience suggests that residential building damage from flooding will occur only at the first floor.
Observation reveals that on average, EWS are two storied, MIG are threestoried, and the HIG are four storied buildings.
Any inundation of depth > 0.25 meter for more than a day is expected tocause a minimum threshold proportional damage requiring repair thatvaries with the type of the building. The minimum damage thresholddiffers across EWS (33%), MIG (25%) and HIG (20%) buildings due tothe quality of building material used in the construction. It is alsoassumed that any building submerged for 10 days or more (withinundation depth > 1.5 m) will always require repair. The proportion ofbuildings requiring repair decreases linearly for fewer days of inundation.For depths of 0.75 m – 1.5 m and 0.25 m – 0.75 m, the proportion ofdamage is assumed to be 75% and 50% respectively of the proportion fordepth > 1.5 m.
Since the depth of inundation keeps changing as water recedes from agiven area, the proportion of building requiring repair in an area is themaximum proportion found from the inundation duration for the threedifferent depths over a 10 day period.
Clean-up Cost of Residential Building: Methodology
It is assumed that all inundated buildings not requiringrepair will incur clean-up costs.
Clean-up costs mainly involve disinfecting buildingpremises and minor repairs including cleaning of the floor,whitewashing walls etc.
Based on field surveys, Clean-up costs are assessed to bearound Rs 500, Rs 2,000 and Rs 4,000 respectively forEWS, MIG, and HIG.
The building clean-up costs are then extrapolated to 2050costs.

Damage of Residential Property: Methodology
Extensive residential property damage is caused by sudden & prolonged flooding, especially if household property cannot be moved to upper floors.
Building Blocks:
The damage to residential property is estimated based on the totalproperty exposed to inundation in the first floor times a property damagefactor.
The estimate of residential property is based on the household income inthe KMC. In particular, it is assumed that the value of the property owneddepends on the savings accumulated in each income category over a 5year period.
The proportion of households that face property damage in a Ward is givenby the maximum percentage of area flooded in that Ward.
The property damage factor is based on the depth and duration of flooding.Based on observation, it is assumed that a maximum of 33% of householdproperty will be damaged if buildings are submerged for 10 or more dayswith inundation depth > 1.5 m with proportional decrease for fewer days ofinundation. The corresponding maximum damage for depths 0.75 m – 1.5m and 0.25 m – 0.75 m are assumed to be 25% and 20%.

Total Residential Damage: Estimates
Faced with a 100 year flood in 2050, an estimated 14.2% of all household in KMC will face varying degrees of damages to their residential building (0.16 million out of total 1.13 million households) even without climate change. Adding the impact of climate change under an A1F1 scenario will increase this number to 15.2% of all households (or 0.17 million).
Damage of Residential Buildings:
Damages to residential buildings are estimated at Rs 24,700 million in the current climateand at Rs 27,900 million under the added A1F1 scenario with a 100 Year return period event.
Damages to residential buildings are estimated at Rs 22,100 million in the current climateand at Rs 24,900 million under the added A1F1 scenario with a 50 Year return period event.
Damages to residential buildings are estimated at Rs 21,300 million in the current climateand at Rs 24,000 million under the added A1F1 scenario with a 30 Year return period event.
Damage of Residential Property:
Damages to household property are estimated at Rs 34,000 million (for current climate) andat Rs 38,600 million (under the added A1F1 scenario) with a 100 Year return period event.
Damages to household property are estimated at Rs 30,400 million (for current climate) andat Rs 34,600 million (under the added A1F1 scenario) with a 50 Year return period event, atRs 29,300 million (for current climate) and at Rs 33,300 million (under the added A1F1scenario) with a 30 Year return period event.

Residential Income Loss: Methodology
Flooding in the KMC affects the income of 4.6 million KMC residents and 6 million daily migrant workers.
Building Blocks:
The estimates of income loss exclude any income loss in the organized sector.Households in the income bracket above Rs 300,000 are all considered to be in theorganized sector.
The income loss for KMC residents working in the unorganized sector, such as artisansor construction laborers is based on the number of lost work days (average duration offlooding in all of KMC) multiplied by the average income in each category.
In the absence of secondary data on workforce in unorganized sectors, it is assumedthat 90% of households in the lowest annual household income bracket (< Rs75,000), 50% of households in the medium household income bracket (Rs 75,000-150,000) and 10% of households in the higher household income bracket (Rs150,000-300,000) are employed in the unorganized sector.
It is also assumed that 25% of migrant workers commute daily to the KMC are in theunorganized sector. Since workers in the unorganized sector tend to be less skilled, itis further assumed that migrant workers in the unorganized sector earn 33% less onaverage than the average urban worker residing in the KMC.
The income loss for migrant workers is computed based on the number of lost days ofwork - based on the average duration of flooding in all of KMC.

Residential Income Loss: Estimates
The total loss of residential income from the 100 year flood in the
current climate is estimated at Rs 4,300 million, of which the KMC
residents will suffer a loss of Rs 1,200 million while migrant workers
will lose an income of Rs 3,100 million.
Under the added A1F1 scenario, the total income loss from the 100
year flood increases to Rs 5,000 million and the major share of that
loss is faced by migrant workers amounting to Rs 3,700 million.
Under the 50 Year flood, the total income loss is Rs 3,800 million (for
current climate) and at Rs 4,600 million (under the added A1F1
scenario).
Under the 30 Year flood, the total income loss is Rs 3,500 million (for
current climate) and at Rs 4,500 million (under the added A1F1
scenario).

Health Sector Damages
Health Sector Damage
Damage to Infrastructure
Treatment Cost
Loss of Productivity
Damage to health infrastructure could not be estimated due to limited dataavailability.
Increased incidences of water borne diseases are evaluated by assessingboth the additional treatment costs and the loss of productivity due toillness.

Estimation of Treatment Cost
Building Blocks:
Annual incidence of major water borne diseases in the KMC totalsaround 5.86% (Gastroenteritis, Cholera: 3.46%, Hepatitis: 0.05%,Typhoid: 0.18%, Malaria, Chickengunya Dengue: 2.17%).
During the rainy season and its immediate aftermath it has beenobserved that incidences of water borne diseases more thandouble.
A conservative estimate of doubling of the incidence of waterborne disease (to 11%) in the flooded area is used for both the100 Year flood and the A1F1 scenario.
Average per capita health care costs for treating such water bornediseases are estimated around Rs 440 at 2009 prices.

Estimation of Loss of Productivity
Building Blocks:
In West Bengal, an estimated 171 DALYs per thousand urbanpopulation is estimated to be lost every year due to variousdiseases, of which about 17% of such DALYs are caused byinfectious and parasitic diseases. More than half of such diseasescan be traced back to water borne causes.
It is estimated that around 14 DALYs per thousand people will belost due to water borne diseases in the KMC in 2050.
In order to factor in the impact of climate change, a doubling ofincidence of water borne diseases in the flooded area is used forboth the 100 Year flood and the added A1F1 scenario.
A value of a statistical life of Rs 15 million computed through asurvey among workers in Chennai and Mumbai byS. Madheswaran, 2007, is used to value economic losses due tomorbidity.

Health Sector Damage: Estimates
With no climate change effects, a 100 year flood in 2050 will resultin Rs 600 million treatment costs and a loss in productivityamounting to Rs 16,500 million.
In a changing climate, under A1F1 scenario the treatment cost isexpected to increase to Rs 700 million and the loss of productivitywill be Rs 17,700 million under a 100 year flood in 2050.
The total damage arising from treatment cost and productivity lossunder a 50 year flood amounts to Rs 15,500 million respectively(for current climate) and Rs 17,000 million respectively (underadded A1F1 scenario).
Under a 30 year flood the corresponding damages are Rs 14,900million respectively (for current climate) and Rs 16,500 millionrespectively (under added A1F1 scenario).

KMC: Total Losses in major Sectors(In 2050)
Rs Million 30 Year
Flood
30 Year
A1F1
Scenario
50 Year
Flood
50 Year
A1F1
Scenario
100
Year
Flood
100 Year
A1F1
Scenario
Residential Building 21,300 24,000 22,100 24,900 24,700 27,900
Residential Property 29,300 33,300 30,400 34,600 34,000 38,600
Residential Income 3,500 4,500 3,800 4,600 4,300 5,000
Commerce 5,700 8,500 6,400 8,700 7,800 9,300
Industry 1,900 2,700 2,200 2,800 2,600 3,000
Health Care 14,900 16,500 15,500 17,000 17,200 18,400
Roads 1,800 2,200 1,900 2,300 2,100 2,400
Transport 2,600 3,400 2,800 3,500 3,300 3,800
Electricity 260 350 270 360 300 380
Total 81,260 95,450 85,370 98,760 96,300 108,780

KMC: Total Expected Damages in 2050

Autonomous Adaptation
Urban flooding during monsoon period is a recurring phenomenon in Kolkata.
Local population has learnt to adapt by developing a number of coping strategies for facing periodic episodes of flooding.
Questions of interest:
1. What are the current coping strategies?
2. Will autonomous adaptation be sufficient to cope in a changing climate?
3. What role can the govt. play in encouraging autonomous adaptation?
4. Will investment in raising awareness be effective in
promoting autonomous adaptation?

Adaptation Deficit
Deficit in sewerage network and treatment infrastructure
Deficit in drainage infrastructure
Operation of major pumping stations at less than rated capacity.
Reduction in the hydraulic capacity of the outfall canal system due to siltation and deposition of solid waste.
Deficit in financial resources and institutional capacity
User charges for municipal services cover only a fraction of the cost.
Lack of commercial approach.
Insufficient/ Little/ Modest private sector participation.
Coordination problem due to multiplicity of govt. agencies
The poor are the most affected.

Adaptation Strategy
Investment in hard infrastructure Investment in the Sewerage System
Investment in the Storm Water Drainage System
Investment in other infrastructure (e.g., Rain Water Harvesting, other public infrastructure)
Investment in soft infrastructure Comprehensive approach to planning
Institutional changes
Watershed Management
Strengthening of disaster management & preparedness
Strengthening of regulatory & enforcement process
Introduction of sustainable financing

Investment in Hard Infrastructure
Investment in the Sewerage System
De-silting of Trunk Sewers
Construction of additional Trunk Sewers
Extension of sewerage system to un-served area
Construction of deep pump sumps &/ rehabilitation of pumpand changing gradation of existing sewers
Sewage Treatment
Investment in the Storm Water Drainage System
Improvement in the storm water drainage system from thecore KMC to Kulti river
Renovation & rehabilitation of the canal system
Investment in other Infrastructure
Investment in rain water harvesting
Investment in solid waste management, water supply, publichealth.

De-silting of Trunk Sewers
33.7536.44
38.5640.97 40.76
38.9442.24
44.8947.43 46.97
0
5
10
15
20
25
30
35
40
45
50
55
60
65
30 50 100 A1f1 B1
Baseline Climate Change
Pe
rce
nt
of
KM
C
Scenarios
Area Affected (%)
Population Affected (%)
Business as Usual Scenario
28.7831.11
33.08
36.4 37.37
34.5937.14
39.7642.58 43.57
0
5
10
15
20
25
30
35
40
45
50
55
60
65
30 50 100 A1f1 B1
Baseline Climate Change
Pe
rce
nt
of
KM
C
Scenarios
Area Affected (%)
Population Affected (%)
Adaptation Scenario
Adaptation (30% de-silting ) can reduce area flooded by 4% and population affected by 5%.
Points of Interest:
1. Is 30% de-silting feasible?2. Targets of on going projects & projects in the pipe line

Hard Infrastructure (continued)
Construction of additional trunk sewers
Extension of sewerage system to un-served areas
Pumping stations
Rainwater harvesting
Points of Interest:
1. Feasible capacity augmentation in the town & suburban systems.
2. Feasibility of improving and extension of sewerage & drainage in Cossipore - Chitpur area and extension of sewerage & drainage in the areas added to KMC limit in 1984.
3. Feasibility of rain water harvesting on a commercial scale.
4. On going projects & projects in the pipeline.
5. Critical bottlenecks.

Investment in Soft Infrastructure
Comprehensive approach to planning recognizing complexity & Interconnectivity of storm water drainage, water supply, waste water, water pollution control, water reuse, soil erosion, solid waste management
Institutional changes
Watershed management
Strengthening disaster management & preparedness
Strengthening regulatory & enforcement process
Points of Interest:1. Feasibility.
2. Critical bottlenecks.
3. Action plan.

Conclusion
Urban flooding is the most critical climate related hazard in Kolkata.
Climate change is likely to intensify this problem through a combination of more intense local precipitation, riverine flooding in the Hooghly and coastal storm surges.
Estimates indicate, the annual expected damage from urban flooding in Kolkata islikely to be nearly $5 billion in a changing climate by 2050; and this is likely to beeven higher in future years.
The current development plans for Kolkata is only up to 2025; and do not accountfor the possible long-term effects of climate change or any adaptation that maybe needed to cope with the problems arising out of climate change over time.
The projects currently being implemented or in the pipeline in KMC were selectedusing cost- benefit analysis based on impact estimates from current weatherrelated data. The impacts from climate change were not included in such analysis.Due to the increased flooding and damage caused by climate change, it is likelythat use of cost benefit analysis using the Net Present Value (NPV) approach thattakes into account climate change effects will increase the viability of manyprojects not found viable earlier with only current weather data.
Hence, there is a need for making climate change effects an integral part in all future planning for adaptation in Kolkata.

Photographs downloaded
from Google Images.