Embed Size (px)
Citation preview

AN ABSTRACT OF THE THESIS OF
Janet VanDusen Smoker for the degree of Master of Science
in Fisheries and Wildlife presented on July 30, 1976
Title: A MENDELIAN STUDY OF CRASSOSTREA GIGAS
Abstract approved: Redacted for PrivacyJames E. Lannan
The genotype frequencies of one-year-old oyster spat
(Crassostrea gigas) from parents of known genotype, are compared
to the frequencies expected with Mendelian inheritance. The geno-
types are characterized at three enzyme loci, Aspartate amino-
transferase (AAT), Phosphohexose isomerase (PHI) and Leucine
aminopeptidase (LAP), and a general protein locus. In this study
expression of these loci as histochemically stained patterns on a gel
following electrophoresis is controlled by two codominant alleles at
each locus.
Frequencies of the genotypes at all four loci, in all offspring
groups investigated, are not statistically different from those
expected with Mendelian inheritance, supporting the hypothesis that
this is the method of inheritance. It is further concluded that there
are no large amounts of selection connected with any of these loci.
An additional observation, that there is no statistical difference
between genotype ratios of siblings in two different growing areas,

is discussed in terms of G. Williams' (1975) "elm-oyster" model.
It is suggested that the search for selection at single loci is probably
not a generally useful one for the oyster breeder.

A Mendelian Study of Crassostrea gigas
by
Janet Van Dusen Smoker
A THESIS
submitted to
Oregon State University
in partial fulfillment ofthe requirements for the
degree of
Master of Science
Completed July 1976
Commencement June 1977

APPROVED:
Redacted for PrivacyAssistant Professor of Fisheries and Wildlife
in charge of major
Redacted for Privacy
Head of Department of Fisheries and Wildlife
Redacted for Privacy
Dean of Graduate School
Date thesis is presented July 30, 1976
Typed by Mary Jo Stratton for Janet Van Dusen Smoker
ACKNOWLEDGEMENTS
This research was supported by a National Science Foundation
Graduate Traineeship (Grant no. GZ2775) and a scholarship from
Northwest Marine Industries.

TABLE OF CONTENTS
INTRODUCTION
Page
1
MATERIALS AND METHODS 6
Experimental Animals 6Accomplishment of Matings 6Larval Culture 7Sampling of Offspring 8Preparation of Samples for Electrophoresis 10Enzyme Systems 12Statistical Tests 1
RESULTS AND DISCUSSION 17
Assortment of Genetic Information 17Linkage Study 32Implications for Genetic Theory 35Implications for the Oyster Hatchery 40
BIBLIOGRAPHY 43
APPENDICES
Appendix A. Spat Strings--Parents and Locations 46Appendix B. Parental Genotypes 48Appendix C. Diagrams of Electrophoretic Patterns 49

LIST OF TABLES
Table Page
1 Larval survival statistics. 9
2 Formulae for buffers and stains. 12a
3 Summary of segregation of AAT alleles. 18
4 Summary of segregation of LAP alleles. 20
5 Summary of segregation of GP alleles. 22
6 Summary of tests for departure fromMendelian inheritance patterns. 24
7 Large-sample test for departure fromMendelian inheritance pattern. 27
8 Test for bay effect on inheritance patterns. 29
9 Tests for departures from Mendelianinheritance patterns. 30
10 Bimonthly samples: genotype distributionsin 30-oyster samples. 31
11 Linkage study. 33

A MENDELIAN STUDY OF CRASSOSTREA GIGAS
INTRODUCTION
With the increased use of aquatic organisms as quasi-
domesticated "crops" has come the realization that genetic research
is not only a means to improve economically important species, but
also necessary if the vigor of stocks is to be maintained.
The oyster has lately become of importance as an experimental
animal, for example as an indicator of environmental quality in bio-
assays (Woe lke, 1972), although it continues to be sought after pri-
marily as a food item. Oysters have been cultured, in some areas
quite intensively, for at least a century. Within historical times, in
some areas oyster populations have been severely diminished through
overfishing (Fasten, 1931) or disease (Sprague, 1971), while other
areas have had exotic species introduced. The close resemblances
and hybridizing abilities of the geographically remote Japanese and
Portugese oysters may be a result of man's early transplanting
activities (Menzel, 1974). Today, with the proliferation of oyster
hatcheries and artificial populations of oysters, it is time to take a
harder look at the relationship between farming oysters and the
genetic structure of the species.
The most intense and long-range investigations of oyster
genetics originated in an attempt to discover disease-resistant

2
strains of the American oyster, Crassostrea virginica (Longwell et al.,
1967). Cytogenetic research at the Milford Research Laboratories of
Connecticut has demonstrated a diploid chromosome number of 20,
with "normal mitosis and meiosis, the latter showing some micro-
scopic evidence of translocations." Later, breeding studies were per-
formed, including interspecific hybridization. Selective breeding
studies resulted in a breeding scheme for maximum vigor realized by
crossing different strains of oyster (Longwell and Stiles, 1973).
Some similar investigations have involved Crassostrea gigas.
The same diploid number of 20 has been verified for C. gigas, as for
all species of oysters studied (Ahmed and Sparks, 1967). Hybridiza-
tion of different species has met with varying degrees of success
(Imai and Saki, 1961; Menzel, 1967). Self-fertilization has been
demonstrated as a potential tool for inbreeding studies (Lannan,
1971). Heritability studies of several economically important traits
has shown that they can be exploited by fairly simple breeding methods
(Lannan, 1972).
The physiology of the Pacific oyster is such that on most of the
West Coast of North America only limited spawning can occur,
requiring oyster growers to import spat or use hatcheries as a source
of "seed." As in the artificial propagation of any species, hatchery
production has both disadvantages and advantages. The potentially
negative aspect is that an undesirable artificial selection may be

3
inherent in hatchery practices. There is statistical evidence that
larval mortalities in the hatchery are non-random, suggesting the
possibility of such selection (Lannan, 1972). Yet the same hatchery
techniques enable the genetical manipulation of oysters in order to
generate lines of oysters with desired economic traits.
To be able to use methods of breeding genetics on oyster
populations with confidence, it must first be confirmed that the breed-
ing system of the oyster is of a Mendelian sort. In other words,
independent segregation of chromosomes during gametogenesis must
occur.
The hypothesis to be tested here is that the numbers of offspring
of several single-locus genotypes in a group of siblings will not be
different from those predicted by Mendelian assortment of genetic
information. Departures from such ratios would imply either some
other form of inheritance, or selection. "Selection occurs when one
genotype leaves a different number of progeny than another. This
may happen because of differences in survival, in mating, or
fertility" (Crow and Kimura, 1970, p. 173). Thus if selection affects
a locus, a departure from the Mendelian distribution of genotype
numbers would be observed; for example, after 10% selection against
the larvae of a certain genotype, the proportions of individuals of
that genotype surviving would only be 90% of that expected without such
selective mortality. The alternatives to the hypothesis are, therefore,

4
that either some other form of inheritance occurs in oysters, or that
selection significantly affects the loci under observation. If selection
is demonstrated, as manifest by significant excesses or deficits of
one of the genotypes at any of the loci, some insight may be gained
into the nature of the non-random larval survival in the hatchery
system.
Selection may occur at several times during the process of
mating oysters and raising their progeny to harvestable size. First,
mating itself may not be completely random; there is variability in
the timing of conditioning for spawning in adult oysters, a trait that
may be under genetic control, so that each adult may not have an
equal probability of mating with every other oyster of the opposite
sex.
The day following successful fertilization of the egg is a critical
one in larval survival. Metamorphosis through the blastula and
gastrula stages should result in the 24-hour "D- shaped" larva. A
considerable proportion of zygotes fail to undergo this transformation
successfully. The second critical period is about four weeks later and
involves metamorphosis of the veliger larvae in preparation for
"setting" or attachment to the substrate. This complex process is
also accompanied by considerable larval mortality.
Mortality of the successfully established spat is usually low in
comparison to the earlier stages. Nonetheless, the potential for
selective mortality exists. As methods for growing spat vary, the

5
young oysters may be exposed to different selective forces according
to their environment. A secondary hypothesis to be tested is that the
selective forces affecting survival of spat in one environment will not
be significantly different from those in another. The test of this will
involve comparing genotype frequencies between bottom-cultured
oysters in one bay and their raft-cultured siblings in another.
In this study single-locus genotypes are determined by electro-
phoretic evaluations of several proteins. Assuming the one gene-one
polypeptide hypothesis, the patterns revealed by electrophoresis and
histochemical staining of oyster tissue may be interpreted as several
forms of a protein resulting from the expression of one or more gene
loci. Codominant alleles at a locus result in patterns predictable
from knowledge of the protein's behavior in an electric field, the
different forms of the protein being known as allozymes. The proteins
investigated in this study had been previously analyzed as producing
electrophoretic patterns which appeared to be compatible with a one-
locus genetic system having two or more codominant alleles (Buroker,
1975). Observation of the offspring of two heterozygous individuals
demonstrates whether the alleles are indeed codominent or whether
different loci are involved; in the latter case only the parental geno-
type would be observed. Observation of the offspring of individuals of
several known genotypes provides data to test the hypothesis of
Mendelian inheritance.

6
MATERIALS AND METHODS
Experimental Animals
Breeding animals, mature Pacific oysters (Crassostrea gigas
Thunberg) were obtained from a stock maintained in Netarts Bay,
Oregon, by Oregon State University, and from Fowler's Oyster
Company in Yaquina Bay, Oregon. These were brought into the
laboratory and conditioned at 18°C in running sea water (Loosanoff and
Davis, 1963).
At the same time, a reference population of 300 oysters was
selected randomly from the Netarts Bay stock, and established in
two fiberglass trays which remained anchored on the mud flats in
Netarts Bay. At approximately two-month intervals (dependent on
convenient low tides), a sample of 30 oysters was randomly drawn
from these trays. These were brought to the labor4.tory and sacri-
ficed immediately prior to electrophoretic characterization.
Accomplishment of Matings
Gametes were obtained either by "stripping" the conditioned
oysters of their sex products with a syringe, or the stimulation of
spawning by raising the water temperature to 30 o C. The sperm and
eggs thus obtained were mixed to produce matings. The crosses were
accomplished on a diallel format in order to produce as many

7
combinations of parental matings as possible and ensure a large
variety of parental genotypes. The allozyme genotypes of the parental
oysters were determined after each successful mating.
Larval Culture
The culture of the larvae involved a small-scale simulation of
the practices and regimes of the Oregon State University oyster
hatchery (Breese and Malouf, 1975). Ten-liter polypropylene buckets
were used as rearing vessels in place of the 400-liter tanks employed
in the production hatchery.
The eggs of each female oyster were divided evenly among a
number of buckets corresponding to the number of spawned male
oysters (not exceeding two million eggs per bucket). A few drops of
turbid sperm and seawater suspension were added to each bucket and
the contents of the buckets gently stirred to aid fertilization. After
five minutes, the volume was adjusted to 10 liters. Two days after
fertilization the larvae were redistributed into additional buckets such
that the density of the larvae was no more than 50, 000 per bucket.
All buckets were kept in a dark room at 25 ± 1°C. All water employed
in the larval culture regime was sand-filtered, ultraviolet irradiated
sea water brought to ambient temperature (25 - 1 °C). The water was
changed twice a week. Each bucket was emptied, the larvae being
retained on screens of appropriate mesh size, then refilled with

8
treated sea water and the larvae were returned to the buckets. At
this time 5 ml of a 5% solution of Sulmet (sulfumethazine) was added
to each bucket for prophylaxis.
The algal food supply was grown in a small-scale simulation of
the oyster hatchery's culture system (Breese and Malouf, 1975).
Batch feeding involved the introduction of enough algae, Pseudo-
isochrysis paradoxa, to each bucket to obtain 40,000 cells /m1 sea
water. The first week the larvae were fed once a day, and twice a
day for the remainder of their pre-metamorphosis period.
At the third week about 40 washed oyster shells (cultch) were
added to each bucket. All successfully metamorphosed larvae
attached themselves to the cultch, where they were then counted.
The cultch from each bucket was strung on heavy cord, each
string being tagged with a plastic tag to identify the mating involved.
These remained in the sea water system of the laboratory until it
was possible to take them to their growing areas. In most cases,
the spat-bearing cultch from each mating was divided into two
groups. The first group was transferred to Netarts Bay at six weeks
of age, where the strings of cultch were tied at both ends to trays
resting on the intertidal mud flats. The second group was suspended
from a raft in Yaquina Bay at 10 weeks of age.
Sampling of Offspring
After a year's growth, 41 samples of 30 oysters were taken.
9
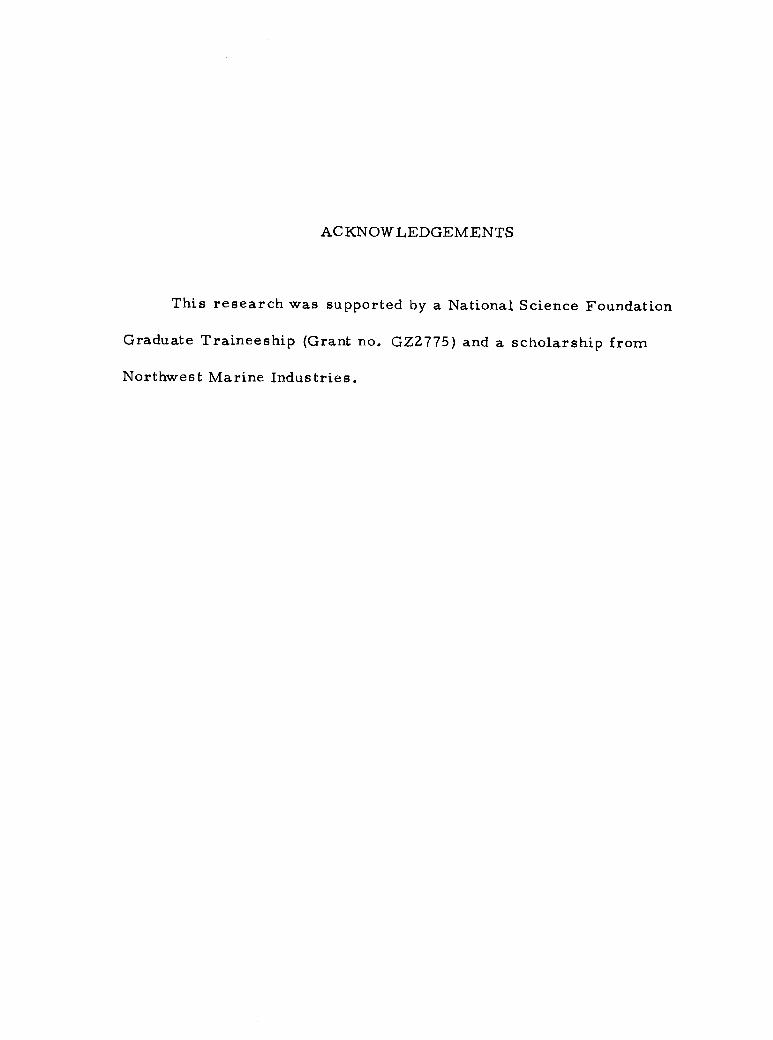
Table 1. Larval survival statistics.
Female MaleEggsgg
produced
"D" shapedlarvae(x 104)
Small spat a, bSurvival Year old spat
No. (% eggs Yaquina Netartsx 10°3)
1 1 6.4 x 10⁵ 4.5 20 0.02 43
1
1
26
30
0.6
24.8
0
2776
0
4.3
-
416
-
103,72
1 78 16.0 3727 5.8 208 47,21
1 82 14.6 3158 4.9 184 67
1 W43 I 11.6 169 2.6 112 43
1 G55 10.5 4488 7.0 527 79
47 1 1.3 x 10⁶ 17.8 1450 1.1 161 64
47 26 4.3 632 0.49 59 37
47 30 12.2 2960 2,3 152 83,51
47 78 27.9 6981 5.4 318,202 67,49
47 82 17.4 4543 3.5 211 53,84
47 W43 15.9 2440 1.7 336 74
47 G55 14.2 758 0.58 63 34
G55 1 1.7 x 10⁶ 1.4 31 0.02 35 -
G55 26 0.4 18 0.01 42
2 1 13.6 x 10⁶ 35.0 33 0.002 38 -
2 26 108.0 362 0.03 86 -
2 W43 I 70.0 195 0.01 78 -
2 82 123.0 633 0.05 118,67 55,49
aNumbers are larger than "small spat" numbers due to difficulties of correctly counting newly-set spat.
bEach number represents one cultch string.

10
Each sample was drawn from one string of cultch. In some cases a
single mating had resulted in enough offspring to warrant several
strings of cultch. Three other matings had fewer than 30 surviving
spat and therefore were not used.
Data for larval survival in each mating are summarized in
Table 1.
Preparation of Samples for Electrophoresis
Subsequent to harvesting gametes, each adult oyster was pre-
prepared as follows. After the shell was opened, the adductor muscle
was removed and about one gram of tissue placed in a 100 x 15 mm
heavy-walled test tube on ice. Two milliliters of cold 2% phenoxy-
ethanol in twice-distilled water were added and the tissue was
homogenized for about 30 seconds with an electric tissue macerator.
The sample was then clarified by centrifugation at low speeds for
about three minutes. The supernatant was decanted into 75 x 10 mm
test tubes. A sample of approximately 0.1 ml was drawn into each of
10 capillary tubes. The small test tubes with capillary tubes intact
were then frozen at -20°C so that the capillary tubes could be removed
individually without having to repeatedly thaw the entire sample and
risk loss of enzyme activity.
Tissue extracts from the progeny were prepared in the same
manner after first freezing the entire animal to facilitate removal of
the adductor muscle.

11
Starch-gel electrophoresis was accomplished by the method of
Kristjannsson (1963). The gel consisted of a 12% solution of electro-
starch (Otto Hiller lot 303) in a modified Schiff (1972) gel buffer. The
procedure was as follows: distilled water (320 ml) was added to
80 ml of the concentrated (5x strength) buffer to produce 400 ml of
gel buffer. Starch (51 g) was then dissolved in 100 ml of the buffer,
while the remainder of the buffer was heated to the boiling point.
Next, 275 ml of the hot buffer was added to the dissolved starch
solution to produce a 12% weight/volume solution. This was shaken
in a flask over a flame until the desired opacity was observed. The
solution was then degassed using an aspirator, and poured into a
vertical mold. The gel mold consisted of two pieces of plate glass
separated by strips of 9 mm thick plexiglas clamped together to form
a rectangle of dimensions 140 x 225 x 9 mm. After the gel cooled to
room temperature the mold was removed from the vertical position
and the upper glass plate and all plexiglas strips were removed. A
slice was then cut in the gel parallel to one of its 225 mm edges and
about 40 mm from it.
The gel was then placed in a refrigerator at 12°C resting upon
two trays containing a Ridgway (1970) electrode buffer which was con-
ducted to the gel ends by wicks made from folded Handiwipes.
Seventy-five milliamps of current, supplied by a DC power source
(Heathkit Model Sp17-A) was conducted through the gel at 200 volts

12
for 10 minutes. The gel was then removed and filter paper strips
2 mm wide soaked in the oyster extract were inserted along the slice,
up to 35 per gel. One additional strip contained a marker dye,
bromophenol blue.
Current was again applied to the gel, for 15 minutes, at which
time the filter paper strips were removed and the surface of the gel
covered with plastic wrap to prevent dehydration. Voltage was again
applied across the gel. Electrophoresis was terminated after
approximately four hours, or when the dye marker had reached the
anodal wick. The gel was sliced horizontally into three 3-mm thick
replicate layers which were immediately stained for enzyme activities.
The histochemical staining methods for localizing the enzyme
activities, and the formulae for the gel and electrode buffers are sum-
marized in Table 2.
Enzyme Systems
The essential problem in determining which enzyme systems to
study was to find ones which could be consistently resolved, easily
readable and interpretable. While other investigations involving
electrophoresis of oyster tissues were in process (Schaal and
Anderson, 1974; Buroker, 1975), their procedures were not always
successful in resolving all systems, whether due to the use of a
different species of oyster (in the former case), or simply due to

Table 2. Formulae for buffers and stains.
Gel buffer system (5x concentration, pH 8.0) Tray buffer system (5x, pH 8. 1)TRIS 9.57 g Lithium hydroxide 12.6 gCitric acid 4.80 Boric acid 92.7Lithium hydroxide 2.30 1 liter
Boric acid 13.05
liter
Enzyme system Abbreviation Reference ModificationAspartate aminotransferase AAT Johnson et al. (1972) none
Leucine aminopeptidase LAP Wall (1968) Fast garnet GBC salt substituted for Black K salt
Muscle protein(general protein)
GP Weber and Osburn (1969) none
Phosphohexose isomerase PHI Shaw and Prasad (1970) Buffer is pH 8.0, not pH 7.1. Omit MgCl2
Sorbitol dehydrogenase SDH Shaw and Prasad (1970) Use 0.5 M Tris-HC1, pH 7.1, not 0.05 M Tris-HC1pH 8.0

13
variation in technique, source of chemicals, and degree of skill of the
technician. As Buroker's study had shown some enzyme systems to
be polymorphic in Crassostrea gigas, these were investigated until
four systems were consistently resolvable in the adult oyster. These
were Aspartate aminotransferase (AAT), Leucine aminopeptidase
(LAP), Sorbitol dehydrogenase (SDH), and General protein (GP).
Later Phosphohexose isomerase (PHI) was worked out for the year-
old oysters; however, SDH activity could not be resolved for these
small oysters.
The five systems investigated include one structural protein
and four enzymes which play very different roles in the metabolism
of the oyster and could therefore be subject to different sorts of
selective forces.
The structural protein of the adductor muscle is apparently
composed of many polypeptides, judging from the number of observed
electrophoretic bands. These are probably produced by several Loci,
only one of which (that producing the most anodally migrating protein
bands) showed any polymorphism. The two-banded heterozygote form
suggested a monomeric polypeptide under control of two codominant
alleles at the locus.
Leucine aminopeptidase is in the class of enzymes known as
proteases, and is a rather non-specific exopeptidase which hydrolyzes
most NH2- terminal amino acids of peptides. It is found in most

14
tissues of the oyster (Buroker, 1975, p. 7) but a more exact role is
not known. Of at least two polymorphic loci, the most consistently
resolved locus appears to have several alleles, of which only two
were observed in this study. The double-banded heterozygote
pattern is typical of an enzyme which is a monomer.
Aspartate aminotransferase belongs to the category of enzymes
which catalyze reactions exchanging keto and amino functions. In
the mitochondrial matrix is found a specific aspartate-glutamic
transaminase, while a more general cytosol AAT is involved in the
urea cycle, reversibly catalyzing glutamic acid and oxaloacetic acid
to a-ketoglutaric acid and aspartic acid. The extraction process
makes it unlikely that any mitochondrial AAT was observed in this
experiment.
In a study of variation of enzyme activities in the American
oyster, C. virginica, Chambers et al. (1975) found a significantly
lower mean specific activity for supernatant AAT during the oyster's
two seasonal reproductive peaks. An earlier study (Hammen, 1968)
suggested that AAT activity in bivalves regulated amino acid balance
and thus osmotic balance. The high AAT level found in Crassostrea
suggests an atypical metabolism in which reactions involving oxalo-
acetate are more important than those involving pyruvate.
The functional AAT molecule is a dimer. Only two alleles
were observed at the locus examined in this study.

15
Sorbitol dehydrogenase reduces D-glucose (in the presence of
H2 and metal) to sorbitol, a sugar alcohol. More exact function in
the oyster is not known, nor is it known why it could not be resolved
in the young oysters. Its subunit composition appears to be tetra-
meric, although all five bands of the heterozygote were not always
clear. Two alleles at one locus were observed.
Phosphohexose isomerase is an important enzyme of the
glycolytic pathway. It catalyzes the conversion of fructose-6-
phosphate to glucose-6- phosphate, which in turn may be involved in
several different pathways. It is found in most tissues of the oyster
(Buroker, 1975) and is a dimer. Although up to five alleles have been
observed at the one locus, only two were observed in this study.
Although the staining procedure for this system was not worked out
at the time of preparation of the parental oysters, judging from the
genotypes of the offspring, none of the adults were heterozygous.
Statistical Tests
Chi-square was used as a test statistic to compare the genotype
numbers observed in a sample of the progeny to the numbers expected
to result from the parental genotypes, assuming Mendelian segrega-
tion (Snedecor and Cochran, 1967).
Examination of the bimonthly sample data involved searching
for any significant changes in genotype frequencies throughout the

16
year. The data were examined using a Chi-square test for homo-
geneity in a 3 x 6 array with three rows (three possible genotypes)
and six columns (the six seasonal samples). SDH was not included
in the array because of small numbers of two of the genotypes.
Observed and expected values were compared using the Chi-square
test (Snedecor and Cochran, 1967, p. 250).

17
RESULTS AND DISCUSSION
Assortment of Genetic Information
The assortment of alleles for three allozyme systems is sum-
marized in Tables 3 through 6. PHI is not included in these tables
since only one genotype was present in the progeny of any one mating.
Inspection of these tables reveals that of the four enzyme systems
examined in 41 samples of sibling groups, only one (a sample for
General Protein from one group of spat) showed any significant devia-
tion from Mendelian expectation. When the significance level of
rejection of the hypothesis is 5%, such a deviation could occur by
chance once in 20 times. It may be concluded that these alleles
segregate independently prior to mating in C. gigas.
The assumption of Mendelian inheritance is implicit in theories
of breeding genetics; the fact that the Pacific oyster has such an
inheritance mechanism supports the use of statistical methods of
selective breeding. Given that genetic variability exists in the
population, such methods may be used to evaluate lines and individuals
for any of the quantitative traits considered important to the oyster
grower (Lannan, 1974).
Selection, acting either at one of these four loci or at some
nearby loci, might also cause a departure from the expected

18
Table 3. Summary of segregation of AAT alleles. Expected numbersof offspring genotypes in parentheses.ParentalTag genotypes genotypes
Offspringx2X
Probability ofa greater x2
valueno. Female Male SS SF FF
SF FF (0) (15) (15)
Y085 12 18 0.83 .4Y086 0 17 13 0.30 .6Y087 0 17 13 0.30 .6Y088 18 12 0.83 .4Y089 17 13 0.30 .6G49 16 14 0.03 .85G47 18 12 0.83 .4W82 17 13 0.30 .6Y084 16 14 0.03 .85G40 16 14 0.03 .85
SF SF (7.5) (15) (7.5)Y095 6 13 11 2.19 .4Y096 7 14 9 0.40 .8Y090 8 14 8 0.13 .9Y091 9 12 9 1.20 .5Y092 9 13 8 0.60 .75Y093 8 15 7 0.06 .95Y094 10 14 6 1.19 .55G82 7 14 9 0.40 .8G42 7 14 9 0.40 .8Y082 9 14 7 0.40 .8Y083 6 15 9 0.60 .75
SS FF (30)
Y080 30W98 30W99 30G99 30G96 30W84 30W83 30
(Continued on next page)

19
Table 3. (Continued)
Tagno.
Parentalgenotypes
Offspringgenotypes X2
Probability ofa greater
valueFemale Male SS SF FF
SS SF (15) (15)
W88 18 12 0.83 .4W87 17 13 0.30 .6W91 14 16 0.03 .85W93 12 18 0.83 .4W94 12 18 0.83 .4W92 13 17 0.30 .6W89 18 12 0.83 .4W95 13 17 0.30 .6W90 13 17 0.30 .6
SS SS (30)
W86 30W85 30
SF SS (15) (15)
Y098 13 17 0.30 .6Y097 12 18 0.83 .4

20
Table 4. Summary of segregation of LAP alleles. Expected offspringgenotypes in parentheses.
ParentalTag genotypesOffspringgenotypes X2
Probability ofa greater
valueno. Female Male SS SF FF
SS SF (30)
Y097 30Y098 30
SS SF (15) (15)
Y086 15 15 0.00Y087 11 19 1.63 .2Y088 18 12 0.83 .4Y089 15 15 0.00Y095 13 17 0.30 .6Y096 15 15 0.00G49 12 18 0.83 .4G47 13 17 0.30 .6G42 13 17 0.30 .6G82 15 15 0.00
SS SS (30)
Y090 30Y091 30Y092 30Y093 30Y094 30Y084 30Y085 30G40 30Y082 30Y083 30
FF SF (15) (15)
W84 13 17 0.30 .6FF SS (30)
W83 30W82 30
SF FF (15) (15)
W86 13 17 0.30 .6W85 16 14 0.03 .85
(Continued on next page)

21
Table 4. (Continued)
Tagno.
Parentalgenotypes
Offspringgenotypes X
2Probability of
a greatervalueFemale Male SS SF FF
SF SF (7.5) (15) (7.5)
Y080 10 12 8W98 9 13 8G96 8 12 10 1.46W88 8 11 11 2.73W87 7 14 9 0.40
SF SS (15) (15)
W99 12 18 0.83 .4G99 14 16 0.03 . 85W94 17 13 0.30 .6W93 12 18 0.83 .4W92 14 16 0.03 .85W91 18 12 0.82 .4W95 13 17 0.30 .6W90 14 16 0.30 . 6W89 17 13 0.30 . 6

22
Table 5. Summary of segregation of GP alleles.genotypes in parentheses.
Expected offspring
ParentalTag genotypes
Offspringgenotypes X
2Probability of
a greater x2valueno. Female Male SS SF FF
FF FF (30)
W83 30W82 36
FF SS (30)
W84 30
SF FF (15) (15)
Y098 14 16 0.03 .85Y097 16 14 0.03 .85W99 16 14 0.03 .85G99 13 17 0.30 .60W86 11 19 1.63 .20W85 16 14 0.03 .85
SF SF (7.5) (15) (7.5)
Y092 5 16 9 1.20 .55Y091 4 13 13 5.93 .05*Y090 6 15 9 0.60 .75W93 8 12 10 1.46 .5W91 8 13 9 1.26 .55W94 6 14 10 1.19 .55W92 9 13 8 1.26 .55
SS FF (30)
Y084 30Y085 30G40 30
SS SS (30)
G42 30G49 30G82 30G47 30
SF SS (15) (15)
Y086 13 17 0.30 .60Y088 11 19 1.63 .20
(Continued on next page)

Table 5. (Continued)
23
Parental Offspring Probability ofTagno. genotypes genotypes X
2 2a greater xvalueFemale Male SS SF FF
SF SS (15) (15)
Y087 13 17 0.30 .60Y089 12 18 0.83 .40Y045 16 14 0.03 .85Y096 12 18 0.83 .40Y094 14 16 0.03 .85Y093 18 12 0.83 .40Y080 17 13 0.30 .60W98 16 14 0.03 .85W88 14 16 0.03 . 85W87 12 18 0.83 .40W89 10 20 2.70 .10W95 12 18 0.83 .40G96 19 11 1.63 .20W90 13 17 0.30 .6o

24Table 6. Summary of tests for departure from Mendelian inheritance patterns. X2 values for
individual strings of spat (subgroups of full-sib groups). Blank indicates all individuals ofsame genotype.
Spatstring
AAT LAP GP
X2 d.f. prob. X2 d.f. prob. X2 d.f. prob.Y087 0.30 1 .6 1.63 1 .2 0.30 1 .6
Y088 0.83 1 .4 0.83 1 .4 1.63 1 .2
Y089 0.30 1 .6 0.00 1 0.83 1 .4G47 0.83 1 .4 0.30 1 .6 -G49 0.03 1 .85 0.83 1 .4 _
W82 0.30 1 .6 - - - -Y084 0.03 1 .85 - - -G40 0.03 1 .85 - - - - - -Y095 2.19 2 .4 0.30 1 .6 0.03 1 .85Y096 0.40 2 .8 0.00 1 0.83 1 .4Y090 0.13 2 .95 - - - 0.60 2 .75Y091 1.20 2 .50 - 5.93 2 .05*Y092 0.60 2 .75 - - 1.20 2 .55
Y093 0.06 2 .95 - - - 0.83 1 .4Y094 1.19 2 .55 - - 0.03 1 .85G82 0.40 2 .8 0.00 1 - -G42 0.40 2 .8 0.30 1 .6 - - -Y082 0.40 2 .8 - - - -Y083 0.60 2 .75 - - -
Y086 0.30 1 .6 0.00 1 0.30 1 .6Y080 - - 1.46 2 .5 0.30 1 .6
W98 - - 0.55 2 .75 0.03 1 .85W99 0.83 1 .4 0.03 1 .85
G99 - - - 0.02 1 .85 0.30 1 .6
C96 - - 1.46 2 .4 1.63 1 .2W84 - - - 0.30 1 .6 - -W83 - - - - - - -Y085 0.83 1 .4 - - - - - -
(Continued on next page)

Table 6. (Continued)
Spatstring
MAT LAP GP
x2 d f prob. X2d . f . prob . X2 d.f, prob.
W88 0.83 1 .4 2.73 2 .25 0.03 1 .85
VV87 0.30 1 .6 0.40 2 .85 0.83 1 .4
W91 0.05 1 .85 0.83 1 .4 1.26 2 .55
W93 0.83 1 .4 0.03 1 .85 1.46 2 .5
W94 0.83 1 .4 0.30 1 .6 1.19 2 ,55
W92 0.30 1 .6 0.03 1 .85 1.26 2 .55
W89 0.83 1 .4 0.30 1 .6 2.70 1 .10
W95 0.30 1 .6 0.30 1 .6 0.83 1 .4
W90 0.30 1 .6 0.03 1 .85 0.83 1 .4
W86 - 0.30 1 .6 1.63 1 ,2
W85 - - 0.03 1 .85 0.03 1 .85
Y098 0.30 1 .6 - 0.03 1 .85
Y097 0.83 1 .4 - - - 0.03 1 .85
25

26
genotype-number distributions in the larvae even though the alleles
had independently segregated prior to mating. For instance, in the
case of a cross between heterozygous parents, if there were a selec-
tive advantage attendant on being heterozygous as opposed to being
homozygous for either allele at a specific locus, an excess (signifi-
cantly more than half) of the surviving offspring would be heterozy-
gous. In this experiment, however, none of the matings resulted in
genotype frequency distributions significantly different from those
expected under Mendelian assortment. It must be noted, however,
that the sample size of 30 could detect a selection magnitude no smaller
than 33% against one allele at a locus. To be even 90% sure of a
selection magnitude as low as 1% would require a sample size of
400, 000 (Lewontin, 1974, p. 242), well beyond the scope of this or
most experiments. A sample size of 120 would detect selection
rates of at least 20% against one allele; such a sample was taken from
a group of spat which in its sample of 30 had a comparatively high
(although not significantly so) Chi-square value (Table 7). Again no
departure from expected values was observed.
In a further attempt to observe small selection values all
samples from all strings of spat from a single mating were pooled,
resulting in sample sizes of 90 to 120 oysters. First, it was neces-
sary to demonstrate that no significant difference existed between
mating members kept in separate bays. A Chi-square test to

27
Table 7. Large-sample test for departure from Mendelian inheritancepattern. x values for three enzyme systems of 120 oysters(from one string of cultch). Mating W92.
Genotype Observed Expected
AAT
LAP
GP
FF 31 30SF 62 60SS 27 30
X2= .62Degrees of freedom = 2P = .5
SS 57 60SF 63 60
x2 = .21Degrees of freedom = 1p =.5
FF 36 30SF 64 60SS 27 30
X2 = 1.77Degrees of freedom = 2p = .25

28
compare siblings from mating G47 x 78 showed no significant bay
effect on the distributions of genotype frequencies (Table 8). Pooled
Chi-square values for three loci (AAT, GP and LAP) were similar
to those for the smaller samples (Table 9). No selection was
detected.
The differences among the six bimonthly samples were not
statistically significant (Table 10). The four enzyme systems (AAT,
LAP, GP, and SDH) were not affected in their electrophoretic
expression by seasonal environmental change. Such an assurance is
necessary when characterizing genotypes by electrophoresis at
different seasons of the year for parents and offspring. Since short-
term acclimation may be accomplished by the individual producing
different isozymes (Hazen and Prosser, 1974), it is possible that
enzyme activities and electrophoretic patterns would be altered
during the acclimation process. Observing individuals in different
physiological states (at different seasons) could lead to erroneous
results if the electrophoretic expression of the enzyme were not
conserved during the year.
An interesting observation concerning the 120 oysters examined
over the year's time was the small amount of variability at the
polymorphic loci. Buroker's (1975) examination of naturally breed-
ing populations in Puget Sound revealed five alleles at the LAP locus,
three at the AAT, three at SDH, and five at PHI. In the Netarts Bay

29
Table 8. Test for bay effect on inheritance patterns.pooled for mating G47 x 78.
Numbers are
Enzyme GenotypeX2 df Prob.SS SF FF
AAT 26 34 Yaquina25 35 Netarts25.5 34.5 Expected
.03 1 .75
GP 16 25 19 Yaquina15 27 18 Netarts15.5 26 18.5 Expected
.14 3 .95
LAP 30 30 Yaquina31 29 Netarts30.5 29.5 Expected
.02 1 .90

Table 9. Tests for departures from Mendelian inheritance patterns; X2 values for pooled sibling-group data.
Protein Mating Tag no, No in No. per genotype X2 Probabilityfamily (df=2) (greater X2)
SS sf ff
General protein G47 x 78 W93, 91 120 30 60 30 Expected1.73 0.4(sf x sf) W94, W92 31 52 37 Observed
1 x 30 Y088 90 45 45 Expected3.22 0.2(sf x ss) Y087 36 54 Observed
Y089
Leucine amino peptidase G47 x 1 Y080 90 22.5 45 22.5 Expected2,31 0.3(sf x sf) W98 27 41 24 Observed
W97
G47 x 78 W94, W93 120 60 60 Expected0.08 0.8(sf x ss) W92, W91 59 61 Observed
1 x 30 Y087 90 45 45 Expected0.01 0.95(ss x sf) Y088 46 44 Observed
Y089
Aspartate amino transferase 1 x 30 Y087 90 45 45 Expected0.90 0.4(sf x ff) Y088 40 50 Observed
Y089

Table 10. Bimonthly samples: Genotype distributions in 30-oyster samples.
MonthAAT LAP SDH GP
Fast Slow Heter Fast Slow Heter. Fast Slow Heter. Fast Slow Heter.
Jan. 5 10 15 8 5 17 1 28 1 4 12 16
Mar. 7 15 8 7 5 18 0 27 3 2 16 12
May 7 8 15 7 4 19 2 26 2 4 11 15
July 8 12 10 7 6 17 2 25 3 5 13 12
Sept. 10 11 9 8 7 15 0 29 1 3 15 12
Nov. 9 12 9 7 9 14 1 28 1 5 13 12
X2a 8.87 3.75 c 3.90
Pb P .5 .95 .95
a
b
Chi-square values are for tests of independence in 3 x 6 contingency tables; one for each enzyme system.
P values are tabulated probabilities of the chance occurrence of greater X2 values than these. None are significantly low.2cNo
X is computed for the SDH system due to the infrequency of the fast allele .

32
group only two alleles were found at each locus. As this was a non-
breeding group, some variability may have been lost randomly; it
appears to be the most uncommon alleles that are missing. It seems
more likely, however, that this lack of variability derives from the
small number of parents used to create this group of oysters.
Linkage Study
As no categories of expected genotypes were missing in the
five matings investigated, it was assumed that no tight linkage
existed among AAT, LAP, GP, or PHI. Finding lesser degrees of
linkage would involve proceeding in the manner illustrated in Table 11.
Each mating must be examined and each individual scored as to geno-
type at all four loci. In Table 12 only three loci, AAT, LAP, and
GP, were scored since all full-siblings shared the same PHI geno-
type (due to the coincidence that none of the parental oysters were
heterozygous at the PHI locus).
The problem of sex linkage is an especially interesting one in
the oyster, a protandrous hermaphrodite. No sex chromosomes have
been identified to date (Longwell, 1973, p. 154). As the year-old
oysters are expected to express the male sex, if any of the loci
studied were located on a sex chromosome, only the genotype of the
male parent might be observed. In no case did this occur; it can be
concluded either that there is no sex chromosome, or that none of the

33
Table 11. Linkage study.aGenotype no.
(supra)No. expected
(no linkage)No.
observed
2
203
12
3.753.753.753.75
Mating Y091
x2 = 14.75
5
635
11 1.875 3 8 degrees of freedom19 3.75 2 .1 < p < .05
1 1.875 1
21 7.5 410 1.875 1
Mating W893 3.75 71 27 2 x2= 10.96
21 7 7 degrees of freedom9 4 .25 < p < .1
25 52719 1
Mating W931 1.875 32 1.875 23 3.750 1
7 1.875 2 x2 -_ 8.938 3.750 2 11 degrees of freedom9 1.875 4 .70 < p < .50
19 1.875 1
20 1.875 221 3.750 425 1.875 226 1.875 327 3.750 4
(Continued on next page)

34Table 11. (Continued)
Genotype no.(supra)
No. expected(no linkage)
No.observed
1016192125271812
Mating Y086
X2= 4.157 degrees of freedom.7 < p < .75
3.75
II
II
II
II
II
II
22
43
5
5
3
6
Mating Y0801 1.875 1
2 1.875 5
3 3.750 310 1.875 1 x2= 11.0711 1.875 3 8 degrees of freedom12 3.750 5 .25 < p < .1019 3.750 220 3.750 621 7.500 4
aPossible genotypes: A denotes AAT; L,s, slow allele; h, heterozygote.
LAP; G, GP; f, fast allele;
1 As Ls Gs 10 AfLsGs 19 AhLsGs2 AsLsGf 11 AfLsGf 20 AhLsGf3 AsLsGh 12 AfLsGh 21 AhLsGh4 AsLfGs 13 AfLfGs 22 AhLfGs5 AsLfGf 14 AfLfGf 23 AhLfGf6 AsLfGh 15 AfLfGh 24 AhLfGh7 AsLhGs 16 AfLhGs 25 AhLhGs8 AsLhGf 17 AfLhGf 26 AhLhGf9 AsLhGh 18 AfLhGh 27 AhLhGh

four protein systems are controlled by a gene located on such a
chromosome.
Implications for Genetic Theory
35
A major debate in the field of genetics today centers around the
importance of the amount of variability found in natural populations.One school of thought, referred to as the "balance" school, holds
that each of the alleles at a locus has different selective value, the
diversity of alleles being maintained by balancing selection, which
often involves heterozygote superiority. The "neoclassical" or
neutralist school suggests that the bulk of alleles are selectivelyneutral and are held in the population through the interaction of
random drift and mutation. This experiment provided no strong
support for either of these arguments.
Superficially, the lack of observable selection at any of the
loci investigated would appear to support the arguments of the neo-
classical school, which would suggest that such allelic variation hasno effect on fitness. An unequivocal demonstration that some
component of fitness is affected by the segregation of allozyme
variants, specifically the selection for one or another allele at apolymorphic locus, would "contradict the fundamental premise of any
neutralist theory" (Lewontin, 1974, p. 250). The lack of such a
demonstration, however, does not automatically support the neo-
classicists. Supporters of the balance school would point out that

36
experiments to measure single locus selection should be carried out
using many independently derived electrophoretic alleles from nature,
in order to minimize effects of linkage disequilibria. The parental
oysters used in the present experiment were at least second genera-
tion hatchery products, in some cases close relatives.
Proponents of the "balance" school would no doubt include the
loci investigated here with those containing "functional variants."
Such loci are characterized by having all the alleles competent, and
the selection coefficient associated with each isoallele very small.
Furthermore, as each biochemical pathway is catalyzed by products
of several polymorphic loci, at each of which the contribution may not
be additive, the (statistical) fitness would depend on the number of
heterozygous loci in the pathway. However, as no significant excess
of heterozygotes was found in any of the matings, no support is given
to overdominance or heterosis as being driving forces in the main-
tenance of polymorphisms.
Based on the essential precepts of the "balance" school, that
each of the many alleles at any locus produces gene products with
different selective values, and that heterosis is closely correlated
to fitness, Williams' (1975) "elm-oyster" model makes some predic-
tions which have been to some extent tested by surveys of oyster
populations in the wild (Buroker, 1975), by selection experiments
(Lannan, 1974), and in the present investigation.

37
Williams begins with the same intuitive assumption that led to
the search for selection in the oyster hatchery system: that the
large amount of mortality occurring between zygote and adult stages
of high-fecundity species such as the oyster may be nonrandom and
involve the culling of less-viable genotypes. His hypothesis is that
the intensity of selection in a population has a positive relation to its
fecundity. Thus, out of the many genotypes of the zygotes produced
from the spawning of adult oysters, only a few are the "fittest" (in
Williams' terminology, "sisyphean") for a particular environment at
a particular time. Although Williams allows some random mortality,
he suggests that fairly strong selective forces work to eliminate less
fit genotypes.
His first prediction, that considerable genetically controlled
variation in adaptive performance will be observed, is strongly sup-
ported by even a superficial examination of oyster populations. The
great variation in size and weight between individuals of one age-
class group and even among siblings, is apparent from a glance at a
string of spat. That this type of rnorphometric variation is to an
extent genetically controlled has been established by analyzing the
offspring of diallel crosses (Lannan, 1974). Traits with closer
relationships to fitness such as fecundity also showed such genetic
variability.
The second prediction, that different genotypes have very differ-
ent likelihoods of surviving given episodes of stress or of exploiting

38
opportunities, has been supported here to the extent that the per-
formance of certain mating pairs (in terms of proportionate offspring
survival and growth) is better than others. The underlying reasons
for this remain obscure, or may not be strictly genetic; no simple
mechanism seems likely. As remarked before, my own data do not
support the prediction of strong selection at least at a one-locus
level. In view of Williams' prediction of very large amounts of
selection, the argument that a small sample size is unable to detect
the selection loses some of its force.
A related prediction is that the progeny of a pair of oysters
raised in different environments should show markedly different gene
and genotype frequencies at some loci after the high-mortality stages
are passed. An experiment to test this should be fairly easy to per-
form. In my experiment, sibling groups were separated and raised
for eight months in two different bays; the separation was subsequent
to the high mortality stages, however, and although some mortality
did occur after separation it was less than 5% of the total. This may
explain why comparisons of the sibling groups show no significant
differences between bays (see Table 11).
Williams' model also makes predictions about wild populations.
These include marked shifts in gene frequencies between local areas,
even those with great gene flow; close tracking of the environment by
genetic change, resulting in marked departures from Hardy-Weinberg

39
equilibrium for some loci; and different gene and genotype frequencies
in different year classes. While it is true that no native populations
of C. gigas exist on the American seaboard, there are several areas
in Washington in which natural spawning may occur yearly and has
occurred in some cases for several generations. In a study of oyster
populations in the Puget Sound area, Buroker (1975) has surveyed six
genetic loci including those investigated in my study.
At five of six areas in Puget Sound, no departure from Hardy-
Weinberg equilibrium was demonstrated for any of the six loci. One
locus, LAP, of a high adult-mortality area, did show deviation. No
geographical cline was present for any of the six loci. No significant
differences were found between two year-classes at one location.
There was a significant difference at three loci (LAP, GP and
GPI) between a first generation hatchery population and the other
"wild" populations, which could be explained by a founder effect;
i.e., since hatchery individuals are descended from a few recent
ancestors, their gene frequencies do not reflect those of the total
population.
Two populations on opposite sides of Hood Canal in Puget Sound
did not have different allele frequencies at the PGI and PGM loci.
However, this resulted from a deficiency of heterozygotes, often an
artifact of two populations mixing in one area.

40
In summary, evidence from selection and electrophoretic
studies does not generally support Williams' hypothesis. The reason
for this may not lie in any basic error of his theory or of the
"balance" school's theories, but in the obscurity surrounding what
actually is the unit of selection. If there are few individual loci at
which selection acts in a dramatic fashion, and each locus must be
considered in the context of the entire genome, particularly including
those other loci with which it is linked or acts epistatically, perhaps
the search for single-locus selection is doomed from the start. This
would be particularly true if the forces of selection themselves
varied, for example seasonally, or with the degree of inter- and
intra-population competition.
Implications for the Oyster Hatchery
The fact that electrophoretic variants are inherited in a straight-
forward Mendelian fashion suggests that it would be easy to select
for other qualitative characters. Although these have not been
identified in the oyster, other molluscs have characters such as shell
coloration which may be of economic importance (Chan ley, 1961).
Once Mendelian inheritance has been demonstrated, lines having the
desired characteristics may be established by proper selection of
parents.

41
This series of experiments does not suggest that the process of
determining oyster genotypes through electrophoresis is a particularly
useful one for the oyster breeder. It may initially give some idea of
the amount of variability present in the local or laboratory population;
discovered loss of rare alleles or increased homozygosity may be an
indication of a population that has been through a bottleneck or become
inbred. The extent that the loss of variability at any individual locus
is a dangerous one in terms of population fitness is difficult to assess.
As long as wild populations exist from which individuals may be
recruited it is probably not of immediate concern.
Although a "mating compatibility" effect has been demonstrated
in oysters (Longwell and Stiles, 1970), in the sense that certain
combinations of parents produce offspring whose performance is
better than those resulting from other parents, it seems unlikely that
the genotypes of such parents will be characterized at the enzyme
level. In other words, it is doubtful that an enzyme marker linked to
improved larval survival in the hatchery system will be found.
The primary reason for this is that there may be many geno-
types of "fitter" offspring resulting from combinations of alleles at
many separate loci. Different alleles at certain loci might affect
certain parameters of fitness at varying stages of the life cycle, but
be undistinguishable at least during the first year of life (since
samples cannot be taken until the oyster is about one year old).

42
Additionally, if one assumes that selection against an allele at a
single locus is on the order of 1%, sample sizes to detect this level
are beyond the scope of any electrophoretic investigation.
The possibility that these single-locus enzymes are, in the
context of the hatchery system, selectively neutral, implies that they
could be used as markers if genetically superior lines could be
established. However, a careful tagging and record-keeping system
would accomplish the same purpose.
Additional parameters of interest to the oyster breeder include
growth rate, body weight, shell shape, and disease resistance.
There is a possibility that certain loci may be associated with gene
complexes found to influence these traits. Discovery of such an
allele would require the observation of a tremendous number of loci.
In conclusion, it is not likely that the examination of single
loci will give much insight into the mechanisms maintaining the
variability in oyster populations or the well-being of oyster stocks.
Fortunately, such variability may be exploited, in terms of the
economically important quantitative traits, without such specific
knowledge.

43
BIBLIOGRAPHY
Ahmed, M. and A. K. Sparks. 1967. A preliminary study ofchromosomes of two species of oysters (Ostrea lurida andCrassostrea gigas). Journal of the Fisheries Research Boardof Canada 24:2155-2159.
Breese, W. P. and R. E. Malouf. 1975. Hatchery manual for thePacific oyster. Oregon State University Sea Grant CollegeProgram Publication no. ORESU-H-72-002. Corvallis,Oregon.
Buroker, N. 1975. A survey of protein variation in populations ofthe Pacific oyster Crassostrea gigas. Master's Thesis.Seattle, University of Washington. 92 numb. leaves.
Chan ley, P. E. 1961. Inheritance of shell markings and growth inthe hard clam, Venus mercenaria. Proceedings of the NationalShellfisheries Association 50:163-169.
Chambers, J. E., F. M. McCorkle, J. W. Carroll, J. R. Heitz,L. Lewis and J. D. Yarbrough. 1975. Variation in enzymeactivities of the American oyster (Crassostrea virginica)relative to size and season. Comparative Biochemistry andPhysiology 51 B:145-150.
Crow, J. F. and M. Kimura. 1970. An introduction to populationgenetics theory. New York, Harper and Row. 591 p.
Fasten, N. 1931. The Yaquina oyster beds of Oregon. AmericanNaturalist 65:434-468.
Hammen, C. S. 1968. Aminotransferase activities and amino acidexcretion of bivalve mollusks and brachiopods. ComparativeBiochemistry and Physiology 26:697-705.
Hazen, J. R. and C. L. Prosser. 1974. Molecular mechanisms oftemperature compensation in poikilotherms. PhysiologicalReview 51:624-677.
Imai, T. and S. Saki. 1961. Study of breeding of Japanese oysters.Tohuku Journal of Agricultural Research 12:125-163.

44
Johnson, A. G., F. M. Utter and K. Niggal. 1972. Electrophoreticvariants of aspartate aminotransferase and adductor muscleproteins in the native oyster (Ostrea lurida). Animal BloodGroups and Biochemical Genetics 3:109-113.
Kristjannsson, F. D. 1963. Genetic control of two pre-albumins inpigs. Genetics 48:1059-1063.
Lannan, J. E. 1971. Experimental self-fertilization of the Pacificoyster, Crassostrea gigas, utilizing cryopreserved sperm.Genetics 48:599-601.
. 1972. Estimating heritability and predictingresponse to selection for the Pacific oyster, Crassostrea gigas.Proceedings of the National Shellfisheries Association 62:62-66.
. 1973. Genetics of the Pacific oyster: biologicaland economic implications. Ph. D. Thesis. Corvallis, OregonState University. 103 numb. leaves.
Lehninger, A. L. 1965. Bioenergetics. W.A. Benjamin Inc.,New York.
Lewontin, R. C. 1974. The genetic basis of evolutionary change.Columbia University Press, New York.
Longwell, A. C., S. S. Stiles and D. E. Smith. 1967. Chromosomecomplement of the American oyster, Crassostrea virginica, asseen in meiotic and cleaving eggs. Canadian Journal of Geneticsand Cytology 9:845-856.
Longwell, A. C. and S. S. Stiles. 1970. The genetic system andbreeding of the commercial American oyster. Endeavor29:94 -99.
. 1973. Oyster genetics and the probable futurerole of genetics in aquaculture. Malacological Review 6: 151-171.
Loosanoff, V. L. and H. C. Davis. 1963. The rearing of bivalvemollusks. Advances in Marine Biology 1:2-136.
Menzel, R. W. 1967. Hybridization in species of Crassostrea.Proceedings of the National Shellfisheries Association 58:6.

45
Menzel, R. W. 1974. Portuguese and Japanese oysters are thesame species. Journal of the Fisheries Research Board ofCanada 31(4):543 -546.
Ridgway, G. J., S. W. Sherburne and R. D. Lewis. 1970. Poly-morphisms in the esterases of Atlantic herring. Transactionsof the American Fisheries Society 99: 147-151.
Schaal, B. and W. Anderson. 1974. Technical report--series no.74--Georgia Marine Center. University of Georgia, SkidawayIsland, Georgia.
Schiff, R., R. Vasudeva and C. Stormont. 1968. A method for theelectrophoretic separation of rabbit blood cell esterases.Immunogenic Letters 5:130-131.
Shaw, C. R. and R. Prasad. 1970. Starch gel electrophoresis ofenzymes--a compilation of recipes. Biochemical Genetics2:109-118.
Snedecor, G. W. and W. G. Cochran. 1967. Statistical methods.Iowa State University Press, Ames, Iowa.
Sprague, V. 1971. Diseases of oysters. Annual Review ofMicrobiology 25:211-230.
Wall, J. R. 1968. Leucine aminopeptidase polymorphism inPhaseolus and differential elimination of the donor parentgenotype in interspecific backcrosses. Biochemical Genetics2:109 118.
Weber, K. and M. Osborn. 1969. The reliability of molecular weightdeterminations by dodecyl sulfate-polyacrylamide gel electro-phoresis. Journal of Biological Chemistry 244:4406-4412.
Williams, G. C. 1975. Sex and evolution. Monographs in PopulationBiology 8. Princeton University Press, Princeton, New Jersey.
Woe lke, C. E. 1972. Development of a receiving water-qualitybioassay criterion based on the 48-hour Pacific oyster (Cras-sostrea gigas) embryo. Washington Department of FisheriesTechnical Report no. 9. State of Washington Department of FishManagement and Research Division, Seattle, Washington.
46
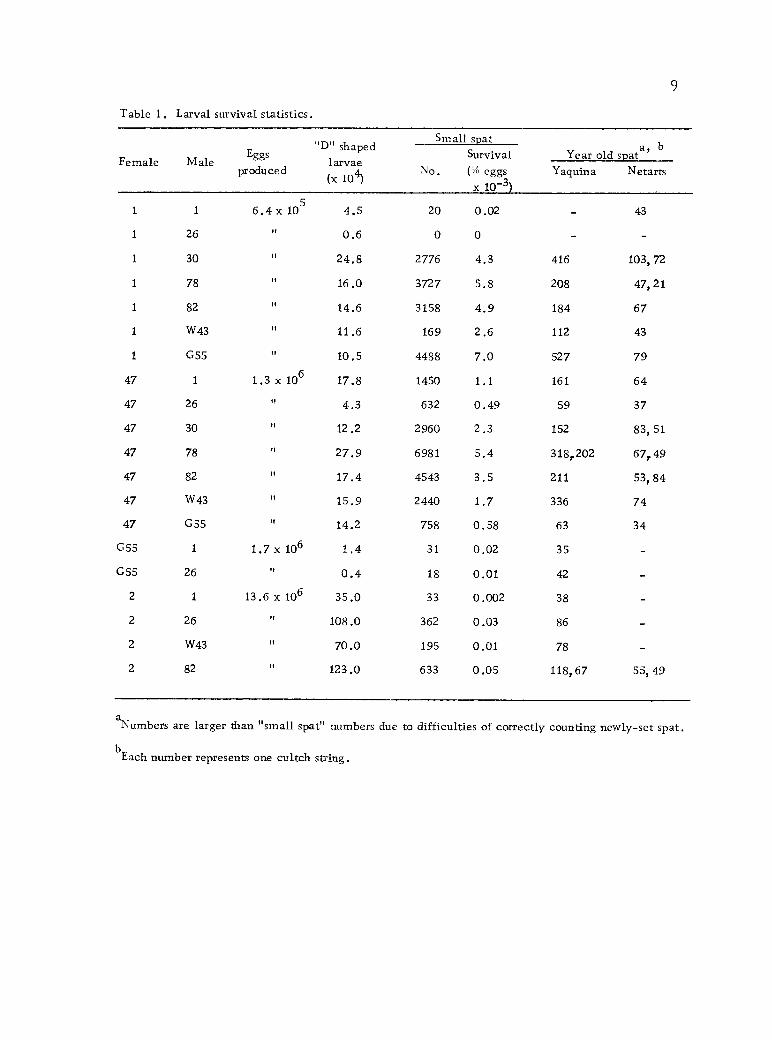
APPENDIX A
Tagnumber
SPAT STRINGS; PARENTS
Femaleparent
AND LOCATIONS
Male21.rent Location
Y087, Y089 1 30 N
Y088 1 30 Y
Y086 1 1 Y
Y096 1 W43 N
Y095 1 W43 Y
Y098 1 G55 Y
Y097 1 G55 N
Y091 1 78 Y
Y090 1 78 N
Y093, Y092 1 82 N
Y094 1 82 Y
Y080 G47 1 Y
W98 G47 1 N
W99 G47 26 Y
G99 G47 26 N
G96 G47 30 N
W88 G47 W43 Y
W87 G47 W43 N
W86 G47 G55 Y
W85 G47 G55 N
W93, W91 G47 78 Y
W94, W92 G47 78 N
W89 G47 82 Y
W95, W90 G47 82 N

47
Appendix A. (Continued)
Tag Female Male Locationnumber parent karent
W84 G55 1 Y
W83 G55 26 Y
W82 G55 26 N
G49 2 1 Y
G47 2 1 N
Y085 2 26 Y
Y084, G40 2 26 N
G42 2 W43 Y
G82 2 W43 N
Y082 2 82 Y
Y083 2 82 N

48
APPENDIX B
PARENTAL GENOTYPES
Parent AAT LAP GP GPIa
Female
1 SF SS SF SS
G47 SS SF SF SS
G55 SS FF FF SS
2 SF SS SS FF
Male
1 FF SF SS SS
26 FF SS FF FF
30 FF SF SS FF
W43 SF SF SS SS
G55 SS FF FF SS
78 SF SS SF SS
82 SF SS SS SS
a GPI genotypes were not originally determined but are suggested bythose found in the resulting matings.

anode
cathode
anode
cathode
anode
cathode
APPENDIX C 49
DIAGRAMS OF ELECTROPHORETIC PATTERNS
Homo. Homo. Hetero.slow fast
Homo. Homo. Hetero.slow fast
WINENINO
Homo. Homo. Hetero.slow fast
anode
cathode I11M11
anode
Homo. Homo. Hetero.slow fast
cathode
General protein
As partate
aminostransferase
Leucine
aminopeptidase
Phosphohexoseisomerase
Sorbitol
WINN dehydrogenase
Homo. Homo. Hetero.slow fast