Embed Size (px)
Citation preview

Computational Biology and Chemistry 32 (2008) 298–301
Contents lists available at ScienceDirect
Computational Biology and Chemistry
journa l homepage: www.e lsev ier .com/ locate /compbio lchem
Short Communication
A method for discovering transmembrane beta-barrel proteins
(TMBt neigakesdictiides fnsitivnform
in Gram-negative bacterial proteomes�
Jing Hu, Changhui Yan ∗
Department of Computer Science, Utah State University, Logan, UT 84322, USA
a r t i c l e i n f o
Article history:Received 29 November 2007Received in revised form 18 March 2008Accepted 19 March 2008
Keywords:Beta-barrelPredictionk-Nearest neighborWeighted Euclidian distance
a b s t r a c t
Transmembrane �-barrelpaper presents a k-nearesstart with a method that mgradually improve the preset of residues and di-peptwith 0.876 MCC, 86.4% seavailable at http://yanbioi
1. Introduction
Transmembrane �-barrel (TMB) proteins perform diverse func-tional roles including bacterial adhesion, structural integrity ofthe cell wall, and material transport (Koebnik et al., 2000; Schulz,2000; Wimley, 2003). Unlike transmembrane �-helical proteinsthat can be easily identified by the long hydrophobic transmem-brane regions, TMB proteins are much harder to identify due tothe big variation in the short transmembrane segments (Koebniket al., 2000). A few methods have been developed to identifyTMB proteins by exploring properties such as sequence profiles(Gnanasekaran et al., 2000), �-barrel score and signal peptides(Schleiff et al., 2003), the distribution of multiple properties onprotein sequences (Zhai and Saier, 2002), and residue composi-tion and predicted secondary structure (Liu et al., 2003). Garrowet al. (2005a,b) developed a TMB-Hunt method to identify TMBproteins based on residue composition and Berven et al. (2004)developed the BOMP method that identifies TMB proteins using acombination of pattern search, �-barrel score based on amino aciddistribution, and a filter that explores the abundance of asparagineand isoleucine in the protein. Both TMB-Hunt and BOMP have webservers available. That makes it possible to compare them with the
� Author’s contributions: CY conceived and designed the study, performed theanalysis and drafted the manuscript. JH carried out the computation.
∗ Corresponding author at: Department of Computer Science, Utah State Univer-sity, Old Main Hill 4205, Logan, UT 84322, USA. Tel.: +1 435 797 2570;fax: +1 435 797 3265.
E-mail address: [email protected] (C. Yan).
T
1476-9271/$ – see front matter. Published by Elsevier Ltddoi:10.1016/j.compbiolchem.2008.03.010
) proteins play pivotal roles in many aspects of bacterial functions. Thishbor (K-NN) method for discriminating TMB and non-TMB proteins. Wepredictions based on a distance computed from residue composition and
on performance by including homologous sequences and searching for aor calculating the distance. The final method achieves an accuracy of 97.1%,ity and 98.8% specificity. A web server based on the proposed method isatics.cs.usu.edu:8080/TMBKNNsubmit.
Published by Elsevier Ltd
current study. In addition to those methods that predict whethera protein is a TMB protein, many other methods predict the topol-ogy of TMB proteins. Some of these topology-predicting methodscan also discriminate TMB proteins from non-TMB proteins. In arecent study, Bagos et al. (2005) made a systematic comparison ofthe topology-predicting methods. In that comparison, PRED-TMBB(Bagos et al., 2004) and PROFtmb (Bigelow and Rost, 2006) achievedthe 1st and 2nd best scores in predicting the topology of TMB pro-
teins. Both methods can be used to discriminate TMB proteins. Thus,we will also compare our method with PRED-TMBB and PROFtmb.2. Materials and Methods
2.1. Datasets
Transmembrane �-barrel (TMB) proteins were obtained fromthe SCOP database (“Transmembrane beta-barrels” family) (Murzinet al., 1995) and Transport Proteins Database (“�-Barrel porins”subclass) (Saier et al., 2006). Redundant proteins were removedusing BLAST (Altschul et al., 1997) so that mutual identity is lessthan 25% in the dataset. Proteins with less than 50 amino acidsand proteins that were not from Gram-negative bacteria wereremoved. The final dataset consisted of 119 TMB proteins. Non-MB proteins were obtained from the PSORTdb database (Rey et al.,
2005) and redundant proteins were removed so that mutual iden-tity is less than 25% in the dataset. These non-TMB proteins weredivided into six groups based on their subcelluar locations: 245proteins from “Cytoplasmic”, 195 proteins from “CytoplasmicMem-brane”, 15 proteins from “Cytoplasmic, CytoplasmicMembrane”,
ogy and Chemistry 32 (2008) 298–301 299
J. Hu, C. Yan / Computational Biol165 proteins from “Periplasmic”, 35 proteins from “Periplasmic,CytoplasmicMembrane”, and 87 proteins from “Extracellular”.Thus, we have seven groups of proteins in total (available athttp://yanbioinformatics.cs.usu.edu:8080/TMBKNNsubmit.)
2.2. Weighted Euclidean Distance (WED) and k-Nearest NeighborMethod
Fivefold cross-validation was used to evaluate the proposedmethod. Residue composition of each protein was calculated. Aver-age residue composition for each group of proteins was calculatedusing proteins in the training set. For each test protein, its distanceto a protein (referred to as train protein) in the training set was cal-
culated using D =√∑
i(xi test − xi train)2/x̄i train, where xi test is the
residue composition of the test protein, xi train is the composition oftrain protein, and x̄i train is the average composition of the group that
train protein belongs to. Note that√∑
i(xi test − xi train)2 gives the
Euclidean distance between the test protein and train protein. Here,in the calculation of D, each item within the summation is weightedby a factor 1/x̄i train. Therefore, D is referred to as weighted Euclideandistance (WED). For a test protein, its WEDs to every protein in thetraining set were calculated. Then, for each of the seven groups, ksmallest distances were chosen and the distance from the test pro-tein to the group was defined as the average of these k smallestdistances. The test protein was predicted to be TMB if its distanceto the TMB group was the least. Otherwise, it was predicted to benon-TMB. In this study, different values of k were tried. The bestperformance were achieved when k = 4. Thus, the results with k = 4were reported.
2.3. Greedy Approach to Select Residues and Di-peptides
We used a greedy method to search for residues and di-peptidesthat were useful for the prediction of TMB proteins. The algorithmis a simplified version of the Bestfirst method included in Weka(Witten and Frank, 2005). The greedy search started with a featureset that included 20 amino acids. The feature set was reduced byremoving amino acid from the set one at a time, until removing anyamino acid from the feature set would reduce the prediction per-formance. Then, the feature set was grown by adding di-peptidesinto the set one at a time until adding any more di-peptide intothe set would decrease the prediction performance. In the end,we obtained a set of features that included 19 residues and 24
di-peptides.2.4. Performance Measures
Prediction performance was evaluated based on sensitivity,specificity, accuracy and MCC:
sensitivity = TPTP + FN
; specificity = TNTN + FP
;
accuracy = TP + TNTP + FN + TN + FP
;
MCC = TP × TN − FP × FN√(TP + FN)(TP + FP)(TN + FP)(TN + FN)
3. Results
3.1. The Proposed Method can Distinguish Between TMB andNon-TMB Proteins
We developed a WED for measuring the distance between a pro-tein and a group, and a K-NN method for classifying proteins into
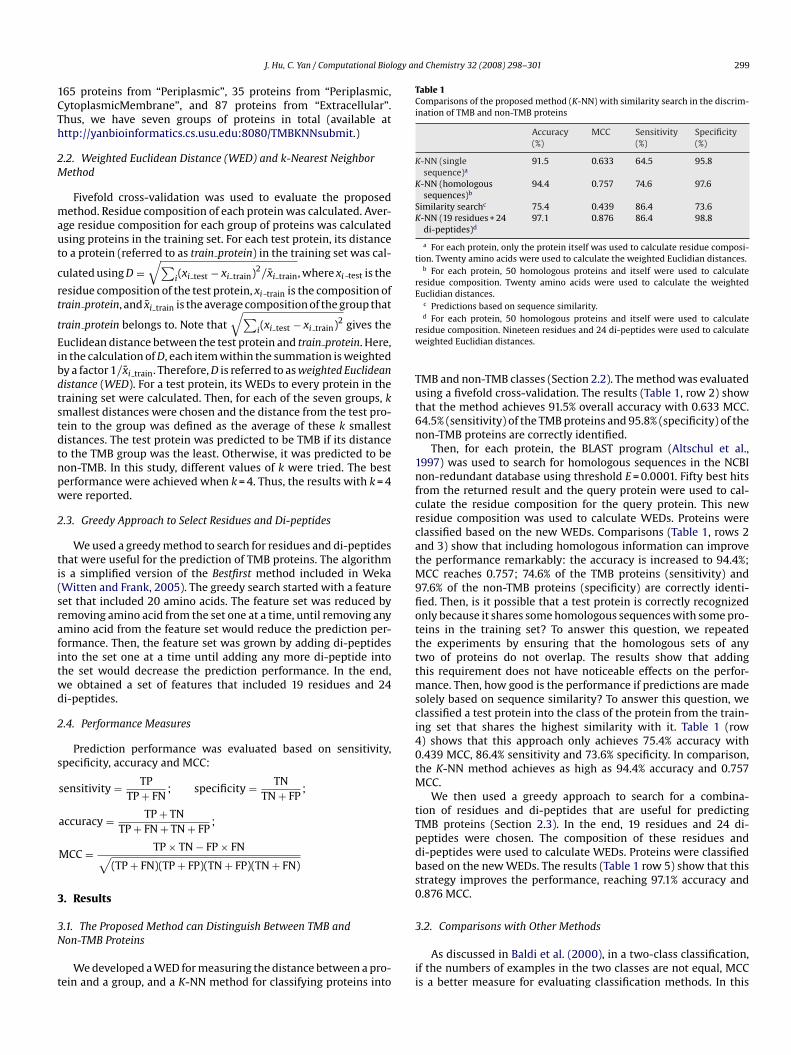
Table 1Comparisons of the proposed method (K-NN) with similarity search in the discrim-ination of TMB and non-TMB proteins
Accuracy(%)
MCC Sensitivity(%)
Specificity(%)
K-NN (singlesequence)a
91.5 0.633 64.5 95.8
K-NN (homologoussequences)b
94.4 0.757 74.6 97.6
Similarity searchc 75.4 0.439 86.4 73.6K-NN (19 residues + 24
di-peptides)d97.1 0.876 86.4 98.8
a For each protein, only the protein itself was used to calculate residue composi-tion. Twenty amino acids were used to calculate the weighted Euclidian distances.
b For each protein, 50 homologous proteins and itself were used to calculateresidue composition. Twenty amino acids were used to calculate the weightedEuclidian distances.
c Predictions based on sequence similarity.d For each protein, 50 homologous proteins and itself were used to calculate
residue composition. Nineteen residues and 24 di-peptides were used to calculateweighted Euclidian distances.
TMB and non-TMB classes (Section 2.2). The method was evaluatedusing a fivefold cross-validation. The results (Table 1, row 2) showthat the method achieves 91.5% overall accuracy with 0.633 MCC.64.5% (sensitivity) of the TMB proteins and 95.8% (specificity) of thenon-TMB proteins are correctly identified.
Then, for each protein, the BLAST program (Altschul et al.,1997) was used to search for homologous sequences in the NCBInon-redundant database using threshold E = 0.0001. Fifty best hitsfrom the returned result and the query protein were used to cal-culate the residue composition for the query protein. This newresidue composition was used to calculate WEDs. Proteins wereclassified based on the new WEDs. Comparisons (Table 1, rows 2and 3) show that including homologous information can improvethe performance remarkably: the accuracy is increased to 94.4%;MCC reaches 0.757; 74.6% of the TMB proteins (sensitivity) and97.6% of the non-TMB proteins (specificity) are correctly identi-fied. Then, is it possible that a test protein is correctly recognizedonly because it shares some homologous sequences with some pro-teins in the training set? To answer this question, we repeatedthe experiments by ensuring that the homologous sets of anytwo of proteins do not overlap. The results show that addingthis requirement does not have noticeable effects on the perfor-mance. Then, how good is the performance if predictions are madesolely based on sequence similarity? To answer this question, we
classified a test protein into the class of the protein from the train-ing set that shares the highest similarity with it. Table 1 (row4) shows that this approach only achieves 75.4% accuracy with0.439 MCC, 86.4% sensitivity and 73.6% specificity. In comparison,the K-NN method achieves as high as 94.4% accuracy and 0.757MCC.We then used a greedy approach to search for a combina-tion of residues and di-peptides that are useful for predictingTMB proteins (Section 2.3). In the end, 19 residues and 24 di-peptides were chosen. The composition of these residues anddi-peptides were used to calculate WEDs. Proteins were classifiedbased on the new WEDs. The results (Table 1 row 5) show that thisstrategy improves the performance, reaching 97.1% accuracy and0.876 MCC.
3.2. Comparisons with Other Methods
As discussed in Baldi et al. (2000), in a two-class classification,if the numbers of examples in the two classes are not equal, MCCis a better measure for evaluating classification methods. In this
300 J. Hu, C. Yan / Computational Biology an
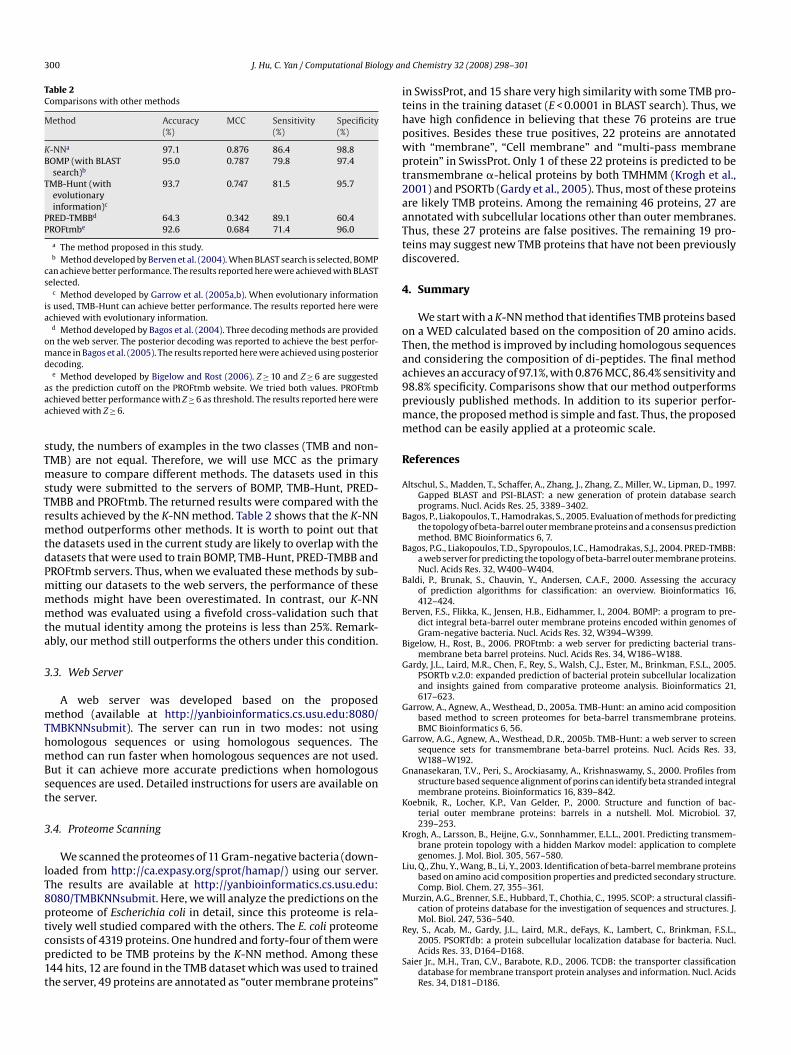
Table 2Comparisons with other methods
Method Accuracy(%)
MCC Sensitivity(%)
Specificity(%)
a
T
T
617–623.
K-NN 97.1 0.876 86.4 98.8BOMP (with BLAST
search)b95.0 0.787 79.8 97.4
TMB-Hunt (withevolutionaryinformation)c
93.7 0.747 81.5 95.7
PRED-TMBBd 64.3 0.342 89.1 60.4PROFtmbe 92.6 0.684 71.4 96.0
a The method proposed in this study.b Method developed by Berven et al. (2004). When BLAST search is selected, BOMP
can achieve better performance. The results reported here were achieved with BLASTselected.
c Method developed by Garrow et al. (2005a,b). When evolutionary informationis used, TMB-Hunt can achieve better performance. The results reported here wereachieved with evolutionary information.
d Method developed by Bagos et al. (2004). Three decoding methods are providedon the web server. The posterior decoding was reported to achieve the best perfor-mance in Bagos et al. (2005). The results reported here were achieved using posteriordecoding.
e Method developed by Bigelow and Rost (2006). Z ≥ 10 and Z ≥ 6 are suggestedas the prediction cutoff on the PROFtmb website. We tried both values. PROFtmbachieved better performance with Z ≥ 6 as threshold. The results reported here wereachieved with Z ≥ 6.
study, the numbers of examples in the two classes (TMB and non-MB) are not equal. Therefore, we will use MCC as the primary
measure to compare different methods. The datasets used in thisstudy were submitted to the servers of BOMP, TMB-Hunt, PRED-MBB and PROFtmb. The returned results were compared with the
results achieved by the K-NN method. Table 2 shows that the K-NNmethod outperforms other methods. It is worth to point out thatthe datasets used in the current study are likely to overlap with thedatasets that were used to train BOMP, TMB-Hunt, PRED-TMBB andPROFtmb servers. Thus, when we evaluated these methods by sub-mitting our datasets to the web servers, the performance of thesemethods might have been overestimated. In contrast, our K-NNmethod was evaluated using a fivefold cross-validation such thatthe mutual identity among the proteins is less than 25%. Remark-ably, our method still outperforms the others under this condition.
3.3. Web Server
A web server was developed based on the proposedmethod (available at http://yanbioinformatics.cs.usu.edu:8080/TMBKNNsubmit). The server can run in two modes: not usinghomologous sequences or using homologous sequences. Themethod can run faster when homologous sequences are not used.But it can achieve more accurate predictions when homologoussequences are used. Detailed instructions for users are available onthe server.
3.4. Proteome Scanning
We scanned the proteomes of 11 Gram-negative bacteria (down-loaded from http://ca.expasy.org/sprot/hamap/) using our server.The results are available at http://yanbioinformatics.cs.usu.edu:8080/TMBKNNsubmit. Here, we will analyze the predictions on theproteome of Escherichia coli in detail, since this proteome is rela-tively well studied compared with the others. The E. coli proteomeconsists of 4319 proteins. One hundred and forty-four of them werepredicted to be TMB proteins by the K-NN method. Among these144 hits, 12 are found in the TMB dataset which was used to trainedthe server, 49 proteins are annotated as “outer membrane proteins”
d Chemistry 32 (2008) 298–301
in SwissProt, and 15 share very high similarity with some TMB pro-teins in the training dataset (E < 0.0001 in BLAST search). Thus, wehave high confidence in believing that these 76 proteins are truepositives. Besides these true positives, 22 proteins are annotatedwith “membrane”, “Cell membrane” and “multi-pass membraneprotein” in SwissProt. Only 1 of these 22 proteins is predicted to betransmembrane �-helical proteins by both TMHMM (Krogh et al.,2001) and PSORTb (Gardy et al., 2005). Thus, most of these proteinsare likely TMB proteins. Among the remaining 46 proteins, 27 areannotated with subcellular locations other than outer membranes.Thus, these 27 proteins are false positives. The remaining 19 pro-teins may suggest new TMB proteins that have not been previouslydiscovered.
4. Summary
We start with a K-NN method that identifies TMB proteins basedon a WED calculated based on the composition of 20 amino acids.Then, the method is improved by including homologous sequencesand considering the composition of di-peptides. The final methodachieves an accuracy of 97.1%, with 0.876 MCC, 86.4% sensitivity and98.8% specificity. Comparisons show that our method outperformspreviously published methods. In addition to its superior perfor-mance, the proposed method is simple and fast. Thus, the proposedmethod can be easily applied at a proteomic scale.
References
Altschul, S., Madden, T., Schaffer, A., Zhang, J., Zhang, Z., Miller, W., Lipman, D., 1997.Gapped BLAST and PSI-BLAST: a new generation of protein database searchprograms. Nucl. Acids Res. 25, 3389–3402.
Bagos, P., Liakopoulos, T., Hamodrakas, S., 2005. Evaluation of methods for predictingthe topology of beta-barrel outer membrane proteins and a consensus predictionmethod. BMC Bioinformatics 6, 7.
Bagos, P.G., Liakopoulos, T.D., Spyropoulos, I.C., Hamodrakas, S.J., 2004. PRED-TMBB:a web server for predicting the topology of beta-barrel outer membrane proteins.Nucl. Acids Res. 32, W400–W404.
Baldi, P., Brunak, S., Chauvin, Y., Andersen, C.A.F., 2000. Assessing the accuracyof prediction algorithms for classification: an overview. Bioinformatics 16,412–424.
Berven, F.S., Flikka, K., Jensen, H.B., Eidhammer, I., 2004. BOMP: a program to pre-dict integral beta-barrel outer membrane proteins encoded within genomes ofGram-negative bacteria. Nucl. Acids Res. 32, W394–W399.
Bigelow, H., Rost, B., 2006. PROFtmb: a web server for predicting bacterial trans-membrane beta barrel proteins. Nucl. Acids Res. 34, W186–W188.
Gardy, J.L., Laird, M.R., Chen, F., Rey, S., Walsh, C.J., Ester, M., Brinkman, F.S.L., 2005.PSORTb v.2.0: expanded prediction of bacterial protein subcellular localizationand insights gained from comparative proteome analysis. Bioinformatics 21,
Garrow, A., Agnew, A., Westhead, D., 2005a. TMB-Hunt: an amino acid compositionbased method to screen proteomes for beta-barrel transmembrane proteins.BMC Bioinformatics 6, 56.
Garrow, A.G., Agnew, A., Westhead, D.R., 2005b. TMB-Hunt: a web server to screensequence sets for transmembrane beta-barrel proteins. Nucl. Acids Res. 33,W188–W192.
Gnanasekaran, T.V., Peri, S., Arockiasamy, A., Krishnaswamy, S., 2000. Profiles fromstructure based sequence alignment of porins can identify beta stranded integralmembrane proteins. Bioinformatics 16, 839–842.
Koebnik, R., Locher, K.P., Van Gelder, P., 2000. Structure and function of bac-terial outer membrane proteins: barrels in a nutshell. Mol. Microbiol. 37,239–253.
Krogh, A., Larsson, B., Heijne, G.v., Sonnhammer, E.L.L., 2001. Predicting transmem-brane protein topology with a hidden Markov model: application to completegenomes. J. Mol. Biol. 305, 567–580.
Liu, Q., Zhu, Y., Wang, B., Li, Y., 2003. Identification of beta-barrel membrane proteinsbased on amino acid composition properties and predicted secondary structure.Comp. Biol. Chem. 27, 355–361.
Murzin, A.G., Brenner, S.E., Hubbard, T., Chothia, C., 1995. SCOP: a structural classifi-cation of proteins database for the investigation of sequences and structures. J.Mol. Biol. 247, 536–540.
Rey, S., Acab, M., Gardy, J.L., Laird, M.R., deFays, K., Lambert, C., Brinkman, F.S.L.,2005. PSORTdb: a protein subcellular localization database for bacteria. Nucl.Acids Res. 33, D164–D168.
Saier Jr., M.H., Tran, C.V., Barabote, R.D., 2006. TCDB: the transporter classificationdatabase for membrane transport protein analyses and information. Nucl. AcidsRes. 34, D181–D186.

J. Hu, C. Yan / Computational Biology an
Schleiff, E., Eichacker, L.A., Eckart, K., Becker, T., Mirus, O., Stahl, T., Soll, J., 2003.Prediction of the plant beta-barrel proteome: a case study of the chloroplastouter envelope. Protein Sci. 12, 748–759.
Schulz, G.E., 2000. Beta-barrel membrane proteins. Curr. Opin. Struct. Biol. 10,443–447.
Wimley, W.C., 2003. The versatile beta-barrel membrane protein. Curr. Opin. Struct.Biol. 13, 404–411.
d Chemistry 32 (2008) 298–301 301
Witten, I.H., Frank, E., 2005. Data Mining: Practical Machine Learning Tools andTechniques. Morgan Kaufmann, San Francisco.
Zhai, Y., Saier, M.H.J.R., 2002. The beta-barrel finder (BBF) program, allowing iden-tification of outer membrane beta-barrel proteins encoded within prokaryoticgenomes. Protein Sci. 11, 2196–2207.