Embed Size (px)
Citation preview

Abstract—This paper proposes a method for estimating the
meanings for groups of shapes in presentation slides. The
method of estimation is as follows; 1) Extracting features of
each shape in a presentation slide, such as size, position, and
type (e.g. circle, rectangle, arrow, etc.), 2) Analyzing the
relations between these shapes, such as connection, inclusion,
overlap, and similarity, 3) Grouping the shapes into meaningful
groups using these relations, and estimating the meaning for
each group, such as list, set, and flow/transition. The result of
the proposed method could be used for retrieval and reuse of
figures in presentation slides. In order to verify the effectiveness
of the proposed method, we conducted an experiment of
estimation accuracy, and achieved 0.93 in recall and 0.70 in
precision.
Index Terms—PowerPoint, OpenXML, figure retrieval.
I. INTRODUCTION
A presentation tool such as Microsoft PowerPoint is a
method of communicating information or opinions to other
people. It is used in many situations, such as lectures and
presentations in schools or universities, and meetings and
conferences in companies. The number of publicly accessible
presentation slides increases every year, and they could be
regarded as a useful resource of knowledge.
There is a demand to raise working efficiency for making
presentation slides, because drawing figures and diagrams
usually requires a lot of time and effort, and presentation
slides that are made in the past could be reused to save this
time and effort. Therefore, search function for presentation
slides, such as Microsoft PowerPoint, attracts much attention
recently.
Figures, as well as text, are frequently used in presentation
slides in order for the audience to easily and quickly
understand the contents visually. Figures often summarize
the contents of a slide, so they could be an important element
to understand the contents of the slide.
Parts of figures in certain structures, such as
flow/transition and diagrams, can be reused in other slides,
and are actually frequently reused. It takes a lot of time and
Manuscript received September 5, 2014; revised November 17, 2014.
Y. Sakuragi is with at the Graduate School of Information Science and
Engineering, Ritsumeikan University, 1-1-1 Noji-higashi, Kusatsu, Shiga
525-8577, Japan (e-mail: is0018ke@ ed.ritsumei.ac.jp).
A. Aoyama is with Graduate School of Technology Management,
Ritsumeikan University, 1-1-1 Noji-higashi, Kusatsu, Shiga 525-8577, Japan
(e-mail: [email protected]).
F. Kimura is with Kinugasa Research Organization, Ritsumeikan
University, 56-1 Toji-in Kita-machi, Kita-ku, Kyoto, Kyoto 603-8577, Japan
(e-mail: fkimura@ ed.ritsumei.ac.jp).
A. Maeda is with College of Information Science and Engineering,
Ritsumeikan University, 1-1-1 Noji-higashi, Kusatsu, Shiga 525-8577, Japan
(e-mail: [email protected]).
effort to make such figures from scratch. The working
efficiency of making a presentation could be increased if we
can reuse and modify figures that are made in the past.
However, such figures are difficult to retrieve by using
simple text search, because it depends on text in or around the
figure to be retrieved.
We have proposed a presentation slide retrieval system
which focuses on figures that consist of shapes [1]. In this
system, a user formulates a query as a group of shapes, and
the system retrieves slides that contain figures similar to the
query. The disadvantages of the current system are that it
requires a considerable amount of labor for formulating a
query, and it does not consider the hierarchy of shapes
Estimating the meanings of groups of shapes from the
hierarchy of shapes is especially important, because a
hierarchical structure of shapes can express the meaning of
shapes within a group of shapes, such as a list structure in a
flow/transition.
Therefore, this paper proposes a method for estimating the
meanings of groups of shapes from the hierarchy of shapes in
presentation slides. The result of the proposed method could
be used to retrieve figures in slides using the structure of
shapes, and to reuse figures in presentation slides.
In this paper a “shape” represents a predefined basic shape,
such as a circle, a rectangle, and an arrow. A “group of
shapes” represents a certain set of shapes that are considered
to have some meaning by the proposed system. Besides, a
“figure” represents a figure or a diagram that consists of one
or more groups of shapes and expresses some message to
audience.
II. RELATED WORK
There is some research about presentation slides in the
field of image processing [2], [3].
Wang et al. proposed an image classification system that
focuses on synthetic (e.g. non-photographic) images [2]. The
NPIC system extracts both content-based image retrieval
features and metadata-based textual features for each image
using machine learning. And the system classifies figures
into block diagrams, tables, graphs and pie charts.
Liew et al. proposed a method for slide search using an
image processing technique by regarding a slide as a picture
[3]. They extracted three types of features from a picture,
such as text features, image features and presentation
features. The slide image type, that is one of the image
features, is determined using the NPIC system.
There is also some research about image classification
focused on specific synthetic image classes [4], [5].
Huang et al. proposed a system that aims at recognizing
chart images using a model-based approach [4]. They
A Method for Estimating Meanings for Groups of Shapes
in Presentation Slides
Yuki Sakuragi, Atsushi Aoyama, Fuminori Kimura, and Akira Maeda
International Journal of Computer Theory and Engineering, Vol. 8, No. 1, February 2016
74DOI: 10.7763/IJCTE.2016.V8.1023
classified a basic chart model into four different chart types
based on their characteristics using basic object features and
constraints between objects defined.
Carberry et al. proposed a method for extending document
summarization to the summarization of information graphics
[5]. They classified graphics and then extracted the data and
the semantic meaning of several types of charts: such as bar,
pie and line charts.
These researches are similar to our research, but our research
does not regard a figure as a picture, and figures we focused
on are not a table or a graph but basic shapes, such as a circle,
a rectangle, and an arrow.
Zhou et al. proposed a method for extracting text from
WWW images [6]. They detected text on images by
examining connected components that satisfy certain criteria.
It is similar to our research in the point of relating object and
text, but our research uses only the information of shapes, so
we can estimate the meaning of an object without using the
metadata of the object.
Wang et al. proposed a generation method of presentation
slides based on expression styles using slide structure [7], [8].
They derived the slide structure by focusing on the level of
indentation of slide text. Their method derives the structure
of multiple slides using text features, whereas our method
derives the structure of a figure using the features of shapes.
Our proposed method estimates the meanings for groups of
shapes by analyzing relations between shapes. In that sense,
our method is different from existing works that analyze the
structure of presentation slides.
Hayama et al. proposed a method for extracting the
structure of information in presentation slides [9]. They
organized each object on a slide into one of the attribute
groups of “title”, “figure”, “table”, “text”, or “decoration”,
and proposed a method for structuring a slide by assembling
the groups into a tree structure. However, their work deals
with a different kind of structure from our research, because a
“structure” in their work means a kind of attribute to the
slides, but a “structure” in our work means the structure of a
figure.
III. STRUCTURE OF FIGURES IN PRESENTATION SLIDES
Shapes, such as circles, rectangles, lines, arrows, etc., are
often used in presentation slides as constituent parts of
figures/diagrams, because they make it easy to understand the
contents of slides. Figures mostly consist of combination of
many shapes, and these shape groups express the contents of
a slide visually. Although a human can recognize a group of
shapes as a figure having some meaning, it is difficult for a
computer to do so. Therefore, the aim of this research is to let
a computer estimate the meanings for groups of shapes as
humans do.
A. Grouping of the Shapes
The proposed method groups the shapes in presentation
slides that are considered to have some meanings. The
“meanings” mentioned here are the meanings that are
obtained by analyzing the questionnaire of recognition of the
shape by humans.
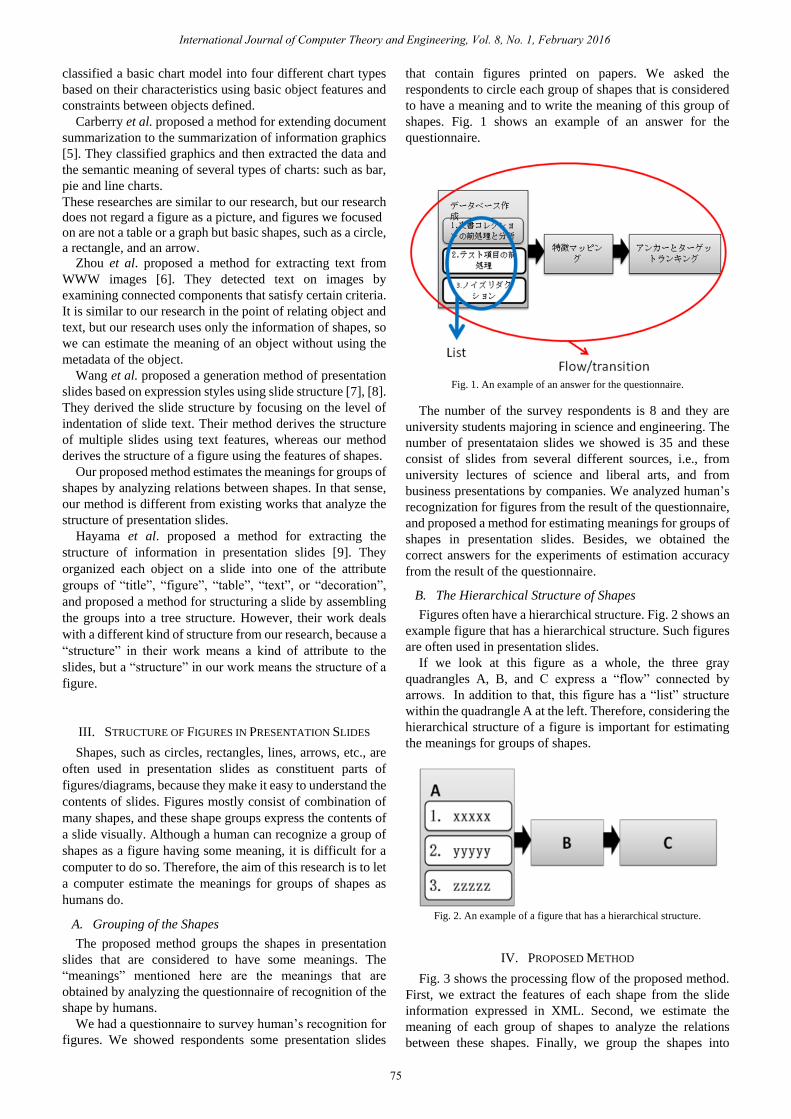
We had a questionnaire to survey human’s recognition for
figures. We showed respondents some presentation slides
that contain figures printed on papers. We asked the
respondents to circle each group of shapes that is considered
to have a meaning and to write the meaning of this group of
shapes. Fig. 1 shows an example of an answer for the
questionnaire.
Fig. 1. An example of an answer for the questionnaire.
The number of the survey respondents is 8 and they are
university students majoring in science and engineering. The
number of presentataion slides we showed is 35 and these
consist of slides from several different sources, i.e., from
university lectures of science and liberal arts, and from
business presentations by companies. We analyzed human’s
recognization for figures from the result of the questionnaire,
and proposed a method for estimating meanings for groups of
shapes in presentation slides. Besides, we obtained the
correct answers for the experiments of estimation accuracy
from the result of the questionnaire.
B. The Hierarchical Structure of Shapes
Figures often have a hierarchical structure. Fig. 2 shows an
example figure that has a hierarchical structure. Such figures
are often used in presentation slides.
If we look at this figure as a whole, the three gray
quadrangles A, B, and C express a “flow” connected by
arrows. In addition to that, this figure has a “list” structure
within the quadrangle A at the left. Therefore, considering the
hierarchical structure of a figure is important for estimating
the meanings for groups of shapes.
Fig. 2. An example of a figure that has a hierarchical structure.
IV. PROPOSED METHOD
Fig. 3 shows the processing flow of the proposed method.
First, we extract the features of each shape from the slide
information expressed in XML. Second, we estimate the
meaning of each group of shapes to analyze the relations
between these shapes. Finally, we group the shapes into
International Journal of Computer Theory and Engineering, Vol. 8, No. 1, February 2016
75

International Journal of Computer Theory and Engineering, Vol. 8, No. 1, February 2016
76
meaningful groups using these relations.
Fig. 3. Processing flow of the proposed method.
A. Extraction of Shape Information
The format for a presentation document with “pptx”
extension is adapted by Microsoft Office 2007 and later
versions. It can be converted into the OpenXML format that
can be divided into texts and shapes.
It is easier for us to obtain the information of each element
from an XML document, because it is text data which
consists of tags, and arranged for every element. Fig. 4 shows
a part of a pptx document that is converted into OpenXML.
The information of the type of a shape, rotation angle,
position, height and width, etc. can be extracted from this text
data.
Fig. 4. An example of text information in an OpenXML document.
B. Defining the Hierarchical Structure of Shapes
In this research, we used inclusive relations between
shapes in order to consider the hierarchy of shapes. The
system assigns each shape to a proper level of hierarchy using
inclusive relations.
In an example of Fig. 5, when the shape “M” includes the
shape “N”, and if the hierarchy level of the shape “M” is “n”,
the level of the shape “N” is set to “n+1”.
The shapes that are not included in any shape are set to
“1st” hierarchy.
Fig. 5. Hierarchy of shapes.
For example, as the result of defining the hierarchical
structure of shapes to the presentation slide shown in Fig. 6,
the system judges that the blue shape is the 1st hierarchy, the
white shapes are the 2nd, the yellow shapes are the 3rd, and
the pink shape is the 4th.
The results of this process are used by the next step of
grouping of shapes considering the meanings.
Also, using the results of the grouping step, we update the
hierarchical structure. The grouped shapes constitute a new
hierarchical class, and the shapes that belong to a group of
shapes are assigned a hierarchical class one level below of the
group of shapes.
Fig. 7 shows an example of the shapes and hierarchical
structure of the shapes.
Fig. 6. An example of defining the hierarchical structure of shapes.
Fig. 7. An example of defining the hierarchical structure of shapes.
C. Grouping of Shapes
This step groups shapes into meaningful groups
considering their meanings. In this paper, we adopt three
meaningful features determined from the analysis of the
questionnaire survey of human's recognition of figures in
actual presentation slides, which was explained in Section
III.A.
The three adopted meaningful features are as follows:
1) Shapes using arrows
2) Shapes that overlap
3) Shapes that have the same type and similar size
Using these meaningful features, we group the shapes into
meaningful groups.
1) Grouping as the meaning of a flow/transition
The method determines which shape an arrow points to,
and which shape an arrow comes from, and groups the arrow
shape and the two shapes that are determined to be connected
by that arrow. As shown in Fig. 8, this group of shapes has the
meaning of “flow/transition” in which an arrow shape exists
between shapes. This meaning is attached to the group of
shapes that are grouped by an arrow. The meaning of
“flow/transition” is used when the transition of procedure or
things is expressed.
Fig. 8. An example of a group that has the meaning of “flow/transition”.
In the grouping of meaning “flow”, the system searches for
the two shapes related by an arrow shape. The search range
focuses on the shape which is within the angle of ±90 degrees
in the direction of back to front of the arrow shape, as shown
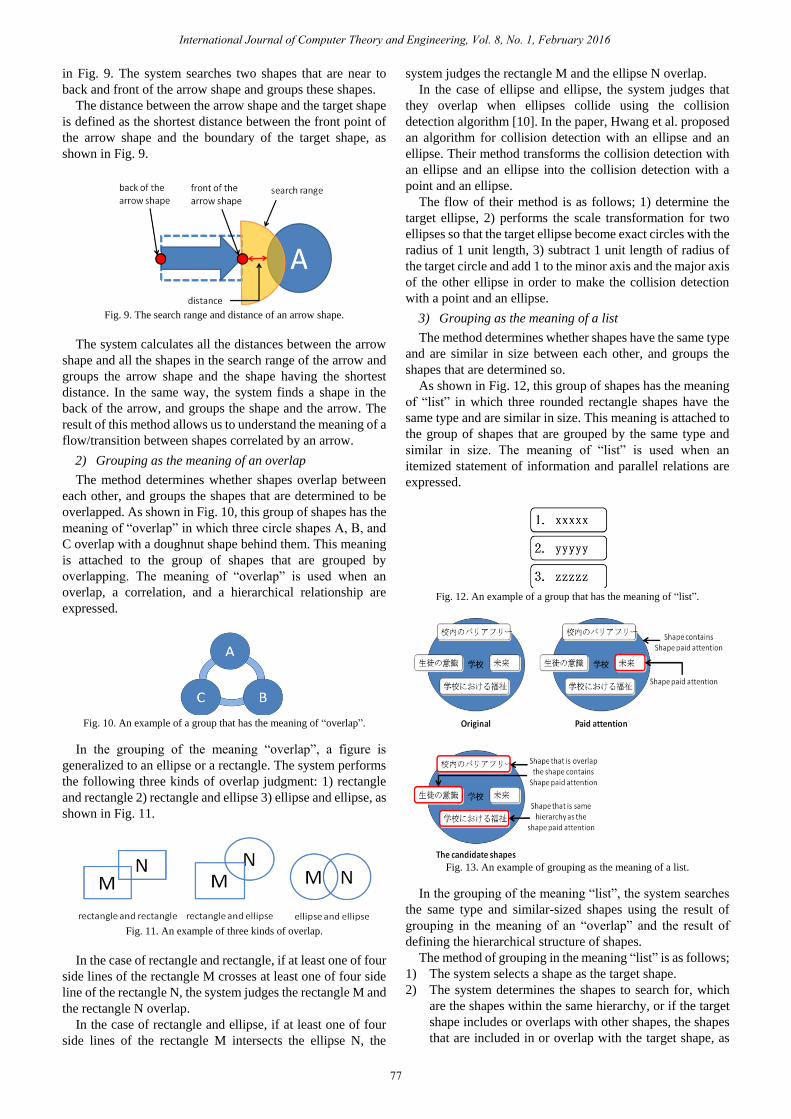
in Fig. 9. The system searches two shapes that are near to
back and front of the arrow shape and groups these shapes.
The distance between the arrow shape and the target shape
is defined as the shortest distance between the front point of
the arrow shape and the boundary of the target shape, as
shown in Fig. 9.
Fig. 9. The search range and distance of an arrow shape.
The system calculates all the distances between the arrow
shape and all the shapes in the search range of the arrow and
groups the arrow shape and the shape having the shortest
distance. In the same way, the system finds a shape in the
back of the arrow, and groups the shape and the arrow. The
result of this method allows us to understand the meaning of a
flow/transition between shapes correlated by an arrow.
2) Grouping as the meaning of an overlap
The method determines whether shapes overlap between
each other, and groups the shapes that are determined to be
overlapped. As shown in Fig. 10, this group of shapes has the
meaning of “overlap” in which three circle shapes A, B, and
C overlap with a doughnut shape behind them. This meaning
is attached to the group of shapes that are grouped by
overlapping. The meaning of “overlap” is used when an
overlap, a correlation, and a hierarchical relationship are
expressed.
Fig. 10. An example of a group that has the meaning of “overlap”.
In the grouping of the meaning “overlap”, a figure is
generalized to an ellipse or a rectangle. The system performs
the following three kinds of overlap judgment: 1) rectangle
and rectangle 2) rectangle and ellipse 3) ellipse and ellipse, as
shown in Fig. 11.
Fig. 11. An example of three kinds of overlap.
In the case of rectangle and rectangle, if at least one of four
side lines of the rectangle M crosses at least one of four side
line of the rectangle N, the system judges the rectangle M and
the rectangle N overlap.
In the case of rectangle and ellipse, if at least one of four
side lines of the rectangle M intersects the ellipse N, the
system judges the rectangle M and the ellipse N overlap.
In the case of ellipse and ellipse, the system judges that
they overlap when ellipses collide using the collision
detection algorithm [10]. In the paper, Hwang et al. proposed
an algorithm for collision detection with an ellipse and an
ellipse. Their method transforms the collision detection with
an ellipse and an ellipse into the collision detection with a
point and an ellipse.
The flow of their method is as follows; 1) determine the
target ellipse, 2) performs the scale transformation for two
ellipses so that the target ellipse become exact circles with the
radius of 1 unit length, 3) subtract 1 unit length of radius of
the target circle and add 1 to the minor axis and the major axis
of the other ellipse in order to make the collision detection
with a point and an ellipse.
3) Grouping as the meaning of a list
The method determines whether shapes have the same type
and are similar in size between each other, and groups the
shapes that are determined so.
As shown in Fig. 12, this group of shapes has the meaning
of “list” in which three rounded rectangle shapes have the
same type and are similar in size. This meaning is attached to
the group of shapes that are grouped by the same type and
similar in size. The meaning of “list” is used when an
itemized statement of information and parallel relations are
expressed.
Fig. 12. An example of a group that has the meaning of “list”.
Fig. 13. An example of grouping as the meaning of a list.
In the grouping of the meaning “list”, the system searches
the same type and similar-sized shapes using the result of
grouping in the meaning of an “overlap” and the result of
defining the hierarchical structure of shapes.
The method of grouping in the meaning “list” is as follows;
1) The system selects a shape as the target shape.
2) The system determines the shapes to search for, which
are the shapes within the same hierarchy, or if the target
shape includes or overlaps with other shapes, the shapes
that are included in or overlap with the target shape, as
International Journal of Computer Theory and Engineering, Vol. 8, No. 1, February 2016
77
the candidate shapes for the judgment.
3) The candidate shape is regarded that it is contained in the
“list” of the target shape, if it has the same type and
similar in size as the target one. In this paper, if
longitudinal width of a shape M is more than 0.5 times of
longitudinal width of a shape N and less than 1.5 times of
longitudinal width of a shape N, the system groups these
shapes into one.
Fig. 13 shows an example of grouping as the meaning of a
list.
V. EXPERIMENT
TABLE I: THE ACCURACY RATE OF DEFINING THE HIERARCHICAL
STRUCTURE OF SHAPES
Accuracy rate 0.76
TABLE II: PRECISION AND RECALL OF ESTIMATING THE MEANINGS OF
GROUPS OF SHAPES
Meaning Precision Recall
Flow/transition 0.82 0.85
Overlap 0.59 1.00
List 0.68 0.95
Average 0.70 0.93
In order to verify the effectiveness of the proposed method,
we conducted an experiment of estimation accuracy. We
computed the accuracy rate of defining the hierarchical
structure of shapes, and precision and recall of estimating the
meanings of groups of shapes.
The accuracy rate of defining the hierarchical structure of
shapes and precision and recall of estimating the meanings of
groups of shapes are defined as follows:
C
Brateaccuracy _
where:
|B| is the total number of the shapes whose hierarchy
matched
|C| is the total number of the target shapes
A
ARprecision
R
ARrecall
where:
|A| is the total number of the shape groups obtained by the
proposed method
|R| is the total number of the correct shape groups
The correct answers were obtained from the result of a
questionnaire survey conducted on 8 people.
The number of the slides that are used for the experiment is
18, and the total number of shapes in these presentation slides
is 187. The slides are the same ones that were used in the
questionnaire survey described in Section III.A.
Results
Table I shows the accuracy rate of defining the hierarchical
structure of shapes. Table II shows the precision and recall of
estimating the meanings of groups of shapes. We achieved
0.93 in recall and 0.70 in precision. However, the number of
slides used in this experiment is not actually sufficient for
reliable results, so we are planning to conduct a larger-scale
experiment with more slides with more variations of shapes.
VI. DISCUSSION
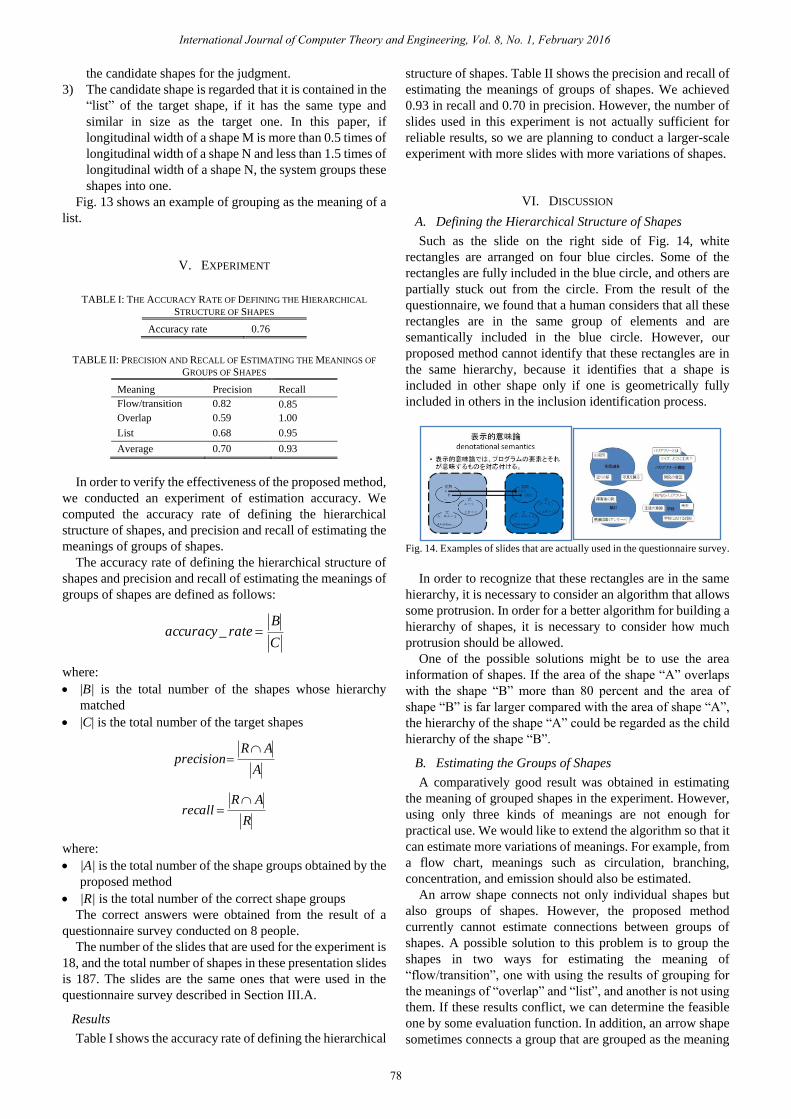
A. Defining the Hierarchical Structure of Shapes
Such as the slide on the right side of Fig. 14, white
rectangles are arranged on four blue circles. Some of the
rectangles are fully included in the blue circle, and others are
partially stuck out from the circle. From the result of the
questionnaire, we found that a human considers that all these
rectangles are in the same group of elements and are
semantically included in the blue circle. However, our
proposed method cannot identify that these rectangles are in
the same hierarchy, because it identifies that a shape is
included in other shape only if one is geometrically fully
included in others in the inclusion identification process.
Fig. 14. Examples of slides that are actually used in the questionnaire survey.
In order to recognize that these rectangles are in the same
hierarchy, it is necessary to consider an algorithm that allows
some protrusion. In order for a better algorithm for building a
hierarchy of shapes, it is necessary to consider how much
protrusion should be allowed.
One of the possible solutions might be to use the area
information of shapes. If the area of the shape “A” overlaps
with the shape “B” more than 80 percent and the area of
shape “B” is far larger compared with the area of shape “A”,
the hierarchy of the shape “A” could be regarded as the child
hierarchy of the shape “B”.
B. Estimating the Groups of Shapes
A comparatively good result was obtained in estimating
the meaning of grouped shapes in the experiment. However,
using only three kinds of meanings are not enough for
practical use. We would like to extend the algorithm so that it
can estimate more variations of meanings. For example, from
a flow chart, meanings such as circulation, branching,
concentration, and emission should also be estimated.
An arrow shape connects not only individual shapes but
also groups of shapes. However, the proposed method
currently cannot estimate connections between groups of
shapes. A possible solution to this problem is to group the
shapes in two ways for estimating the meaning of
“flow/transition”, one with using the results of grouping for
the meanings of “overlap” and “list”, and another is not using
them. If these results conflict, we can determine the feasible
one by some evaluation function. In addition, an arrow shape
sometimes connects a group that are grouped as the meaning
International Journal of Computer Theory and Engineering, Vol. 8, No. 1, February 2016
78
of “flow/transition” and a shape or a group of some other
meanings. Thus, the algorithm for grouping for the meaning
of “flow/transition” is needed to be reconsidered.
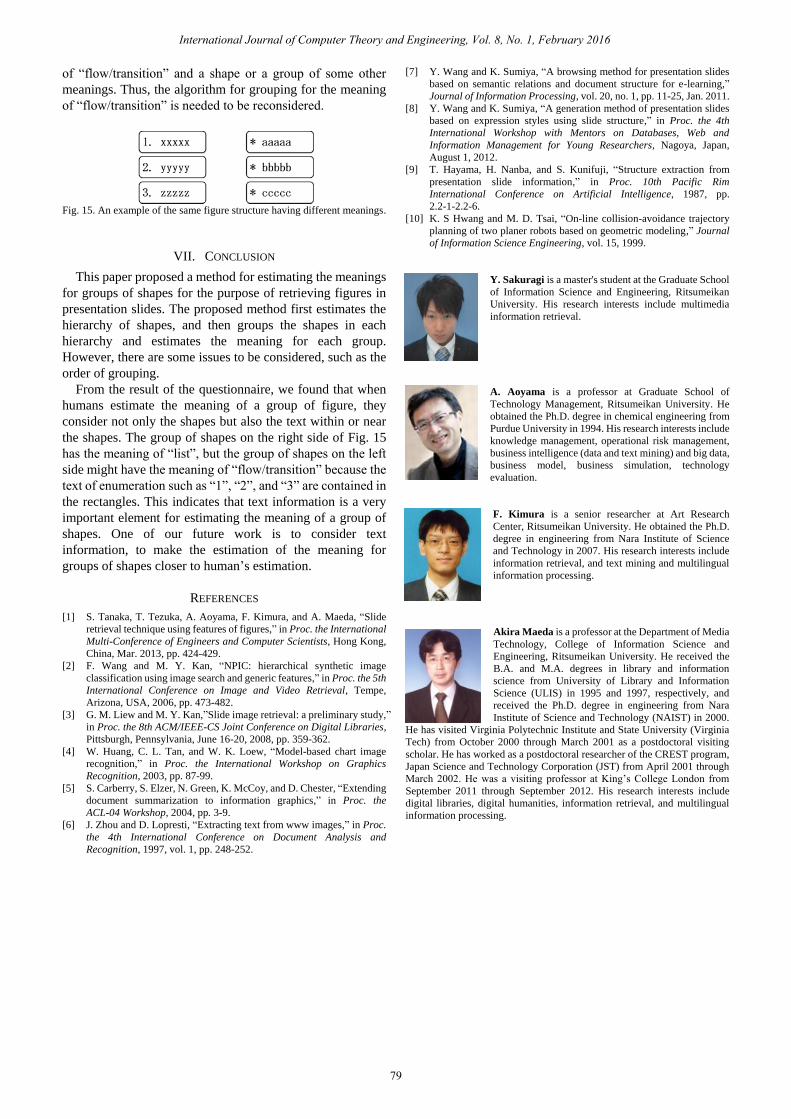
Fig. 15. An example of the same figure structure having different meanings.
VII. CONCLUSION
This paper proposed a method for estimating the meanings
for groups of shapes for the purpose of retrieving figures in
presentation slides. The proposed method first estimates the
hierarchy of shapes, and then groups the shapes in each
hierarchy and estimates the meaning for each group.
However, there are some issues to be considered, such as the
order of grouping.
From the result of the questionnaire, we found that when
humans estimate the meaning of a group of figure, they
consider not only the shapes but also the text within or near
the shapes. The group of shapes on the right side of Fig. 15
has the meaning of “list”, but the group of shapes on the left
side might have the meaning of “flow/transition” because the
text of enumeration such as “1”, “2”, and “3” are contained in
the rectangles. This indicates that text information is a very
important element for estimating the meaning of a group of
shapes. One of our future work is to consider text
information, to make the estimation of the meaning for
groups of shapes closer to human’s estimation.
REFERENCES
[1] S. Tanaka, T. Tezuka, A. Aoyama, F. Kimura, and A. Maeda, “Slide
retrieval technique using features of figures,” in Proc. the International
Multi-Conference of Engineers and Computer Scientists, Hong Kong,
China, Mar. 2013, pp. 424-429.
[2] F. Wang and M. Y. Kan, “NPIC: hierarchical synthetic image
classification using image search and generic features,” in Proc. the 5th
International Conference on Image and Video Retrieval, Tempe,
Arizona, USA, 2006, pp. 473-482.
[3] G. M. Liew and M. Y. Kan,”Slide image retrieval: a preliminary study,”
in Proc. the 8th ACM/IEEE-CS Joint Conference on Digital Libraries,
Pittsburgh, Pennsylvania, June 16-20, 2008, pp. 359-362.
[4] W. Huang, C. L. Tan, and W. K. Loew, “Model-based chart image
recognition,” in Proc. the International Workshop on Graphics
Recognition, 2003, pp. 87-99.
[5] S. Carberry, S. Elzer, N. Green, K. McCoy, and D. Chester, “Extending
document summarization to information graphics,” in Proc. the
ACL-04 Workshop, 2004, pp. 3-9.
[6] J. Zhou and D. Lopresti, “Extracting text from www images,” in Proc.
the 4th International Conference on Document Analysis and
Recognition, 1997, vol. 1, pp. 248-252.
[7] Y. Wang and K. Sumiya, “A browsing method for presentation slides
based on semantic relations and document structure for e-learning,”
Journal of Information Processing, vol. 20, no. 1, pp. 11-25, Jan. 2011.
[8] Y. Wang and K. Sumiya, “A generation method of presentation slides
based on expression styles using slide structure,” in Proc. the 4th
International Workshop with Mentors on Databases, Web and
Information Management for Young Researchers, Nagoya, Japan,
August 1, 2012.
[9] T. Hayama, H. Nanba, and S. Kunifuji, “Structure extraction from
presentation slide information,” in Proc. 10th Pacific Rim
International Conference on Artificial Intelligence, 1987, pp.
2.2-1-2.2-6.
[10] K. S Hwang and M. D. Tsai, “On-line collision-avoidance trajectory
planning of two planer robots based on geometric modeling,” Journal
of Information Science Engineering, vol. 15, 1999.
Y. Sakuragi is a master's student at the Graduate School
of Information Science and Engineering, Ritsumeikan
University. His research interests include multimedia
information retrieval.
A. Aoyama is a professor at Graduate School of
Technology Management, Ritsumeikan University. He
obtained the Ph.D. degree in chemical engineering from
Purdue University in 1994. His research interests include
knowledge management, operational risk management,
business intelligence (data and text mining) and big data,
business model, business simulation, technology
evaluation.
F. Kimura is a senior researcher at Art Research
Center, Ritsumeikan University. He obtained the Ph.D.
degree in engineering from Nara Institute of Science
and Technology in 2007. His research interests include
information retrieval, and text mining and multilingual
information processing.
Akira Maeda is a professor at the Department of Media
Technology, College of Information Science and
Engineering, Ritsumeikan University. He received the
B.A. and M.A. degrees in library and information
science from University of Library and Information
Science (ULIS) in 1995 and 1997, respectively, and
received the Ph.D. degree in engineering from Nara
Institute of Science and Technology (NAIST) in 2000.
He has visited Virginia Polytechnic Institute and State University (Virginia
Tech) from October 2000 through March 2001 as a postdoctoral visiting
scholar. He has worked as a postdoctoral researcher of the CREST program,
Japan Science and Technology Corporation (JST) from April 2001 through
March 2002. He was a visiting professor at King’s College London from
September 2011 through September 2012. His research interests include
digital libraries, digital humanities, information retrieval, and multilingual
information processing.
International Journal of Computer Theory and Engineering, Vol. 8, No. 1, February 2016
79