Embed Size (px)
Citation preview

A Method for Evaluating QoE of Live Streaming Services
Hui Zhang*, Xiuhua Jiang, Xiaohua Lei
Digital Video Quality Assessment Lab, Communication University of China, Beijing, P. R. China. * Corresponding author. Tel.: +86 13436478364; email: [email protected] Manuscript submitted June 29, 2015; accepted October 13, 2015. doi: 10.17706/ijcee.2015.7.5.296-304
Abstract: This paper presents a novel method which can provide accurate real-time evaluation for Quality
of Experience (QoE) of live streaming services. First, we use the modified Analytic Hierarchy Process (AHP)
to build a QoE model which is mainly based on video quality and network transmission quality in live
streaming services. Then, for video quality, we take into account the unique multi-resolution feature of
Internet live streaming videos and design a video quality assessment algorithm mainly based on bitrate,
temporal perceptual information (TI) and spatial perceptual information (SI). This algorithm removes the
interference of multi-resolution and has a good correlation with subjective perception. And for network
transmission quality, we design another assessment algorithm based on buffering time and frequency.
Finally, by using the QoE model and the assessment algorithms, we can build a real-time QoE monitoring
and evaluation system for live streaming services.
Key words: Media streaming, objective evaluation techniques, QoE, subjective evaluation techniques.
1. Introduction
With the rapid development of communication technology, various multimedia services also develop in
full swing. Nowadays, users can easily get access to a wide variety of services and applications and they are
putting more attention to the quality of experience the service providers can offer. The traditional concept
of Quality of Service (QoS) can’t solve the problem of user-centered service quality management. Thus ITU
put forward the concept of Quality of Experience (QoE). Compared with QoS, QoE can evaluate the overall
satisfaction of an application or service from the user's point of view. It does not only realize the
quantization of users’ experience, but also reflects the gap between real quality of service and users’
expectations at the same time [1].
Different services have different factors to influence the overall QoE. Researchers have been working on
finding the method to quantify and map these factors into a QoE model to assess the quality of the
corresponding service.
QoE evaluation methods can be classified into three categories: subjective methods, objective methods
and pseudo subjective methods. Subjective methods include single-stimulus methods (SS), double-stimulus
impairment scale method (DSIS), double-stimulus continuous quality-scale method (DSCQS) [2], [3], etc. We
can even simply evaluate users’ experience with questionnaires. These methods can directly get results
from the perspective of users’ perception, but they are so costly and time-consuming that we always only
use them for validation or error correction. No-reference objective methods try to evaluate users’
experience from several objective quality parameters such as delay, jitter, etc. Compared with subjective
methods, they are more efficient and easier to deploy. However, to get a much more accurate evaluation of
International Journal of Computer and Electrical Engineering
296 Volume 7, Number 5, October 2015
users’ experience, we need to consider multiple QoS parameters and sometimes this can be really difficult.
For example, authors in [4] divided the QoE of IPTV service into two components and proposed an objective
assessment algorithm for each component. But they failed to evaluate the overall QoE from those two
components. Authors in [5] also proposed a mapping model between QoS and QoE of IPTV service, but they
could only figure out the objective assessment method for video quality of IPTV service. Combing the
advantages of subjective method and objective method, pseudo subjective method, also known as pseudo
subjective quality assessment (PSQA) [6], can provide real-time and accurate evaluation of users’
experience based on human perception model. Basic steps of PSQA for QoE evaluation are as follows [7].
First we should analyze the specific service we are going to evaluate to get the QoE metrics and
corresponding QoS parameters. Now we can establish a mapping model between QoS and QoE. Then we
should conduct quality evaluation experiments in either laboratory viewing environment or home viewing
environment with well selected samples. The laboratory viewing environment is intended to provide
critical conditions to check systems whereas the home viewing environment is intended to provide a means
to evaluate quality on the consumer side of the service [2]. The subjects should also be well selected from
different ages, genders, educational backgrounds, etc. After collecting data and sifting through them, we can
finally correlate QoS and QoE with appropriate mathematical models. These mathematical models include
Analytic Hierarchy Process (AHP) [8], hidden Markov models (HMM), regress analysis, support vector
machine, etc.
AHP is a widely used method in solving integrated multi-index problems. It combines qualitative and
quantitative methods while reducing the influence of subjective factors to ensure the rationality of the
systems or models. The basic steps to apply AHP algorithm is as follows. First, we need to establish a
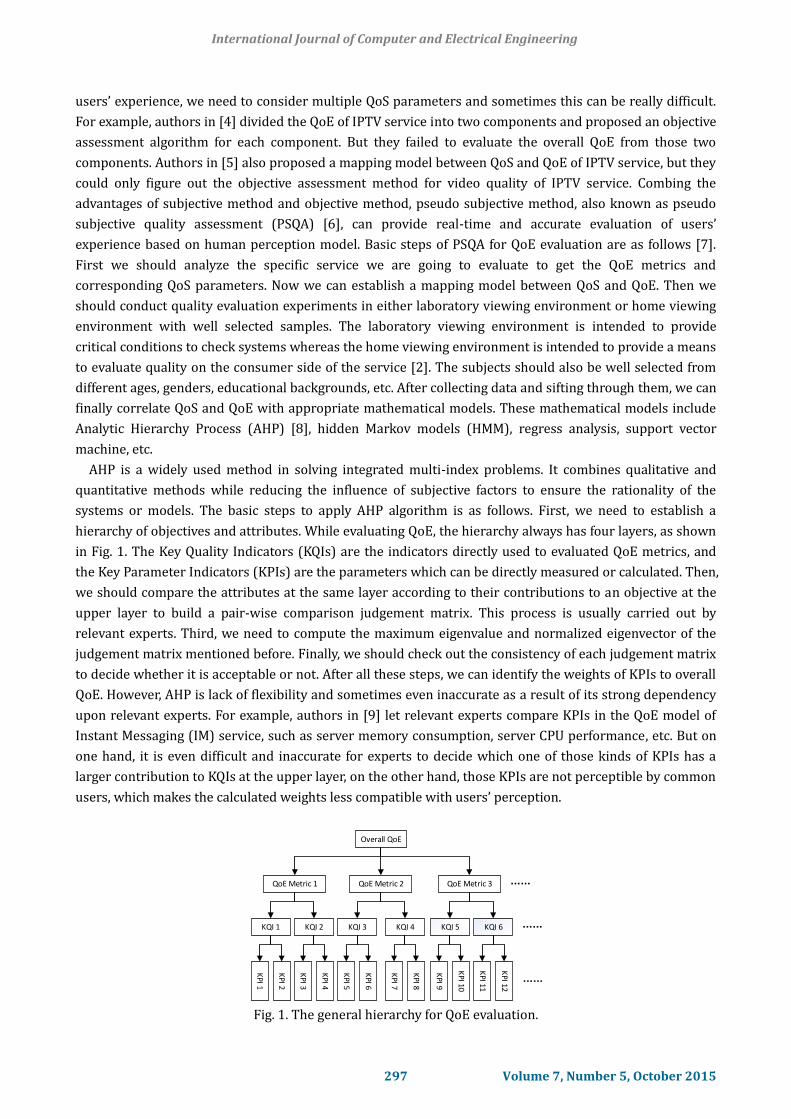
hierarchy of objectives and attributes. While evaluating QoE, the hierarchy always has four layers, as shown
in Fig. 1. The Key Quality Indicators (KQIs) are the indicators directly used to evaluated QoE metrics, and
the Key Parameter Indicators (KPIs) are the parameters which can be directly measured or calculated. Then,
we should compare the attributes at the same layer according to their contributions to an objective at the
upper layer to build a pair-wise comparison judgement matrix. This process is usually carried out by
relevant experts. Third, we need to compute the maximum eigenvalue and normalized eigenvector of the
judgement matrix mentioned before. Finally, we should check out the consistency of each judgement matrix
to decide whether it is acceptable or not. After all these steps, we can identify the weights of KPIs to overall
QoE. However, AHP is lack of flexibility and sometimes even inaccurate as a result of its strong dependency
upon relevant experts. For example, authors in [9] let relevant experts compare KPIs in the QoE model of
Instant Messaging (IM) service, such as server memory consumption, server CPU performance, etc. But on
one hand, it is even difficult and inaccurate for experts to decide which one of those kinds of KPIs has a
larger contribution to KQIs at the upper layer, on the other hand, those KPIs are not perceptible by common
users, which makes the calculated weights less compatible with users’ perception.
Overall QoE
QoE Metric 1 QoE Metric 2 QoE Metric 3
KQI 1 KQI 2 KQI 3 KQI 4 KQI 5 KQI 6
��
KPI 1
KPI 2
KPI 3
KPI 4
KPI 5
KPI 6
KPI 7
KPI 8
KPI 9
KPI 10
KPI 11
KPI 12
��
��
Fig. 1. The general hierarchy for QoE evaluation.
International Journal of Computer and Electrical Engineering
297 Volume 7, Number 5, October 2015

To overcome above problems, in this paper, we only use AHP to identify the weights between perceptible
KQIs, QoE metrics and the overall QoE of live streaming service. For each KQI and its corresponding KPIs,
we propose different objective evaluation algorithms based on subjective quality assessment results. After
all these PSQA process, by using the QoE model and the assessment algorithms, we can get a relatively
accurate real-time overall QoE of live streaming service.
The remainder of this paper is organized as follows. Section 2 presents the QoE mapping model of live
streaming service. And a video quality objective assessment algorithm mainly based on bitrate, temporal
perceptual information (TI) and spatial perceptual information (SI) will be illustrated in Section 3. Then a
network transmission quality evaluation model is proposed in Section 4. Finally, conclusion will be stated in
Section 5.
2. QoE Model
The overall QoE of a service has two direct influencing factors: the service itself and the users [1]. Many
system performance characteristics will affect the QoE of multimedia service, e.g., the codec and the
encoding bitrate used, media resolution in the source and at the display, etc. On the users’ side, influencing
factors includes how much they are paying for the service, what special benefits (mobility, time
independence, exceptionally large program library) the service provides, and so on. We call these consumer
side factors the human components of QoE (QoEu).
We propose that the overall QoE of live streaming service is composed of QoS and QoEu. Then we define a
qualitative model as follows:
QoE = QoS + QoE𝑢 = 𝐾(𝐴 × 𝑤𝑎 + 𝐵 × 𝑤𝑏 + 𝐶 × 𝑤𝑐 + 𝐷 × 𝑤𝑑 + ⋯ ) + QoE𝑢 (1)
where, K stands for the weight of QoS to QoEu, which is decided by the service type. The value of K and QoEu
can be determined simply by subjective methods, e.g., questionnaire survey. A, B, C, D, etc. are influencing
factors of QoS, namely KQIs, and wa, wb, wc, wd, etc. are their corresponding weight.
According to the QoE evaluation model introduced in Section 1, we can list the QoE metrics, KQIs and
KPIs of live streaming service, as shown in Table 1.
Note that we will only discuss the Real Time Messaging Protocol (RTMP) based live streaming service in
this paper. In RTMP, a connection begins with a handshake after DNS query and TCP connection process.
Then a NetConnection and several NetStreams are established between server and client. Finally the audio
and video message will be sent from server to client [10]. We defined the time from handshake to media
message start being sent to client as the RTMP connection delay. Initial Buffer Delay is defined as the time
from having established the RTMP connection to the media start playing on client.
Table 1. The Metrics Of Live Streaming Service QOE Model QoE metrics KQIs(1-5) KPIs(1-12)
Quality of Media (QoM) Video quality
Bitrate Temporal perceptual Information(TI)
Spatial perceptual Information(SI) Audio quality Audio channels
Quality of Network (QoN) Playback continuity
Average buffering time Buffering frequency
AV sync quality Synchronism loss frequency
Average synchronism loss time
Quality of Access (QoA) Access delay
DNS query delay TCP connection Delay
RTMP connection delay Initial buffer delay
International Journal of Computer and Electrical Engineering
298 Volume 7, Number 5, October 2015

Equation (1) indicates that QoE can be understood as the evaluation of QoS from the perspective of users’
perception. So there should be user involvement in the determination of A, B, C, D, etc. and their
corresponding weight. Therefore, we have deliberately chosen those QoE metrics and KQIs which are more
perceptible and readily comprehensible by common consumers. In this way, we can invite more people
rather than just relevant experts to conduct AHP and identify the weights of those KQIs. This modified AHP
for QoE evaluation is more flexible and accurate.
After doing a questionnaire survey in 120 college students asking them to compare metrics at the same
layer of the QoE model in the light of their contribution to an metric on the upper layer and using the AHP
algorithm mentioned in Section 1, finally we get the mapping model between QoS and KQIs as follows
QoS = 0.226KQI1 + 0.052KQI2 + 0.272KQI3 + 0.255KQI4 + 0.195KQI5 (2)
It can be seen from (2) that audio quality has the minimal weight, which means it has the least influence
on the overall QoE. Other KQIs have similar weights, whereas playback continuity has the maximal weight.
Now we need to find the relationship between KQI and their corresponding KPIs. Instead of doing
questionnaire survey again, we will propose different objective evaluation algorithms based on subjective
quality assessment results for each KQI according to its characteristics. Due to the lack of space, here we
will only introduce the evaluation model for the two most important KQIs: video quality and playback
continuity.
3. Video Quality Evaluation Model
We can’t use full-reference objective methods such as Peak Signal to Noise Ratio (PSNR) or Structural
Similarity (SSIM) to evaluate video quality of live streaming service, since we can’t get the source videos. We
also can’t evaluate parameters like blurring or blocking, which is time-wasting. Most researchers tend to
consider bitrate as the main factor while estimating video quality, however, it isn’t suitable for Internet
videos any more. The most important feature of Internet videos is that they can be quite different in
resolutions. In this case, bitrate is no longer an effective parameter. For example, an SD resolution video
with high quality may has the same bitrate as an HD resolution video with poor quality. To overcome above
problems, we propose a video quality evaluation model based on bitrate, TI and SI in this paper.
The definition of TI and SI is as follows [11]:
SI = maxtime{𝑠𝑡𝑑space[Sobel(𝐹𝑛)]} (3)
TI = maxtime{𝑠𝑡𝑑space[𝐹𝑛(𝑖, 𝑗) − 𝐹𝑛−1(𝑖, 𝑗)]} (4)
where, Fn is each video frame (luminance plane) at time n and Fn(i, j) is the pixel at the ith row and jth column
of nth frame in time. Sobel means the Sobel filter and stdspace is a standard deviation over space operation.
We use SI to represent the spatial information content of the scene and TI to describe the motion difference
feature. Generally, those scenes with very minimal spatial detail always have a low SI value and scenes with
very limit motion usually have a low TI value.
To investigate the relationship between bitrate, TI, SI and perception quality, we build a video library
consisting of videos with different resolutions and bitrates. Then we select a full-reference objective
evaluation model which has a good correlation with human eye perception and use this model to find out
the relationship between bitrate, TI, SI and objective quality. After that, we can convert the objective quality
to subjective perceptual quality. In this way, we can get the subjective quality for a huge number of training
samples without wasting time conducting subjective evaluation tests. Finally, we can build a no-reference
International Journal of Computer and Electrical Engineering
299 Volume 7, Number 5, October 2015

objective evaluation model and now we can conduct some subjective evaluation tests to validate the
accuracy of our model.
Here we use the subjective video quality evaluation result from [12] which is based on the IVC database
[13] to convert the average SSIM [14] of our encoded sequences to Mean Opinion Score (MOS). Fig. 2 and (5)
shows the relationship between SSIM and MOS for samples in IVC database.
(5)
Fig. 2. The relationship between the objective SSIM score and MOS for samples in IVC database (the PCC of
all samples achieves 0.9018 and the RMSE is 0.4999).
We select three sequences from the Consumer Digital Video Library [15]. The TI and SI of these
sequences (with a resolution of 1920×1080) are shown in Table 2.
Table 2. The TI and SI of Training Samples Seq NO. TI SI
Seq1 4.553 84.417 Seq2 8.927 39.296 Seq3 11.039 52.996
Then each sequence is encoded into another three resolutions (640×360, 848×480 and 1280×720) and
six bits per pixel (bpp) values (0.025, 0.05, 0.075, 0.1, 0.15 and 0.2). Now we have got 72 sequences in all.
After calculating the SSIM, SSIM-based MOS value, TI and SI of these sequences, we get the result as follows:
(a) (b)
Fig. 3. The SI and TI of all the encoded sequences with different resolutions.
International Journal of Computer and Electrical Engineering
300 Volume 7, Number 5, October 2015
logistic = 0.5 −1
1 + exp (37.37 × (ssim − 0.93))
MOS = 3.27 × logisitc + 1.22 × ssim + 2.14
Fig. 4. The SSIM-based MOS value of all the encoded sequcences with the same resolution of 1920×1080.
Fig. 3(a) shows that SI decreases with increasing resolutions for each sequence. This is because the
number of macro blocks will increase with resolution, and per macro block will have a much lower portion
of the whole picture. Thus the complexity of each macro block is much lower. As a result, macro blocks in
higher resolution videos are more likely to be similar to their surrounding macro blocks, which leads to a
much lower SI. Fig. 3(b) presents that TI increases with resolution for each sequence, which is simply a
result of more pixels in high resolution videos.
Fig. 4 illustrates that different sequences of the same bitrate have different SSIM-based MOS values, which
is obviously a result of different TI and SI. Now the relationship between bitrates, TI, SI and MOS can be
derived by non-linear regression analysis based on the above training samples as follows
MOS = 0.5492 × ln bitrate − 0.9022 × ln TI − 0.4816 × ln SI + 0.1583 (6)
Using (6), we can evaluate the video quality of live streaming service. Equation (6) well reflects the
relationship between KQI1 in (2) and its corresponding KPIs which means we can replace the KQI1 in (2)
with the MOS in (6).
To further verify the accuracy of this assessment algorithm, we conducted a subjective MOS test based on
the videos mentioned before and two other sequences. The configuration of the multimedia system under
test is presented in Table 3.
Table 3. The Configuration of the System under Test Parameter Specification
Type of display PC monitor Display size 22”
Video display card Nvidia GeForce GT420 Manufacturer Lenovo
Model LEN0A0C L2250p Wide LED Monitor Aspect Ratio 16:10
The DSCQS subjective evaluation model was used and 21 viewers with an average age of 22 participated
in the test. We find that the Pearson Correlation Coefficient (PCC) between subjective MOS value and the
QoE score calculated by our algorithm achieves to 0.9069 and the RMSE is about 0.6644, which gives the
evidence that our algorithm can evaluate user’s perception well for video quality of live streaming service.
4. Network Transmission Quality Evaluation Model
Authors in [16] design a QoE measurement framework based on throughput, delay jitter and packet loss.
However, these parameters can’t be directly perceived by end users. Most network transmission problems
International Journal of Computer and Electrical Engineering
301 Volume 7, Number 5, October 2015

lead to buffering during live streaming, and that is what can be directly perceived by end users. In this
section, we will introduce an algorithm to evaluate the network transmission perceptual quality of live
streaming service based on buffering frequency and average buffering time.
First we build a video library for subjective MOS test. To be more close to the real fact, the video
resolution is set to 1280×720 with an fps of 25. Then we make an animation using video editing software to
simulate the buffering in live streaming service and insert it into those prepared videos, as shown in Fig. 5.
The configuration of the sequences under test is presented in Table 4.
Table 4. The Configuration of Sequences under Test Buffering inside the sequence
No. Buffering frequency Average buffering time(s) 1 1,2,4,6,8 1 2 1,2,4,6,8 2 3 1,2,3 4 4 1,2 6 5 1 8 6 1 12
Fig. 5. The animation used to simulate buffering in live streaming service.
Here we select two videos, both of them are of 30 seconds long, one of them is from a TV series, the other
is from a live show. The SS subjective evaluation model was used and the configuration of the multimedia
system is the same as mentioned in Table 3. 51 viewers participated in the test. The results are shown in Fig.
6.
(a) (b)
Fig. 6. (a)The relationship between buffering frequency, average buffering time and MOS for live streaming
service. (b) The fit result of our training samples (the R-square achieves 0.9363 and the RMSE is 0.2075).
International Journal of Computer and Electrical Engineering
302 Volume 7, Number 5, October 2015

We can get the conclusion that MOS will decrease with increasing average buffering time while buffering
frequency is fixed, it will also decrease with increasing buffering frequency while average buffering time is
fixed. Here we propose an equation to evaluate the network transmission quality.
MOS = −0.774 × ln time − 1.102 × ln freq + 4.445 (7)
The freq in (7) represents the buffering frequency in every 30 seconds and time is the average buffering
time in every 30 seconds. Equation (7) well reflects the relationship between KQI3 in (2) and its
corresponding KPIs which means we can replace the KQI3 in (2) with the MOS in (7).
To verify the accuracy of this assessment algorithm, we conducted subjective MOS tests based on three
other videos with different buffering frequency and average buffering time as validation samples. And we
find a PCC of 0.8456 and a RMSE of 0.2934 between subjective MOS value and the QoE score calculated by
(6), which gives the evidence that our assessment algorithm can evaluate user’s perception accurately.
5. Conclusion
In this paper, we use a modified AHP algorithm to build the basic QoE model describing the relationship
between overall QoE, QoE metrics and KQIs of RTMP based live streaming service. Then, for each KQI and
their corresponding KPIs, we propose different objective evaluation algorithms. This paper mainly
discusses how to build the evaluation model for the most important KQIs of live streaming service, which is
video quality and network transmission quality and the performance evaluation of these models has been
verified by plenty of subjective MOS tests. Models for other KQIs can be built in similar ways. One thing to
note here is that for video quality, our algorithm based on bitrate, TI and SI removes the interference of the
unique multi-resolution feature of Internet live streaming videos and has a good correlation with subjective
perception. Finally, we can get the overall QoE by monitoring those easy available KPIs.
Acknowledgment
This work was supported in part by The State Administration of Press, Publication, Radio, Film and
Television of the People's Republic of China (SAPPRFT) under Program NO.2012BAH15B01-0.
References
[1] ITU-T Rec. G.1080. (2012). Quality of Experience Requirements for IPTV Services.
[2] ITU-T Rec. BT.500. (2012). Methodology for the Subjective Assessment of the Quality of Television
Pictures.
[3] ITU-T Rec. BT.1788. (2007). Methodology for the Subjective Assessment of Video Quality in Multimedia
Applications.
[4] Garcia, M., Canovas, A., Edo, M., & Lloret, J. (October 2009). A QoE management system for ubiquitous
IPTV devices. Proceedings of Third International Conference on Mobile Ubiquitous Computing, Systems,
Services and Technologies (pp. 147-152). IEEE.
[5] Kim, H. L., & Choi, S. G. (February 2010). A study on a QoS/QoE correlation model for QoE evaluation on
IPTV service. Proceedings of 2010 the 12th International Conference on Advanced Communication
Technology: Vol. 2 (pp. 1377-1382). IEEE.
[6] Piamrat, K., Viho, C., Bonnin, J. M., & Ksentini, A. (2009, April). Quality of experience measurements for
video streaming over wireless networks. Proceedings of Sixth International Conference on Information
Technology: New Generations (pp. 1184-1189). IEEE.
[7] Agboma, F., & Liotta, A. (2008, November). QoE-aware QoS management. Proceedings of the 6th
International Conference on Advances in Mobile Computing and Multimedia (pp. 111-116). ACM.
International Journal of Computer and Electrical Engineering
303 Volume 7, Number 5, October 2015

[8] Saaty, T. L. (1990). How to make a decision: The analytic hierarchy process. European Journal of
Operational Research, 48(1), 9-26.
[9] Luo, Y., Shou, G., Hu, Y., & Guo, Z. (2012, September). A model for evaluating QoE of mobile Internet
services. Proceedings of 2012 15th International Symposium on Wireless Personal Multimedia
Communications (WPMC) (pp. 438-442). IEEE.
[10] Parmar, H., & Thornburgh, M. (2012). Real-Time Messaging Protocol (RTMP) Specification.
[11] ITU-T Rec. P.910. (2008). Subjective Video Quality Assessment Methods for Multimedia Applications.
[12] Sheikh, H. R., Sabir, M. F., & Bovik, A. C. (2006). A statistical evaluation of recent full reference image
quality assessment algorithms. IEEE Transactions on Image Processing, 15(11), 3440-3451.
[13] Ninassi, A., Le Callet, P., & Autrusseau, F. (2006, February). Pseudo no reference image quality metric
using perceptual data hiding. Proceedings of Electronic Imaging 2006 (pp. 60570G-60570G).
International Society for Optics and Photonics.
[14] Wang, Z., Bovik, A. C., Sheikh, H. R., & Simoncelli, E. P. (2004). Image quality assessment: From error
visibility to structural similarity. IEEE Transactions on Image Processing, 13(4), 600-612.
[15] Pinson, M. (2013). The consumer digital video library [best of the web]. Signal Processing Magazine,
IEEE, 30(4), 172-174.
[16] Hsu, W. H., Yeh, S. C., Shieh, Y. P., & Hsieh, C. H. (December 2013). Web-based QoE measurement
framework. Proceedings of 2013 International Conference on Signal-Image Technology & Internet-Based
Systems (SITIS) (pp. 265-272). IEEE.
Hui Zhang received his bachelor’s degree in broadcasting and television engineering from
Communication University of China (CUC) in 2014. He is currently a master student in the
School of Information and Engineering at CUC. His research interests include multimedia
communications and video quality assessment.
Xiuhua Jiang received her master’s degree in radio electronics from Shandong University
(SDU) in 1982. She is currently a professor with the School of Information and
Engineering at Communication University of China (CUC). Previously, she was the
member of digital television and high definition television standard group at the State
Administration of Press, Publication, Radio, Film and Television of the People's Republic of
China (SAPPRFT). Her research interests include multimedia communications, visual
signal processing, visual perception and video quality assessment.
Xiaohua Lei received his bachelor’s degree in broadcasting and television engineering
and master’s degree in digital television technology from Communication University of
China (CUC) in 2011 and 2014, respectively. He is currently a Ph.D. student in the School
of Information and Engineering at CUC. His research interests include multimedia
communications and visual signal processing.
International Journal of Computer and Electrical Engineering
304 Volume 7, Number 5, October 2015