Embed Size (px)
Citation preview
Int. J. Electrochem. Sci., 10 (2015) 5800 - 5811
International Journal of
ELECTROCHEMICAL SCIENCE
www.electrochemsci.org
Short Communication
A Method for Predicting the Tortuosity of Pore Phase in Solid
Oxide Fuel Cells Electrode
Wei Kong1,*
, Qiang Zhang1, Xiang Gao
1, Jiying Zhang
2, Daifen Chen
1 and Shichuan Su
1
1School of Energy and Power Engineering, Jiangsu University of Science and Technology,212003,
Zhenjiang, Jiangsu, China 2Institute for Interdisciplinary Research, Jianghan University, 430056,Wuhan, Hubei, China
*E-mail: [email protected]
Received: 18 April 2015 / Accepted: 16 May 2015 / Published: 27 May 2015
A novel method is proposed to estimate the tortuosity of the pore phase in solid oxide fuel cells (SOFC)
electrode fabricated by the conventional powder-processed technique. The electrode microstructure is
reconstructed by a 3D cube packing model. Based on the reconstructed structure and the numerical
simulation approach, the tortuosity of the pore phase is obtained. This approach not only overcomes
the complexity, expensiveness and time consumption of the experimental method, but also is more
accurate and efficient compared to 3D sphere packing model. The validity of this approach has been
demonstrated by the good agreement with experiment data. The results conclusively justify that the
tortuosity strongly depend on the porosity, which should not be treated as an adjustable or empirical
parameter. This study provides an accurate and efficient approach for the prediction of the tortuosity.
Keywords: Solid oxide fuel cells; Electrode; Porous media; Tortuosity; Gas transport; The effective
gas diffusion coefficient;
1. INTRODUCTION
Traditional thermal power, which is based on the combustion of fossil fuels, only provides a
limited efficiency of Carnot cycle and gives rise to the gaseous pollutants. Thus, there is an urgent
need for a completely new way of electricity generation. Due to the high conversion efficiency and low
pollutants emission, SOFCs are considered as one of the most ideal electricity generation devices [1-
4].
The typical SOFC consist of a three layers sandwich structure of anode, electrolyte and
cathode, wherein the anode and cathode are both porous, while the electrolyte is dense. Duo to the very
thin electrolyte layer and the accompanying lower operating temperature, the electrode-supported
SOFC has been considered as the most promising type of SOFC[5, 6]. However, a thick electrode
Int. J. Electrochem. Sci., Vol. 10, 2015
5801
blocks the transportation of reactant gas and product gas, which causes great polarization on the
electrode side of electrode-supported SOFC[6-9]. Therefore, an in-depth study about the effective gas
diffusion coefficient effD in the porous electrode is of great significance to reduce this kind of
polarization, and improve the cell performance.
In some literatures, the parallel-capillary model, which takes the pore phase as parallel-
capillary bundle, is widely adopted to evaluate the effective gas diffusion coefficient effD , which can
be written as[10, 11]:
2
0
effD
D (1)
where 0D is the intrinsic diffusion coefficient, represents the electrode porosity, denotes
the tortuosity used to describe the tortuous gas transport paths, which is the ratio of the length along
the average effective path ( effL ) to the shortest straight distance along the diffusion direction ( 0L ), as
described in Fig. 1.
eff
0
L
L (2)
Figure 1. The definition of the tortuosity.
Obviously, the effective gas diffusion coefficient effD strongly relies on the tortuosity. As a
result, the accurate evaluation of the tortuosity is of great significance. However, although the parallel-
capillary model is widely employed, how to calculate tortuosity is not given in the parallel-capillary
model.
For 2 0.5 , Eq. (1) becomes the well-known Bruggeman equation:

Int. J. Electrochem. Sci., Vol. 10, 2015
5802
1.5
0
effD
D (3)
Although the Bruggeman model is valid for 0.6 , which has been experimentally proved,
the tortuosity estimated by Bruggeman model is much lower than the experimental data for 0.5 , as
shown in Fig.2. Because the SOFC electrode porosity is generally lower than 0.5, it is not appropriate
to use Bruggeman model in the prediction of the tortuosity of the pore phase in SOFC electrode.
There are two main approaches to investigate the tortuosity of the pore phase in SOFC
electrode. For the experimental method, focused ion beam combined scanning electron microscopy
(FIB-SEM) method and the X-ray tomography technique have been widely employed to acquire the
real microstructure of the electrode[12-14]. Combined the reconstructed electrode microstructure with
some algorithms, such as random walk approach, Monte Carlo method and finite element method, the
tortuosity can be obtained. Although experimental method can obtain reliable data and provide
valuable information, it relies on specific practical electrode and high-tech equipment which is time-
consuming and expensive for the systematic and serial study[15].
Figure 2. The tortuosity estimated by different approaches. The open circle symbols denotes
experiment results [21-27]; Line + solid triangle symbols denotes the results calculated by the
Bruggeman model; Line + solid square symbols denotes the results calculated by the random
packing sphere model [16].
Therefore, the tortuosity is given for one to three different porosities in a specific experiment
mostly. For numerical method, the 3D sphere packing model[16-18] is widely adopted to simulate the
microstructure of the electrode, which is a validated approach to predict the properties of electrode
such as three phase boundaries, effective conductivity, hydraulic radius and so on. However, compared
Int. J. Electrochem. Sci., Vol. 10, 2015
5803
with the experimental data, the 3D sphere packing model significantly underestimates the tortuosity
value, as shown in Fig. 2. This may be explained by comparing the real electrode microstructure with
the 3D sphere packing model. Because the contact angle between spheres in the 3D sphere packing
model is often set as 30°, there is much more room around the surface of sphere for gas to transport,
which leads to that transport path is not as tortuous as the real situation. Furthermore, the discretization
of the geometry structure reconstructed by these two methods is a vast challenge because of the many
irregular curved surfaces existing in the geometry structure [19, 20].
In the SOFC studies, due to the lack of the accurate approach, the tortuosity is usually used as
an adjustable parameter to matching with the cell performance or an empirical parameter [28, 29],
which is certainly not appropriate. What’s more, the tortuosity values used in the literatures vary
significantly from each other. He et al.[30] used a tortuosity of 4.7 to account for the experimental
data. While based on the measure of the saturation current densities, the tortuosity factor on the anode
side is estimated to be 1.55 [10]. Therefore, the appropriate method must be developed to accurately
calculate the tortuosity.
Owing to the different preparation techniques of electrode, the pore morphologies vary
dramatically. For example, the vertical pores are generated in electrode by using the pulsed laser
deposition technique[31]. It is evident that the tortuosity is uniform. However, the random distribution
of pores in electrode can be realized via the conventional powder-processed technique [32-35] . For
this case, the prediction of the tortuosity of pore phase is a challenge work. So in this paper, the main
efforts are devoted to develop a novel methodology to estimate the tortuosity of the pore phase in
electrode fabricated by the conventional powder-processed technique.
Within this paper, Sec. 2 proposes the novel numerical method to calculate the tortuosity. In
Sec. 3 the grid independence and the computational domain size are verified and the tortuosity for
different porosity is obtained. The general conclusions are included in Sec. 4.
2. THE CALCULATION OF THE TORTUOSITY
The calculation of the tortuosity is carried out by two steps.
The first step is to reconstruct the geometric microstructure of the SOFC electrode. Due to the
pores random distribution in electrode, the packing of particles may be an effective method to
reconstruct the microstructure of electrode. However, it is difficult to predetermine what particle shape
is appropriate. Because, On the one hand, the real pores in the electrode are irregular and complex. On
the other hand, the shape of the particle definitely has a significant influence on the pore phase
tortuosity. Fig. 2 shows that the 3D sphere packing model significantly underestimates the tortuosity
value, which implies the sphere is an unreasonable approximation. Instead of spheres, cubes are
employed in this study to reconstruct the electrode microstructure, which can be defined as the 3D
cube packing model. The excellent agreement between the 3D cube packing model result and the
experimental data in Sec.3 will testify that the cube is an appropriate choice. Furthermore, using cubes
will significantly simplify the model and improve the calculation efficiency, which is benefit to handle
the large computational domain.
Int. J. Electrochem. Sci., Vol. 10, 2015
5804
The second step is to numerically model the diffusion progress in the reconstructed electrode
and obtain the tortuosity [21, 23, 25, 26].
2.1 The 3D cube packing model
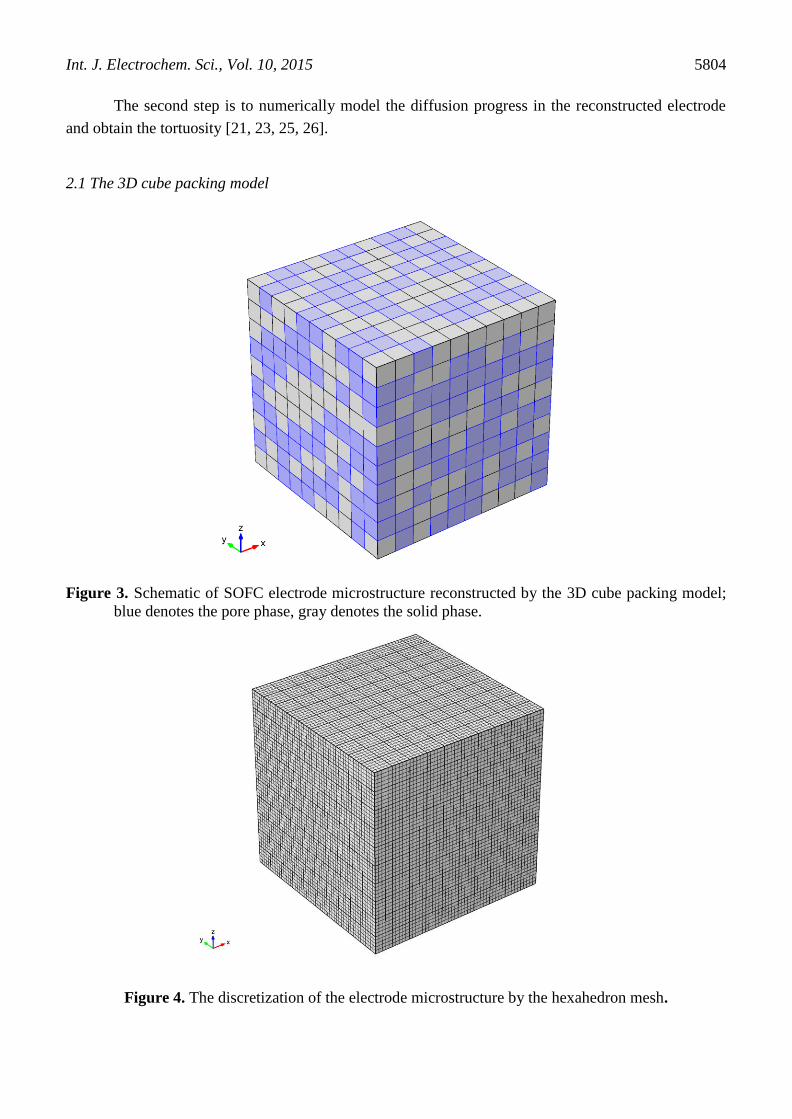
Figure 3. Schematic of SOFC electrode microstructure reconstructed by the 3D cube packing model;
blue denotes the pore phase, gray denotes the solid phase.
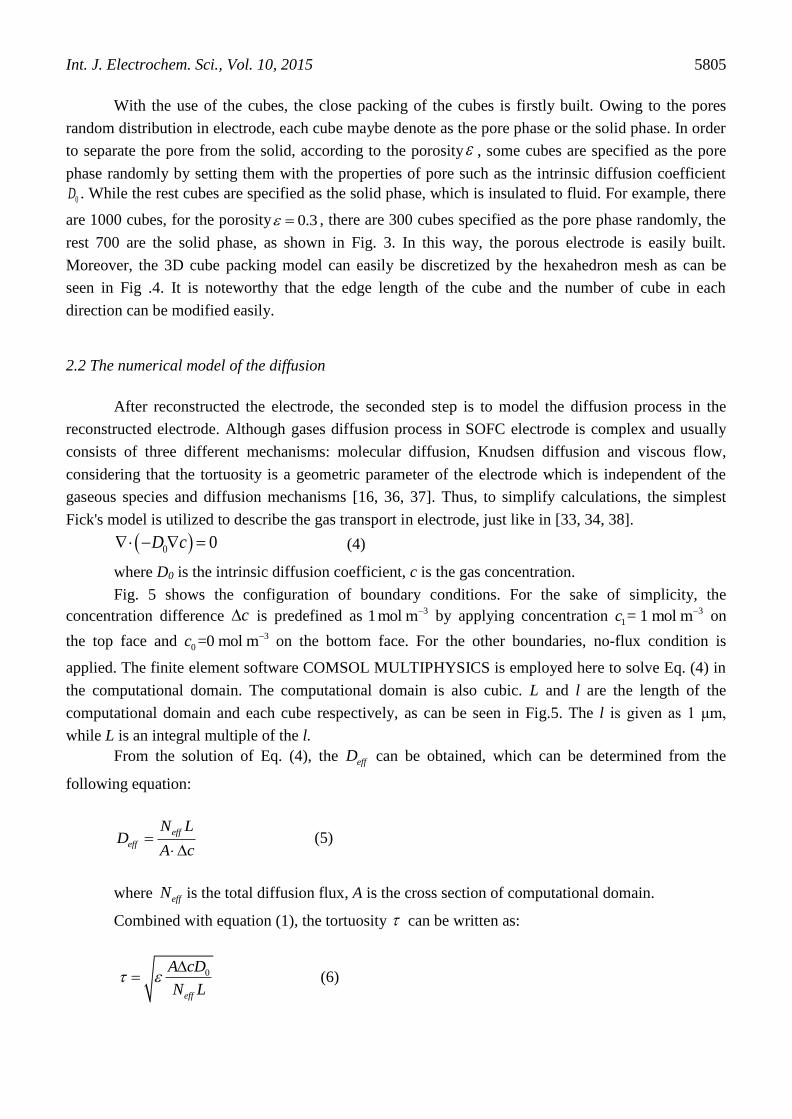
Figure 4. The discretization of the electrode microstructure by the hexahedron mesh.
Int. J. Electrochem. Sci., Vol. 10, 2015
5805
With the use of the cubes, the close packing of the cubes is firstly built. Owing to the pores
random distribution in electrode, each cube maybe denote as the pore phase or the solid phase. In order
to separate the pore from the solid, according to the porosity , some cubes are specified as the pore
phase randomly by setting them with the properties of pore such as the intrinsic diffusion coefficient
0D . While the rest cubes are specified as the solid phase, which is insulated to fluid. For example, there
are 1000 cubes, for the porosity 0.3 , there are 300 cubes specified as the pore phase randomly, the
rest 700 are the solid phase, as shown in Fig. 3. In this way, the porous electrode is easily built.
Moreover, the 3D cube packing model can easily be discretized by the hexahedron mesh as can be
seen in Fig .4. It is noteworthy that the edge length of the cube and the number of cube in each
direction can be modified easily.
2.2 The numerical model of the diffusion
After reconstructed the electrode, the seconded step is to model the diffusion process in the
reconstructed electrode. Although gases diffusion process in SOFC electrode is complex and usually
consists of three different mechanisms: molecular diffusion, Knudsen diffusion and viscous flow,
considering that the tortuosity is a geometric parameter of the electrode which is independent of the
gaseous species and diffusion mechanisms [16, 36, 37]. Thus, to simplify calculations, the simplest
Fick's model is utilized to describe the gas transport in electrode, just like in [33, 34, 38].
0 0 D c (4)
where D0 is the intrinsic diffusion coefficient, c is the gas concentration.
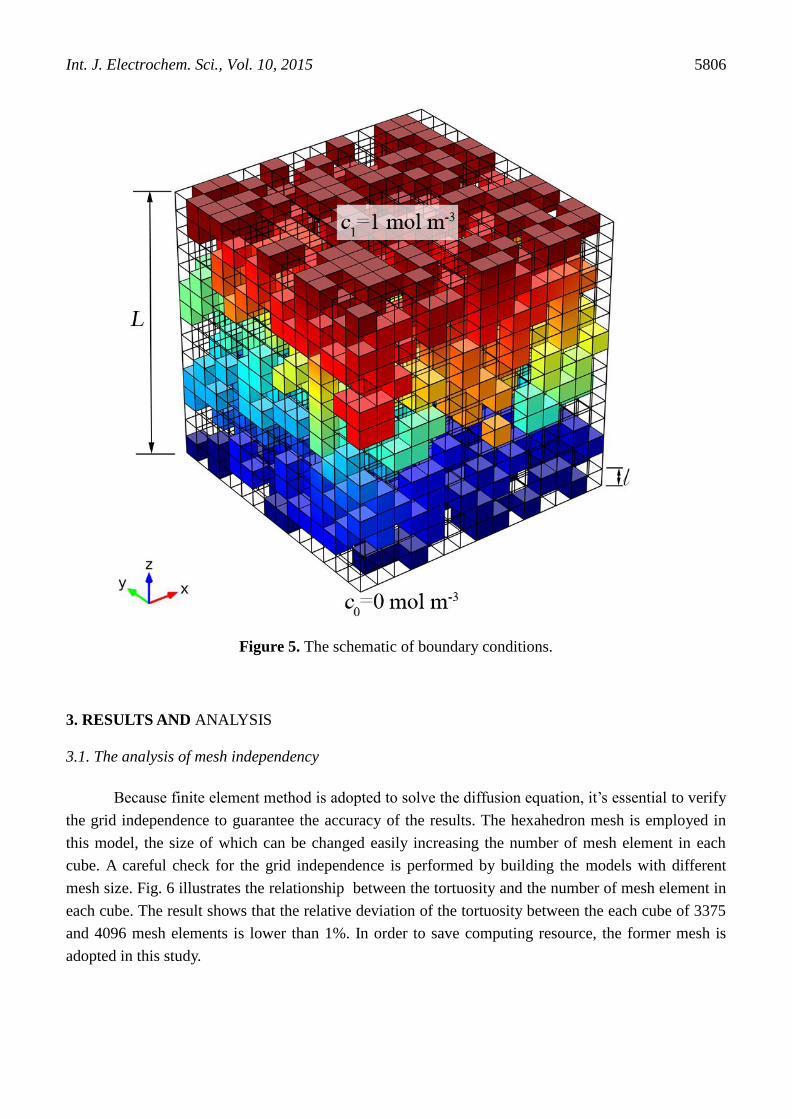
Fig. 5 shows the configuration of boundary conditions. For the sake of simplicity, the
concentration difference c is predefined as 31mol m by applying concentration 3
1= 1 mol mc on
the top face and 3
0 =0 mol mc on the bottom face. For the other boundaries, no-flux condition is
applied. The finite element software COMSOL MULTIPHYSICS is employed here to solve Eq. (4) in
the computational domain. The computational domain is also cubic. L and l are the length of the
computational domain and each cube respectively, as can be seen in Fig.5. The l is given as 1 μm,
while L is an integral multiple of the l.
From the solution of Eq. (4), the effD can be obtained, which can be determined from the
following equation:
eff
eff
N LD
A c (5)
where effN is the total diffusion flux, A is the cross section of computational domain.
Combined with equation (1), the tortuosity can be written as:
0
eff
A cD
N L
(6)
Int. J. Electrochem. Sci., Vol. 10, 2015
5806
Figure 5. The schematic of boundary conditions.
3. RESULTS AND ANALYSIS
3.1. The analysis of mesh independency
Because finite element method is adopted to solve the diffusion equation, it’s essential to verify
the grid independence to guarantee the accuracy of the results. The hexahedron mesh is employed in
this model, the size of which can be changed easily increasing the number of mesh element in each
cube. A careful check for the grid independence is performed by building the models with different
mesh size. Fig. 6 illustrates the relationship between the tortuosity and the number of mesh element in
each cube. The result shows that the relative deviation of the tortuosity between the each cube of 3375
and 4096 mesh elements is lower than 1%. In order to save computing resource, the former mesh is
adopted in this study.
Int. J. Electrochem. Sci., Vol. 10, 2015
5807
Figure 6. The validation of mesh independency. One-percent error bars are added.
3.2. Effect of the domain size
Figure 7. The domain size as a function of the tortuosity. One-percent error bars are added.
Before calculating the tortuosity of the pore phase in electrode, the computational domain size
must be determined. Because the tortuosity should be independent of the computational domain size,
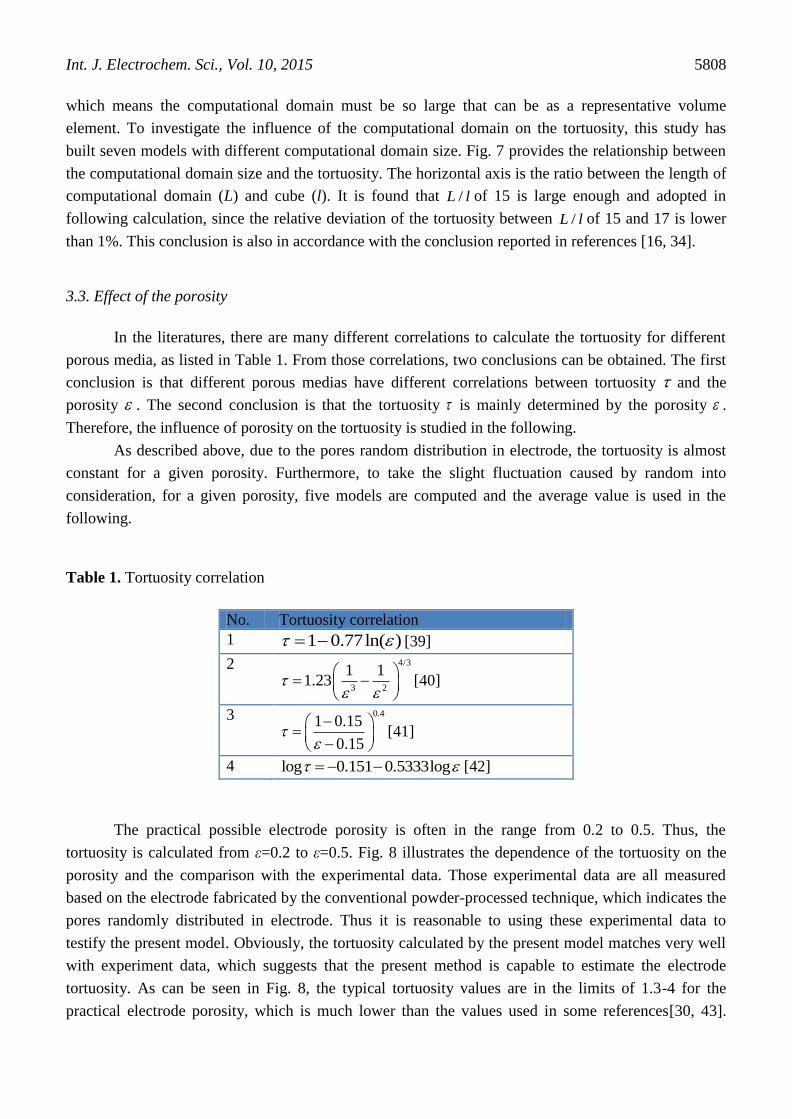
Int. J. Electrochem. Sci., Vol. 10, 2015
5808
which means the computational domain must be so large that can be as a representative volume
element. To investigate the influence of the computational domain on the tortuosity, this study has
built seven models with different computational domain size. Fig. 7 provides the relationship between
the computational domain size and the tortuosity. The horizontal axis is the ratio between the length of
computational domain (L) and cube (l). It is found that /L l of 15 is large enough and adopted in
following calculation, since the relative deviation of the tortuosity between /L l of 15 and 17 is lower
than 1%. This conclusion is also in accordance with the conclusion reported in references [16, 34].
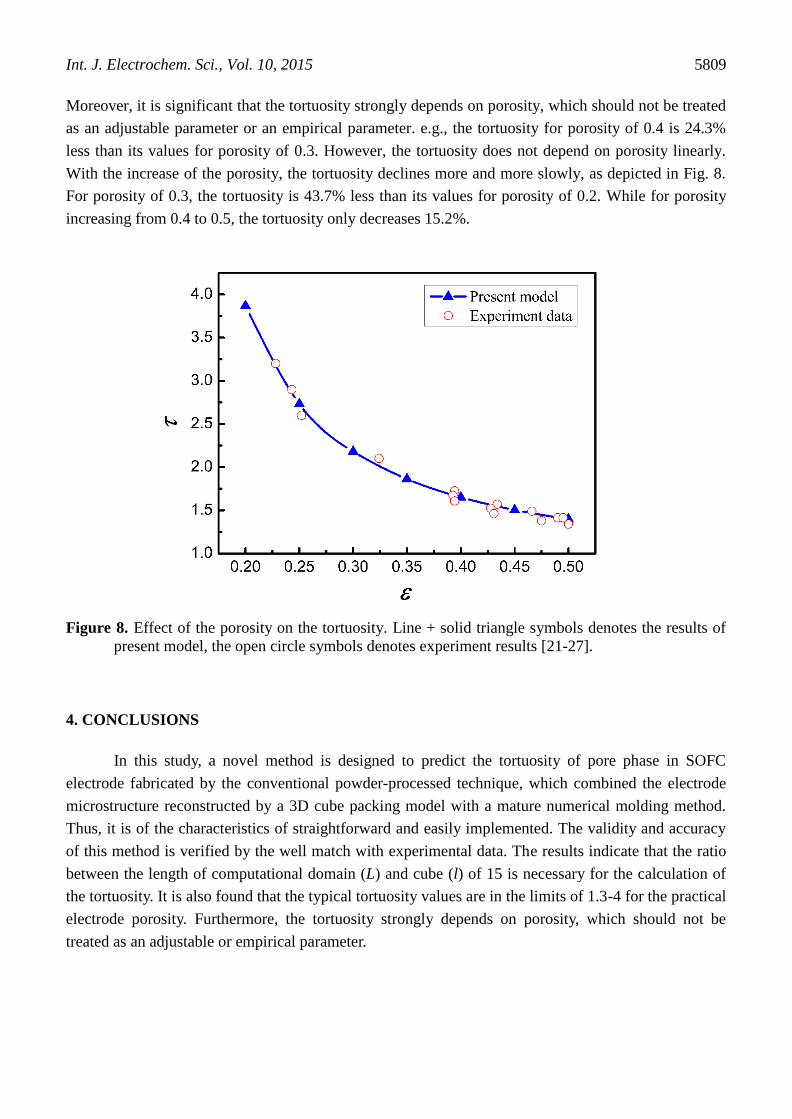
3.3. Effect of the porosity
In the literatures, there are many different correlations to calculate the tortuosity for different
porous media, as listed in Table 1. From those correlations, two conclusions can be obtained. The first
conclusion is that different porous medias have different correlations between tortuosity and the
porosity . The second conclusion is that the tortuosity is mainly determined by the porosity .
Therefore, the influence of porosity on the tortuosity is studied in the following.
As described above, due to the pores random distribution in electrode, the tortuosity is almost
constant for a given porosity. Furthermore, to take the slight fluctuation caused by random into
consideration, for a given porosity, five models are computed and the average value is used in the
following.
Table 1. Tortuosity correlation
No. Tortuosity correlation
1 1 0.77ln( ) [39]
2 4/3
3 2
1 11.23
[40]
3 0.41 0.15
0.15
[41]
4 log 0.151 0.5333log [42]
The practical possible electrode porosity is often in the range from 0.2 to 0.5. Thus, the
tortuosity is calculated from ε=0.2 to ε=0.5. Fig. 8 illustrates the dependence of the tortuosity on the
porosity and the comparison with the experimental data. Those experimental data are all measured
based on the electrode fabricated by the conventional powder-processed technique, which indicates the
pores randomly distributed in electrode. Thus it is reasonable to using these experimental data to
testify the present model. Obviously, the tortuosity calculated by the present model matches very well
with experiment data, which suggests that the present method is capable to estimate the electrode
tortuosity. As can be seen in Fig. 8, the typical tortuosity values are in the limits of 1.3-4 for the
practical electrode porosity, which is much lower than the values used in some references[30, 43].
Int. J. Electrochem. Sci., Vol. 10, 2015
5809
Moreover, it is significant that the tortuosity strongly depends on porosity, which should not be treated
as an adjustable parameter or an empirical parameter. e.g., the tortuosity for porosity of 0.4 is 24.3%
less than its values for porosity of 0.3. However, the tortuosity does not depend on porosity linearly.
With the increase of the porosity, the tortuosity declines more and more slowly, as depicted in Fig. 8.
For porosity of 0.3, the tortuosity is 43.7% less than its values for porosity of 0.2. While for porosity
increasing from 0.4 to 0.5, the tortuosity only decreases 15.2%.
Figure 8. Effect of the porosity on the tortuosity. Line + solid triangle symbols denotes the results of
present model, the open circle symbols denotes experiment results [21-27].
4. CONCLUSIONS
In this study, a novel method is designed to predict the tortuosity of pore phase in SOFC
electrode fabricated by the conventional powder-processed technique, which combined the electrode
microstructure reconstructed by a 3D cube packing model with a mature numerical molding method.
Thus, it is of the characteristics of straightforward and easily implemented. The validity and accuracy
of this method is verified by the well match with experimental data. The results indicate that the ratio
between the length of computational domain (L) and cube (l) of 15 is necessary for the calculation of
the tortuosity. It is also found that the typical tortuosity values are in the limits of 1.3-4 for the practical
electrode porosity. Furthermore, the tortuosity strongly depends on porosity, which should not be
treated as an adjustable or empirical parameter.
Int. J. Electrochem. Sci., Vol. 10, 2015
5810
ACKNOWLEDGEMENTS
We gratefully acknowledge the financial support of the National Science Foundation of China
(21406095 and 21106058), the Jiangsu Province Colleges and Universities Natural Science Projects
(13KJB480003) and the Jiangsu University of Science and Technology (35321101).
References
1. M. Andersson, J. Yuan and B. Sundén, J. Electrochem. Soc., 160 (2013) F1
2. S. Su, H. He, D. Chen, W. Zhu, Y. Wu, W. Kong, B. Wang and L. Lu, Int. J. Hydrogen Energy, 40
(2015) 577
3. F. Miao, Int. J. Electrochem. Sci., 8 (2013) 11814
4. L. W. Chen, S. H. Gao and H. C. Zhang, Int. J. Electrochem. Sci., 8 (2013) 10772
5. S. Su, X. Gao, Q. Zhang, W. Kong and D. Chen, Int. J. Electrochem. Sci, 10 (2015) 2487
6. S. Q. Yang, T. Chen, Y. Wang, Z. B. Peng and W. G. Wang, Int. J. Electrochem. Sci., 8 (2013) 2330
7. W. He, X. Lin, J. H. Dickerson and J. B. Goodenough, Nano Energy, 2 (2013) 1004
8. L. A. Chick, K. D. Meinhardt, S. P. Simner, B. W. Kirby, M. R. Powell and N. L. Canfield, J.
Power Sources, 196 (2011) 4475
9. G. Wang, H. Li, Y. Xu, L. Xu and L. Zhang, Int. J. Electrochem. Sci., 8 (2013) 6579
10. C.-L. Tsai and V. H. Schmidt, J. Power Sources, 196 (2011) 692
11. N. Epstein, Chem. Eng. Sci., 44 (1989) 777
12. P. Möller, R. Kanarbik, I. Kivi, G. Nurk and E. Lust, J. Electrochem. Soc., 160 (2013) F1245
13. M. Kishimoto, H. Iwai, M. Saito and H. Yoshida, J. Electrochem. Soc., 159 (2012) B315
14. K. Yakal-Kremski, L. V. Mogni, A. Montenegro-Hernández, A. Caneiro and S. A. Barnett, J.
Electrochem. Soc., 161 (2014) F1366
15. A. Cecen, E. Wargo, A. Hanna, D. Turner, S. Kalidindi and E. Kumbur, J. Electrochem. Soc., 159
(2012) B299
16. A. Bertei, B. Nucci and C. Nicolella, Chem Eng Sci, 101 (2013) 175
17. A. Berson, H.-W. Choi and J. G. Pharoah, Phys.Rev.E, 83 (2011)
18. B. Kenney, M. Valdmanis, C. Baker, J. G. Pharoah and K. Karan, J. Power Sources, 189 (2009)
1051
19. J. Sanyal, G. M. Goldin, H. Zhu and R. J. Kee, J. Power Sources, 195 (2010) 6671
20. J. Joos, T. Carraro, A. Weber and E. Ivers-Tiffee, J. Power Sources, 196 (2011) 7302
21. F. Usseglio-Viretta, J. Laurencin, G. Delette, J. Villanova, P. Cloetens and D. Leguillon, J. Power
Sources, 256 (2014) 394
22. H. Iwai, N. Shikazono, T. Matsui, H. Teshima, M. Kishimoto, R. Kishida, D. Hayashi, K.
Matsuzaki, D. Kanno, M. Saito, H. Muroyama, K. Eguchi, N. Kasagi and H. Yoshida, J. Power
Sources, 195 (2010) 955
23. N. S. K. Gunda, H.-W. Choi, A. Berson, B. Kenney, K. Karan, J. G. Pharoah and S. K. Mitra, J.
Power Sources, 196 (2011) 3592
24. M. Kishimoto, H. Iwai, M. Saito and H. Yoshida, J. Power Sources, 196 (2011) 4555
25. E. A. Wargo, T. Kotaka, Y. Tabuchi and E. C. Kumbur, J. Power Sources, 241 (2013) 608
26. J. R. Wilson, J. S. Cronin, A. T. Duong, S. Rukes, H.-Y. Chen, K. Thornton, D. R. Mumm and S.
Barnett, J. Power Sources, 195 (2010) 1829
27. D. Gostovic, J. Smith, D. Kundinger, K. Jones and E. Wachsman, Electrochem. Solid-State Lett., 10
(2007) B214
28. K. J. Yoon, S. Gopalan and U. B. Pal, J. Electrochem. Soc., 156 (2009) B311
29. W. Kong, H. Zhu, Z. Fei and Z. Lin, J. Power Sources, 206 (2012) 171
30. H. Weidong, Y. Kyung Joong, R. S. Eriksen, S. Gopalan, S. N. Basu and U. B. Pal, J. Power
Sources, (2010) 532

Int. J. Electrochem. Sci., Vol. 10, 2015
5811
31. J. Yoon, R. Araujo, N. Grunbaum, L. Baqué, A. Serquis, A. Caneiro, X. Zhang and H. Wang, Appl.
Surf. Sci., 254 (2007) 266
32. L. Gan, Q. Zhong, Y. Song, L. Li and X. Zhao, J. Alloys Compd., 628 (2015) 390
33. J. Joos, T. Carraro, A. Weber and E. Ivers-Tiffée, J. Power Sources, 196 (2011) 7302
34. J. Laurencin, R. Quey, G. Delette, H. Suhonen, P. Cloetens and P. Bleuet, J. Power Sources, 198
(2012) 182
35. M. Kang, J. Fang, S. Li, T. Liu, C. Wang and L. Tan, Int. J. Electrochem. Sci., 8 (2013) 12757
36. J. M. Zalc, S. C. Reyes and E. Iglesia, Chem. Eng. Sci., 59 (2004) 2947
37. A. Berson, H. W. Choi and J. G. Pharoah, Phys.Rev.E, 83 (2011) 12
38. Y. Zhang, C. Xia and M. Ni, Int. J. Hydrogen Energy, 37 (2012) 3392
39. M. Matyka, A. Khalili and Z. Koza, Phys.Rev.E, 78 (2008)
40. P. Y. Lanfrey, Z. V. Kuzeljevic and M. P. Dudukovic, Chem. Eng. Sci., 65 (2010) 1891
41. V. I. Nikitsin and B. Backiel-Brzozowska, Int. J. Heat Mass Transfer, 56 (2013) 30
42. P. W. Li and M. K. Chyu, J. Power Sources, 124 (2003) 487
43. J. W. Kim, A. V. Virkar, K. Z. Fung, K. Mehta and S. C. Singhal, J Electrochem Soc, 146 (1999) 69
© 2015 The Authors. Published by ESG (www.electrochemsci.org). This article is an open access
article distributed under the terms and conditions of the Creative Commons Attribution license
(http://creativecommons.org/licenses/by/4.0/).