Embed Size (px)
Citation preview
I. CHEM. E. SYMPOSIUM SERIES NO. 58
A METHOD OF MEASURING THE CONCENTRATION OF FLAMMABLE GASES, MISTS AND VAPOURS
T J Snee*
Many industrial processes may give r i se to flammable concentrations of mists or hot vapours which cannot be measured using conventional explosimeters. Even with gases, uncertainty as to the chemical composition of the fuel may make it difficult to a ssess the fire and explosion hazard. A new type of instrument is described that measures the concentration of a gas, mis t or vapour in te rms of the stoichiometric fuel concentration, giving a direct indication of flammability which is approximately independent of the chemical composition of the fuel. Details a re given of validation experiments, and the sensitivity and accuracy of the device a re discussed with particular reference to sampling of aerosols and to sampling in oxygen deficient atmospheres.
INTRODUCTION
Conventional explosimeters give low readings for those gases, vapours and mists that condense out before reaching the sensing element, and variations in the diffusivity of different fuels make it necessary to recalibrate or apply correction factors according to the chemical composition of the fuel, Fir th et al (1). This paper is concerned with the development of an explosimeter that is sensitive to gases, mists and vapours and which produces a reading of explosibility approximately independent of the chemical composition of the fuel being sampled. The operation of the device is based on the fact that, at any specified temperature, the ratio of the fuel concentration at the lower explosive limit to the fuel concentration needed for complete combustion is , to a first approximation and for most fuels, independent of the nature of the fuel. Thus, the ratio of a fuel concentration to its stoichiometric fuel concentration gives a measure of the explosibility of a fuel-air mixture. This ratio is determined by drawing in a fixed volume of sample mixture and measuring the volume of oxygen required for complete oxidation of the fuel. The limitations on the use of the device will be largely those imposed by the difficulties of sampling aerosols that contain large particles and move at high speed.
METHOD
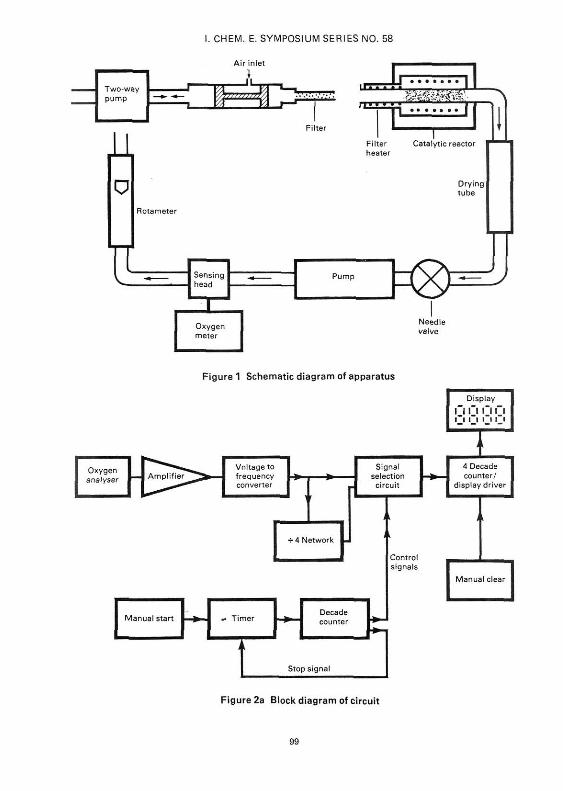
The prototype apparatus is illustrated in Figure 1. The portable sampling device has a two-way pump which controls the movement of a piston so as to draw in a fixed volume of sample through a filter. Fuel mist droplets and condensed vapour a re
* Health and Safety Executive, Research and Laboratory Services Division, Harpur Hill, Buxton, Derbyshire.
89

I. CHEM. E. SYMPOSIUM SERIES NO. 58
retained on the filter and gaseous fuel is held in the piston chamber. A second sampling system has been developed in which a separate manually operated piston is used to draw in the fixed volume of gas which is held in a reservoir adjacent to the filter. The piston can be operated in a region remote from the atmosphere being sampled by separating the piston from the reservoir and filter by a tube of any desired length. The sample is removed to a safe environment and the filter is inserted into the filter heater. The fixed volume of sample is drawn into the catalytic reactor and the filter is heated so as to vaporise the liquid fuel on the filter into the reactor. Additional a i r is drawn in to sweep the fuel sample into the reactor. The drop in oxygen concentration caused by the catalytic oxidation of the fuel sample is measured downstream of the reactor. With a constant flow-rate of gas through the apparatus, the integral of the signal from the oxygen analyser gives the total volume of oxygen consumed.
APPARATUS
The catalytic reactor consists of a stainless steel tube 150 mm long with an internal diameter of 6 mm containing a platinised alumina catalyst supported on rock wool. The tube can be heated to 600°G by an externally wound nickel-chrome wire heating element. The filter from the sampling device fits into the front end of the reactor tube and is heated to about 300 C by a separate heater winding. This means that the instrument is sensitive to fuels with boiling points up to and a little above this temperature. The filter consists of a steel tube 70 mm long with an external diameter of 6 mm containing compacted steel wool. The oxygen analyser is based on a polarographic sensor giving good stability and linearity over a wide range of partial pressure , Bergman and Windle (2).
In the prototype device a sample volume of 25 ml is drawn in at a rate of approximately 75 ml/min. The integration takes place over 2. 5 min at a flow-rate of 220 ml/min.
The sampling can be carr ied out using either a battery-powered pump or a manually operated piston. The measuring device, which must be used in a safe area, is powered from mains electricity so there a re no severe limitations on the power consumption of the components used. The power requirement of the prototype, 150 W, could probably be reduced sufficiently to enable operation from a ca r battery.
INTEGRATION
The integration is carr ied out electronically by first converting the voltage signal from the oxygen analyser to a frequency proportional to the voltage and then counting the number of oscillations. Thus a drop in oxygen concentration causes a proportionate reduction in frequency which causes a reduction in the total count in a given length of time. The drop in the count is therefore proportional to the drop in the oxygen concentration and the length of time for which this drop is sustained. If the flow rate of gas is kept constant, the drop in the count is proportional to the total volume of oxygen consumed.
90
I. CHEM. E. SYMPOSIUM SERIES NO. 58
BASELINE COMPENSATION
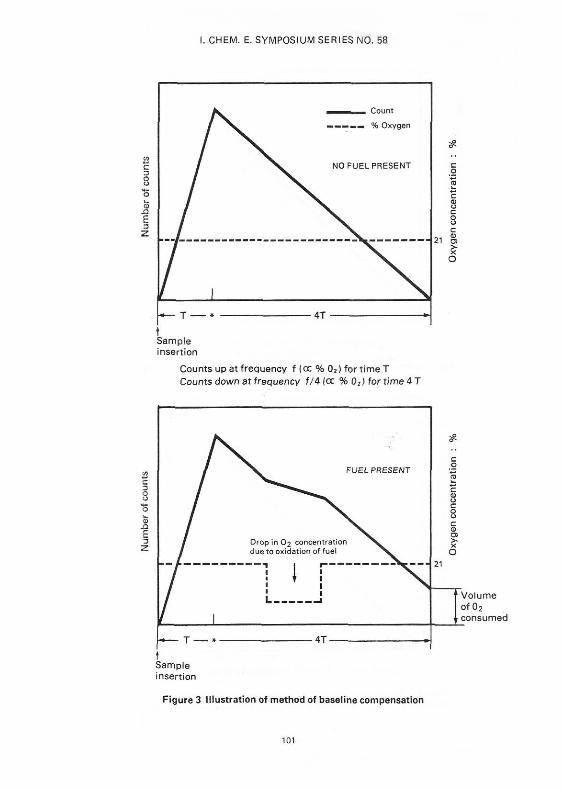
In order to measure the volume of oxygen consumed it is necessary to subtract the amount of oxygen that has passed through the apparatus during the integration period from the amount that would have passed through if no oxidation had taken place. In an industrial environment the ambient oxygen concentration at the measuring device could be significantly below the normal 21% and this could cause a large e r r o r in the integrated reading. In addition, any e r ro r in the initial adjustment of the oxygen analyser would be integrated and cause a large e r ro r in the final reading. These problems have been overcome electronically by measuring the baseline reading from the oxygen analyser during the time before the products of combustion can reach the sensing head of the oxygen analyser and only ambient air is flowing past. The integrated reading that would be obtained if this baseline remained unchanged is projected and compared with the integrated reading obtained after the products of combustion have passed the sampling head. The effect on the integrated reading of oxygen deficiency in the atmosphere being sampled is discussed later.
CIRCUIT FUNCTION
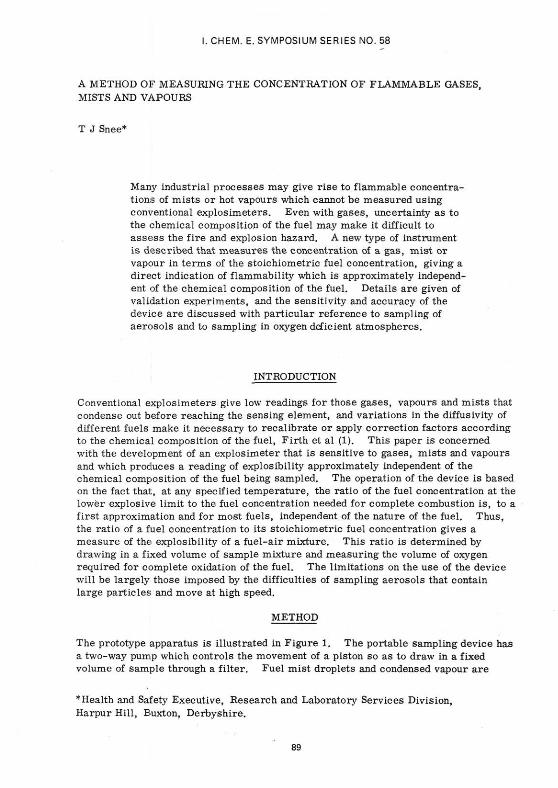
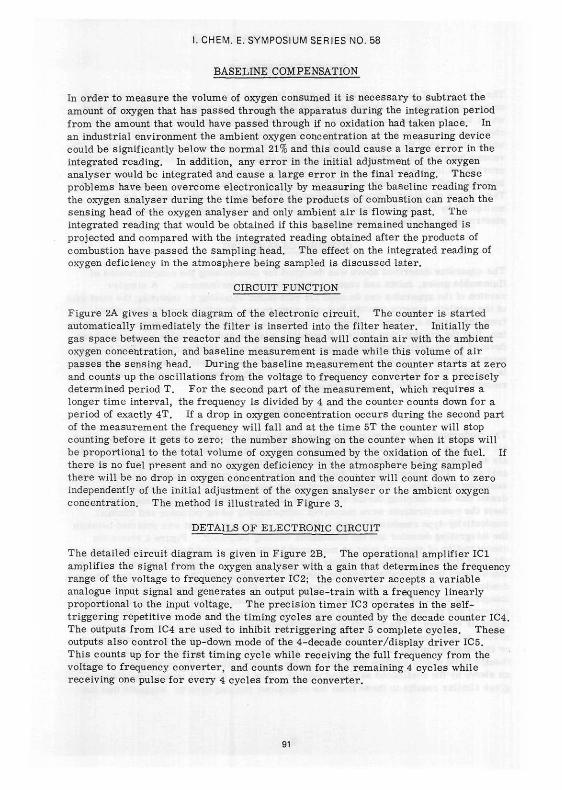
Figure 2A gives a block diagram of the electronic circuit. The counter is started automatically immediately the filter is inserted into the filter heater. Initially the gas space between the reactor and the sensing head will contain a i r with the ambient oxygen concentration, and baseline measurement is made while this volume of air passes the sensing head. During the baseline measurement the counter s tar ts at zero and counts up the oscillations from the voltage to frequency converter for a precisely determined period T. For the second part of the measurement, which requires a longer time interval, the frequency is divided by 4 and the counter counts down for a period of exactly 4T. If a drop in oxygen concentration occurs during the second part of the measurement the frequency will fall and at the t ime 5T the counter will stop counting before it gets to zero; the number showing on the counter when it stops will be proportional to the total volume of oxygen consumed by the oxidation of the fuel. If there is no fuel present and no oxygen deficiency in the atmosphere being sampled there will be no drop in oxygen concentration and the counter will count down to zero independently of the initial adjustment of the oxygen analyser or the ambient oxygen concentration. The method is illustrated in Figure 3.
DETAILS OF ELECTRONIC CIRCUIT
The detailed circuit diagram is given in Figure 2B. The operational amplifier IC1 amplifies the signal from the oxygen analyser with a gain that determines the frequency range of the voltage to frequency converter IC2; the converter accepts a variable analogue input signal and generates an output pulse-train with a frequency linearly proportional to the input voltage. The precision t imer IC3 operates in the self-triggering repetitive mode and the timing cycles a re counted by the decade counter IC4. The outputs from IC4 are used to inhibit retriggering after 5 complete cycles. These outputs also control the up-down mode of the 4-decade counter/display driver IC5. This counts up for the first timing cycle while receiving the full frequency from the voltage to frequency converter, and counts down for the remaining 4 cycles while receiving one pulse for every 4 cycles from the converter.
91

I. CHEM. E. SYMPOSIUM SERIES NO. 58
FLOW MEASUREMENT
The flow-rate of gas through the apparatus is set to a standard value and measured using a rotameter. A second method of flow-rate measurement is being developed which involves measuring the time interval between sample insertion and the first change in the oxygen meter reading. Sample insertion automatically s ta r t s a t imer which stops when the differentiated oxygen meter signal exceeds a pre-se t level. The volume between the inlet port and the oxygen analyser sampling head is fixed, so that, provided at least some fuel is oxidised soon after sample insertion, the time between insertion and the detection of a change in oxygen concentration gives the gas flow-rate. The volume of oxygen consumed is given by the integrated oxygen meter reading multiplied by the gas flow rate; methods of carrying out this multiplication electronically a re being investigated.
CONTINUOUS SAMPLING
The apparatus described above was designed for determining the concentrations of flammable gases, mists and vapours in an industrial environment. A simpler version of the apparatus can be used for continuous sampling by inserting the inlet tube of the catalytic reactor into the fuel-air mixture and directly recording the output from the oxygen analyser. However, there is a possibility, in this particular apparatus, that the reactor may ignite a flammable mixture and no reliable means has been devised of preventing ignitions without removing a substantial part of the fuel from a mixture before it reaches the reactor. Therefore this simpler form of the apparatus is intended for use only for validation purposes in the laboratory where limited amounts of flammable mixtures a r e used.
VALIDATION
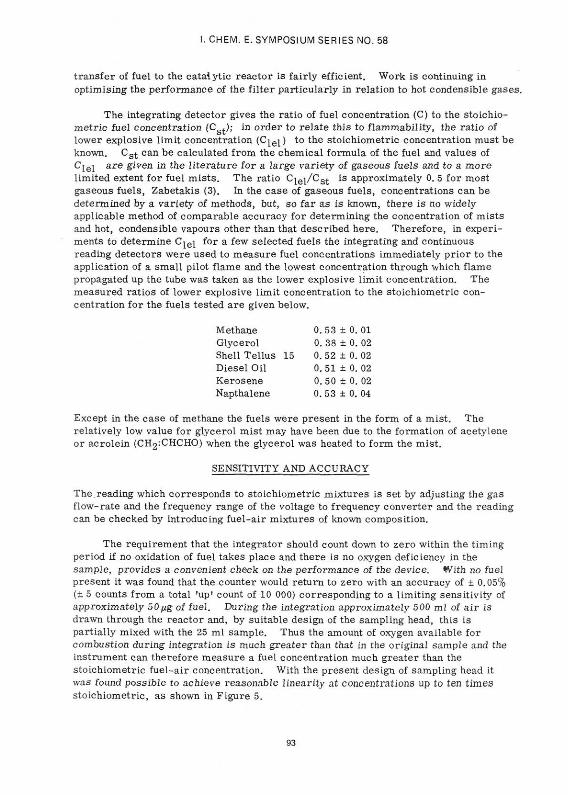
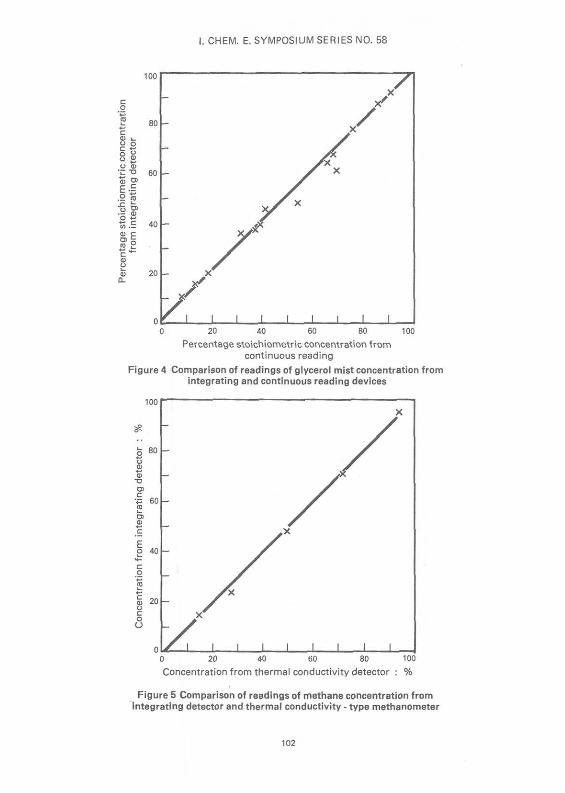
The performance of the integrating detector has been checked against a variety of fuel-air mixtures in a 5-cm-diameter vertical tube. Gaseous fuels were pre-mixed with air and passed into the tube, fuel mists were formed by mixing hot fuel vapour with cold air . The concentration of fuel-air mixtures was measured using the continuous sampling apparatus. When the concentration was steady, 25 ml of sample were drawn into the sampling device at a rate of about 75 ml/min. In the case of gaseous fuels the concentrations were measured independently using pellistor and thermal conductivity-type combustible-gas indicators. Good agreement was obtained between the integrating detector and the continuous reading indicator. Figure 4 shows the concentration of glycerol mist as measured by the integrating detector against that obtained from the continuous reading of oxygen depletion. Figure 5 shows a comparison between the integrating detector results for methane and the results from a thermal conductivity-type methanometer. These results show that the response of the integrating detector is linear over a wide range of concentrations for methane and for glycerol and there is no reason to suppose that it would not be linear for other gases, mists or vapours. The results also provide evidence that there a re no unexpected e r r o r s arising from the oxidation process, the measurement of oxygen concentration or the integrating and timing circuitry. The scat ter on the glycerol results is thought to be due to random fluctuation in the concentration of the mists being sampled as shown by the continuous sampling record. The fact that the integrating detector gives s imilar results to those from the continuous reading devices suggests that the
92
I. CHEM. E. SYMPOSIUM SERIES NO. 58
transfer of fuel to the catalytic reactor is fairly efficient. Work is continuing in optimising the performance of the filter particularly in relation to hot condensible gases.
The integrating detector gives the ratio of fuel concentration (C) to the stoichiometr ic fuel concentration (Cg t); in order to relate this to flammability, the ratio of lower explosive limit concentration (Cj e | ) to the stoichiometric concentration must be known. Cs^. can be calculated from the chemical formula of the fuel and values of ^ l e l a r e S i ven in the l i terature for a large variety of gaseous fuels and to a more limited extent for fuel mists . The ratio C j e j / C s t is approximately 0. 5 for most gaseous fuels, Zabetakis (3). In the case of gaseous fuels, concentrations can be determined by a variety of methods, but, so far as is known, there is no widely applicable method of comparable accuracy for determining the concentration of mists and hot, condensible vapours other than that described here. Therefore, in experiments to determine C^e\ for a few selected fuels the integrating and continuous reading detectors were used to measure fuel concentrations immediately pr ior to the application of a small pilot flame and the lowest concentration through which flame propagated up the tube was taken as the lower explosive limit concentration. The measured ratios of lower explosive limit concentration to the stoichiometric concentration for the fuels tested a re given below.
Methane 0. 53 + 0. 01 Glycerol 0. 38 ± 0. 02 Shell Tellus 15 0. 52 ± 0. 02 Diesel Oil 0. 51 ± 0. 02 Kerosene 0. 50 ± 0. 02 Napthalene 0. 53 ± 0. 04
Except in the case of methane the fuels were present in the form of a mist. The relatively low value for glycerol mist may have been due to the formation of acetylene or acrolein (Cl^CHCHO) when the glycerol was heated to form the mist.
SENSITIVITY AND ACCURACY
The reading which corresponds to stoichiometric mixtures is set by adjusting the gas flow-rate and the frequency range of the voltage to frequency converter and the reading can be checked by introducing fuel-air mixtures of known composition.
The requirement that the integrator should count down to zero within the timing period if no oxidation of fuel takes place and there is no oxygen deficiency in the sample, provides a convenient check on the performance of the device. With no fuel present it was found that the counter would return to zero with an accuracy of + 0.05% (± 5 counts from a total 'up' count of 10 000) corresponding to a limiting sensitivity of approximately 50jig of fuel. During the integration approximately 500 ml of a i r is drawn through the reactor and, by suitable design of the sampling head, this is partially mixed with the 25 ml sample. Thus the amount of oxygen available for combustion during integration is much greater than that in the original sample and the instrument can therefore measure a fuel concentration much greater than the stoichiometric fuel-air concentration. With the present design of sampling head it was found possible to achieve reasonable linearity at concentrations up to ten t imes stoichiometric, as shown in Figure 5.
93
I. CHEM. E. SYMPOSIUM SERIES NO. 58
Both the sensitivity and the accuracy of the measurement depend upon the sample volume. A large sample volume is advisable when sampling low concentrations whereas a smaller sample should be used for higher concentrations so as not to saturate the reactor. With a 25 ml sample, concentrations around the lower explosive limit could be measured to an accuracy of ± 5%, the major source of e r ro r being variations in the gas flow-rate through the system. If greater sensitivity and accuracy were required, for example when measuring low concentrations of toxic fuels, a large sample of up to about 300 ml could be used.
Catalytic sensing elements of the type used in industrial explosimeters a re particularly susceptible to catalyst inhibitors. Molecules containing halogens, sulphur or nitrogen tend to be strongly adsorbed on the catalyst surface preventing the adsorption and oxidation of the fuel which is to be detected and produce low readings. Interfering gases containing for example silicon or lead are oxidised on the catalyst surface to leave a solid residue which causes a permanent and cumulative reduction in sensitivity known as catalyst poisoning. Increases in catalyst surface area and in operating temperature to reduce the effect of inhibitors and poisons a re limited, in portable devices, by the requirements of small physical size and low power consumption. The catalytic reactor in the integrating detector operates at high temperature and has a large catalyst surface area in relation to the small amount of fuel to be oxidised so that inhibitors and poisons would not be expected to impair substantially the performance of the reactor. The effect of inhibitors was investigated by introducing varying quantities of trichlorethylene into 5% methane-air mixtures and observing any change in the reading of fuel concentration. No reduction in sensitivity was observed at concentrations of trichlorethylene up to at least 2%. For comparison, concentrations of chlorinated hydrocarbons as low as 100 ppm are known to significantly reduce the response of conventional explosimeters, F i r th et al (4).
If the atmosphere being sampled is oxygen deficient compared with ambient a non-zero reading will be obtained even if no fuel is present. The oxygen deficiency can be determined by repeating the measurement with the reactor and filter heater switched off. Subtracting this oxygen deficiency reading from the first reading will give the fuel concentration. The effect of oxygen deficiency on flammability limits depends upon the nature of the fuel and the concentration and chemical composition of the diluent gases, but in general a small oxygen deficiency is likely to have little effect on the lower explosive limit fuel concentration. It is advantageous, from a safety viewpoint, that oxygen deficiency in the atmosphere being sampled results in an increase rather than a decrease in apparent fuel concentration.
INTERPRETATION OF READINGS
The general equation for the complete combustion of a compound C ^ H O , is ii i n A
C n H m°X + ( n + f f i T - X ) 0 2 — n C 0 2 + f H 2° <«
Hence the stoichiometric concentration C * can be calculated using the expression
CSt = 1 (2) 1 + 4.773 (n + m - 2\)
4
94
I. CHEM. E. SYMPOSIUM SERIES NO. 58
where 4. 773 is the reciprocal of the molar concentration of oxygen in dry air (for 20. 95% oxygen).
For a fuel-air mixture whose concentration C = AC g j (where A is a constant) the reading of residual oxygen concentration from the continuous sampling apparatus would be given by:
(1 - A) (0. 2095 + B) continuous reading ° ( 1 _ A ) ( 1 + B ) + 3. 77B + nA ( 3 )
, .. , m - 2 where B = n + —:
The corresponding reading using the integrating apparatus with a sample volume V would be
Integrated reading = 0.2095 VA ( ^ ? 7 . 3 ^ - t ° ) (4)
These expressions assume a constant gas flow-rate downstream of the reactor and that water has been removed from the products of combustion.
The integrated reading is directly proportional to A (= C/C g t ) , the factor (3. 773B + n) / (1 + 4. 773B) being associated with the effect of the volume changes due to combustion and the removal of water.
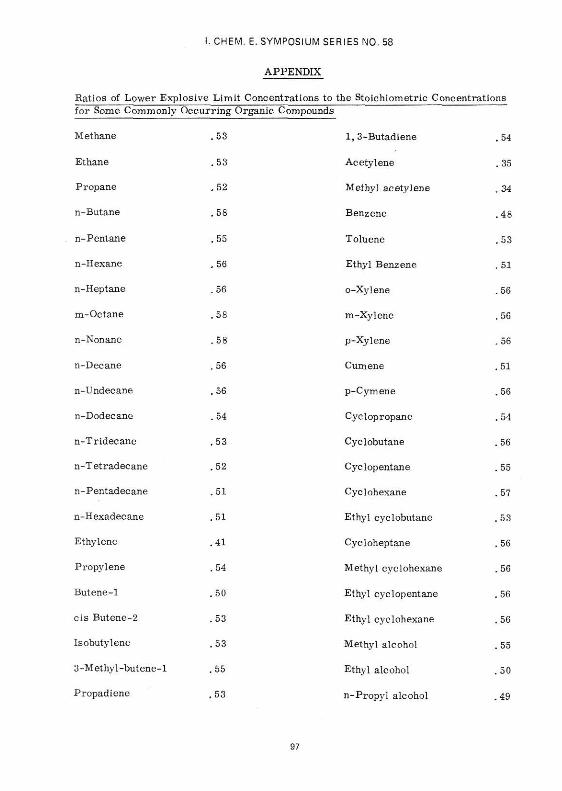
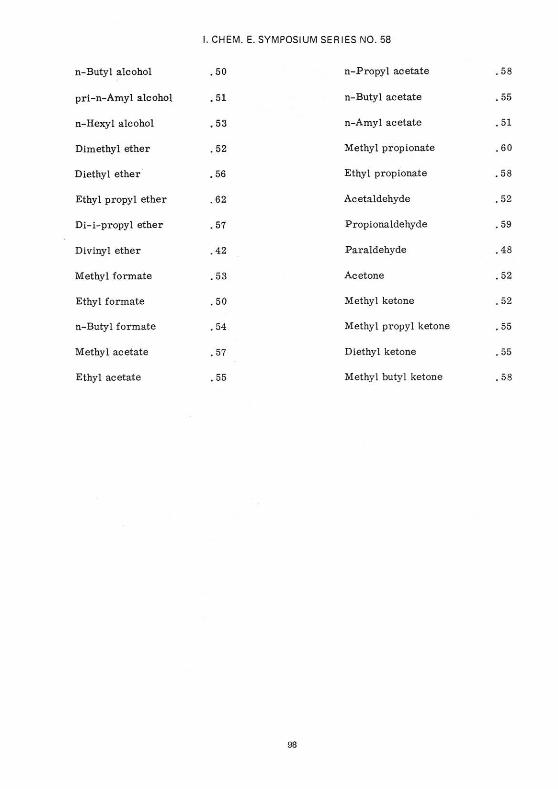
A li terature survey of flammability data has been carr ied out on 72 commonly occurring aliphatic and aromatic hydrocarbons, alcohols, ethers, es te rs , aldehydes and ketones (see Appendix). The mean ratio of the lower explosive limit concentration (Cjej) to the stoichiometric concentration (Cs^) was found to be 0. 533 with a standard deviation of 0. 047. If the reading of the integrating detector which c o r r e s ponds to the stoichiometric mixture of a hypothetical fuel for which there is no net volume change due to combustion and removal of water is taken as unity, then, for the 72 compounds, the mean reading at lower explosive limit concentrations would be 0. 485 with a standard deviation of 0. 045. For the 72 fuels only 8 would give a reading differing from the mean by more than 10% and only 3 by more than 15%. Fuels such as hydrogen have exceptionally wide flammability limits and, if their presence is suspected, the lower limit should not be taken as half the stoichiometric concentration but the integrated reading should be compared with the actual value of the ratio Cje^ to C s t for each individual fuel.
The situation with regard to fuel mists is more complicated but it appears that for fine mists (particle size below 10 jim) the concentration at the lower limit is about the same as that in a uniform vapour-air mixture (3). However, as the droplet size increases above 10pm the concentration at the lower explosive limit appears to decrease for upward propagation and to increase for downward propagation, Burgoyne and Cohen (5). The effect is due to the increased sedimentation velocity of la rger particles so that the effective concentration reaching the flame front is enhanced for upward propagation, Burgoyne (6). The amount of fuel which is collected on a filter is also affected by sedimentation. If the sampling velocity is approximately equal to the
95
I. CHEM. E. SYMPOSIUM SERIES NO. 58
flame velocity, the apparent concentration will be equal to the effective concentration reaching the flame front for flame propagation in the direction of sampling (6). From a safety viewpoint, the sampling velocity should be adjusted to the flame velocity at the lower explosive limit and the filter should face upward, as this is the most favourable direction for flame propagation. The value of effective concentration thus obtained can then be compared with the stoichiometric concentration. The effective concentration at the lower flammability limit is reported to show little variation with droplet size and to be approximately equal to half the stoichiometric fuel concentration (6), Burgoyne (7) and Cook et al (8).
The discussion so far has been restr icted to particles undergoing sedimentation in a stagnant medium. With moving aerosols the effect of inertia may cause large particles to be seriously overestimated unless the sampling velocity is adjusted to the velocity of the aerosol being sampled. Further experimental work is required to determine the optimum sampling techniques for both stationary and moving aerosols .
CONCLUSION
The assumption that the lower explosive limit concentration is approximately half the stoichiometric concentration seems to be valid for most fuels. The method developed for measuring the ratio of fuel concentration to the stoichiometric fuel concentration thus provides a reasonably accurate guide to the flammability of most gases, mists and vapours. With careful sampling, the method might be extended to cover fuel mists with quite large droplet diameters. Where the composition of the fuel is known a more accurate comparison can be made between the fuel concentration and the known limits of flammability.
REFERENCES
1. Firth, J .G. , Jones, A. and Jones, T.A., 1973, Combustion and Flame, 21, 303.
2. Bergman, I. and Windle, D. A., 1972, Ann. Occup. Hyg. , 15, 329.
3. Zabetakis, M. G. , 1965, U. S. Bureau of Mines Bulletin 627.
4. Firth, J. G. , Jones, A. and Jones, T.A. , 1972, Ann. Occup. Hyg. , 15, 321
5. Burgoyne, J. H. , and Cohen, L. , 1954, Proc. Roy. Soc. (London), 225, 375.
6. Burgoyne, J. H., 1963, Second Symposium on Chemical Process Hazards, 1.
7. Burgoyne, J. H. , 1957, Chemical Engineering Progress , 53, No. 3, 121.
8. Cook, S. J. , Cullis, C. F. , and Good, A. J. , 1977, Combustion and Flame, 30, 309.
© Crown copyright 1980
96
I. CHEM. E. SYMPOSIUM SERIES NO. 58
APPENDIX
Ratios of Lower Explosive Limit Concentrations to the Stoichiometric Concentrations for Some Commonly Occurring Organic Compounds
Methane
Ethane
Propane
n-Butane
n-Pentane
n-Hexane
n-Heptane
m-Octane
n-Nonane
n-Decane
n-Undecane
n-Dodecane
n-Tridecane
n-Tetradecane
n-Pentadecane
n-Hexadecane
Ethylene
Propylene
Butene-1
cis Butene-2
Isobutylene
3-Methyl-butene-l
Propadiene
. 5 3
. 5 3
. 5 2
. 5 8
.55
. 5 6
. 5 6
. 5 8
. 5 8
. 5 6
.56
. 5 4
. 5 3
. 5 2
. 5 1
. 5 1
. 4 1
. 54
. 5 0
. 53
. 5 3
, 5 5
. 5 3
1, 3-Butadiene
Acetylene
Methyl acetylene
Benzene
Toluene
Ethyl Benzene
o-Xylene
m-Xylene
p-Xylene
Cumene
p-Cymene
Cyclopropane
Cyclobutane
Cyclopentane
Cyclohexane
Ethyl cyclobutane
Cycloheptane
Methyl cyclohexane
Ethyl cyclopentane
Ethyl c}'Clohexane
Methyl alcohol
Ethyl alcohol
n-Propyl alcohol
. 5 4
. 35
. 3 4
. 4 8
. 5 3
. 5 1
. 5 6
. 5 6
. 5 6
. 5 1
. 5 6
. 5 4
. 5 6
.55
.57
. 5 3
. 5 6
.56
. 5 6
. 5 6
. 55
. 5 0
. 4 9
97
I. CHEM. E. SYMPOSIUM SERIES NO. 58
n-Butyl alcohol
pri-n-Amyl alcohol
n-Hexyl alcohol
Dimethyl ether
Diethyl ether
Ethyl propyl ether
Di-i-propyl ether
Divinyl ether
Methyl formate
Ethyl formate
n-Butyl formate
Methyl acetate
Ethyl acetate
.50
.51
.53
.52
.56
.62
.57
.42
.53
.50
.54
.57
.55
n-Propyl acetate
n-Butyl acetate
n-Amyl acetate
Methyl propionate
Ethyl propionate
Acetaldehyde
Propionaldehyde
Paraldehyde
Acetone
Methyl ketone
Methyl propyl ketone
Diethyl ketone
Methyl butyl ketone
.58
.55
.51
.60
.58
.52
.59
.48
.52
.52
.55
.55
.58
98
I. CHEM. E. SYMPOSIUM SERIES NO. 58
Two-way pump
P
F Rotameter
Air inlet
Sensing head
Oxygen meter
I Filter
l l u m
Filter Catalytic reactor heater
Drying tube
Pump Jf
Needle valve
Oxygen analyser
Figure 1 Schematic d iagram of apparatus
Amplifier Voltage to frequency converter
•=• 4 Network
Signal selection circuit
Display
l"l l"l IJ M
Control signals
Manual start
.
Sto
Decade counter
p signal
4 Decade counter/
display driver
Manual clear
Figure 2a Block diagram of circuit
99

I. CHEM. E. SYMPOSIUM SERIES NO. 58
VVV*-| | Hi'
^ oo—|| l
>
2
I E ? o to & c w V 3 01 £$<
>
<
n a
CO CO CO L.U
9 «- <-2 2 2 5 N 0 N < <p — O) —
< " j ! 0 t/3 a) t - m 1 E U . h U . i— CN CO ^3- LO
o o o o o
n a100
I. CHEM. E. SYMPOSIUM SERIES NO. 58
Count
% Oxygen
21 &
Counts up at frequency f (cc % 02) for time T Counts down at frequency f / 4 (cc % 02) for t ime 4 T
/ I « ^ - T _ » —
^ V FUEL PRESENT
Drop in O2 concentration ^ ^ due to oxidation of fuel ^W
1 J
1 1
<£
c O
xygen
conce
ntr
atic
V
c
Sample insertion
Figure 3 Illustration of method of baseline compensation
101
I. CHEM. E. SYMPOSIUM SERIES NO. 58
0 20 40 60 80 100 Percentage stoichiometric concentration from
continuous reading
Figure 4 Comparison of readings of glycerol mist concentration from integrating and continuous reading devices
0 20 40 60 80 100 Concentration from thermal conductivity detector : %
Figure 5 Comparison of readings of methane concentration from integrating detector and thermal conductivity - type methanometer
102