Embed Size (px)
Citation preview
A method to predict theresistivity index for tightsandstone reservoirs fromnuclear magnetic resonance dataLiang Xiao, Yujiang Shi, Gaoren Li, Haopeng Guo,and Junran Li
ABSTRACT
The relationship between water saturation and resistivity index intight sandstone reservoirs cannot be simply expressed using theArchie equation. This makes the saturation exponent difficult todetermine and the water saturation estimation significantly chal-lenging. Based on fractal theory and the Archie equation, a theo-retical power function relationship is used to predict the resistivityindex using the nuclear magnetic resonance (NMR) transverserelaxation time. In this study, 36 core samples, which were re-covered from tight gas sands of the Upper Triassic Xujiahe For-mation in the central Sichuan Basin, southwestern China, werestudied using laboratory NMR and resistivity experiments toverify the reliability of the proposed relationship. The results ofthis study show that this theoretical relationship is only effectivefor core samples that contain similar pore structures and physicalproperties. To precisely predict the resistivity index from NMRdata in formations with complicated pore structures, these 36core samples were classified into three types based on the porestructure and physical properties. For each type of core sample, theparameters used in this relationship were calibrated, along with therelationships between the water saturation and resistivity index andthe saturation exponents. Finally, the predicted saturation exponentsand the experimental results were compared and validated usingtwo tight sandstone reservoirs located elsewhere in China. Usingthis proposed method, tight sandstone reservoir saturation expo-nents were predicted from NMR data. Combining the existingcementation exponent prediction technique, the indispensable
AUTHORS
Liang Xiao ~ State Key Laboratory ofGeological Processes and Mineral Resources,China University of Geosciences, Ministry ofEducation, Beijing, People’s Republic ofChina; School of Geophysics andInformation Technology, China University ofGeosciences, Beijing, People’s Republic ofChina; [email protected]
Liang Xiao currently works as an associateprofessor and Ph.D. supervisor at ChinaUniversity of Geosciences, Beijing. Hisresearch interests include conventional andunconventional reservoir pore structurecharacterization and applied nuclear magneticresonance logs. More than 30 relevant papershave been published. He received his Ph.D.in geological resources and geologicalengineering from China University ofPetroleum (Beijing) in 2012. He has beenan associate editor for AAPG Bulletin, ActaGeophysica, and Arabian Journal ofGeosciences and an editorial boardmember ofEnergy Sources, Part A: Recovery, Utilization,and Environmental Effects.
Yujiang Shi ~ Research Institute ofExploration and Development, ChangqingOilfield, PetroChina, Xi’an, Shaanxi, People’sRepublic of China; [email protected]
Yujiang Shi received his Ph.D. in mineralresource prospecting and exploration fromNorthwest University in 2012. He currentlyworks as a professor-level senior engineer atChangqing Oilfield, PetroChina. His researchinterests comprise low-permeability to tight oiland gas reservoir evaluation and intelligentdigital oil field construction. He has publishedmore than 30 relevant papers and hasobtained six Chinese patents and eightsoftware copyrights.
Gaoren Li ~ Research Institute ofExploration and Development, ChangqingOilfield, PetroChina, Xi’an, Shaanxi, People’sRepublic of China; [email protected]
Gaoren Li obtained his B.Sc. in appliedgeophysics from Southwest PetroleumUniversity in 2002. He is now a senior engineerat the Research Institute of Exploration and
Copyright ©2021. The American Association of Petroleum Geologists. All rights reserved.
Manuscript received December 5, 2018; provisional acceptance March 18, 2019; revised manuscriptreceived August 15, 2019; revised manuscript provisional acceptance December 11, 2019; 2nd revisedmanuscript received December 13, 2019; 2nd revised manuscript provisional acceptance February 24,2020; 3rd revised manuscript received February 26, 2020; 3rd revised manuscript provisionalacceptance May 14, 2020; 4th revised manuscript received May 19, 2020; final acceptance May 22,2020.DOI:10.1306/05222018269
1009AAPG Bulletin, v. 105, no. 5 (May 2021), pp. 1009–1032
input parameters in the Archie equation were acquired, and watersaturations were accurately estimated in tight sandstone reservoirs.
INTRODUCTION
Water saturation is an important input parameter for the iden-tification and prediction of hydrocarbon-bearing reservoirs (Xiaoet al., 2013a; Amiri et al., 2015; Baziar et al., 2018). Generally,formation water saturation is predicted by combining the resis-tivity and porosity logs using the Archie equation (Archie, 1942).The Archie equation was proposed based on laboratory resistivityexperiments of core samples. The core samples that were usedwere drilled from conventional pure sandstone formations andexhibited high porosity and permeability and a relatively simplepore structure. Meanwhile, the additional conduction of clay mineralswas ignored (Mao et al., 1999a). The Archie equations are expressedas follows:
FF =R0
Rw=
awm (1)
Ir =Rt
R0=
bSnw
(2)
where FF is the formation factor; Ir is the resistivity index, whichrepresents the increase in rock resistivity when the saturated brinein the pore spaces is displaced by hydrocarbons; R0 is the rockresistivity with complete brine saturation; Rw is the resistivity offormation water, which can be acquired from water analysis li-braries or estimated from the spontaneous potential log (Doll,1948, 1950; Smits, 1968); Rt is the rock resistivity with hy-drocarbon saturation, which is acquired from conventional re-sistivity logs (e.g., deep Laterologs or deep induction logs); w isthe fractional formation porosity, which is determined usingporosity logs (e.g., density, sonic, or neutron) based on knownmodels (Wyllie et al., 1956; Widmyer and Wood, 1958; Freed-man et al., 1998; Hamada and Abu-Shanab, 2007; Gu et al., 2017;Rafik and Kamel, 2017; Wang and Fehler, 2018a, b); Sw is thefractional water saturation; a is the tortuosity factor, and m is thecementation exponent, which is heavily affected by the degree ofcementation and formation porosity; b is a constant associated withrock lithology, and n is the saturation exponent that is affectedby lithology, pore structure, and/or wettability; and a, b, m, and nare collectively referred to as the dimensionless rock resistivityparameters.
Theoretically, when rock pore spaces are fully occupied bybrine, Rt = R0 and Sw = 1.0. Hence, the constant of b is deter-mined as 1.0 using equation 2.
Development of Changqing Oilfield,PetroChina. He is mainly engaged in the studyof low-permeability to tight oil and gasreservoirs evaluation and application of newwell-logging technology.
Haopeng Guo ~ Research Institute ofExploration and Development, ChangqingOilfield, PetroChina, Xi’an, Shaanxi, People’sRepublic of China; [email protected]
Haopeng Guo obtained his master’s degree ingeodetection and information technology fromChina University of Petroleum (Beijing) in2007. He is now a senior engineer at theResearch Institute of Exploration andDevelopment of Changqing Oilfield,PetroChina. His research interests includepetrophysics, well-log interpretation, andformation evaluation.
Junran Li ~ Department of Geosciences,The University of Tulsa, Tulsa, Oklahoma;[email protected]
Junran Li obtained his B.Sc. in geology fromJilin University, Changchun, Jilin, China, in1998. He earned his Ph.D. in environmentalsciences from the University of Virginia,Charlottesville, Virginia, in 2008. He is currentlyan associate professor of geosciences at TheUniversity of Tulsa. His current interests includeaeolian geomorphology and aeolianreservoirs, geochemical characterization ofconventional and unconventional reservoirs,and the environmental impacts of energy useand exploration.
ACKNOWLEDGMENTS
This research was supported by the NationalNatural Science Foundation of China (No.41302106), the Major National Oil and GasSpecific Project of China (No. 2016ZX05050),the China Postdoctoral Science Foundation(Nos. 2012M520347, 2013T60147), and theFundamental Research Funds for the CentralUniversities, China (No. 2-9-2019-041).
1010 Predicting Resistivity Index from Nuclear Magnetic Resonance Data
Combining equations 1 and 2, equation 3 isderived as follows:
Sw =
ffiffiffiffiffiffiffiffiffiffiffiffiffiffiffiffia · Rw
wm · Rt
n
s(3)
Equation 3 illustrates that the determination of a, m,and n are necessary to predict water saturation fromconventional porosity and resistivity logs.
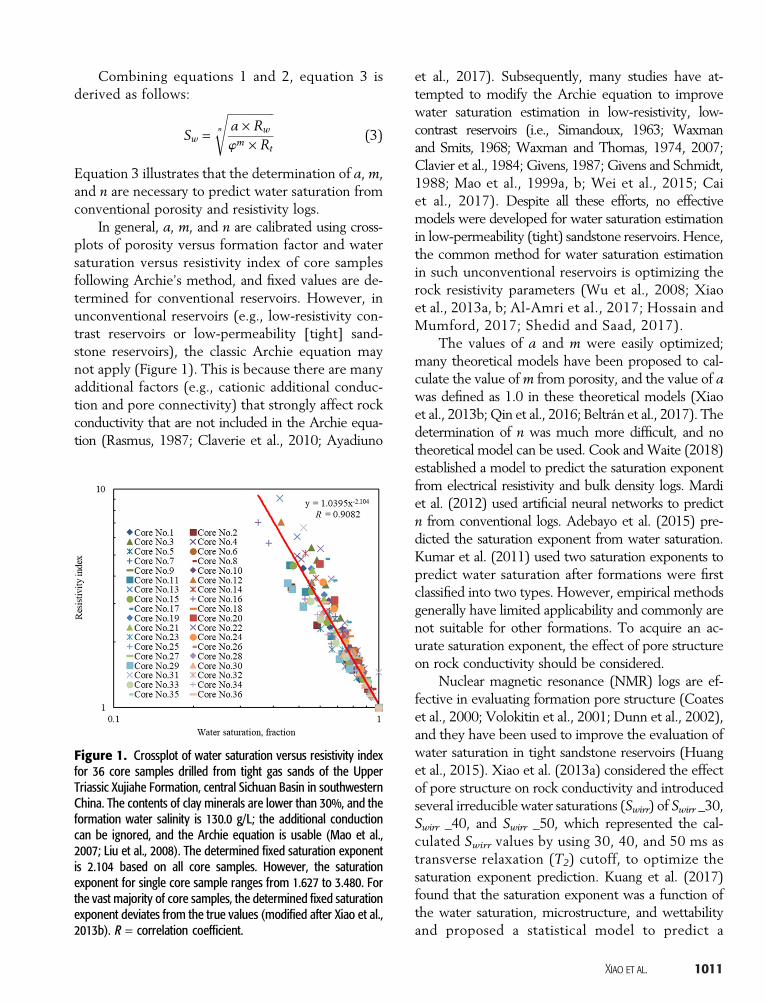
In general, a, m, and n are calibrated using cross-plots of porosity versus formation factor and watersaturation versus resistivity index of core samplesfollowing Archie’s method, and fixed values are de-termined for conventional reservoirs. However, inunconventional reservoirs (e.g., low-resistivity con-trast reservoirs or low-permeability [tight] sand-stone reservoirs), the classic Archie equation maynot apply (Figure 1). This is because there are manyadditional factors (e.g., cationic additional conduc-tion and pore connectivity) that strongly affect rockconductivity that are not included in the Archie equa-tion (Rasmus, 1987; Claverie et al., 2010; Ayadiuno
et al., 2017). Subsequently, many studies have at-tempted to modify the Archie equation to improvewater saturation estimation in low-resistivity, low-contrast reservoirs (i.e., Simandoux, 1963; Waxmanand Smits, 1968; Waxman and Thomas, 1974, 2007;Clavier et al., 1984; Givens, 1987; Givens and Schmidt,1988; Mao et al., 1999a, b; Wei et al., 2015; Caiet al., 2017). Despite all these efforts, no effectivemodels were developed for water saturation estimationin low-permeability (tight) sandstone reservoirs. Hence,the common method for water saturation estimationin such unconventional reservoirs is optimizing therock resistivity parameters (Wu et al., 2008; Xiaoet al., 2013a, b; Al-Amri et al., 2017; Hossain andMumford, 2017; Shedid and Saad, 2017).
The values of a and m were easily optimized;many theoretical models have been proposed to cal-culate the value ofm from porosity, and the value of awas defined as 1.0 in these theoretical models (Xiaoet al., 2013b;Qin et al., 2016; Beltran et al., 2017). Thedetermination of n was much more difficult, and notheoretical model can be used. Cook andWaite (2018)established a model to predict the saturation exponentfrom electrical resistivity and bulk density logs. Mardiet al. (2012) used artificial neural networks to predictn from conventional logs. Adebayo et al. (2015) pre-dicted the saturation exponent from water saturation.Kumar et al. (2011) used two saturation exponents topredict water saturation after formations were firstclassified into two types. However, empirical methodsgenerally have limited applicability and commonly arenot suitable for other formations. To acquire an ac-urate saturation exponent, the effect of pore structureon rock conductivity should be considered.
Nuclear magnetic resonance (NMR) logs are ef-fective in evaluating formation pore structure (Coateset al., 2000; Volokitin et al., 2001; Dunn et al., 2002),and they have been used to improve the evaluation ofwater saturation in tight sandstone reservoirs (Huanget al., 2015). Xiao et al. (2013a) considered the effectof pore structure on rock conductivity and introducedseveral irreducible water saturations (Swirr) of Swirr _30,Swirr _40, and Swirr _50, which represented the cal-culated Swirr values by using 30, 40, and 50 ms astransverse relaxation (T2) cutoff, to optimize thesaturation exponent prediction. Kuang et al. (2017)found that the saturation exponent was a function ofthe water saturation, microstructure, and wettabilityand proposed a statistical model to predict a
Figure 1. Crossplot of water saturation versus resistivity indexfor 36 core samples drilled from tight gas sands of the UpperTriassic Xujiahe Formation, central Sichuan Basin in southwesternChina. The contents of clay minerals are lower than 30%, and theformation water salinity is 130.0 g/L; the additional conductioncan be ignored, and the Archie equation is usable (Mao et al.,2007; Liu et al., 2008). The determined fixed saturation exponentis 2.104 based on all core samples. However, the saturationexponent for single core sample ranges from 1.627 to 3.480. Forthe vast majority of core samples, the determined fixed saturationexponent deviates from the true values (modified after Xiao et al.,2013b). R = correlation coefficient.
Xiao et al. 1011
saturation exponent from NMR logs. These modelswere established based on statistical methods, and theystrongly relied on the laboratory experiments of coresamples. Their broad applicability needs to be furtherverified. In addition, the diffusion relaxation of naturalgas makes the main NMR T2 peaks move to the leftand overlap with the surface relaxation T2 distributionof irreducible water (Akkurt et al., 1996; Kleinbergand Vinegar, 1996; Coates et al., 2000; Hirasakiet al., 2003; Minh et al., 2018; Xiao et al., 2018).This means Swirr _30, Swirr _40, and Swirr _50 areoverestimated, and the determined saturation ex-ponent is overestimated. AlthoughGuo et al. (2018)proposed a method to predict the saturation expo-nent from NMR data, the pore structure was notconsidered. The method is only applicable in rockswith uniform property and cannot be consecutivelyapplied in formations with a complicated porestructure.
The purpose of this paper is to develop a methodto predict various water exponents fromNMR logs intight sandstone reservoirs. In this method, a theoreticalmodel was established to predict the resistivity indexfrom NMR logs based on fractal theory. A pseudo-relationship of the water saturation and resistivity indexwas reconstituted to acquire the saturation exponentbased on typical tight gas sands of the Upper TriassicXujiahe Formation in the central Sichuan Basin insouthwestern China. Field applications in our target,the Xujiahe Formation, illustrated that this methodcan only be applied to the formations that werefirst classified into individual types based on thepore structure and physical properties. Finally,this proposed method was verified using addi-tional sets of core samples collected from otherlocations in China, and field applications illus-trated that it can be widely used in tight sandstonereservoirs once a reasonable classification of for-mations was first established and the input pa-rameters were calibrated.
GEOLOGICAL SETTING
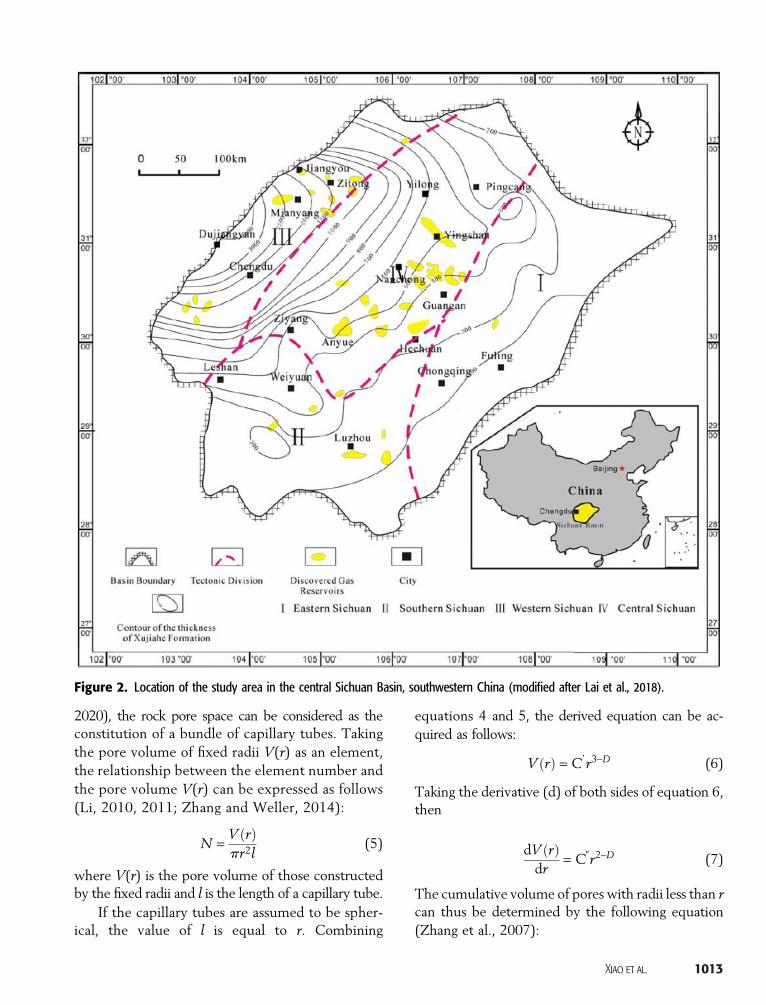
The Sichuan Basin located in southwestern Chinacovers an area of more than 230,000 km2 (Hao et al.,2008) (Figure 2). It is the largest natural gas (includingshale gas and tight gas) production base in China (Laiet al., 2018). The Sichuan Basin looks like a diamond
shape (Xu et al., 2013). Shallow-marine carbonatesdominate sub-Middle Triassic strata of the centralSichuan Basin. The Upper Triassic Xujiahe Formationcomprises more than 10,000 m of sandstone withsubordinate amounts of mudstone and coal and is theprimary tight gas-bearing unit in the basin (Zeng,2010). In ascending order, the Xujiahe Formation isdivided into six members, which are Xu 1 section, Xu2 section, Xu 3 section, Xu 4 section, Xu 5 section,and Xu 6 section (Figure 3) (Mao et al., 2007). Thefirst member is black mudstone and is absent in thistarget area. The second, fourth, and sixth membersare the main sandstone reservoirs. The secondsection contains both gas and water, with watersaturation higher than 60.0% (Zheng et al., 2019).The fourth and sixth sections are the principaltight gas reservoir, with porosities ranging from2.0% to 12.0%, and permeabilities mainly dis-tributed from 0.01 to 1.0 md (Xiao et al., 2015).The third member is the dark gray and black shalewith dark gray siltstone, and the fifth member isblack to gray shale, argillaceous siltstone, and sand-stone with coal (Zeng, 2010). The third and fifthmembers are the main source rocks with highgamma ray and resistivity responses in the conven-tional well-log curves.
TECHNICAL BACKGROUND
The Fractal Theory of Porous Media
Based on the principle proposed by Pfeifer and Avnir(1983), the shape of a rock surface satisfies fractalstructure. If an irregular rock pore is assumed to beconstituted by numerous tightly arranged spheres withthe radius (r) in micrometers and these spheres areconsidered elements of this pore space, the relation-ship between the element number and its radius canbe expressed by a power function:
N}Cr-D (4)
where N is the number of elements, D is the fractaldimension of the rock, and C is a statistical modelparameter.
Based on the Carman–Kozeny equation (Kozeny,1927;Carman, 1937; Friesen andMikula, 1987; Anguloet al., 1992; Buiting and Clerke, 2013; Amadu andPegg, 2018; Mirzaei-Paiaman et al., 2018; Hou et al.,
1012 Predicting Resistivity Index from Nuclear Magnetic Resonance Data
2020), the rock pore space can be considered as theconstitution of a bundle of capillary tubes. Takingthe pore volume of fixed radii V(r) as an element,the relationship between the element number andthe pore volume V(r) can be expressed as follows(Li, 2010, 2011; Zhang and Weller, 2014):
N =VðrÞpr2l
(5)
where V(r) is the pore volume of those constructedby the fixed radii and l is the length of a capillary tube.
If the capillary tubes are assumed to be spher-ical, the value of l is equal to r. Combining
equations 4 and 5, the derived equation can be ac-quired as follows:
V ðrÞ = C9r3-D (6)
Taking the derivative (d) of both sides of equation 6,then
dV ðrÞdr
= C0r2-D (7)
The cumulative volume of pores with radii less than rcan thus be determined by the following equation(Zhang et al., 2007):
Figure 2. Location of the study area in the central Sichuan Basin, southwestern China (modified after Lai et al., 2018).
Xiao et al. 1013
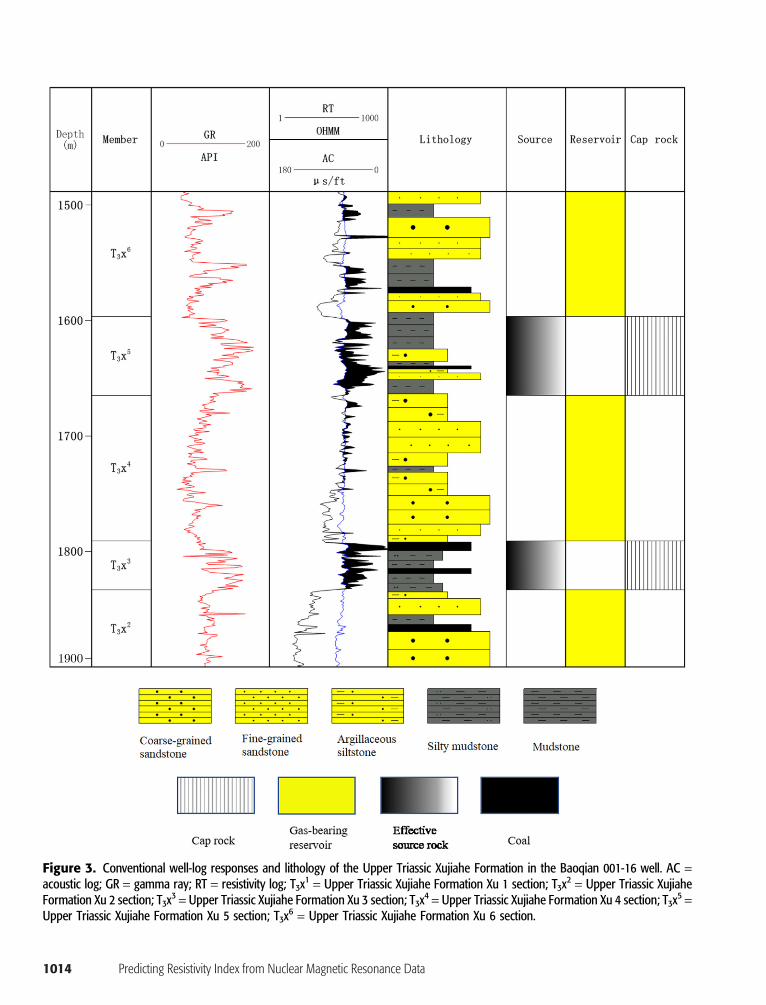
Figure 3. Conventional well-log responses and lithology of the Upper Triassic Xujiahe Formation in the Baoqian 001-16 well. AC =acoustic log; GR = gamma ray; RT = resistivity log; T3x
1 = Upper Triassic Xujiahe Formation Xu 1 section; T3x2 = Upper Triassic Xujiahe
Formation Xu 2 section; T3x3 = Upper Triassic Xujiahe Formation Xu 3 section; T3x
4 = Upper Triassic Xujiahe Formation Xu 4 section; T3x5 =
Upper Triassic Xujiahe Formation Xu 5 section; T3x6 = Upper Triassic Xujiahe Formation Xu 6 section.
1014 Predicting Resistivity Index from Nuclear Magnetic Resonance Data
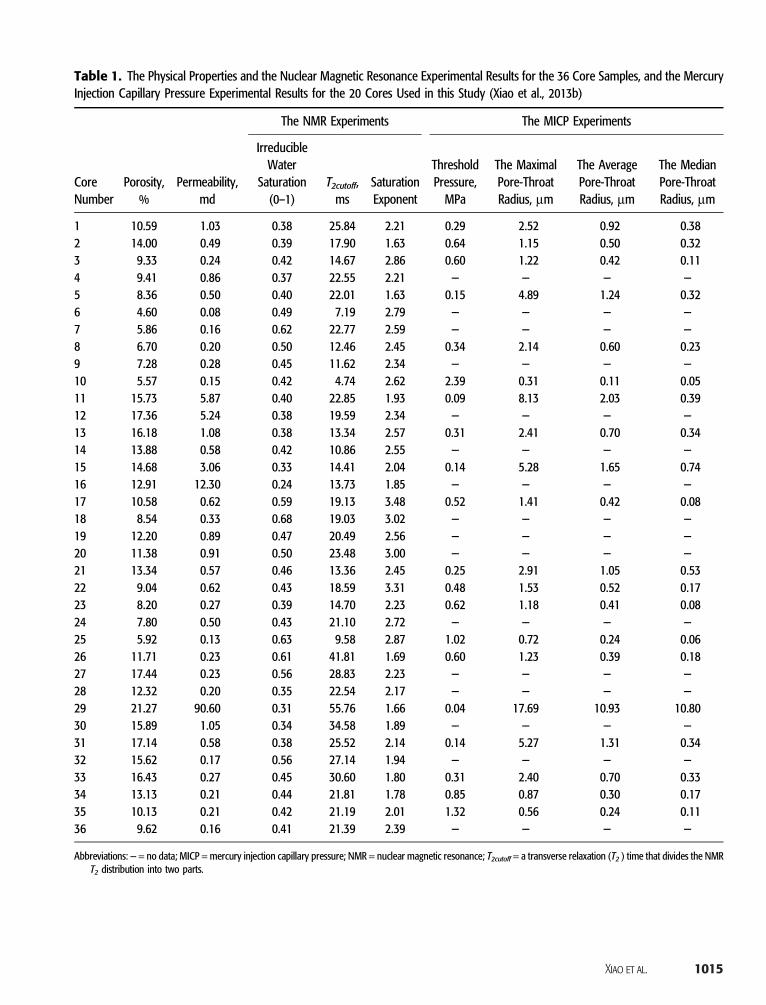
Table 1. The Physical Properties and the Nuclear Magnetic Resonance Experimental Results for the 36 Core Samples, and the MercuryInjection Capillary Pressure Experimental Results for the 20 Cores Used in this Study (Xiao et al., 2013b)
CoreNumber
Porosity,%
Permeability,md
The NMR Experiments The MICP Experiments
IrreducibleWater
Saturation(0–1)
T2cutoff,ms
SaturationExponent
ThresholdPressure,MPa
The MaximalPore-ThroatRadius, mm
The AveragePore-ThroatRadius, mm
The MedianPore-ThroatRadius, mm
1 10.59 1.03 0.38 25.84 2.21 0.29 2.52 0.92 0.382 14.00 0.49 0.39 17.90 1.63 0.64 1.15 0.50 0.323 9.33 0.24 0.42 14.67 2.86 0.60 1.22 0.42 0.114 9.41 0.86 0.37 22.55 2.21 — — — —
5 8.36 0.50 0.40 22.01 1.63 0.15 4.89 1.24 0.326 4.60 0.08 0.49 7.19 2.79 — — — —
7 5.86 0.16 0.62 22.77 2.59 — — — —
8 6.70 0.20 0.50 12.46 2.45 0.34 2.14 0.60 0.239 7.28 0.28 0.45 11.62 2.34 — — — —
10 5.57 0.15 0.42 4.74 2.62 2.39 0.31 0.11 0.0511 15.73 5.87 0.40 22.85 1.93 0.09 8.13 2.03 0.3912 17.36 5.24 0.38 19.59 2.34 — — — —
13 16.18 1.08 0.38 13.34 2.57 0.31 2.41 0.70 0.3414 13.88 0.58 0.42 10.86 2.55 — — — —
15 14.68 3.06 0.33 14.41 2.04 0.14 5.28 1.65 0.7416 12.91 12.30 0.24 13.73 1.85 — — — —
17 10.58 0.62 0.59 19.13 3.48 0.52 1.41 0.42 0.0818 8.54 0.33 0.68 19.03 3.02 — — — —
19 12.20 0.89 0.47 20.49 2.56 — — — —
20 11.38 0.91 0.50 23.48 3.00 — — — —
21 13.34 0.57 0.46 13.36 2.45 0.25 2.91 1.05 0.5322 9.04 0.62 0.43 18.59 3.31 0.48 1.53 0.52 0.1723 8.20 0.27 0.39 14.70 2.23 0.62 1.18 0.41 0.0824 7.80 0.50 0.43 21.10 2.72 — — — —
25 5.92 0.13 0.63 9.58 2.87 1.02 0.72 0.24 0.0626 11.71 0.23 0.61 41.81 1.69 0.60 1.23 0.39 0.1827 17.44 0.23 0.56 28.83 2.23 — — — —
28 12.32 0.20 0.35 22.54 2.17 — — — —
29 21.27 90.60 0.31 55.76 1.66 0.04 17.69 10.93 10.8030 15.89 1.05 0.34 34.58 1.89 — — — —
31 17.14 0.58 0.38 25.52 2.14 0.14 5.27 1.31 0.3432 15.62 0.17 0.56 27.14 1.94 — — — —
33 16.43 0.27 0.45 30.60 1.80 0.31 2.40 0.70 0.3334 13.13 0.21 0.44 21.81 1.78 0.85 0.87 0.30 0.1735 10.13 0.21 0.42 21.19 2.01 1.32 0.56 0.24 0.1136 9.62 0.16 0.41 21.39 2.39 — — — —
Abbreviations: — = no data; MICP =mercury injection capillary pressure; NMR = nuclear magnetic resonance; T2cutoff = a transverse relaxation (T2 ) time that divides the NMRT2 distribution into two parts.
Xiao et al. 1015
Vð< rÞ =ðrrmin
C0r2-Ddr (8)
Based on equation 8, the rock total pore volume, VT,which can be equivalent to the accumulation of thepore-throat radius from the minimum to maximum,can be estimated as follows:
VT = V ð< rmaxÞ =ðrmax
rmin
C0r2-Ddr = C9ðr3-Dmax - r3-Dmin Þ
(9)
In a similar way, the pore volumes with pore radiinarrower than r, Vr, are predicted by (Guo et al.,2017; Pan et al., 2018)
Vr = V ð< rÞ =ðrrmin
C0r2-Ddr = C9ðr3-D - r3-Dmin Þ
(10)
Rock water saturation is defined as the ratio betweenthe pore volume occupied by water and the total
pore volume (Burstrom, 1966). By combining equa-tion 9 with equation 10, the formula used to calculateSw can be expressed as follows:
Sw =Vr
VT=C9ðr3-D - r3-Dmin ÞC9ðr3-Dmax - r3-Dmin Þ
=r3-D - r3-Dmin
r3-Dmax - r3-Dmin(11)
Generally, rmax >> rmin, and the difference betweentheir values can be up to three to four orders of mag-nitude (Guo et al., 2018). Hence, the variables associ-ated with rmin can be ignored, and equation 11 can bechanged into the following:
Sw =r3-D
r3-Dmax=�
rrmax
�3-D
(12)
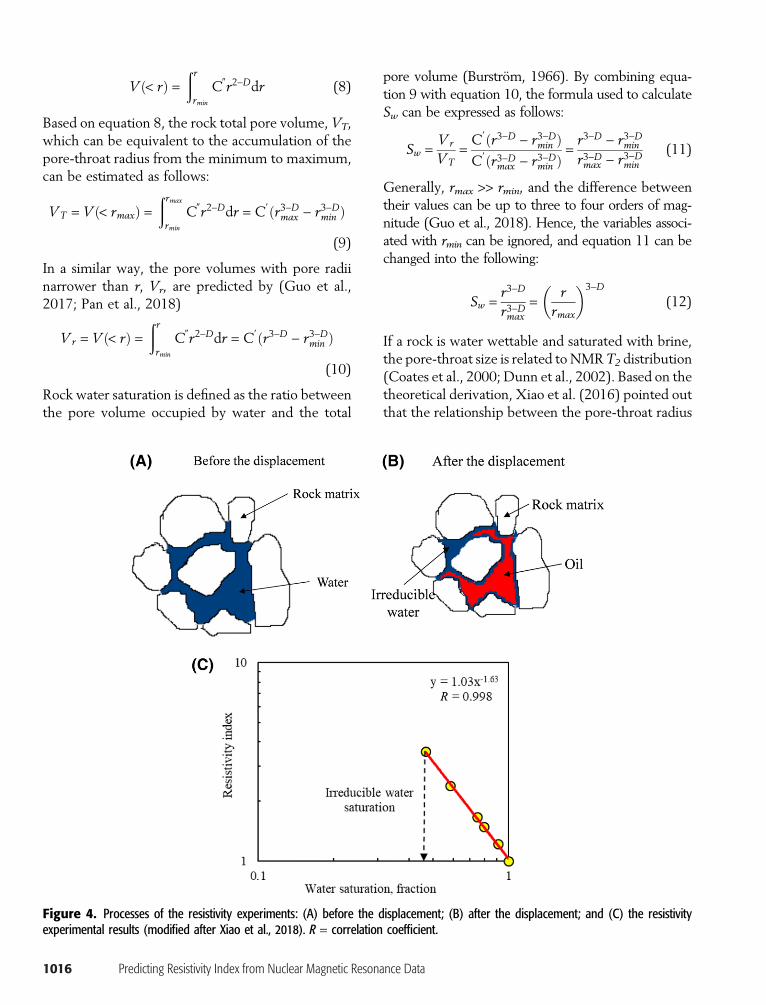
If a rock is water wettable and saturated with brine,the pore-throat size is related to NMR T2 distribution(Coates et al., 2000; Dunn et al., 2002). Based on thetheoretical derivation, Xiao et al. (2016) pointed outthat the relationship between the pore-throat radius
Figure 4. Processes of the resistivity experiments: (A) before the displacement; (B) after the displacement; and (C) the resistivityexperimental results (modified after Xiao et al., 2018). R = correlation coefficient.
1016 Predicting Resistivity Index from Nuclear Magnetic Resonance Data
of rock and the NMR T2 time can be expressed as apower function:
r = a1 · Tb12 (13)
where T2 is the NMR transverse relaxation time (inms) and a1 and b1 are the involved model param-eters between r and T2 time, whose values can becalibrated by combining the NMR and mercury
injection capillary pressure (MICP) data. The valuesof a1 and b1 are also associated with rock porestructure. As rock pore structure improves, the valuesof a1 decrease and the values of b1 increase.
Substituting equation 13 into equation 12 givesthe following equation:
Sw =
a1 ·Tb1
2
a1 ·Tb12max
!3-D
=�
T2
T2max
�b1·ð3-DÞ(14)
where T2max is the maximum T2 time.
Relationship between NMR T2 Time andResistivity Index
The relationship between Sw and Ir can be obtainedby rearranging equation 2:
Sw =�R0
Rt
�1n
=�1Ir
�1n
= I-1n
r (15)
Substituting equation 15 into equation 14, the re-sulting equation can be expressed as
Ir =�
T2
T2max
�-b1·n·ð3-DÞ
= Tb1·n·ð3-DÞ2max · T-b1·n·ð3-DÞ
2
(16)
If two parameters p and q are introduced, and theirvalues are defined as
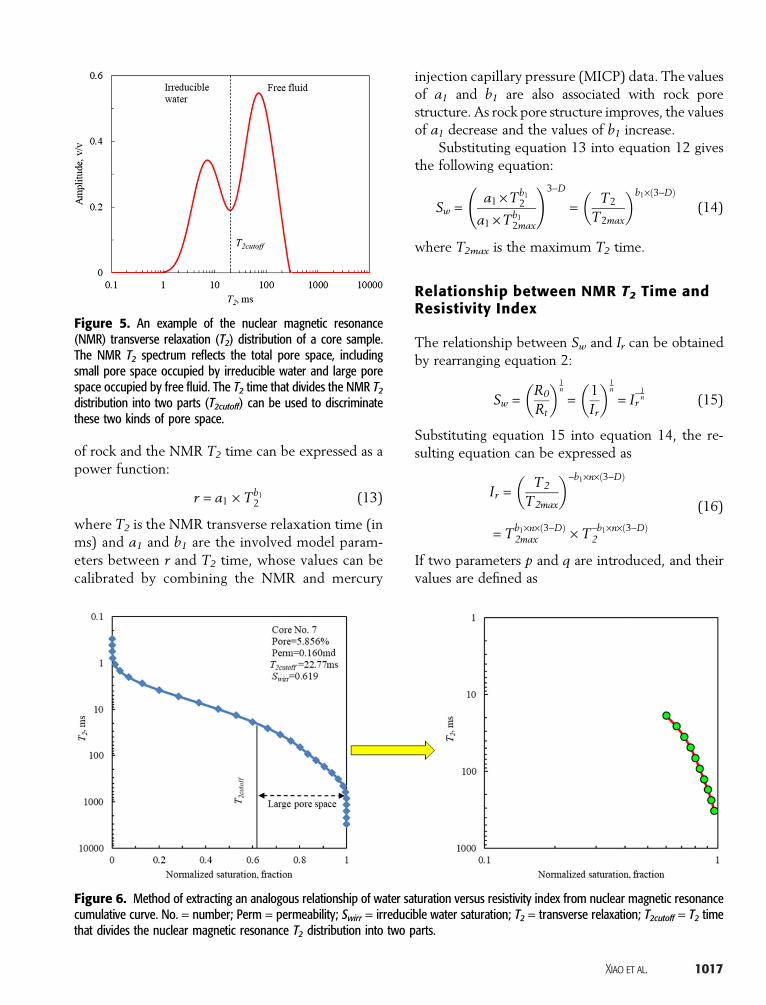
Figure 6. Method of extracting an analogous relationship of water saturation versus resistivity index from nuclear magnetic resonancecumulative curve. No. = number; Perm = permeability; Swirr = irreducible water saturation; T2 = transverse relaxation; T2cutoff = T2 timethat divides the nuclear magnetic resonance T2 distribution into two parts.
Figure 5. An example of the nuclear magnetic resonance(NMR) transverse relaxation (T2) distribution of a core sample.The NMR T2 spectrum reflects the total pore space, includingsmall pore space occupied by irreducible water and large porespace occupied by free fluid. The T2 time that divides the NMR T2distribution into two parts (T2cutoff) can be used to discriminatethese two kinds of pore space.
Xiao et al. 1017
p = Tb1·n·ð3-DÞ2max (17)
q = b1 · n · ð3 - DÞ (18)
then equation 16 can be transformed into
Ir = p · T-q2 (19)
The values of T2max, b1, n, and D are associated withrock pore structure. For a given core sample, theirvalues are constant. In this case, the values of Ir areonly determined by the T2 times.
Equation 19 illustrates that the relationship be-tween the rock resistivity index and T2 time can beexpressed as a power function, and they are
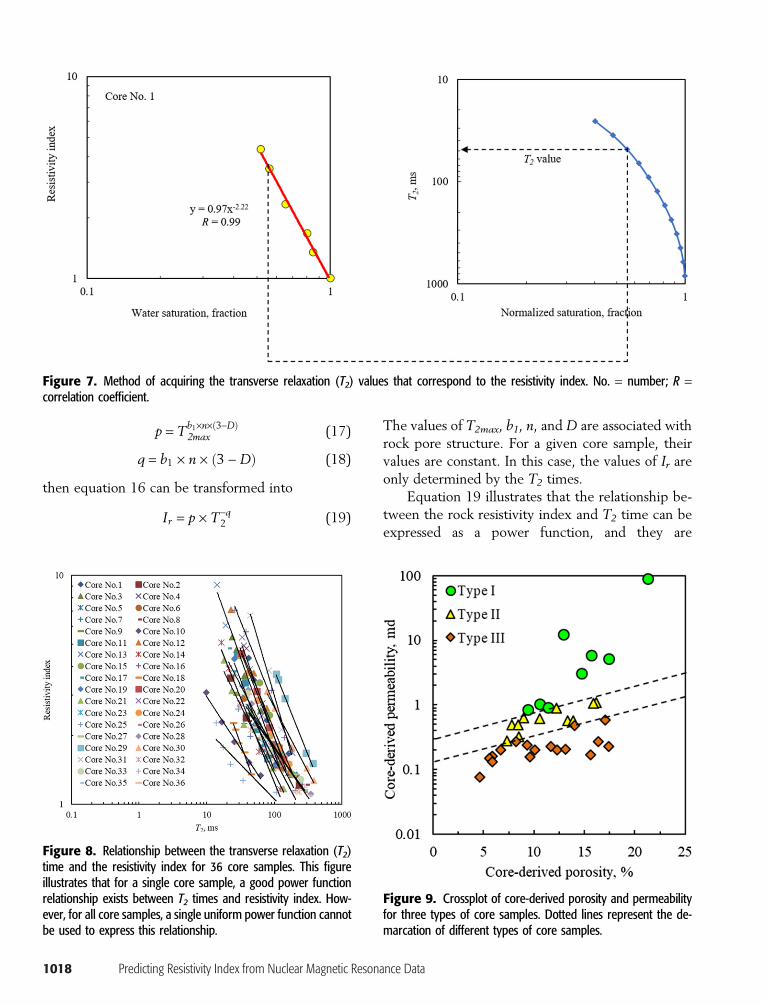
Figure 8. Relationship between the transverse relaxation (T2)time and the resistivity index for 36 core samples. This figureillustrates that for a single core sample, a good power functionrelationship exists between T2 times and resistivity index. How-ever, for all core samples, a single uniform power function cannotbe used to express this relationship.
Figure 9. Crossplot of core-derived porosity and permeabilityfor three types of core samples. Dotted lines represent the de-marcation of different types of core samples.
Figure 7. Method of acquiring the transverse relaxation (T2) values that correspond to the resistivity index. No. = number; R =correlation coefficient.
1018 Predicting Resistivity Index from Nuclear Magnetic Resonance Data
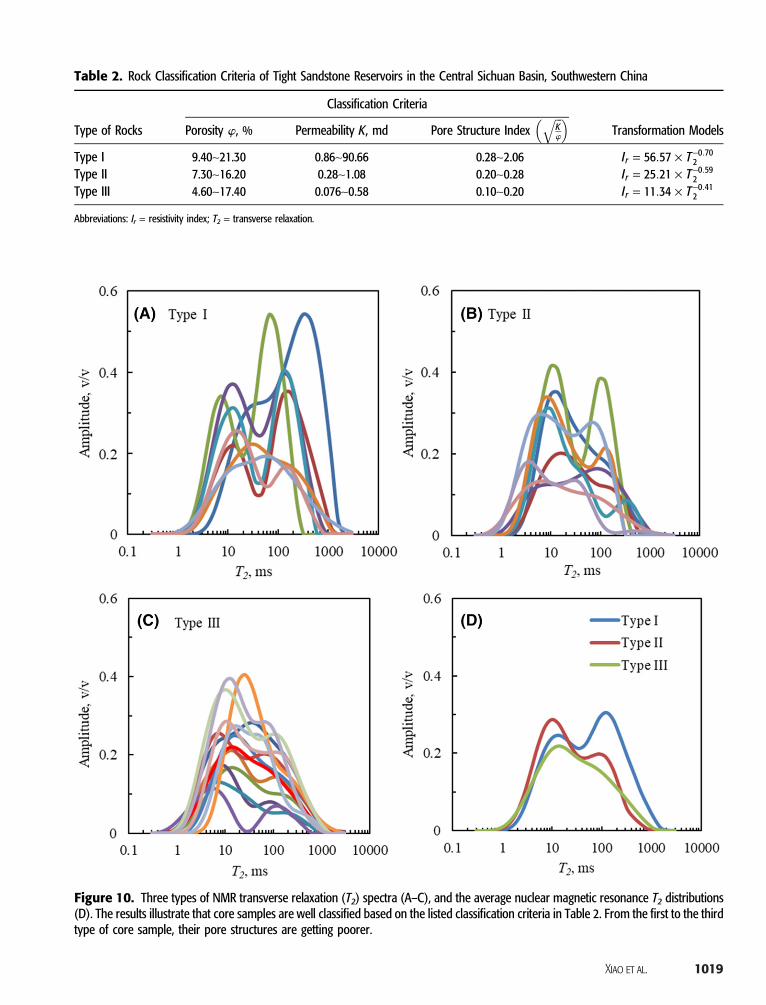
Table 2. Rock Classification Criteria of Tight Sandstone Reservoirs in the Central Sichuan Basin, Southwestern China
Type of Rocks
Classification Criteria
Transformation ModelsPorosity w, % Permeability K, md Pore Structure Index� ffiffiffi
Kw
q �
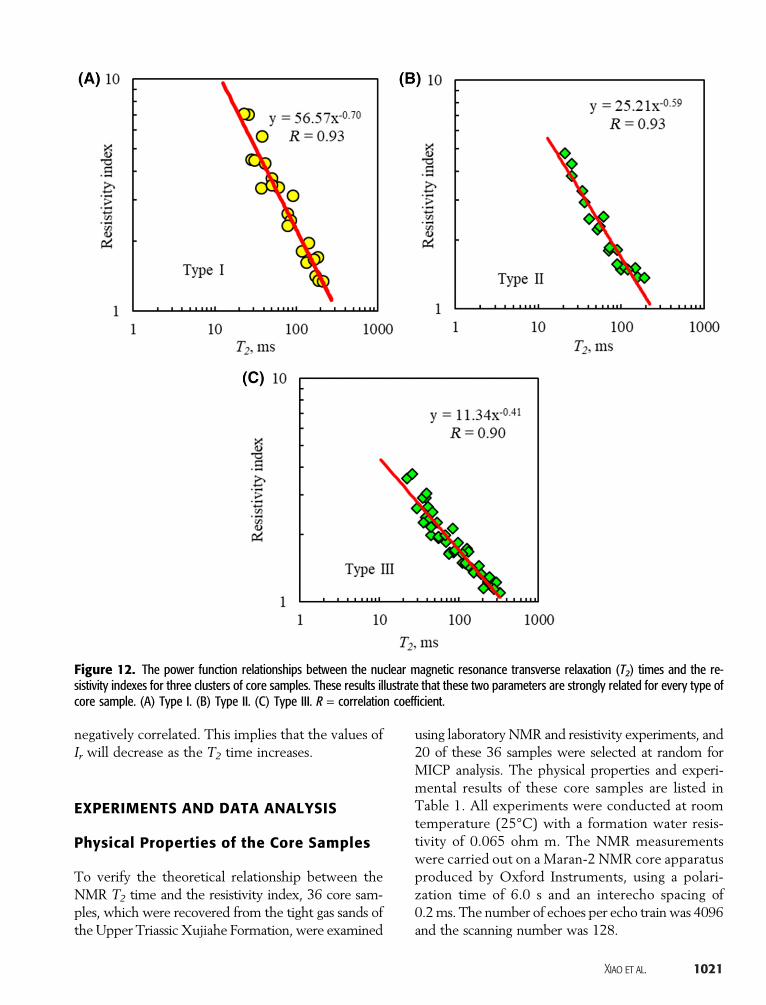
Type I 9.40~21.30 0.86~90.66 0.28~2.06 Ir = 56:57 · T-0:702Type II 7.30~16.20 0.28~1.08 0.20~0.28 Ir = 25:21 · T-0:592Type III 4.60~17.40 0.076~0.58 0.10~0.20 Ir = 11:34 · T-0:412
Abbreviations: Ir = resistivity index; T2 = transverse relaxation.
Figure 10. Three types of NMR transverse relaxation (T2) spectra (A–C), and the average nuclear magnetic resonance T2 distributions(D). The results illustrate that core samples are well classified based on the listed classification criteria in Table 2. From the first to the thirdtype of core sample, their pore structures are getting poorer.
Xiao et al. 1019
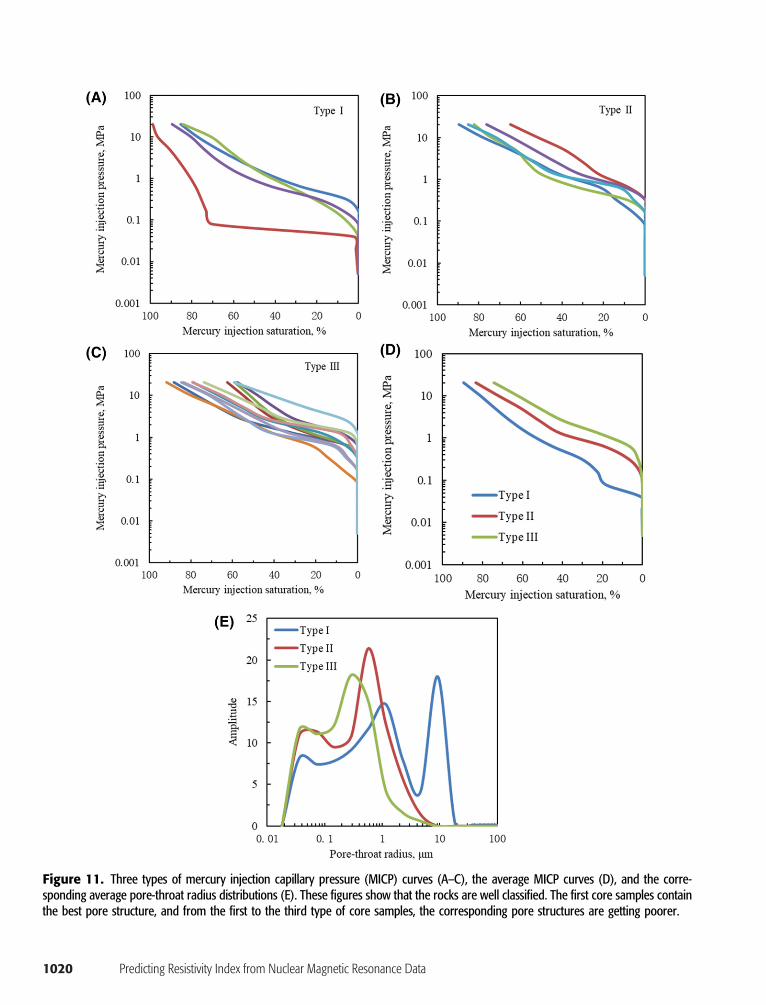
Figure 11. Three types of mercury injection capillary pressure (MICP) curves (A–C), the average MICP curves (D), and the corre-sponding average pore-throat radius distributions (E). These figures show that the rocks are well classified. The first core samples containthe best pore structure, and from the first to the third type of core samples, the corresponding pore structures are getting poorer.
1020 Predicting Resistivity Index from Nuclear Magnetic Resonance Data
negatively correlated. This implies that the values ofIr will decrease as the T2 time increases.
EXPERIMENTS AND DATA ANALYSIS
Physical Properties of the Core Samples
To verify the theoretical relationship between theNMR T2 time and the resistivity index, 36 core sam-ples, which were recovered from the tight gas sands ofthe Upper Triassic Xujiahe Formation, were examined
using laboratory NMR and resistivity experiments, and20 of these 36 samples were selected at random forMICP analysis. The physical properties and experi-mental results of these core samples are listed inTable 1. All experiments were conducted at roomtemperature (25°C) with a formation water resis-tivity of 0.065 ohm m. The NMR measurementswere carried out on a Maran-2 NMR core apparatusproduced by Oxford Instruments, using a polari-zation time of 6.0 s and an interecho spacing of0.2ms. The number of echoes per echo train was 4096and the scanning number was 128.
Figure 12. The power function relationships between the nuclear magnetic resonance transverse relaxation (T2) times and the re-sistivity indexes for three clusters of core samples. These results illustrate that these two parameters are strongly related for every type ofcore sample. (A) Type I. (B) Type II. (C) Type III. R = correlation coefficient.
Xiao et al. 1021
The resistivity experiments were conducted us-ing the classical gas-drive method (Liu et al., 2011).In this method, core samples were first saturated withthe configured brine (with salinity of 130.0 g/L), andthe resistivity and weight of rocks were measuredseparately. Second, the brine-saturated samples wereplaced in a container and displayed by gas for 2 hr toreduce water saturation, and then, the resistivity andweight of rocks were measured again. The experi-mental procedure mentioned in the second step wasrepeated several times until the weight of rocks didnot change.
Acquiring a Pseudocurve of ResistivityIndex versus Water Saturation fromNMR Data
To analyze the relationship between the T2 time andthe resistivity index, a curve is constructed using theNMR data, with the shape of this curve being analo-gous to the crossplot of water saturation versus theresistivity index. It should be noted that the reflectedpore spaces of the NMR data and resistivity experi-ments were somewhat different. During the resistivityexperimental measurement, rocks were first fully sat-urated with brine, and then gas was used to replace thewettable brine based on the displacement method.Figure 4 shows that the resistivity changed with thedecrease of water saturation. Hence, the resistivityexperiments can only be used to reflect the largepore spaces occupied by free fluids because only thebrine saturated in the large pore spaces can be dis-placed by gas. In the small pore spaces, brine wasirreducible because of the high capillary pressure,and it cannot be displaced by gas.
The NMR T2 distribution measures the totalhydrogen index of the rock pore spaces and reflectsthe total pore spaces. This suggests that the porespaces measured by the NMR are larger than thosefrom the resistivity experiments. To ensure that theconstructed resistivity index from NMR data isconsistent with the resistivity experiments, thesetwo methods must be ensured to target on the samepore spaces.
In the NMR T2 spectrum, the T2 cutoff is definedas a T2 time that divides the NMR T2 distributioninto two parts (Ge et al., 2015; Xiao et al., 2018). AT2 distribution with T2 times shorter than the T2
cutoff value represents small rock pore spaces thatare occupied by irreducible water. In contrast, a T2
distribution with T2 times longer than the T2 cutoffrepresents large rock pore spaces occupied by freefluids (e.g., free water and/or hydrocarbon) (Figure 5).Therefore, the T2 cutoff is an important indicator ofsmall and large pore spaces (Xiao et al., 2018).
In this study, to make the experimental resultsof NMR and resistivity measurements reflect thesame pore spaces, the experimental NMR T2 am-plitude was first integrated with T2 time increasingfrom theminimum T2 relaxation time tomaximum T2relaxation time and normalized it to obtain an NMRcumulative curve. Afterward, the experimental T2cutoff was used to separate the NMR cumulativecurve into two sections. The section with T2 relax-ation times longer than the T2 cutoff is the pseu-docurve. Using the No. 7 core sample as an example,the method of determining the analogous relation-ship of water saturation versus resistivity index fromNMR data is illustrated in Figure 6. Using thismethod, the NMR data of all 36 core samples wereprocessed by combining the experimental parame-ters of Swirr and T2 cutoff, and they acquired all theanalogous relationships of water saturation versus re-sistivity index.
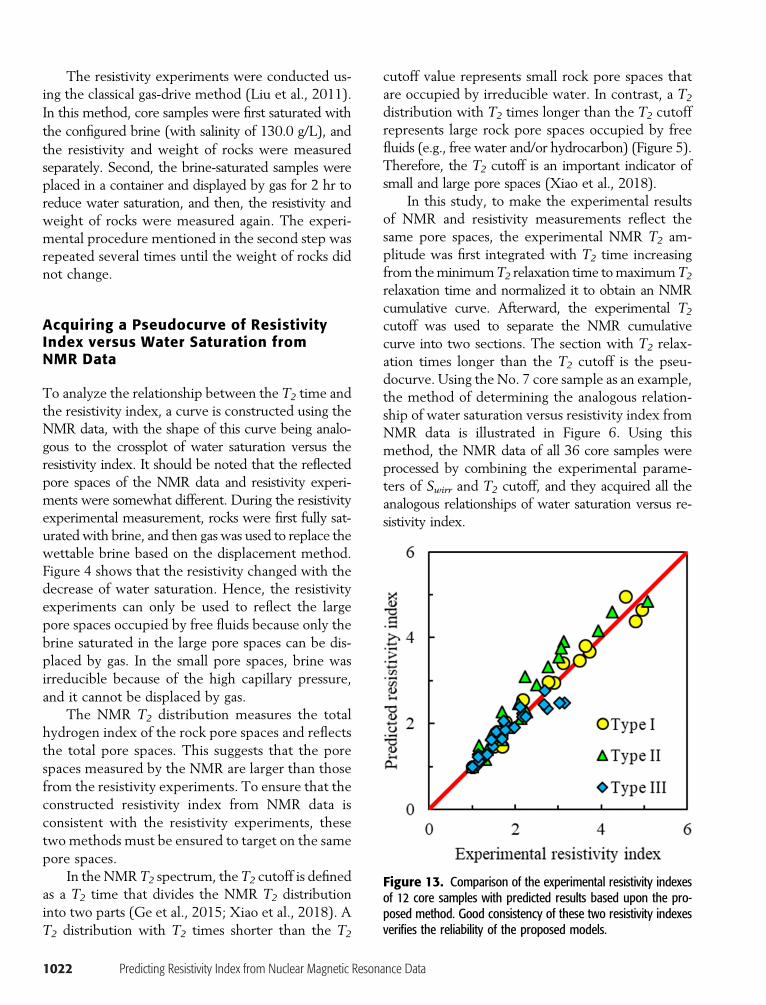
Figure 13. Comparison of the experimental resistivity indexesof 12 core samples with predicted results based upon the pro-posed method. Good consistency of these two resistivity indexesverifies the reliability of the proposed models.
1022 Predicting Resistivity Index from Nuclear Magnetic Resonance Data
Relationship of T2 Value and ResistivityIndex
Using theNo. 1 core sample as an example, themethodof extracting the T2 time under every resistivity index isshown in Figure 7. In this method, the constructedpseudocurve from the NMR data and the experi-mental results are plotted using the same x-axis. Forevery resistivity index, a line that contains the samewater saturation is drawn to intersect with thepseudocurve, and the corresponding T2 value canthen be acquired.
Similarly, all 36 core samples were processed,and the NMR T2 values corresponding to every re-sistivity index were extracted and crossplotted withthe resistivity index (Figure 8). This figure suggeststhat a power function can be used to express therelationship of the T2 value and the resistivity indexfor single core samples, and this power function ex-hibits a straight line in log–log coordinates. However,for every core sample, the mentioned parameters in
this power function are not the same. As a result, asingle uniform relationship cannot be obtained for allthe core samples.
A NEW METHOD FOR PREDICTING THESATURATION EXPONENT
Given the fact that no single model can be used torepresent the relationship of the T2 value and theresistivity index for all core samples, an alternativemethod based on rock classification is proposed. Inthis method, rocks are first classified into severaltypes based on their pore structures and physicalproperties. Second, an average NMR T2 spectrumand the crossplot of water saturation versus resis-tivity index are acquired for each rock type, and thecorresponding average pseudocurve of resistivity indexversus water saturation is also acquired from the av-erage NMR T2 spectrum. Third, the mentionedmethod in Figure 7 is used to obtain the T2 timesunder every resistivity index. Finally, a single power
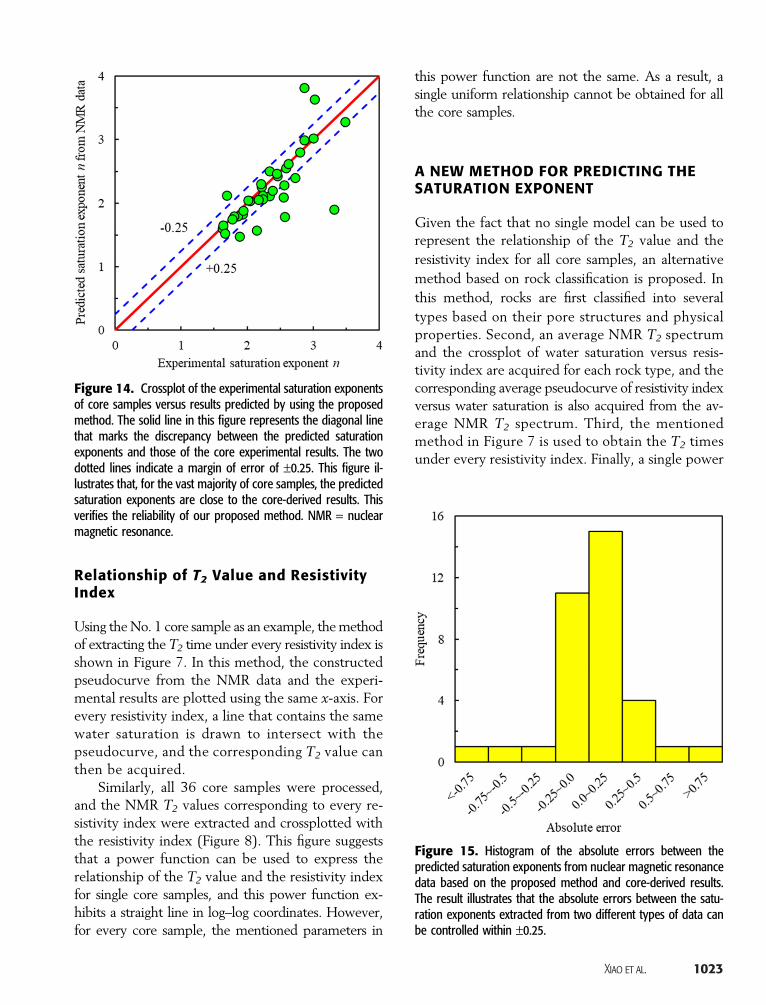
Figure 15. Histogram of the absolute errors between thepredicted saturation exponents from nuclear magnetic resonancedata based on the proposed method and core-derived results.The result illustrates that the absolute errors between the satu-ration exponents extracted from two different types of data canbe controlled within –0.25.
Figure 14. Crossplot of the experimental saturation exponentsof core samples versus results predicted by using the proposedmethod. The solid line in this figure represents the diagonal linethat marks the discrepancy between the predicted saturationexponents and those of the core experimental results. The twodotted lines indicate a margin of error of –0.25. This figure il-lustrates that, for the vast majority of core samples, the predictedsaturation exponents are close to the core-derived results. Thisverifies the reliability of our proposed method. NMR = nuclearmagnetic resonance.
Xiao et al. 1023
function relationship is established between the T2
value and the resistivity index within every rocktype, and these relationships are used to transformthe T2 value into the resistivity index within eachrock type. By combining the synthesized resistivityindex with the normalized water saturation, therelationship between the water saturation and theresistivity index can be reconstructed from NMRdata.
Classification of Core Samples
To establish a reasonable classification criterion forthe target tight sandstone reservoirs, the shapes ofthe NMR T2 spectra for the 36 core samples and theMICP curves for the 20 core samples were analyzed.As a result, these core samples can be classified intothree types based on pore structure and difference inphysical properties (Figure 9; Table 2). Figure 10A–Cshows the NMR T2 distributions for each type ofcore sample, and Figure 10D displays the averageNMR T2 spectra for three types of core samples.Similarly, Figure 11A–C displays the MICP curvesfor each type of core sample, and Figure 11D dis-plays the average MICP curves for three types of coresamples. In Figure 11E, the average pore-throat radiiextracted from the averageMICP curves are displayed.
Comparisons of the physical properties, the shapesof the NMR T2 spectra, and the corresponding MICPcurves of three types of core samples illustrate that fromthe first to the third type, the porosities and perme-abilities decrease, and the pore structure becomespoorer and poorer. The NMR T2 spectra of the firsttype of core samples mainly exhibit a bimodal dis-tribution, and the large pore spaces (T2 spectra witha long T2 time) are dominant (Figure 10A). TheMICPcurves exhibit the best pore structure, the corre-sponding threshold pressures are lower than 0.2MPa (Figure 11A), and the pore-throat radii aredistributed from 0.01 to 20 mm and mainly from0.3 to 20 mm (Figure 11E). The second type of T2
spectra also exhibits a bimodal distribution, but thespectra are dominated by small pore spaces (T2 spectrawith a short T2 time) (Figure 10B). The position of theMICP curves goes up, the threshold pressures mainlyrange from 0.2 to 0.6 MPa (Figure 11B), and the pore-throat radii mainly range from 0.2 to 2.0 mm. The thirdtype of T2 spectra is unimodal, and the small pore
spaces are developed (Figure 10C), the correspondingMICP curves represent the poorest pore structure, andthe threshold pressures are higher than 0.7 MPa(Figure 11C); the pore-throat radii mainly range from0.1 to 0.7 mm.
Transformation of the Resistivity Indexfrom NMR Experimental Data
Using the rock classification criteria listed in Table 2,the crossplots of T2 time and resistivity index displayedin Figure 8 are distributed among three clusters. In thisstudy, the experimental data of 24 core samples areused to establish the models to predict resistivity indexfrom the T2 value, and the rest of the experimentaldata of 12 core samples are held in reserve to verify thereliability of this model. Figure 12A–C displays thecrossplots of NMR T2 values and resistivity indexes foreach of these three clusters of core samples. By usingthe statistical regression method based on the powerfunction, the models that are used to transform theNMR T2 time into the resistivity index are acquiredand listed in the last column of Table 2. The resultsillustrate that a strong correlation (correlation coeffi-cient (R) dotted lines represent the demarcation ofdifferent types of core samples. >0.9) exists betweenthese two parameters for every cluster of core sam-ples. From the first to the third type of core sam-ples, the values of p and q in equation 19 decrease. Byusing the models shown in Figure 12A–C, the rockresistivity index can be precisely predicted from theNMR data. By crossplotting the normalized watersaturation with the predicted resistivity index, a rela-tionship of water saturation versus resistivity index canbe constructed from the NMR data. It can be used toreplace the resistivity experiments of core samples andto predict the rock saturation exponent.
Reliability Demonstration
Using the established models displayed in Figure 12A–C, the NMR data of the rest of the 12 core samples areprocessed. After the core samples are first classified intothree types, the corresponding models were used topredict the resistivity index from T2 time. To verify thereliability of the proposed models, the predicted re-sistivity indexes with the experimental results of lab-oratory resistivity were compared. Figure 13 displays
1024 Predicting Resistivity Index from Nuclear Magnetic Resonance Data
Figu
re16
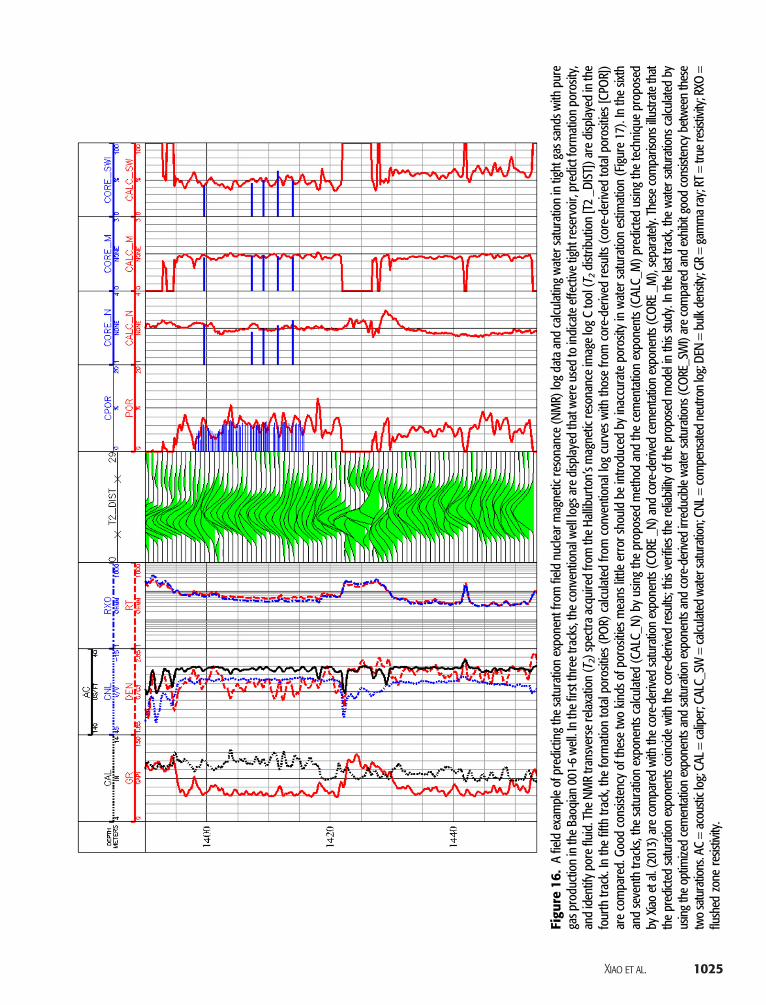
.Afieldexam
pleofpredictingthesaturationexponentfro
mfieldnuclearmagnetic
resonance(NMR)logdataandcalcu
latingwatersaturationintightgassands
with
pure
gasp
roductionintheBaoqian001-6well.Inthefirstthree
tracks,theconventionalw
elllogsaredisplayedthatwereused
toindicateeffective
tightreservoir,predict
form
ationporosity,
andidentifyporefluid.TheNM
Rtransverserelaxation(T2)spectra
acquiredfro
mtheHallib
urton’sm
agnetic
resonanceimagelogCtool(T2distribution[T2_D
IST])aredisplayedinthe
fourthtrack.Inthefifth
track,the
form
ationtotalporosities
(POR)
calcu
latedfro
mconventionallog
curves
with
thosefro
mcore-derive
dresults
(core-derived
totalporosities
[CPO
R])
arecompared.Go
odconsistency
ofthesetwokindso
fporosities
means
little
errorshouldbe
intro
ducedby
inaccurateporosityinwatersaturationestim
ation(Figure17).Inthesixth
andseventhtracks,thesaturationexponentscalculated(CALC_
N)by
usingtheproposed
methodandthecementationexponents(CA
LC_M
)predicted
usingthetechniqueproposed
byXiao
etal.(2013)arecomparedwith
thecore-derivedsaturationexponents(CO
RE_N
)and
core-derivedcementationexponents(CO
RE_M
),separately.Thesecomparisonsillustratethat
thepredicted
saturationexponentscoincidewith
thecore-derivedresults;thisverifiesthereliability
oftheproposed
modelinthisstu
dy.Inthelasttrack,the
watersaturations
calculated
byusingtheoptim
izedcementationexponentsand
saturationexponentsand
core-derivedirreduciblewatersaturations
(CORE_SWI)arecomparedandexhibitgoodconsistencybetweenthese
twosaturations.AC=acousticlog;CAL
=caliper;CALC_SW
=calculated
watersaturation;CN
L=compensated
neutronlog;DEN=bulkdensity;GR=gammaray;RT
=trueresistivity;RXO
=flushedzone
resistivity.
Xiao et al. 1025
the comparison of the acquired resistivity indexes fromthe NMR data with core experimental results for 12core samples. This comparison illustrates that thepredicted resistivity indexes are coincident with theexperimental results of core samples. This verifiesthe reliability of the established model.
Acquiring the Saturation Exponents fromConstructed Resistivity Index
Combining the predicted resistivity index with thenormalized water saturation, the relationships of watersaturation versus resistivity index for all 36 core sam-ples are reconstructed. The saturation exponents,then, are regressed. Figure 14 shows that there is astrong consistency between the saturation exponentspredicted with the proposed method versus those ofthe core experimental results for all 36 core samples.Figure 15 further shows that for a majority of coresamples, the absolute errors between the predictedand experimental saturation exponents are within–0.25.
CASE STUDY
The proposed method and established models wereapplied to the Baoqian 001-6 well in the centralSichuan Basin to predict consecutive saturation ex-ponents. Meanwhile, the model of predicting thecementation exponent (m) from total porosity (w)proposed by Xiao et al. (2013) was also used to ac-quire consecutive cementation exponents. This modelis expressed as follows (Xiao et al., 2013):
m = 2:00 + 0:48 · log10ðwÞ (20)
Combined with the predicted cementation exponentsusing equation 20 and saturation exponents, formationwater saturation was calculated from porosity andresistivity logs (Figure 16). The drill-stem test dataillustrate that the interval of 1395.0 to 1480.0 m(4577.0 to 4855.9 ft) yields pure gas without water.Therefore, experimental core-derived Swirr (CORE_SWI)represents the core-derived water saturation in thisformation. This figure shows that the predicted watersaturation by using the extracted saturation exponentsfrom field NMR logs (calculated water saturation[CALC_SW]) matches with CORE_SWI very well inthis test zone. This means the proposed technique is
effective in optimizing saturation exponent estimationin tight gas sands.
EXTENSIVE APPLICATION
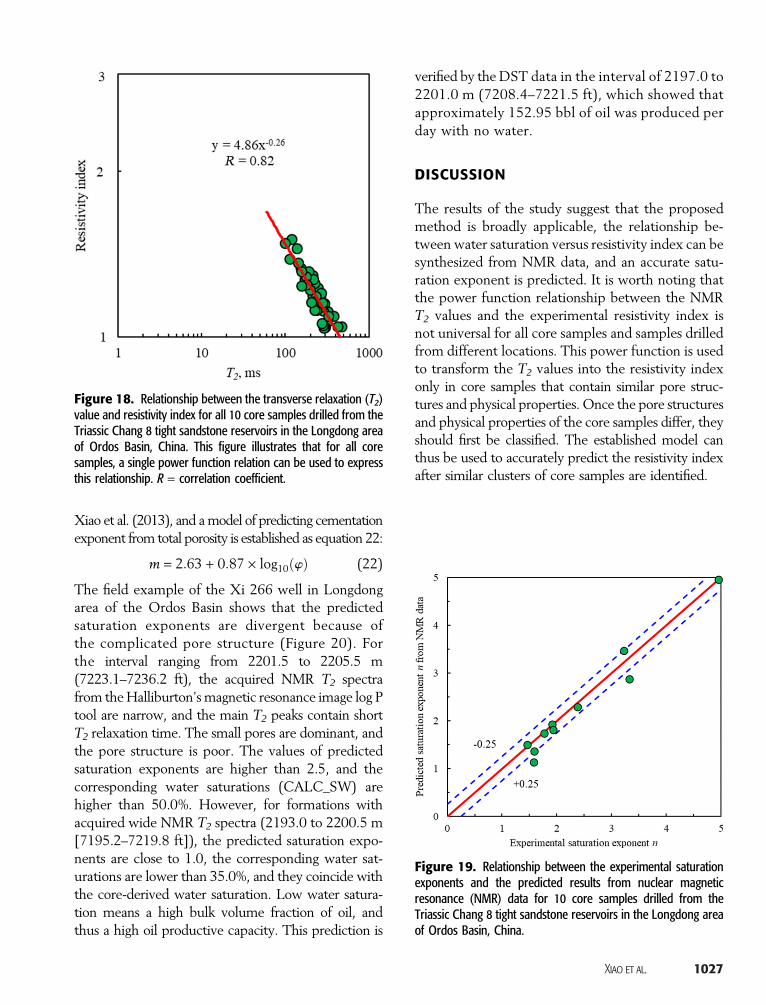
To further evaluate the applicability of the proposedmethod, it was applied in the Triassic Chang 8 tightsandstone reservoirs of the Longdong area in theOrdosBasin, northcentral China. Ten core samples werecollected for laboratory NMR and resistivity exper-iments. The relationship between the NMR T2 timeand resistivity index of all 10 core samples showsthat a strong power function relationship exists be-tween these two parameters (Figure 18; R = 0.82).For these 10 core samples, no further classification isneeded. The power function relationship betweenthese two parameters is expressed as follows:
Ir = 4:86 · T-0:262 (21)
The saturation exponents predicted from the proposedmethod are also highly correlated with the experi-mental results from the core samples, and the absoluteerrors between them are less than –0.25 (Figure 19).Meanwhile, the resistivity experimental data arereprocessed based on the technique proposed by
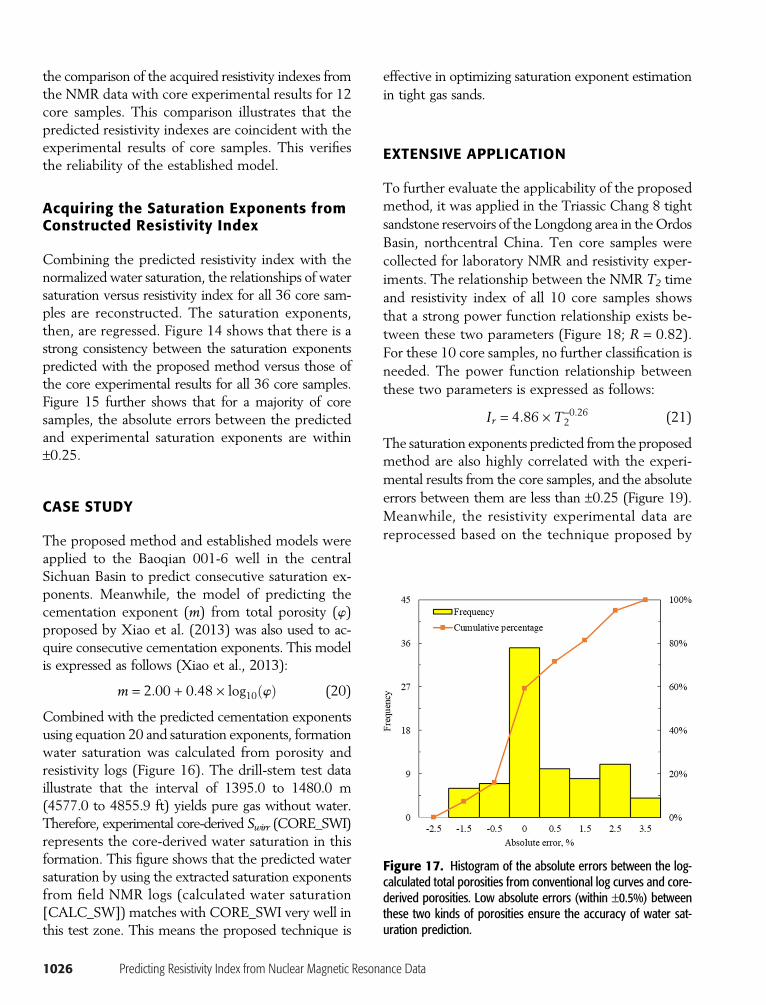
Figure 17. Histogram of the absolute errors between the log-calculated total porosities from conventional log curves and core-derived porosities. Low absolute errors (within –0.5%) betweenthese two kinds of porosities ensure the accuracy of water sat-uration prediction.
1026 Predicting Resistivity Index from Nuclear Magnetic Resonance Data
Xiao et al. (2013), and amodel of predicting cementationexponent from total porosity is established as equation 22:
m = 2:63 + 0:87 · log10ðwÞ (22)
The field example of the Xi 266 well in Longdongarea of the Ordos Basin shows that the predictedsaturation exponents are divergent because ofthe complicated pore structure (Figure 20). Forthe interval ranging from 2201.5 to 2205.5 m(7223.1–7236.2 ft), the acquired NMR T2 spectrafrom theHalliburton’s magnetic resonance image log Ptool are narrow, and the main T2 peaks contain shortT2 relaxation time. The small pores are dominant, andthe pore structure is poor. The values of predictedsaturation exponents are higher than 2.5, and thecorresponding water saturations (CALC_SW) arehigher than 50.0%. However, for formations withacquired wide NMR T2 spectra (2193.0 to 2200.5 m[7195.2–7219.8 ft]), the predicted saturation expo-nents are close to 1.0, the corresponding water sat-urations are lower than 35.0%, and they coincide withthe core-derived water saturation. Low water satura-tion means a high bulk volume fraction of oil, andthus a high oil productive capacity. This prediction is
verified by theDST data in the interval of 2197.0 to2201.0 m (7208.4–7221.5 ft), which showed thatapproximately 152.95 bbl of oil was produced perday with no water.
DISCUSSION
The results of the study suggest that the proposedmethod is broadly applicable, the relationship be-tween water saturation versus resistivity index can besynthesized from NMR data, and an accurate satu-ration exponent is predicted. It is worth noting thatthe power function relationship between the NMRT2 values and the experimental resistivity index isnot universal for all core samples and samples drilledfrom different locations. This power function is usedto transform the T2 values into the resistivity indexonly in core samples that contain similar pore struc-tures and physical properties. Once the pore structuresand physical properties of the core samples differ, theyshould first be classified. The established model canthus be used to accurately predict the resistivity indexafter similar clusters of core samples are identified.
Figure 18. Relationship between the transverse relaxation (T2)value and resistivity index for all 10 core samples drilled from theTriassic Chang 8 tight sandstone reservoirs in the Longdong areaof Ordos Basin, China. This figure illustrates that for all coresamples, a single power function relation can be used to expressthis relationship. R = correlation coefficient.
Figure 19. Relationship between the experimental saturationexponents and the predicted results from nuclear magneticresonance (NMR) data for 10 core samples drilled from theTriassic Chang 8 tight sandstone reservoirs in the Longdong areaof Ordos Basin, China.
Xiao et al. 1027
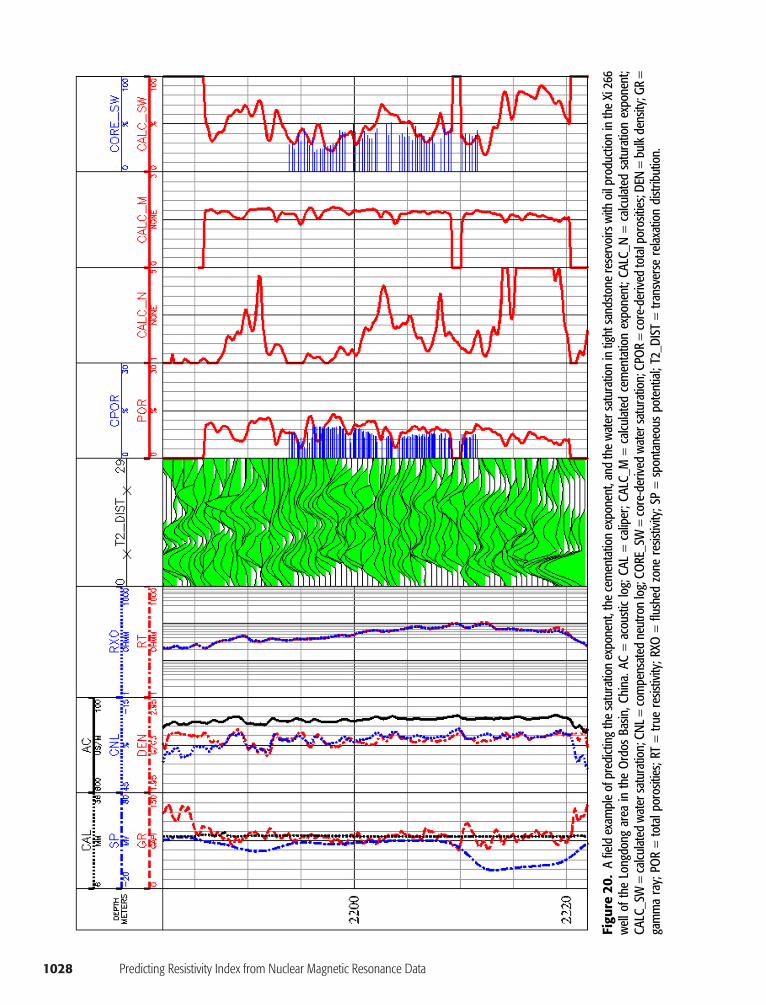
Figu
re20
.Afieldexam
pleofpredictingthesaturationexponent,the
cementationexponent,and
thewatersaturationintightsandsto
nereservoirswith
oilproductionintheXi266
wellofthe
Longdong
area
intheOrdos
Basin
,China.A
C=acousticlog;CA
L=caliper;C
ALC_
M=calcu
latedcementationexponent;C
ALC_
N=calcu
latedsaturationexponent;
CALC_SW=calcu
latedwatersaturation;CN
L=compensated
neutronlog;CO
RE_SW=core-derive
dwatersaturation;CPOR=core-derive
dtotalporosities;D
EN=bulkdensity;G
R=
gammaray;PO
R=totalporosities;RT=tru
eresistivity;R
XO=flushedzone
resistivity;SP=spontaneouspotential;T2_D
IST=transverserelaxationdistribution.
1028 Predicting Resistivity Index from Nuclear Magnetic Resonance Data
CONCLUSIONS
The saturation exponent is a very important inputparameter in water saturation estimation based uponthe Archie equation. In conventional reservoirs, asingle value of the saturation exponent can be acquiredbased on laboratory resistivity experiments. However,it is difficult to directly predict water saturation byusing a single saturation exponent in tight sandstonereservoirs. The values of the saturation exponent arestrongly affected by rock pore structure and vary basedon this property. To improve the accuracy of the pre-dicted water saturation, various saturation exponentsshould be used.
In this study, a theoretical model that associatesthe NMR T2 values with the resistivity indexes basedon the derivation of fractal theory and the Archieequation is established. By using this model, the NMRT2 data can be transformed into a synthesized curveof the water saturation versus the resistivity index, andthen the saturation exponent can be precisely esti-mated. In addition, by combining the technique ofpredicting a cementation exponent from total poros-ity, the water saturation can be calculated from theporosity and resistivity logs.
The method developed in this study has beensuccessfully applied to core samples drilled frommultiple locations and field applications in China.The results show that the predicted saturation expo-nents and water saturation match with the core-derived results very well.
REFERENCES CITED
Adebayo, A. R., H. Y. Al-Yousef, andM. A.Mahmoud, 2015,An investigation of the effect of CO2–brine–rock inter-action on determination of Archie’s saturation exponentfor carbon dioxide evaluation in carbonate reservoirs:Journal of Petroleum Science Engineering, v. 133,p. 665–676, doi:10.1016/j.petrol.2015.05.005.
Akkurt, R., H. J. Vinegar, P. N. Tutunjian, and A. J. Guillory,1996, NMR logging of natural gas reservoirs: Log Ana-lyst, v. 37, no. 6, p. 33–42.
Al-Amri, M., M. Mahmoud, S. Elkatatny, H. Al-Yousef, andT. Al-Ghamdi, 2017, Integrated petrophysical and res-ervoir characterization workflow to enhance permeabil-ity and water saturation prediction: Journal of AfricanEarth Sciences, v. 131, p. 105–116, doi:10.1016/j.jafrearsci.2017.04.014.
Amadu, M., and M. J. Pegg, 2018, Theoretical and experi-mental determination of the fractal dimension and pore
size distribution index of a porous sample using spon-taneous imbibition dynamics theory: Journal of Petro-leum Science Engineering, v. 167, p. 785–795, doi:10.1016/j.petrol.2018.04.037.
Amiri, M., G. Zahedi, and M. H. Yunan, 2015, Water satu-ration estimation in tight shaly gas sandstones by appli-cation of Progressive Quasi-Static (PQS) algorithm—Acase study: Journal of Natural Gas Science and Engi-neering, v. 22, p. 468–477, doi:10.1016/j.jngse.2014.12.027.
Angulo, R. F., V. Alvarado, and H. Gonzalez, 1992, Fractaldimensions from mercury intrusion capillary tests: So-ciety of Petroleum Engineers Latin America PetroleumEngineering Conference, Caracas, Venezuela, March8–11, 1992, SPE-23695-MS, 9 p.
Archie, G. E., 1942, The electrical resistivity log as an aid indetermining some reservoir characteristics: Transactionsof theAIME, v. 146, no. 1, p. 54-62, doi:10.2118/942054-G.
Ayadiuno, C. B., S. Khan, A. A. Alabbad, and F. Almohsen,2017, Investigating low resistivity-low contrast resistivitypay in a permo-carboniferous reservoir, central SaudiArabia: Abu Dhabi International Petroleum Exhibi-tion and Conference, AbuDhabi, United Arab Emirates,November 13–16, 2017, SPE-188887-MS, 17 p., doi:10.2118/188887-MS.
Baziar, S., H. B. Shahripour, M. Tadayoni, and M. Nabi-Bidhendi, 2018, Prediction of water saturation in a tightgas sandstone reservoir by using four intelligent methods:A comparative study: Neural Computing and Applications,v. 30, no. 4, p. 1171–1185, doi:10.1007/s00521-016-2729-2.
Beltran, A., O. Chavez, J. Zaldivar, F. A. Godinez, A. Garcia,and R. Zenit, 2017, A newmodel for the computation ofthe formation factor of core rocks: Journal of StructuralGeology, v. 97, p. 189–198, doi:10.1016/j.jsg.2017.03.001.
Buiting, J. J. M., and E. A. Clerke, 2013, Permeability fromporosimetry measurements: Derivation for a tortuousand fractal tubular bundle: Journal of Petroleum Sci-ence Engineering, v. 108, p. 267–278, doi:10.1016/j.petrol.2013.04.016.
Burstrom, H., 1966, Definition and determination of watersaturation: Protoplasma, v. 61, no. 3–4, p. 294–301, doi:10.1007/BF01248986.
Cai, J., W. Wei, X. Hu, and D. A. Wood, 2017, Electricalconductivity models in saturated porous media: A re-view: Earth-Science Reviews, v. 171, p. 419–433, doi:10.1016/j.earscirev.2017.06.013.
Carman, P. C., 1937, Fluid flow through granular beds:Chemical Engineering Research and Design, v. 75, p. S32–S48, doi:10.1016/S0263-8762(97)80003-2.
Claverie, M., D. F. Allen, N. J. Heaton, and G. A. Bordakov,2010, A new look at low-resistivity and low-contrast(LRLC) pay in clastic reservoirs: Society of PetroleumEngineers Annual Technical Conference and Exhibi-tion, Florence, Italy, September 19–22, 2010, SPE-134402-MS, 12 p.
Clavier, C., G. Coates, and J. Dumanoir, 1984, Theoreticaland experimental bases for the dual-water model forinterpretation of shaly sands: Society of Petroleum
Xiao et al. 1029
Engineers Journal, v. 24, no. 2, p. 153–168, doi:10.2118/6859-PA.
Coates, G. R., L. Z. Xiao, and M. G. Primmer, 2000, NMRlogging principles and applications: Houston, Texas, GulfPublishing Company, 256 p.
Cook, A. E., and W. F. Waite, 2018, Archie saturation ex-ponent for natural gas hydrate in coarse-grained reservoirs:Journal of Geophysical Research: Solid Earth, v. 123,no. 3, p. 2069–2089, doi:10.1002/2017JB015138.
Doll, H. G., 1948, The SP log: Theoretical analysis and prin-ciples of interpretation: Transactions of the AIME, v. 179,no. 1, p. 146–185, doi:10.2118/949146-G.
Doll, H. G., 1950, The SP log in shaly sands: Journal of Pe-troleum Technology, v. 2, no. 7, p. 205–214, doi:10.2118/950205-G.
Dunn, K. J., D. J. Bergman, and G. A. Latorraca, 2002,Nuclear magnetic resonance: Petrophysical and loggingapplications: New York, Pergamon, Handbook of Geo-physical Exploration: Seismic Exploration, v. 32, 293 p.
Freedman, R., C. C. Minh, G. Gubelin, J. J. Freeman,T. McGinness, B. Terry, and D. Rawlence, 1998, Com-bining NMR and density logs for petrophysical analysis ingas-bearing formations: Society of Petrophysicists andWellLog Analysts 39th Annual Logging Symposium, Keystone,Colorado, May 26–28, 1998, 14 p.
Friesen, W. I., and R. J. Mikula, 1987, Fractal dimensions ofcoal particles: Journal of Colloid and Interface Science,v. 120, no. 1, p. 263–271, doi:10.1016/0021-9797(87)90348-1.
Ge, X., Y. Fan, X. Zhu, Y. Chen, and R. Li, 2015, Deter-mination of nuclear magnetic resonance T2 cutoff valuebased on multifractal theory—An application in sand-stone with complex pore structure: Geophysics, v. 80,no. 1, p. D11–D21, doi:10.1190/geo2014-0140.1.
Givens, W. W., 1987, A conductive rock matrix model(CRMM) for the analysis of low-contrast resistivityformations: Log Analyst, v. 28, no. 2, p. 138–151.
Givens, W. W., and E. J. Schmidt, 1988, A generic electricalconduction model for low-contrast resistivity sandstones:Society of Petrophysicists and Well Log Analysts 29thAnnual Logging Symposium, San Antonio, Texas, June5–8, 1988, 25 p.
Gu, Y., Z. Bao, Y. Lin, Z. Qin, J. Lu, and H.Wang, 2017, Theporosity and permeability predictionmethods for carbonatereservoirs with extremely limited logging data: Stepwiseregression vs. N-way analysis of variance: Journal ofNatural Gas Science and Engineering, v. 42, p. 99–119,doi:10.1016/j.jngse.2017.03.010.
Guo, Y., B. Pan, and L. Zhang, 2017, A new method toidentify reservoirs in tight sandstones based on the newmodel of transverse relaxation time and relative permeabil-ity: Geofluids, v. 2017, 8 p, doi:10.1155/2017/6787038.
Guo, Y.-h., B.-z. Pan, L.-h. Zhang, and C.-h. Fang, 2018,Research and application of the relationship betweentransverse relaxation time and resistivity index in tightsandstone reservoir: Journal of Petroleum Science En-gineering, v. 160, p. 597–604, doi:10.1016/j.petrol.2017.01.034.
Hamada, G. M., and M. A. Abu-Shanab, 2007, Better po-rosity estimate of gas sandstone reservoirs using densityand NMR logging data: Asia Pacific Oil and Gas Confer-ence and Exhibition, Jakarta, Indonesia, October 30–November 1, 2007, SPE-106627-MS, 6 p.
Hao, F., T. Guo, Y. Zhu, X. Cai, H. Zou, and P. Li, 2008,Evidence for multiple stages of oil cracking and ther-mochemical sulfate reduction in the Puguang gas field,Sichuan Basin, China: AAPG Bulletin, v. 92, no. 5,p. 611–637, doi:10.1306/01210807090.
Hirasaki, G. J., S. W. Lo, and Y. Zhang, 2003, NMR prop-erties of petroleum reservoir fluids: Magnetic ResonanceImaging, v. 21, no. 3–4, p. 269–277, doi:10.1016/S0730-725X(03)00135-8.
Hossain, S. Z., and K. G. Mumford, 2017, Capillary pressure-saturation relationships for diluted bitumen and water ingravel: Journal of Hydrology, v. 551, no. S1, p. 306–313,doi:10.1016/j.jhydrol.2017.06.007.
Hou, X., Y. Zhu, S. Chen, Y. Wang, and Y. Liu, 2020, In-vestigation on pore structure and multifractal of tightsandstone reservoirs in coal bearing strata using LF-NMRmeasurements: Journal of Petroleum Science and Engi-neering, v. 187, 106757, doi:10.1016/j.petrol.2019.106757.
Huang, D., L.. Sima, F. Wu, L. Wang, and Q. Li, 2015, Es-timating saturation exponent from NMR logging: Ara-bian Journal of Geosciences, v. 8, no. 9, p. 6771–6778,doi:10.1007/s12517-014-1768-1.
Kleinberg, R. L., and H. J. Vinegar, 1996, NMR properties ofreservoir fluids: Log Analyst, v. 37, no. 6, p. 20–32.
Kozeny, J., 1927, Ueber kapillare Leitung des Wassers imBoden [in German]: Sitzungsberichte der KaiserlichenAkademie der Wissenschaften in Wien, v. 136, no. 2a,p. 271–306.
Kuang, Y., L. Sima, Z. Zhang, Z. Wang, and M. Chen, 2017,A model for estimating the saturation exponent based onNMR in tight sandy conglomerate reservoirs: ArabianJournal for Science and Engineering, v. 43, no. 11,p. 6305–6313, doi:10.1007/s13369-017-3013-1.
Kumar, M., T. J. Senden, A. P. Sheppard, C. H. Arns, andM. A. Knackstedt, 2011, Probing the Archie’s exponentunder variable saturation conditions: Petrophysics, v. 52,no. 2, p. 124–134.
Lai, J., G. Wang, C. Cai, Z. Fan, S. Wang, J. Chen, andG. Luo, 2018, Diagenesis and reservoir quality in tightgas sandstones: The fourth member of the Upper TriassicXujiahe Formation, Central Sichuan Basin, SouthwestChina: Geological Journal, v. 53, no. 2, p. 629–646, doi:10.1002/gj.2917.
Li, K., 2010, Analytical derivation of Brooks-Corey typecapillary pressure models using fractal geometry andevaluation of rock heterogeneity: Journal of PetroleumScience and Engineering, v. 73, no. 1–2, p. 20–26, doi:10.1016/j.petrol.2010.05.002.
Li, K., 2011, Interrelationship between resistivity index,capillary pressure and relative permeability: Transportin Porous Media, v. 88, no. 3, p. 385–398, doi:10.1007/s11242-011-9745-6.
Liu, H.-n., S.-j. Huang, L.-l. Deng, and M. Wu, 2008, Pre-cipitation interaction of authigenic clay minerals for
1030 Predicting Resistivity Index from Nuclear Magnetic Resonance Data
clastic reservoirs and its effect on reservoirs: A case studyof sandstones of Xujiahe Formation of Upper TriassicfromWestern Sichuan Depression: Geology andMineralResources of South China, v. 4, no. 1, p. 1–7, doi:10.3969/j.issn.1007-3701.2008.04.001.
Liu, X. J., H. Liu, and C. Yang, 2011, Experimental study onrock-electricity parameters of carbonate gas reservoirs:Acta Petrolei Sinica, v. 32, no. 1, p. 131–134, doi:10.7623/syxb201101021.
Mao, Z., F. Gong, C. Liu, D. Zhu, and Z. Zuo, 1999a, Ex-perimental study on the gensis of low resistivity pay zonein north region of Tarim basin (I): Well Logging Tech-nology, v. 23, no. 4, p. 404–410.
Mao, Z., Z. Wang, Y. Jin, W. Zhou, X. Liu, and B. Xie, 2007,Study on petrophysical foundation, methodology andtechniques of logging reservoir evaluation for UpperTriassic Xujiahe Formation in Sichuan Basin:Well LoggingTechnology, v. 31, no. 3, p. 203–206, doi:10.16489/j.issn.1004-1338.2007.03.006.
Mao, Z., W. Zhu, and R. Wang, 1999b, Experimental studyon the gensis of low resistivity pay zone in north region ofTarim basin (II): Well Logging Technology, v. 23, no. 6,p. 404–410.
Mardi, M., H. Nurozi, and S. Edalatkhah, 2012, A watersaturation prediction using artificial neural networks andan investigation on cementation factors and saturationexponent variations in an Iranian oil well: Petroleum Sci-ence and Technology, v. 30, no. 4, p. 425–434, doi:10.1080/10916460903452033.
Minh, C. C., V. Jain, D. Maggs, and D. Murray, 2018, Esti-mation of Sw from NMR T2 logging: Society of Petro-physicists and Well Log Analysts 59th Annual LoggingSymposium, London, June 2–6, 2018, 19 p.
Mirzaei-Paiaman, A., M. Ostadhassan, R. Rezaee, H. Saboorian-Jooybari, and Z. Chen, 2018, A new approach in pet-rophysical rock typing: Journal of Petroleum ScienceEngineering, v. 166, p. 445–464, doi:10.1016/j.petrol.2018.03.075.
Pan, B., C. Fang, Y. Guo, L. Zhang, J. Lei, and Y. Fan, 2018,Logging evaluation and productivity prediction of Suligetight sandstone reservoirs based on petrophysics trans-formation models: Chinese Journal of Geophysics, v. 61,no. 12, p. 5115–5124, doi:10.6038/cjg2018L0724.
Pfeifer, P., and D. Avnir, 1983, Chemistry in noninteger di-mensions between two and three (I): Fractal theory ofheterogeneous surface: Journal of Chemical Physics, v. 79,no. 7, p. 3558–3565, doi:10.1063/1.446210.
Qin, Z., H. Pan, H. Ma, A. A. Konate, M. Hou, and S. Luo,2016, Fast prediction method of Archie’s cementationexponent: Journal of Natural Gas Science and Engi-neering, v. 34, p. 291–297, doi:10.1016/j.jngse.2016.06.070.
Rafik, B., and B. Kamel, 2017, Prediction of permeability andporosity from well log data using the nonparametric re-gression with multivariate analysis and neural network,Hassi R’Mel Field, Algeria: Egyptian Journal of Petro-leum, v. 26, no. 3, p. 763–778, doi:10.1016/j.ejpe.2016.10.013.
Rasmus, J. C., 1987, A summary of the effects of various poregeometries and their wettabilities on measured and in-situ values of cementation and saturation exponents: LogAnalyst, v. 38, no. 2, p. 152–164.
Shedid, S. A., and M. A. Saad, 2017, Comparison and sensi-tivity analysis of water saturationmodels in shaly sandstonereservoirs using well logging data: Journal of PetroleumScience Engineering, v. 156, p. 536–545, doi:10.1016/j.petrol.2017.06.005.
Simandoux, P., 1963, Dielectric measurements on porousmedia and application to the measurements of watersaturation: Study of behavior of Argillaceous Formations:Revue de l’Instiut Francase du Petrol, v. 18, p. 193–215.
Smits, L. J. M., 1968, SP log interpretation in shaly sands:Society of Petroleum Engineers Journal, v. 8, no. 2,p. 123–136, doi:10.2118/1863-B.
Volokitin, Y., W. J. Looyestijn, W. F. J. Slijkerman, andJ. P. Hofman, 2001, A practical approach to obtainprimary drainage capillary pressure curves from NMRcore and log data: Petrophysics, v. 42, no. 4, p. 334–343.
Wang, H., andM. C. Fehler, 2018a, The wavefield of acousticlogging in a cased-hole with a single casing—Part I: Amonopole tool: Geophysical Journal International, v. 212,no. 1, p. 612–626, doi:10.1093/gji/ggx437.
Wang, H., andM. C. Fehler, 2018b, The wavefield of acousticlogging in a cased hole with a single casing—Part II: Adipole tool: Geophysical Journal International, v. 212,no. 2, p. 1412–1428, doi:10.1093/gji/ggx475.
Waxman, M. H., and L. J. M. Smits, 1968, Electrical con-ductivities in oil-bearing shaly sands: SPE FormationEvaluation, v. 8, no. 2, p. 107–122, doi:10.2118/1863-A.
Waxman, M. H., and E. C. Thomas, 1974, Electrical con-ductivities in shaly sands: I. The relation between hydro-carbon saturation and resistivity index; II. The temperaturecoefficient of electrical conductivity: Journal of PetroleumTechnology, v. 26, no. 2, p. 213–225, doi:10.2118/4094-PA.
Waxman,M.H., and E. C. Thomas, 2007, Technical note: Anaddendum to electrical conductivities in shaly sands: I.The relation between hydrocarbon saturation and resis-tivity index; II. The temperature coefficient of electricalconductivity: SPE Journal, v. 12, no. 3, SPE-109632-PA,p. 392, doi:10.2118/109632-PA.
Wei, W., J. Cai, X. Hu, and Q. Han, 2015, An electricalconductivity model for fractal porous media: GeophysicalResearch Letters, v. 42, no. 12, p. 4833–4840, doi:10.1002/2015GL064460.
Widmyer, R. H., and G. M. Wood, 1958, Evaluation of po-rosity derivation from neutron logs: Journal of PetroleumTechnology, v. 10, no. 5, p. 57–60, doi:10.2118/961-G.
Wu, P. Y., B. Z. Hsieh, G. V. Chiling, and Z. S. Lin, 2008,Estimation of water saturation in rocks with conductivematrix: Energy Sources: Part A, Recovery, Utilization,and Environmental Effects, v. 30, no. 5, p. 401–410, doi:10.1080/15567030701833766.
Wyllie, M. R. J., A. R. Gregory, and L. W. Gardner, 1956,Elastic wave velocities in heterogeneous and porousmedia: Geophysics, v. 21, no. 1, p. 41–70, doi:10.1190/1.1438217.
Xiao et al. 1031
Xiao, L., J. R. Li, Z. Q. Mao, J. Lu, H. Y. Yu, H. P. Guo, andG. R. Li, 2018, A method to determine nuclear magneticresonance (NMR) T2 cutoff based on normal distributionsimulation in tight sandstone reservoirs: Fuel, v. 225,p. 472–482, doi:10.1016/j.fuel.2018.03.178.
Xiao, L., Z.-q. Mao, and Y. Jin, 2015, Tight gas sandstonereservoirs evaluation from nuclear magnetic resonance(NMR) logs: Case studies: Arabian Journal for Scienceand Engineering, v. 40, no. 4, p. 1223–1237, doi:10.1007/s13369-015-1608-y.
Xiao, L., Z.-q. Mao, G.-r. Li, and Y. Jin, 2013a, Estimation ofsaturation exponent from nuclear magnetic resonance(NMR) logs in low permeability reservoirs: AppliedMagnetic Resonance, v. 44, no. 3, p. 333–347, doi:10.1007/s00723-012-0366-1.
Xiao, L., Z.-q. Mao, C.-c. Zou, Y. Jin, and J.-c. Zhu, 2016, Anew methodology of constructing pseudo capillary pres-sure (Pc) curves from nuclear magnetic resonance (NMR)logs: Journal of Petroleum Science Engineering, v. 147,p. 154–167, doi:10.1016/j.petrol.2016.05.015.
Xiao, L., C.-c. Zou, Z.-q. Mao, Y.-j. Shi, X.-p. Liu, Y. Jin,H.-p. Guo, and X.-x. Hu, 2013b, Estimation of watersaturation from nuclear magnetic resonance (NMR) andconventional logs in low permeability sandstone reser-voirs: Journal of Petroleum Science Engineering, v. 108,p. 40–51, doi:10.1016/j.petrol.2013.05.009.
Xu, A., Z. Wang, C. Bian, Z. Xu, and X. Zhai, 2013,Comprehensive prediction of favorable gas reservoir inthe large-scale tight sandstone of Upper Triassic XujiaheFormation in Hechuan Area of Sichuan Basin, China:AAPG Search and Discovery article 50805, accessedMarch 24, 2021, http://www.searchanddiscovery.com/pdf/documents/2013/50805xu/ndx_xu.pdf.html.
Zeng, L., 2010, Microfracturing in the Upper Triassic SichuanBasin tight-gas sandstones: Tectonic, overpressure, anddiagenetic origins: AAPG Bulletin, v. 94, no. 12, p. 1811–1825, doi:10.1306/06301009191.
Zhang, C. M., Z. B. Chen, Z. S. Zhang, J. Li, H. S. Lin, andB. D. Sun, 2007, Fractal characteristics of reservoir rockpore structure based on NMR T2 distribution: Journal ofOil and Gas Technology, v. 29, no. 4, p. 80–86.
Zhang, Z., and A. Weller, 2014, Fractal dimension of pore-space geometry of an Eocene sandstone formation:Geophysics, v. 79, no. 6, p. D377–D387, doi:10.1190/geo2014-0143.1.
Zheng, T., X. Ma, X. Pang, W. Wang, D. Zheng, Y. Huang,X. Wang, and K. Wang, 2019, Organic geochemistry ofthe Upper Triassic T3x
5 source rocks and the hydrocar-bon generation and expulsion characteristics in SichuanBasin, central China: Journal of Petroleum Science En-gineering, v. 173, p. 1340–1354, doi:10.1016/j.petrol.2018.10.070.
1032 Predicting Resistivity Index from Nuclear Magnetic Resonance Data


![RESISTIVITY [ ]](https://img.pdfslide.net/doc/110x75/6249524a7a9f6a12787a8128/resistivity-.jpg)