Embed Size (px)
Citation preview

August 20, 2003 9:14 WSPC/115-IJPRAI 00271
International Journal of Pattern Recognitionand Artificial IntelligenceVol. 17, No. 6 (2003) 903–929c© World Scientific Publishing Company
A METHODOLOGY FOR FEATURE SELECTION USING
MULTIOBJECTIVE GENETIC ALGORITHMS FOR
HANDWRITTEN DIGIT STRING RECOGNITION
L. S. OLIVEIRA∗ and R. SABOURIN
Ecole de Technologie Superieure (ETS),Laboratoire d’Imagerie, de Vision et d’Intelligence Artificielle (LIVIA),
Department de Genie de la Production Automatisee (GPA),1100, rue Notre Dame Ouest, Montreal, Canada H3C 1K3
F. BORTOLOZZI
Pontifıcia Universidade Catolica do Parana (PUCPR),Rua Imaculada Conceicao 1155, Prado Velho, 80215-901, Curitiba Pr, Brazil
C. Y. SUEN
Centre for Pattern Recognition and Machine Intelligence (CENPARMI),1455 de Maisonneuve Blvd. West, Suite GM 606 - Montreal, Canada H3G 1M8
In this paper a methodology for feature selection for the handwritten digit string recog-nition is proposed. Its novelty lies in the use of a multiobjective genetic algorithm wheresensitivity analysis and neural network are employed to allow the use of a representativedatabase to evaluate fitness and the use of a validation database to identify the subsets ofselected features that provide a good generalization. Some advantages of this approachinclude the ability to accommodate multiple criteria such as number of features andaccuracy of the classifier, as well as the capacity to deal with huge databases in order toadequately represent the pattern recognition problem. Comprehensive experiments onthe NIST SD19 demonstrate the feasibility of the proposed methodology.
1. Introduction
An important issue in constructing classifiers is the selection of the best discrimi-
native features. In many applications, it is not unusual to find problems involving
hundreds of features. However, it has been observed that beyond a certain point,
the inclusion of additional features leads to a worse rather than better performance.
Moreover, the choice of features to represent the patterns affects several aspects of
the pattern recognition problem such as accuracy, required learning time, and the
necessary number of samples.
∗Author for correspondence.
903

August 20, 2003 9:14 WSPC/115-IJPRAI 00271
904 L. S. Oliveira et al.
This apparent paradox presents us with a feature selection problem in automatic
design of pattern classifiers. Such a problem refers to the task of identifying and
selecting an effective subset of features to represent patterns from a larger set of
often mutually redundant or even irrelevant features. This is not a trivial problem
since features are seldom entirely independent. There may be redundancy, where
certain features are correlated so that it is not necessary to include all of them in
modeling, and interdependence, where two or more features between them convey
important information that is obscure if any of them is included on its own.
In the context of practical applications such as handwriting recognition, feature
selection presents a multicriterion optimization function, e.g. number of features
and accuracy of classification. Genetic algorithms offer a particularly attractive ap-
proach to solve this kind of problems since they are generally quite effective in rapid
global search of large, nonlinear and poorly understood spaces. It has been shown
that genetic algorithms can be applied to general NP-complete problems. More-
over, simultaneous allocation of search effort to many regions of the search space
contributes the power of genetic algorithm. It is called implicit parallelism and has
been proved that it can set a lower bound of an N 3 speedup over systematic sequen-
tial search,13 where N is the population size. In the last decade, genetic algorithms
have been largely applied to the feature selection problem.18,30,34,37 The approach
often combines different optimization objectives into a single objective function.
The main drawback of this kind of strategy lies in the difficulty of exploring differ-
ent possibilities of trade-off between classification accuracy and different subsets of
selected features. In order to overcome this kind of problem, Emmanouilidis et al.6
proposed the use of a multiobjective genetic algorithm to perform feature selection.
In this work we discuss the use of multiobjective genetic algorithms as a means to
search for subsets of features, which contain discriminatory information to classify
handwritten digit strings. The proposed strategy takes into account an efficient
multiobjective genetic algorithm35 to generate a set of alternative solutions and the
use of a cross-validation method to indicate the best accuracy/complexity (number
of features) trade-off. We demonstrate that the cross-validation is very important
when working with a set of alternative solutions and it cannot be neglected as
in Ref. 6. The classification accuracy is supplied by multilayer perceptron neural
networks in conjunction with the sensitivity analysis.24 Such an approach makes
it feasible to deal with huge databases in order to better represent the pattern
recognition problem during the fitness evaluation. Some advantages of the proposed
methodology include the ability to accommodate multiple criteria such as number
of features and accuracy of the classifier, as well as the capacity to deal with huge
databases in order to represent well the pattern recognition problem. Moreover,
the use of the multiobjective genetic algorithms help to avoid the phenomenon of
premature convergence presented by simple genetic algorithms. To make this paper
more concise we have chosen to focus our attention on the proposed methodology
rather than comparing it with classical approaches. This is based on the fact that
several studies in the literature have been demonstrated that genetic algorithms

August 20, 2003 9:14 WSPC/115-IJPRAI 00271
A Methodology for Feature Selection 905
would be more effective than other methods when dealing with large-scale feature
selection (i.e. more than 50 features). For those readers interested in comparative
studies, please see Refs. 7, 17 and 34.
In order to show the robustness of the proposed strategy, we carry out exper-
iments in two different contexts: isolated digits and string of digits. The latter is
more difficult since we need to deal with problems such as fragmentation, overlap-
ping and effects of segmentation. Finally, we analyze several solutions provided by
the feature selection algorithm and show that there is a relationship between some
discarded features and the strategy of zoning we choose. All experiments reported
in this work use NIST SD19.
This paper is structured as follows. Section 2 summarizes different approaches
to select feature subsets. Section 3 presents the general multiobjective problem
as well as different strategies applied to solve such a problem. Section 4 describes
the real world problem used in our experiments. Section 5 describes the proposed
methodology and Sec. 6 reports the results of experiments carried out and some
discussion as well. Finally, Sec. 7 presents some discussion and Sec. 8 concludes this
paper.
2. Related Works
The preliminary works on feature selection started in the early 1960s. The ap-
proaches at that time were based on probabilistic measures of class separability
and on entropies. In most of the methods the independence of features was as-
sumed and the features were selected on the basis of their individual merits. Since
such methods ignore the interactions among features, they usually produce unsat-
isfactory subsets of features.
In order to perform feature selection taking into account the relationship
between features, three approaches can be found in the literature3: Complete,
Heuristic and Randomized searches. Since complete search over all possible sub-
sets of a feature set (2N where N is the number of features) is not computationally
feasible in practice, several authors have explored the use of heuristics for feature
subset selection, often in conjunction with branch and bound search. Forward selec-
tion and backward elimination are the most common sequential branch and bound
search algorithms used in feature selection.14,25 Most of the current approaches
assume monotonicity of some measure of classification performance. This ensures
that adding features does not worsen the performance. However, many practical
scenarios do not satisfy the monotonicity assumption. Moreover, this kind of search
is not designed to handle multiple selection criteria.
Randomized algorithms make use of randomized or probabilistic steps or sam-
pling processes. Several researchers have explored the use of such algorithms for
feature selection16,20 while others have explored the use of randomized population-
based heuristic search techniques such as genetic algorithms for feature selection
for decision tree and nearest neighbor classifier15,31,34 or neural networks.37,38 The

August 20, 2003 9:14 WSPC/115-IJPRAI 00271
906 L. S. Oliveira et al.
advantage of feature selection techniques that employ genetic algorithms is that
they do not require the restrictive monotonicity assumption. They can also deal
with the use of multiple selection criteria, e.g. classification accuracy, feature mea-
surement cost, etc. This makes them particularly attractive in the design of pat-
tern classifiers in many practical scenarios such as signature verification,28 medical
diagnosis,37 facial modeling12 and handwriting recognition.15
Due to the ability of genetic algorithms to deal with multiobjective optimization,
several authors have explored genetic algorithms for feature selection for handwrit-
ten character recognition.15,21,33 Feature selection using genetic algorithm is often
performed by aggregating different objectives into a single and parameterized ob-
jective, which is achieved through a linear combination of the objectives. The main
drawback of this approach is that it is very difficult to explore different trade-offs
between accuracy and different subsets of selected features.
In order to overcome this kind of problem, Emmanouilidis et al.6 proposed the
use of a multicriteria genetic algorithm to perform feature selection. Notwithstand-
ing that only small databases were considered in this work, they achieved interesting
results.
2.1. Filter and wrapper approaches to feature selection
Feature selection algorithms can also be classified into two categories based on
whether or not feature selection is performed independently of the learning algo-
rithm used to construct the classifier. If feature selection is done independently of
the learning algorithm, the technique is said to follow a filter approach. Otherwise,
it is said to follow a wrapper approach.14 While the filter approach is generally
computationally more efficient than the wrapper approach, its major drawback is
that an optimal selection of features may not be independent of the inductive and
representational biases of the learning algorithm that is used to construct the classi-
fier. On the other hand, the wrapper approach involves the computational overhead
of evaluating candidate feature subsets by executing a given learning algorithm on
the database using each feature subset under consideration.
3. Multiobjective Optimization Using Genetic Algorithms
3.1. Definitions
A general multiobjective optimization problem consists of a number of objectives
and it is associated with a number of inequality and equality constraints. Mathe-
matically, the problem can be written as follows.29
Minimize (or Maximize) fi(x) i = 1, . . . , N
subject to :
{
gj(x) ≤ 0 j = 1, 2, . . . , J
hk(x) = 0 k = 1, 2, . . . , K .(1)
August 20, 2003 9:14 WSPC/115-IJPRAI 00271
A Methodology for Feature Selection 907
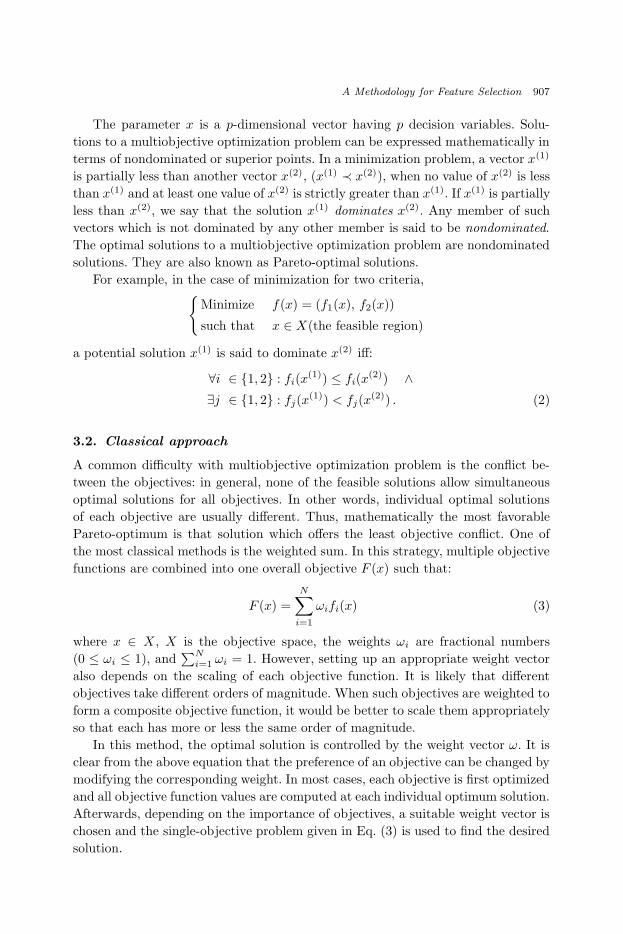
The parameter x is a p-dimensional vector having p decision variables. Solu-
tions to a multiobjective optimization problem can be expressed mathematically in
terms of nondominated or superior points. In a minimization problem, a vector x(1)
is partially less than another vector x(2), (x(1) ≺ x(2)), when no value of x(2) is less
than x(1) and at least one value of x(2) is strictly greater than x(1). If x(1) is partially
less than x(2), we say that the solution x(1) dominates x(2). Any member of such
vectors which is not dominated by any other member is said to be nondominated.
The optimal solutions to a multiobjective optimization problem are nondominated
solutions. They are also known as Pareto-optimal solutions.
For example, in the case of minimization for two criteria,{
Minimize f(x) = (f1(x), f2(x))
such that x ∈ X(the feasible region)
a potential solution x(1) is said to dominate x(2) iff:
∀i ∈ {1, 2} : fi(x(1)) ≤ fi(x
(2)) ∧∃j ∈ {1, 2} : fj(x
(1)) < fj(x(2)) . (2)
3.2. Classical approach
A common difficulty with multiobjective optimization problem is the conflict be-
tween the objectives: in general, none of the feasible solutions allow simultaneous
optimal solutions for all objectives. In other words, individual optimal solutions
of each objective are usually different. Thus, mathematically the most favorable
Pareto-optimum is that solution which offers the least objective conflict. One of
the most classical methods is the weighted sum. In this strategy, multiple objective
functions are combined into one overall objective F (x) such that:
F (x) =N
∑
i=1
ωifi(x) (3)
where x ∈ X , X is the objective space, the weights ωi are fractional numbers
(0 ≤ ωi ≤ 1), and∑N
i=1 ωi = 1. However, setting up an appropriate weight vector
also depends on the scaling of each objective function. It is likely that different
objectives take different orders of magnitude. When such objectives are weighted to
form a composite objective function, it would be better to scale them appropriately
so that each has more or less the same order of magnitude.
In this method, the optimal solution is controlled by the weight vector ω. It is
clear from the above equation that the preference of an objective can be changed by
modifying the corresponding weight. In most cases, each objective is first optimized
and all objective function values are computed at each individual optimum solution.
Afterwards, depending on the importance of objectives, a suitable weight vector is
chosen and the single-objective problem given in Eq. (3) is used to find the desired
solution.

August 20, 2003 9:14 WSPC/115-IJPRAI 00271
908 L. S. Oliveira et al.
f 2
f 1
A W 1
W 2 d
a
b
c
Pareto-optimal front
Feasible objective space
Fig. 1. Illustration of the weighted sum approach on a convex Pareto-optimal front.
Figure 1 shows an example of this approach where a two-objective problem
is considered.4 Once the weight vector is defined we can calculate the composite
function F . Its contour surface can then be visualized in the objective space, as
shown by lines “a”, “b”, “c” and “d”. Since F is a linear combination of both
objectives f1 and f2, we would expect a straight line as the contour line of F on
the objective space. This is because any solution on the contour line will have the
same F value. If considered carefully, this contour line is not an arbitrary one. Its
slope is related to the choice of the weight vector. In fact, for two objectives, its
slope is −w1/w2. The location of the line depends on the value of F on any point of
the line. The effect of lowering the contour line from “a” to “b” is in effect jumping
from solutions of higher F values to a lower one.
In a minimization problem, the task is to find the contour line with the minimum
F value. This happens with the contour line which is tangential to the search space
and also lies in the bottom-left corner of this space. In Fig. 1, this line is represented
by “d”. The tangent point “A” is the minimum solution of F , and is consequently
the Pareto-optimal solution corresponding to the weight vector.
The only advantage of using this technique is the emphasis of one objective over
the other. As we have seen, the optimization of the single objective may guaran-
tee a Pareto-optimal solution but results in a single point solution. However, in
real world situations we usually need different alternatives in order to make a deci-
sion. Moreover, if some of the objectives are noisy or have a discontinuous variable
space, this method may not work properly. The main drawback of this approach
is its sensitivity towards weights, i.e. the solution obtained largely depends on the
underlying weight vector.
Deb in Ref. 4 mentioned further potential problems with these approaches,
i.e. application areas where their use is restricted. Moreover, this kind of method
requires several optimization runs to obtain an approximation of the Pareto-optimal
set. As the runs are performed independently from each other, usually synergies
cannot be exploited which, in turn, may create a high computation overhead.

August 20, 2003 9:14 WSPC/115-IJPRAI 00271
A Methodology for Feature Selection 909
0 1 2 3 4 5 6 7 8 9 f2
f1
1
2
3
4
5
12
3
4
5
Fig. 2. Ranking of a population by fronts.
3.3. Pareto-based approach
In order to overcome the difficulties mentioned above, Pareto-based evolutionary
optimization has become an alternative to classical techniques such as weighted
sum method. This approach was first proposed by Goldberg in Ref. 9 and it ex-
plicitly uses Pareto dominance to determine the reproduction probability of each
individual. Basically, it consists of assigning rank 1 to the nondominated indivi-
duals and removing them from contention, then finding a new set of nondominated
individuals, ranked 2, and so forth. Figure 2 depicts the ranking by fronts.
Pareto-based ranking correctly assigns all nondominated individuals the same
fitness, however, this does not guarantee that the Pareto set is uniformly sampled.
When presented with multiple equivalent optima, finite populations tend to con-
verge to only one of them, due to stochastic errors in the selection process. This
phenomenon, known as genetic drift, has been observed in natural as well as in
artificial evolution, and can also occur in Pareto-based evolutionary optimization.
In order to avoid such a problem, Goldberg and Richardson in Ref. 10 proposed
the additional use of fitness sharing. The main idea behind this is that individuals
in a particular niche have to share the available resources. The more individuals
are located in the neighborhood of a certain individual, the more its fitness value
is degraded. In the following section we present the Pareto-based algorithm we have
used as well as an implementation of the sharing function.
3.3.1. Nondominated sorting genetic algorithm (NSGA)
Over the past decade, a number of multiobjective evolutionary algorithms have
been proposed. Zitzler et al. in Ref. 39 provided a systematic comparison of various
evolutionary approaches to multiobjective optimization using six carefully chosen
test functions. In this work, they found that NSGA (with elitism) proposed by
Srinivas and Deb in Ref. 35 surpasses several other methods. Besides, such a method
has been applied to solve various problems.23,36 For these reasons, we opted to use
such an algorithm in our study.
August 20, 2003 9:14 WSPC/115-IJPRAI 00271
910 L. S. Oliveira et al.
The idea behind the NSGA is that a ranking selection method is used to em-
phasize good points and a niche method is used to maintain stable subpopulations
of good points. It differs from simple genetic algorithm only in the way the selection
operator works. The crossover and mutation remain as usual. Before the selection is
performed, the population is ranked based on an individual’s nondomination. The
nondominated individuals present in the population are first identified from the
current population. Then, all these individuals are assumed to constitute the first
nondominated front in the population and assigned a large dummy fitness value.
The same fitness value is assigned to give an equal reproductive potential to all
these nondominated individuals.
In order to maintain the diversity in the population, these classified individuals
are then shared with their dummy fitness values. Sharing is achieved by performing
selection operation using degraded fitness values obtained by dividing the original
fitness value of an individual by a quantity proportional to the number of individuals
around it. After sharing, these nondominated individuals are ignored temporarily
to process the remaining population in the same way to identify individuals for
the second nondominated front. These new sets of points are then assigned a new
dummy fitness which is kept smaller than the minimum shared dummy fitness of
the previous front. This process is continued until the entire population is classified
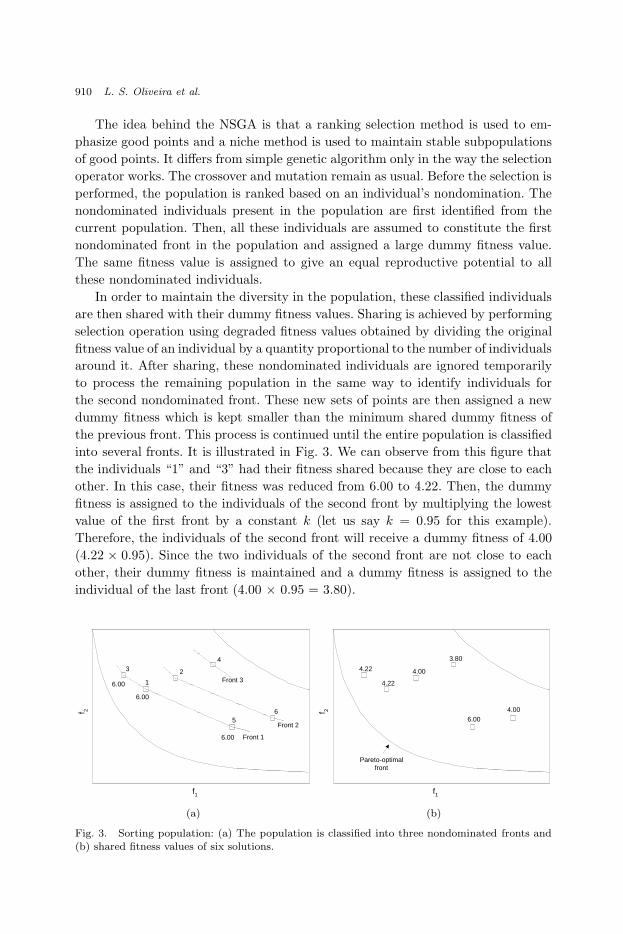
into several fronts. It is illustrated in Fig. 3. We can observe from this figure that
the individuals “1” and “3” had their fitness shared because they are close to each
other. In this case, their fitness was reduced from 6.00 to 4.22. Then, the dummy
fitness is assigned to the individuals of the second front by multiplying the lowest
value of the first front by a constant k (let us say k = 0.95 for this example).
Therefore, the individuals of the second front will receive a dummy fitness of 4.00
(4.22 × 0.95). Since the two individuals of the second front are not close to each
other, their dummy fitness is maintained and a dummy fitness is assigned to the
individual of the last front (4.00 × 0.95 = 3.80).
f 1
Front 1
Front 2
Front 3
f 2
3
1
5
2
6
4
6.00
6.00
6.00
(a)
f 1
f 2
4.22
4.22
6.00
4.00
4.00
3.80
Pareto-optimal front
(b)
Fig. 3. Sorting population: (a) The population is classified into three nondominated fronts and(b) shared fitness values of six solutions.

August 20, 2003 9:14 WSPC/115-IJPRAI 00271
A Methodology for Feature Selection 911
Start
Initialize population,
gen=0 Front = 1
Is the population
classified ?
Identify non-dominated
individuals
Assign dummy fitness
Sharing in current front
front = front + 1
Reproduction according to
dummy fitness Crossover Mutation
Is gen <
maxgen ?
Stop
gen = gen + 1
Yes
No
No
Yes
Fig. 4. Flow chart of NSGA.
The population is then reproduced according to the dummy fitness values. Since
individuals in the first front have the maximum fitness value, they get more copies
than the rest of the population. This was intended to search for the nondominated
regions of Pareto-optimal fronts. The efficiency of NSGA lies in the way multiple
objectives are reduced to a dummy fitness function using nondominated sorting
procedures.
Figure 4 shows a flow chart of NSGA. The algorithm is similar to a simple ge-
netic algorithm except for the classification of nondominated fronts and the sharing
operation. The sharing in each front is achieved by calculating a sharing function
value between two individuals in the same front as:
Sh(d(i, j)) =
1 −(
d(i, j)
σshare
)2
if d(i, j) < σshare
0 otherwise
(4)
where d(i, j) is the distance between two individuals i and j in the current front
and σshare is the maximum distance allowed between any two individuals to be-
come members of a niche. In any application of sharing, we can implement either
genotypic sharing, since we always have a genotype (the encoding), or phenotypic
sharing. However, Deb and Goldberg in Ref. 5 indicated that in general, phenotypic
sharing is superior to genotypic sharing. Thus, we have used a phenotypic sharing
which is calculated from the normalized Euclidean distance between the objective
functions.
The parameter σshare can be calculated as follows5:
σshare ≈0.5p√
q(5)
where q is the desired number of distinct Pareto-optimal solutions and p is the
number of decision variables. Although the calculation of σshare depends on this
parameter q, it has been shown in Ref. 35 that the use of the above equation with
q ≈ 10 works in many test problems.

August 20, 2003 9:14 WSPC/115-IJPRAI 00271
912 L. S. Oliveira et al.
4. Handwritten Digit String Recognition System
In order to evaluate the effect of the proposed feature selection scheme, we have used
a handwritten string digit recognition system. Basically, the recognition module
of this system is composed of one general-purpose recognizer, which is devoted to
recognize ten numerical classes, and two verifiers devoted to detect over- and under-
segmentation. All classifiers are neural networks (multilayer perceptron) trained
with the backpropagation algorithm.32 Figure 5 shows the block diagram of the
system used in this work. The database considered in our work is the NIST SD19.
Component Detection
Segmentation Conc&Cont
Multi-level Concaviity Analysis
Concavity
Over-Seg. Verifier (v o )
Under-Seg. Verifier (v u )
I M A G E
Component Detection and Segmentation
Feature Extraction
Recognition and Verification
General-purpose recognizer
Fig. 5. Block diagram of the handwritten digit string recognition system.
Regarding the general-purpose recognizer, the training and validation sets con-
tained 195,000 and 28,000 samples from the hsf {0,1,2,3} series respectively while
the test set contained 30,089 samples from the hsf 7 series. The recognition rates
(zero-rejection level) achieved by the general-purpose recognizer were 99.66%,
99.45% and 99.13% on the training, validation and test sets, respectively. The
feature vector used by this classifier is described in Sec. 4.1.
The over-segmentation verifier vo has two outputs: isolated characters and over-
segmentation. In order to train this verifier, we have used the following data: 8000
correctly segmented characters, 8000 naturally isolated characters and 12,000 over-
segmented parts, which were generated automatically by the segmentation algo-
rithm through the segmentation of the isolated and touching characters. The first
two parts are devoted to train the first class of the verifier, while the third one
is devoted to train the second class. Therefore, the training set used by vo has
28,000 samples. The validation and test sets were built in the same manner, and
they have 14,000 samples each. This verifier reached a recognition rate of 99.40%
on the test set.
The under-segmentation verifier vu is devoted to detect under-segmented charac-
ters. Thus, it considers two classes: isolated characters and under-segmentation. The
database used in this case contains 9000 samples, which are divided into 5000 im-
ages of isolated characters and 4000 images of touching characters. The validation
and test sets were built considering the same distribution of samples and they have
August 20, 2003 9:14 WSPC/115-IJPRAI 00271
A Methodology for Feature Selection 913
4000 samples each. This verifier reached a recognition rate of 99.17% on the test
set.
The feature vector that feeds the first verifier is based on different levels of
concavity while the second one is based on the same measurements of concavities
used by the general-purpose recognizer. The difference lies in the kind of zoning
used. Both feature vectors have 42 components. More details about this system can
be found in Ref. 27.
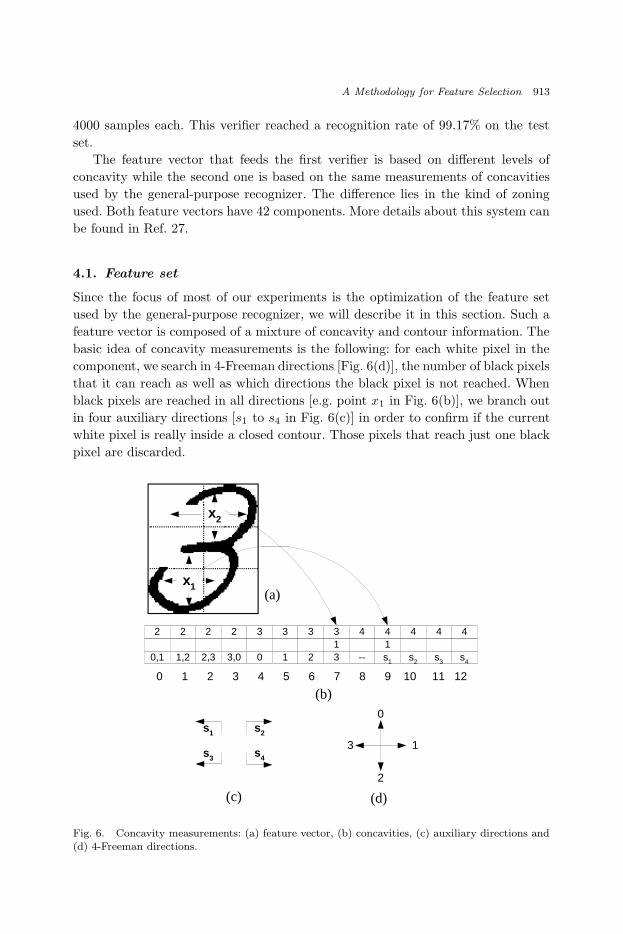
4.1. Feature set
Since the focus of most of our experiments is the optimization of the feature set
used by the general-purpose recognizer, we will describe it in this section. Such a
feature vector is composed of a mixture of concavity and contour information. The
basic idea of concavity measurements is the following: for each white pixel in the
component, we search in 4-Freeman directions [Fig. 6(d)], the number of black pixels
that it can reach as well as which directions the black pixel is not reached. When
black pixels are reached in all directions [e.g. point x1 in Fig. 6(b)], we branch out
in four auxiliary directions [s1 to s4 in Fig. 6(c)] in order to confirm if the current
white pixel is really inside a closed contour. Those pixels that reach just one black
pixel are discarded.
1 1 0,1 1,2 2,3 3,0 0 1 2 3 -- s 1 s 2 s 3 s 4
0 1 2 3 4 5 6 7 8 9 10 11 12
2 2 2 2 3 3 3 3 4 4 4 4 4
x 2
x 1
s 1 s 2
s 3 s 4
0
2
3 1
(b)
(a)
(c) (d)
Fig. 6. Concavity measurements: (a) feature vector, (b) concavities, (c) auxiliary directions and(d) 4-Freeman directions.
August 20, 2003 9:14 WSPC/115-IJPRAI 00271
914 L. S. Oliveira et al.
0 1 2 3 4 5 6 7
2
3
1
4
0
5
6
7
(a) (b) (c)
0 2 4 4 3 4 5 1
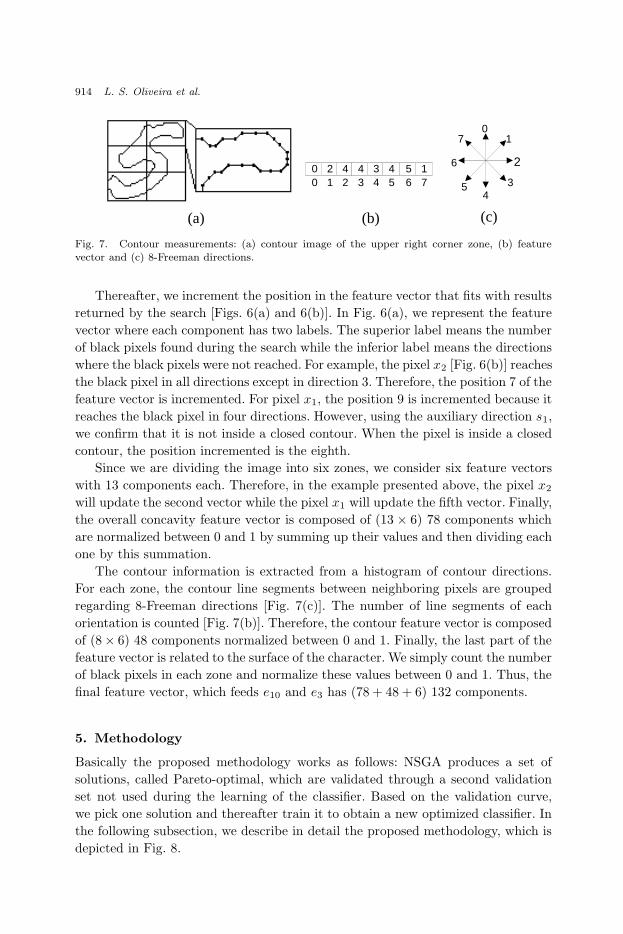
Fig. 7. Contour measurements: (a) contour image of the upper right corner zone, (b) featurevector and (c) 8-Freeman directions.
Thereafter, we increment the position in the feature vector that fits with results
returned by the search [Figs. 6(a) and 6(b)]. In Fig. 6(a), we represent the feature
vector where each component has two labels. The superior label means the number
of black pixels found during the search while the inferior label means the directions
where the black pixels were not reached. For example, the pixel x2 [Fig. 6(b)] reaches
the black pixel in all directions except in direction 3. Therefore, the position 7 of the
feature vector is incremented. For pixel x1, the position 9 is incremented because it
reaches the black pixel in four directions. However, using the auxiliary direction s1,
we confirm that it is not inside a closed contour. When the pixel is inside a closed
contour, the position incremented is the eighth.
Since we are dividing the image into six zones, we consider six feature vectors
with 13 components each. Therefore, in the example presented above, the pixel x2
will update the second vector while the pixel x1 will update the fifth vector. Finally,
the overall concavity feature vector is composed of (13 × 6) 78 components which
are normalized between 0 and 1 by summing up their values and then dividing each
one by this summation.
The contour information is extracted from a histogram of contour directions.
For each zone, the contour line segments between neighboring pixels are grouped
regarding 8-Freeman directions [Fig. 7(c)]. The number of line segments of each
orientation is counted [Fig. 7(b)]. Therefore, the contour feature vector is composed
of (8× 6) 48 components normalized between 0 and 1. Finally, the last part of the
feature vector is related to the surface of the character. We simply count the number
of black pixels in each zone and normalize these values between 0 and 1. Thus, the
final feature vector, which feeds e10 and e3 has (78 + 48 + 6) 132 components.
5. Methodology
Basically the proposed methodology works as follows: NSGA produces a set of
solutions, called Pareto-optimal, which are validated through a second validation
set not used during the learning of the classifier. Based on the validation curve,
we pick one solution and thereafter train it to obtain a new optimized classifier. In
the following subsection, we describe in detail the proposed methodology, which is
depicted in Fig. 8.

August 20, 2003 9:14 WSPC/115-IJPRAI 00271
A Methodology for Feature Selection 915
Pool of Candidates
New Pool of Candidates
Neural Network and Sensitivity Analysis
Validation
Training Solution Indicated by the Validation Curve
Generate initial population
Apply NSGA and genetic operators Rank
according to fitness
values
Pareto-optimal front
Pareto-optimal front with its respective
validation curve
Optimized classifier
Solution provided by the validation
curve
Fig. 8. Flow chart of the proposed methodology.
5.1. Implementation of NSGA
In our experiments, NSGA is based on bit representation, one-point crossover, bit-
flip mutation, roulette wheel selection, and elitism which is implemented using a
generational procedure. The following parameter settings were employed:
• Population size: 128.
• Number of generations: 1000.
• Probability of crossover (Pc): 0.8.
• Probability of mutation (Pm): 0.007.
• Niche Distance (σshare): 0.45.
In order to define the probabilities of crossover and mutation, we have used
the one-max problem, which is probably the most frequently-used test function in
research on genetic algorithms because of its simplicity.1 This function measures
the fitness of an individual as the number of bits set to one on the chromosome.

August 20, 2003 9:14 WSPC/115-IJPRAI 00271
916 L. S. Oliveira et al.
We have used a standard genetic algorithm with a single-point crossover and the
maximum generations of 1000. The fixed crossover and mutation rates are used in
a run, and the combination of the crossover rates 0.0, 0.4, 0.6, 0.8 and 1.0 and the
mutation rates of 0.1/L, 1/L and 10/L, where L is the length of the chromosome.
The best results were achieved with Pc = 0.8 and Pm = 1/L. Such results confirmed
the values reported by Miki et al.22 The population size was determined through
experimentation. The parameter σshare was first defined using Eq. (5), and then
tuned empirically.
As discussed elsewhere, our goal is to find the best accuracy/complexity
trade-off for the classifier. This means that two objectives must be considered:
minimization of the number of features and minimization of the error rate of the
classifier. Computing the first one is simple, i.e. the number of selected features (bit
= 1). The problem lies in computing the second one, i.e. the error rate supplied
by the classifier. Regarding a wrapper approach, in each generation, evaluation of
a chromosome (a feature subset) requires training the corresponding neural net-
work and computing its accuracy. This evaluation has to be performed for each of
the chromosomes in the population. Since such a strategy is not feasible due to
the limits imposed by the learning time of the huge training set considered in this
work, we have adopted the strategy proposed by Moody and Utans,24 who used the
sensitivity of the network to estimate the relationship between the input features
and the network performance.
The sensitivity of the network model to variable i is defined as:
Si =1
N
∑
j
Sij (6)
where Sij is the sensitivity computed for exemplar xj
Sij = SE(xi) − SE(xij) (7)
with
xi =1
N
N∑
j=1
xij . (8)
Si measures the effect on the training squared error (SE) of replacing the ith
input xi by its average xi for all N exemplars. Moody and Utans showed that when
variables with small sensitivity values (Si) with respect to the network outputs are
removed, they do not influence the final classification. In light of this, to evaluate
a given feature subset we replace all unselected inputs xi of the test set by their
respective averages xi computed on the training set. In this way, we avoid training
the neural network and hence turn the wrapper approach feasible for our problem.
We call this strategy modified-wrapper. Such scheme was also employed by Yuan
et al.38

August 20, 2003 9:14 WSPC/115-IJPRAI 00271
A Methodology for Feature Selection 917
40 60 80 100
Number of Features
0,5
1
1,5
2
2,5
Err
or R
ate
(%)
30 50 70 90
x Pareto-front Validation
3
3,5
4
x x
x
x x x x
x x x
x x x
x x
x
x x x
x x x x x x x x x x x
x x x x x x x x x x x x x x x x x x xxxxxxxxxxxxxxxxxxxxxxxxx
+
+ + +
+ +
+ + +
+
+ + +
+
+ + + + + + + + + + + + + + + + + + +
+ + +
+ + + + + + +
+ + + + + + +
+ +
+ +
+ +
+
+ + + + + + +
+
S 1 S 2
Fig. 9. Example of the Pareto-optimal front and its respective validation curve.
5.2. Validating the Pareto-optimal front
As depicted in Fig. 8, the last step of the strategy consists of choosing the best
solution from the Pareto-optimal front. After several experiments, we realized that
the Pareto-optimal front by itself does not provide enough information to select the
best solution. Often, the best solution found in the Pareto-optimal front does not
have good generalization power on a different database. In order to overcome this
kind of problem, we propose the use of a validation database, which is not used
during the feature selection procedure, to verify the generalization power of the
Pareto-optimal front. This scheme is exemplified in Fig. 9.
If we analyze just the Pareto-front, the best trade-off between the number of
features and the error rate is the solution S1, which produces an error rate of
0.36% for 75 selected features. However, by analyzing the validation curve, we
can observe that such a solution supplies a poor generalization on an unknown
database and hence an error rate of about 1.7%. We can also observe that the
accuracy/complexity trade-off that has the best generalization on the validation
set is the solution S2.
5.3. Parallel processing
The approach of parallel processing used in this work is based on a single-population
master-slave genetic algorithm. In this strategy, one master node executes the
genetic operators (selection, crossover and mutation), and the evaluation of fitness
is distributed among several slave processors. In order to execute our experiments,
we have used a Beowulf cluster with 17 (one master and 16 slaves) PCs (1.1Ghz

August 20, 2003 9:14 WSPC/115-IJPRAI 00271
918 L. S. Oliveira et al.
CPU, 512Mb RAM). Such a strategy, which is a low cost parallel computing based
on a cluster of personal computers, makes the proposed approach tractable on short
term.
In order to execute 1000 generations of NSGA, this architecture takes about
8 hours. The same process in a SUN Ultra 1 (167Mhz CPU, with 128Mb RAM)
takes more than 20 days.
6. Experiments and Results
In order to test the effectiveness of the proposed methodology we have applied it to
optimize the system described in Sec. 4. As mentioned before, we have performed
experiments in two different contexts: isolated digits and strings of digits. For all
reported results we used the following definitions of the recognition rate, error rate,
rejection rate and reliability rate. Let B be a test set with NB string images. If
the recognition system rejects Nrej, classifies correctly Nrec and misclassifies the
remaining Nerr, then
Recognition Rate =Nrec
NB
× 100 (9)
Error Rate =Nerr
NB
× 100 (10)
Rejection Rate =Nrej
NB
× 100 (11)
Reliability =Nrec
Nrec + Nerr. (12)
Therefore, the recognition rate, error rate and rejection rate sum up to 100%.
In general, the recognition rate is a valid rate, but to characterize the quality of
the classifier for practical issues, this rate is not appropriate. A more suitable rate
for classifier examination in real applications is the reliability rate, which gives an
impression of the classifier behavior in several different situations. Such a rate takes
not only the error rate, but also the reject rate into consideration. Therefore, for all
experiments presented in this work we report the recognition rate at zero-rejection
level, 0.5% error level and reliability rate. We have used the rejection mechanism
proposed by Fumera et al.8 In all experiments we do not consider the knowledge of
the number of digits in the string.
6.1. Experiments on isolated digits
The database used to assess the impact of different subsets of inputs during the
feature selection was the same as employed for validation during training of the
classifier (28,000 samples from hsf 0123).
In order to show the limitations of the weighted-sum approach, we first tried to
optimize the classifier using it. As expected, the results achieved by the weighted-
sum approach presented a premature convergence to a specific region of the search

August 20, 2003 9:14 WSPC/115-IJPRAI 00271
A Methodology for Feature Selection 919
0 20 40 60 80 100
Number of Features
120 140
20
40
60
80
100
Err
or R
ate
(%)
(a)
0 20 40 60 80 100
Number of Features
120 140
20
40
60
80
100
Err
or R
ate
(%)
(b)
Fig. 10. Proposed methodology using the weighted-sum approach: (a) evolution of the populationin the objectives plane (one trial) and (b) Pareto-optimal solutions found by the classical approachafter several trials.
space instead of maintaining a diverse population. This kind of behavior can be ex-
plained by the sensitivity towards weight presented by the weighted-sum approach.
Since we have chosen weights to favor solutions with a small error rate rather than
a small number of features, the selection pressure drove the search to the region
where the error rates are smaller. Thus, after several trials using different weights
we did not succeed in finding the Pareto-optimal front but rather an approximation
of the Pareto-optimal solutions (Fig. 10).
As we have discussed in Sec. 3.3, the Pareto-based approach was designed to
overcome this kind of problem. Since NSGA uses a niching technique to preserve
the diversity in the population, this algorithm is able to deal with the problem of
converging prematurely to a specific region of the search space. Therefore, it can
guide the search towards the Pareto-optimal set. Figure 11(a) depicts the evolution
of the population in the objectives plane from the first generation to the last one.
This plot demonstrates the efficacy of NSGA in converging close to the Pareto-
optimal front with a wide variety of solutions.
As discussed in Sec. 5, after finding the Pareto-optimal front the next step is to
find a solution. In order to perform this task we have used a new validation database,
which consists of 30,000 samples (from hsf 7) not used so far. Figure 11(b) shows
the Pareto-optimal front as well as its correspondent validation curve, which depicts
the performance of the entire Pareto-optimal front on this new validation set. After
analyzing the validation curve plotted in Fig. 11(b), we selected a solution with
100 features [solution S4 in Fig. 11(b)] and error rate on the new validation set
smaller than 1% to retrain the general-purpose recognizer.
Thereafter, we trained a new classifier using such a solution using the same
databases presented in Sec. 4. The recognition rates achieved by this new classifier
at zero rejection level were 99.66%, 99.63%, 99.16% on training, validation and
test sets, respectively. Table 1 summarizes the results obtained by the optimized

August 20, 2003 9:14 WSPC/115-IJPRAI 00271
920 L. S. Oliveira et al.
0 20 40 60 80 100
Number of Features
120 140
20
40
60
80
100
Err
or R
ate
(%)
(a)
x
0 40 60 80 100
Number of Features
120 140
0,5
1
1,5
2
2,5
Err
or R
ate
(%)
30 50 70 90 110 130
x x x
x x x
x
x
x x x
x x x x
x x x x x x x x x x x x x x x x xxxxxxxxxxxxxxxxxxxxxxx
x Pareto-front Validation
S 3 S 4
(b)
Fig. 11. Feature selection using a Pareto-based approach: (a) evolution of the population in theobjective plane, (b) Pareto-optimal front found by NSGA and its correspondent validation curve.
Table 1. Comparison between the original and optimized classifiers. Error ratefixed at 0.5%.
Original System Optimized System
Number of Rates (%) Number of Rates (%)
Features Recog. Rej. Reliab. Features Recog. Rej. Reliab.
132 98.50 1.00 99.49 100 98.54 0.96 99.50
classifier on the test set at 0.5% error level. As we can observe, the optimized system
uses about 25% less features and keeps the reliability rate at the same level. Such
results confirm the efficiency of the proposed methodology in selecting a powerful
subset of features. In order to show the importance of the validation set to select a
good solution, we retrained the best trade-off of the Pareto-front without regarding
the validation curve [solution S3 in Fig. 11(b)]. The recognition rate (zero-rejection
level) and reliability rate reached by this solution on the test set were 96.8% and
98.5%, respectively.
6.2. Experiments on strings of digits (1)
The experiments using numeral strings are based on 12,802 numeral strings ex-
tracted from the hsf 7 series and distributed into six classes: 2 digit (2370), 3 digit
(2385) 4 digit (2345), 5 digit (2316), 6 digit (2316) and 10 digit (1217) strings, re-
spectively. These data exhibit different problems such as touching and fragmenta-
tion. Figure 12 shows some examples of the variability found in the NIST database.
The recognition rates at zero-rejection level as well as the performance at 0.5%
error level achieved by the original system are reported in Table 2.
In the first experiment with strings of digits we just replaced the original classi-
fier by the optimized one presented in the previous section. The idea here is to find
out whether the optimized classifier is good enough to recognize strings of digits.

August 20, 2003 9:14 WSPC/115-IJPRAI 00271
A Methodology for Feature Selection 921
92771 13210 892 73169
79293 8963 690411 5827
40059 23976 56 01 12701
226440 7883 75434 5649
71329 43733 87251 552
83830 3976 29344 4507
Fig. 12. Examples of digit strings (NIST SD19).
Table 2. Performance of the original system on strings of digits.
String Number of Rec. Rec. Rate ReliabilityLength Strings Rate (Error = 0.5%) Rate
2 2370 96.88 93.88 99.473 2385 95.38 89.84 99.444 2345 93.38 84.36 99.415 2316 92.40 82.44 99.406 2169 93.12 84.03 99.4110 1217 90.24 75.20 99.34
As discussed before, such a problem is much more complicated than the problem
of naturally isolated digits since the system must face complications such as noise,
fragmentation and touching digits. In order to answer the above question, we have
applied the optimized classifier to recognize strings of digits. It is worthy of remark
that both verifiers remain the same. The results of these experiments are presented
in Table 3.
Table 3. Performance of the system on strings of digits using thegeneral-purpose classifier optimized with isolated digits.
String Number of Rec. Rec. Rate ReliabilityLength Strings Rate (Error = 0.5%) Rate
2 2370 97.21 94.00 99.473 2385 94.62 89.72 99.444 2345 93.34 84.38 99.415 2316 92.36 82.67 99.406 2169 92.60 83.70 99.4010 1217 89.19 74.77 99.33

August 20, 2003 9:14 WSPC/115-IJPRAI 00271
922 L. S. Oliveira et al.
Table 4. Performance of the system on strings of digits using the
general-purpose classifier optimized with strings of digits.
String Number of Rec. Rate Rec. Rate ReliabilityLength Strings (Error = 0.0%) (Error = 0.5%) Rate
2 2370 96.91 93.90 99.474 2345 93.33 84.36 99.415 2316 92.40 82.44 99.406 2169 92.35 83.95 99.40
At the second time, we carried out the feature selection for both verifiers and
used them in the system afterwards. To perform this task, we have used the pro-
posed methodology where the databases used to validate the Pareto-front (called
second validation set, so far) for the over-segmentation and under-segmentation
verifiers have 7000 and 2000 samples, respectively. They were built in the same
way we have described in Sec. 4. After running the feature selection we found the
solution with 30 and 38 features for the over-segmentation and under-segmentation
verifiers, respectively.
After training these optimized verifiers, we applied them together with the op-
timized classifier to recognize the strings of digits. The reliability rates were kept at
the same level as presented in Table 3. Considering the three optimized classifiers
in this experiment, the total features used by the system were reduced from 216
(132+42+42) to 168 (100+30+38), i.e. about 22% less features.
In spite of the fact that the optimized classifier succeeded in keeping the re-
liability rate at the same levels as the original system, such a classifier produced
better recognition rates for strings composed of naturally isolated digits and worse
performance for strings that showed problems of touching digits, fragmentation
and noise. Therefore, the improvement found in the former case compensates the
problems found in the latter.
6.3. Experiments on strings of digits (2)
In order to improve the performance of the classifier globally, i.e. for naturally
isolated digits as well as digits with problems of fragmentation, touching and so
forth, we have performed a new series of experiments. The goal was to select a subset
of features suitable for the problem of strings of digits rather than the problem
of naturally isolated digits. Thus, instead of using a database of isolated digits
to assess the fitness during the feature selection procedure, we used the 3-digit
string database which is composed of 2385 images. In this manner, problems such
as overlapping, fragmentation and effects of segmentation are tackled during the
optimization process and hence relevant features for those problems will not be
discarded. The validation set used to find the best solution in the Pareto-optimal
front is the 10-digit string database which contains 1217 images.
After performing the feature selection for the general-purpose recognizer taking
into account such databases, the best solution we found had 124 selected features,

August 20, 2003 9:14 WSPC/115-IJPRAI 00271
A Methodology for Feature Selection 923
i.e. it is considerably greater than that presented in the previous section (100
features). After training such a classifier and using it to classify strings of digits we
performed an error analysis in order to find out whether the optimized classifier
got better results for strings with problems of touching digits, fragmentation and
noise. We verified that it succeeded in improving the rates for strings with such
problems, however, the rates for strings composed of naturally isolated digits was
slightly lower than those shown in the previous section. Since most of the strings
of the NIST database are composed of naturally isolated digits (about 75%), the
slightly worse rates obtained in this case neutralized the improvement reached for
strings with problems. Hence, the reliability rates of this experiment are almost the
same as those of the previous experiment. Table 4 reports the performance (0.5%
error level) of the classifier optimized in the context of strings of digits. The results
for 3- and 10-digit strings were omitted here since we have used such subsets during
the optimization process.
7. Discussion
In spite of the fact that the Pareto-based approach presents several advantages
over the classical one, we have seen through the experiments that both strategies
found similar solutions [see Figs. 10(b) and 11(b)]. In our first experiment, we
observed that the classical approach converged the search to the space where the
most probable solutions are located due to the weights we have chosen. However,
for problems where the solutions are located along the Pareto-front, the classical
approach does not work properly. Moreover, to achieve part of the Pareto-front, the
weighted-sum method was run several times with different weight vectors.
For the problem of feature selection for handwriting recognition we can observe
that the main advantage of the Pareto-based approach is the ability of dealing with
different databases without having to deal with problems such as scaling and finding
the suitable values for the weight vector. Moreover, Pareto-based approaches have
the ability of finding the Pareto-optimal front in the first run of the algorithm.
As we have seen, two different optimized classifiers were used to recognize strings
of digits. The former was optimized considering a database composed of naturally
isolated digits only while the latter took into account a database of strings of
digits. Through detailed experiments we have demonstrated that in both cases
the optimized systems attained very similar reliability rates. In the first case, the
classifier obtains slightly better rates for isolated digits and worse rates for strings
with problems such as touching digits, fragmentation and noise while in the second
case we observed the opposite. Since about 75% of the strings of digits of the NIST
database consist of naturally isolated digits, the classifier optimized in this context,
which has about 25% less features than the original classifier, provided the same
reliability rates as those found in the original system.
Table 5 summarizes the recognition rates claimed by different authors on NIST
database. Ha et al.11 used about 5000 strings of the NIST SD3 while Lee and

August 20, 2003 9:14 WSPC/115-IJPRAI 00271
924 L. S. Oliveira et al.
Table 5. Recognition rates on NIST databases reported by
other authors.
String Number of Error Rate Error Rate
Authors Length Tested Strings 0% 1% 0,5%
Ref. 11 2 981 96.20 93.50 91.50
4 988 93.20 81.00 70.00
5 988 91.10 77.50 70.50
6 982 90.30 75.50 66.50
Ref. 19 2 1000 95.23 95.20 −
4 1000 80.69 80.50 −
5 1000 78.61 78.40 −
6 1000 70.49 70.20 −
Kim19 used 5000 strings but they did not specify the data used. By comparing
the results reached by our system (Table 4) with those reported by other authors
(Table 5), we can confirm that our system provides very good recognition rates at
zero-recognition level and a very encouraging error-reject trade-off.
Since there is an interdependence between features where two or more features
between them convey important information, it is very difficult to analyze the
unselected features independently. However, analyzing the unselected features of
several runs of the algorithm we could notice the following aspects.
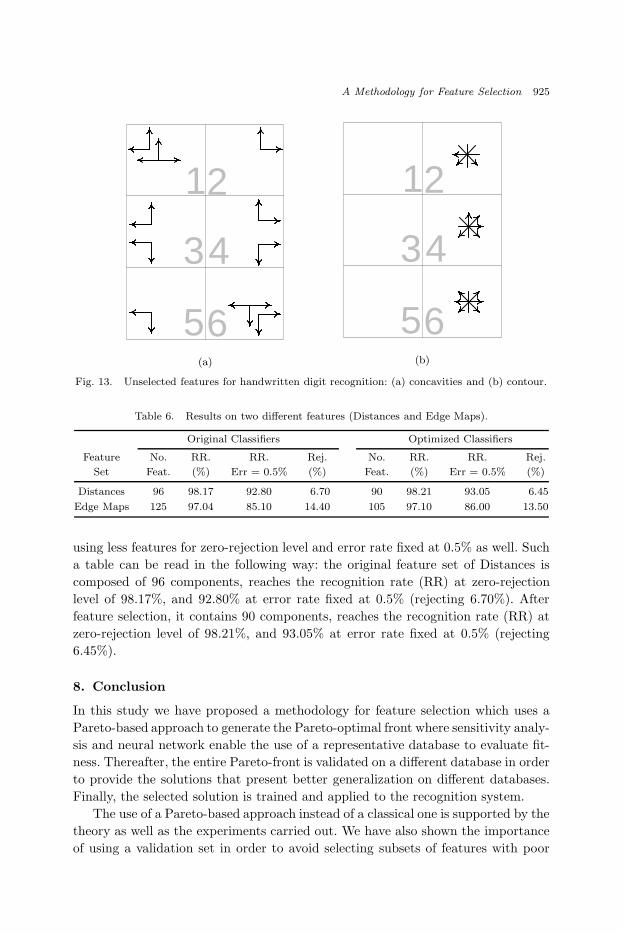
1. In most of the solutions we observed that the unselected features of concav-
ity have a certain symmetry among the zones, e.g. zones 1–6, 2–5 and 3–4
[Fig. 13(a)]. Moreover, we can conclude that for this kind of zoning there is a re-
lationship between the geographic position of the zone and 4-Freeman directions.
For example, in zone 2 (North–East) the unselected concavity configuration is
the one that searches black pixels in directions North–East. We can notice the
same behavior for the other zones.
2. All unselected features of contour are located just on the right side of the zoning
[Fig. 13(b)] in most solutions. In this case we can assume that such features are
correlated so that it is not necessary to include them in the feature set.
3. The information related to the surface of the image was never unselected. This
means that such an information is relevant to the feature vector we have used.
It is worth to remark that such an analysis is valid for the feature vector de-
scribed in Sec. 4.1. However, it can be a very helpful tool to get a better insight for
any kind of feature vector.
Finally, to demonstrate that the methodology can be successfully extended to
different features, we have applied it on two other feature sets, namely, Distances26
and Edge Maps.2 Thus, two classifiers were trained using the same databases and
methodology described in Sec. 4. Table 6 reports the performance achieved by both
classifiers on the test set of isolated digits (30,089 samples of hsf 7). It can be
observed from this table that the optimized feature sets get slightly better results
August 20, 2003 9:14 WSPC/115-IJPRAI 00271
A Methodology for Feature Selection 925
1 2
3 4
5 6 (a)
1 2
3 4
5 6 (b)
Fig. 13. Unselected features for handwritten digit recognition: (a) concavities and (b) contour.
Table 6. Results on two different features (Distances and Edge Maps).
Original Classifiers Optimized Classifiers
Feature No. RR. RR. Rej. No. RR. RR. Rej.
Set Feat. (%) Err = 0.5% (%) Feat. (%) Err = 0.5% (%)
Distances 96 98.17 92.80 6.70 90 98.21 93.05 6.45
Edge Maps 125 97.04 85.10 14.40 105 97.10 86.00 13.50
using less features for zero-rejection level and error rate fixed at 0.5% as well. Such
a table can be read in the following way: the original feature set of Distances is
composed of 96 components, reaches the recognition rate (RR) at zero-rejection
level of 98.17%, and 92.80% at error rate fixed at 0.5% (rejecting 6.70%). After
feature selection, it contains 90 components, reaches the recognition rate (RR) at
zero-rejection level of 98.21%, and 93.05% at error rate fixed at 0.5% (rejecting
6.45%).
8. Conclusion
In this study we have proposed a methodology for feature selection which uses a
Pareto-based approach to generate the Pareto-optimal front where sensitivity analy-
sis and neural network enable the use of a representative database to evaluate fit-
ness. Thereafter, the entire Pareto-front is validated on a different database in order
to provide the solutions that present better generalization on different databases.
Finally, the selected solution is trained and applied to the recognition system.
The use of a Pareto-based approach instead of a classical one is supported by the
theory as well as the experiments carried out. We have also shown the importance
of using a validation set in order to avoid selecting subsets of features with poor

August 20, 2003 9:14 WSPC/115-IJPRAI 00271
926 L. S. Oliveira et al.
generalization ability. Through comprehensive experiments on isolated digits and
strings of digits, we have demonstrated that the proposed methodology succeeded
in reducing the complexity of feature set used by the classifier and also that even
using less features such a classifier achieved reliability rates at the same level as
those reached by the original classifier.
We have seen that the classifier optimized in the context of isolated digits pro-
duced reliability rates for the problem of strings of digits at the same level as the
classifier optimized in the context of strings of digits. However, we also pointed
out that such a behavior is closely related to the database we have used, since it
contains about 75% of naturally isolated digits. Finally, we have analyzed several so-
lutions provided by the feature selection algorithm and determined the relationship
between some unselected features and the strategy of zoning we have applied.
References
1. E. Cantu-Paz, Efficient and Accurate Parallel Genetic Algorithms, Kluwer AcademicPress, 2000.
2. Y. C. Chim, A. A. Kassim and Y. Ibrahim, “Dual classifier sysem for handprintedalphanumeric character recognition,” Patt. Anal. Appl. 1, 3 (1998) 155–162.
3. M. Dash and H. Liu, “Feature selection for classification,” Intell. Data Anal. 1, 3(1997) 131–156.
4. K. Deb, Multi-Objective Optimization Using Evolutionary Algorithm, John Wiley,2001.
5. K. Deb and D. E. Goldberg, “An investigation of niche and species formation ingenetic function,” Proc. 3rd Int. Conf. Genetic Algorithms, 1989, pp. 42–50.
6. C. Emmanouilidis, A. Hunter and J. MacIntyre, “A multiobjective evolutionarysetting for feature selection and a commonality-based crossover operator,” Proc.
Congress on Evolutionary Computation, Vol. 1, 2000, pp. 309–316.7. F. J. Ferri, P. Pudil, M. Hatef and J. Kittler, “Comparative study of technique for
large-scal feature selection,” Pattern Recognition in Practice, eds. J. E. Moody, S. J.Hanson and R. L. Lippmann, Vol. 4, Elsevier, 1994, pp. 403–413.
8. G. Fumera, F. Roli and G. Giacinto, “Reject option with multiple thresholds,” Patt.
Recogn. 33, 12 (2000) 2099–2101.9. D. Goldberg, Genetic Algorithms in Search, Optimization and Machine Learning,
Reading, MA, Addison-Wesley, 1989.10. D. E. Goldberg and J. Richardson, “Genetic algorithms with sharing for multi-modal
function optimisation,” Proc. 2nd Int. Conf. Genetic Algorithms and Their Applica-
tions, 1987, pp. 41–49.11. T. M. Ha, M. Zimmermann and H. Bunke, “Off-line handwritten numeral string
recognition by combining segmentation-based and segmentation-free methods,” Patt.
Recogn. 31, 3 (1998) 257–272.12. S. Y. Ho and H. L. Huang, “Facial modeling from a uncalibrated face image using a
coarse-to-fine genetic algorithm,” Patt. Recogn. 34, 5 (2001) 1015–1031.13. J. H. Holland, Adaptation in Natural Artificial Systems, University of Michigan Press,
Ann Arbor, 1975.14. G. John, R. Kohavi and K. Pfleger, “Irrelevant features and the subset selection
problems,” Proc. 11th Int. Conf. Machine Learning, 1994, pp. 121–129.
August 20, 2003 9:14 WSPC/115-IJPRAI 00271
A Methodology for Feature Selection 927
15. G. Kim and S. Kim, “Feature selection using genetic algorithms for handwritten char-acter recognition,” Proc. 7th Int. Workshop on Frontiers of Handwriting Recognition
(IWFHR), Amsterdam, Netherlands, 2000, pp. 103–112.16. L. Kira and L. Rendell, “A practical approach to feature selection,” Proc. 9th Int.
Conf. Machine Learning, Morgan Kaufmann, 1992, pp. 249–256.17. M. Kudo and J. Sklansky, “Comparison of algorithms that select features for pattern
classifiers,” Patt. Recogn. 33, 1 (2000) 25–41.18. L. Kuncheva and L. C. Jain, “Designing classifier fusion sysyems by genetic
algorithms,” IEEE Trans. Evolut. Comput. 4, 4 (2000) 327–336.19. S. W. Lee and S. Y. Kim, “Integrated segmentation and recognition of handwritten
numerals with cascade neural networks,” IEEE Trans. Syst. Man Cybern. Part C:Appl. Rev. 29, 2 (1999) 285–290.
20. H. Liu and R. Setiono, “A probabilistic approach to feature selection — a filterapproach,” Proc. 13th Int. Conf. Machine Learning, Morgan Kaufmann, 1996,pp. 319–327.
21. W. Liu, M. Wang and Y. Zhong, “Selecting features with genetic algorithms inhandwritten digits recognition,” Proc. Int. Conf. Evolutionary Computation, 1995,pp. 396–399.
22. M. Miki, T. Hiroyasu, K. Kaneko and K. Hatanaka, “A parallel genetic algorithm withdistributed environment scheme,” Proc. Int. Conf. Systems, Man and Cybernetics,Vol. 1, 1999, pp. 695–700.
23. K. Mitra, K. Deb and S. K. Gupta, “Multiobjective dynamic optimization of anindustrial nylon 6 semibatch reactor using genetic algorithms,” J. Appl. Polym. Sci.
69, 1 (1998) 69–87.24. J. Moody and J. Utans, “Principled architecture selection for neural networks:
Application to corporate bond rating predictions,” Advances in Neural Information
Processing Systems, eds. J. Moody, S. J. Hanson and R. P. Lippmann, Vol. 4, MorganKaufmann, 1991, pp. 683–690.
25. P. Narendra and K. Fukunaga, “A branch and bound algorithm for feature subsetselection,” IEEE Trans. Comput. 26 (1997) 917–922.
26. I.-S. Oh and C. Y. Suen, “Distance features for neural network-based recognition ofhandwritten characters,” Int. J. Doc. Anal. Recogn. 1, 2 (1998) 73–88.
27. L. S. Oliveira, R. Sabourin, F. Bortolozzi and C. Y. Suen, “Automatic recognition ofhandwritten numerical strings: a recognition and verification strategy,” IEEE Trans.
Patt. Anal. Mach. Intell. 24, 11 (2002) 1438–1454.28. V. E. Ramesh and N. Murty, “Off-line signature verification using genetically opti-
mized weighted features,” Patt. Recogn. 32, 2 (1999) 217–233.29. S. Rao, Optimization Theory and Application, Wiley Eastern Limited, New Delhi,
1991.30. M. L. Raymer, W. F. Punch, E. D. Goodman, L. A. Kahn and L. C. Jain, “Dimension-
ality reduction using genetic algorithms,” IEEE Trans. Evolut. Comput. 4, 2 (2000)164–171.
31. M. Richeldi and P. Lanzi, “Performing effective feature selection by investigating thedeep structure of the data,” Proc. 2nd Int. Conf. Knowledge Discovery and Data
Mining, 1996, pp. 379–383.32. D. E. Rumelhart, R. Durbin, R. Golden and Y. Chauvin, “Backpropagation: the basic
theory,” Backpropagation: Theory, Architectures and Applications, eds. Y. Chauvinand D. E. Rumelhart, Lawrence Erlbaum, Hillsdale, NJ, 1995, pp. 1–34.
33. D. Shi, “Feature selection for handwritten Chinese character recognition based ongenetic algorithm,” Proc. Int. Conf. Systems, Man and Cybernetics, Vol. 5, 1998,

August 20, 2003 9:14 WSPC/115-IJPRAI 00271
928 L. S. Oliveira et al.
pp. 4201–4206.34. W. Siedlecki and J. Sklansky, “A note on genetic algorithms for large scale on feature
selection,” Patt. Recogn. Lett. 10 (1989) 335–347.35. N. Srinivas and K. Deb, “Multiobjective optimization using nondominated sorting in
genetic algorithms,” Evolut. Comput. 2, 3 (1995) 221–248.36. D. S. Weile, E. Michielssen and D. E. Goldberg, “Genetic algorithm design of Pareto
optimal broadband microwave absorbers,” IEEE Trans. Electromag. Compat. 38, 3(1996) 518–525.
37. J. Yang and V. Honavar, “Feature subset selection using a genetic algorithm,” IEEE
Intell. Syst. 13, 1 (1998) 44–49.38. H. Yuan, S. S. Tseng, W. Gangshan and Z. Fuyan, “A two-phase feature selection
method using both filter and wrapper,” Proc. IEEE Int. Conf. Systems, Man and
Cybernetics, Vol. 2, 1999, pp. 132–136.39. E. Zitzler, K. Deb and L. Thiele, “Comparison of multiobjective evolutionary
algorithms: empirical results,” Evolut. Comput. 8, 2 (2000) 173–195.
Luiz S. Oliveira re-ceived the B.S. de-gree in computer sci-ence from UnicenP, Cu-ritiba, PR, Brazil andthe M.Sc. degree in elec-trical engineering andindustrial informaticsfrom the Centro Fed-eral de Educacao Tec-
nologica do Parana (CEFET–PR), Curitiba,PR, Brazil in 1995 and 1998, respec-tively. From 1994 to 1998, he was a sys-tem analyst at HSBC Bank, Curitiba, PR,Brazil, where he worked on financial sys-tems. Currently, he is a Ph.D. candidateat Ecole de Technologie Superieure, Uni-versite du Quebec, Montreal, Canada andvisiting scientist at the Centre for Pat-tern Recognition and Machine Intelligence(CENPARMI).
His current interests include pattern recog-nition, neural networks, image analysis andevolutionary computation.
Robert Sabourin re-ceived the B.Ing.,M.Sc.A. and Ph.D. de-grees in electrical engi-neering from the EcolePolytechnique de Mon-treal in 1977, 1980 and1991 respectively. In1977, he joined thephysics department of
the Universite de Montreal where hewas responsible for the design and de-velopment of scientific instrumentation forthe Observatoire du Mont Megantic. In1983, he joined the staff of the Ecolede Technologie Superieure, Universite duQuebec, Montreal, P.Q., Canada, where heis currently a Professeur Titulaire in theDepartement de Genie de la ProductionAutomatisee. In 1995, he joined also theComputer Science Department of the Pontif-cia Universidade Catlica do Paran (PUCPR,Curitiba, Brazil) where he was co-responsiblesince 1998 for the implementation of a Ph.D.program in applied informatics. Since 1996,he is a senior member of the Centre for Pat-tern Recognition and Machine Intelligence(CENPARMI).
His research interests are in the areas ofhandwriting recognition and signature verifi-
cation for banking and postal applications.

August 20, 2003 9:14 WSPC/115-IJPRAI 00271
A Methodology for Feature Selection 929
Flavio Bortolozzi re-ceived the B.S. degreein mathematics in 1977from Pontifıcia Univer-sidade Catolica do Pa-rana (PUC-PR), Brazil,a B.S. degree in civil en-gineering in 1980 fromPUC-PR, and a Ph.D.in system engineering
(computer vision) from the Universite deTechnologie de Compiegne, France, in 1990where his work was concerned with thetrinocular vision. From 1994 to 1999, he wasthe Head of the Department of Informatics,and the Dean of the College of Exact Sciencesand Technology at PUC-PR. Currently, he isa full professor at the Computer Science De-partment and the prorector for research atPUC-PR.
His research interests are computervision, handwriting recognition, documentimage analysis, educational multimedia andhypermedia.
Ching Y. Suen re-
ceived an M.Sc. (Eng.)degree from the Uni-versity of Hong Kongand a Ph.D. from theUniversity of BritishColumbia, Canada. In1972, he joined the De-partment of ComputerScience of Concordia
University where he became Professor in 1979and served as Chairman from 1980 to 1984,and as Associate Dean for Research of theFaculty of Engineering and Computer Sci-ence from 1993 to 1997. He has guided morethan 30 visiting scientists and post-doctoralfellows, and about 50 doctoral and master’sstudents. Currently he holds the distin-guished Concordia Research Chair of Artifi-cial Intelligence and Pattern Recognition, andis the Director of CENPARMI, the Centre forPR & MI.
Prof. Suen is the author/editor of 11 booksand more than 300 papers on subjects rang-ing from computer vision and handwritingrecognition, to expert systems and compu-tational linguistics. He is the founder andEditor-in-Chief of a journal and an AssociateEditor of several journals related to patternrecognition.
A Fellow of the IEEE, IAPR and theAcademy of Sciences of the Royal Societyof Canada, he has served several professionalsocieties as President, Vice-President or Gov-ernor. He is also the founder and chair ofseveral conference series including ICDAR,IWFHR and VI. He was the General Chairof numerous international conferences, in-cluding the International Conference onDocument Analysis and Recognition held inMontreal in August 1995 and the Interna-tional Conference on Pattern Recognitionheld in Quebec City in August 2002.
Dr. Suen is the recipient of numer-ous awards, including the ITAC/NSERCAward (Information Technology Associationof Canada and the Natural Sciences and
Engineering Research Council of Canada) in1992 and the Concordia “Research Fellow”award in 1998.