Embed Size (px)
Citation preview

Abstract Pelvis fractures between the anterior superior iliac spine (ASIS) and anterior inferior iliac spine (AIIS) have been observed in frontal-crash sled tests over the last 50 years. This paper presents the methods used and results obtained from a new study aimed to replicate lap belt loading conditions from sled tests in a more controlled, isolated, belt to torso loading environment. Three whole-body Post Mortem Human Subjects (PMHS) were positioned in a posture matching that of PMHS the time of pelvis fracture from previous reclined, frontal-crash sled tests. An air powered, hydraulic-moderated, feedback-controlled test device pulled a lap belt with a displacement and force time history derived from the sled tests. Of these tests, two PMHS sustained pelvis fractures at 4300 N and 5090 N, and one submarined at 3225 N. A fourth PMHS was tested twice at sub-injurious load levels to measure the effect of belt-to-pelvis orientation on iliac wing strain distributions. The results from this study can be used to match the loading conditions from full-scale sled tests to component-level iliac wing conditions to create an injury risk function for pelvis fractures caused by lap belt loading in the region between the ASIS and AIIS.
Keywords Cadaver, Notch Angle, Pelvis Fracture, PMHS, Submarining
I. INTRODUCTION
Sled tests are often used to replicate car crash scenarios in the injury biomechanics field. They allow researchers to evaluate various seating configurations, crash severities, crash directions, and injury countermeasures without using a full vehicle for every test. These types of tests have been run for over 50 years to evaluate many different research questions, many of them involving understanding injury to humans. Based on those tests, researchers have developed injury risk functions that have been applied to anthropomorphic test devices (ATDs) and human body models (HBMs) to aid in predicting injuries.
Lap belt induced pelvis injuries to the area between the anterior superior iliac spine (ASIS) and anterior inferior iliac spine (AIIS) have been reported in literature since the 1970s. In 1974, Schmidt et al conducted forty-nine 50 km/h frontal impact sled tests on postmortem human subjects (PMHS) to investigate the difference in a three point harness system and a two point restraint with knee bar [1]. It was noted that three PMHS sustained iliac wing fractures in the three-point harness condition. In 1975, Fayon et al ran 31 sled impact tests using PMHS at varying impact speeds to understand the thorax response with a three-point harness [2]. Five of the 31 PMHS sustained iliac wing fractures [2]. Throughout the 2010 decade, Luet et al, Uriot et al, and Trosseille et al published three different sled test series investigating the occurrence of submarining (when the lap belt slides over the pelvis and loads the abdomen), all with the presence of iliac wing fractures [3][4][5].
In 2018, we conducted the first set of reclined PMHS sled frontal impact tests [6][7][8][9]. Detailed pelvis kinematic and injury data were reported [6]. Of the four PMHS with midsize male mass and stature, two of the PMHS (Subject 1 and Subject 3) sustained similar iliac wing fractures as seen in the previous studies, one subject (Subject 5) submarined, and one subject (Subject 4) maintained lap belt interaction without injury. All subjects had similar peak lap belt forces between 6.5 kN and 8.3 kN. These four subjects also had similar pelvis pitch displacements and lap belt angle displacements despite these different outcomes (pelvis angular kinematic data was lost for Subject 3) [6].
In order to more accurately understand how lap belt loading to the pelvis causes iliac wing fractures, a more controlled-experiment is required. The complexity of the sled environment makes it difficult to understand
David Moreau is a PhD Student in Mechanical Engineering at the University of Virginia’s Center for Applied Biomechanics (phone: 434-297-8024, email: [email protected]). J.R. Kerrigan is the Director of University of Virginia’s Center for Applied Biomechanics and Associate Professor in the Department of Mechanical and Aerospace Engineering. 1: University of Virginia. 2: Autoliv AB Sweden
A Methodology to Replicate Lap Belt Loading Conditions from a Sled Impact Test in a Non-Impact Dynamic Environment on Whole-Body Postmortem Human Subjects
David Moreau1, John Paul Donlon1, Aida Chebbi1, Mohan Jayathirtha1, Sara Sochor1, Brian Overby1, Rachel Richardson1, Bronislaw Gepner1, Jason Forman1, Martin Östling2, Jason Kerrigan1
IRC-21-36 IRCOBI conference 2021
261
exactly how the pelvis is loaded. The forces borne specifically by the iliac wings, which would be required to create an injury risk function that could be used to predict injuries with an ATD or HBM, are difficult to isolate due to alternative load paths present from tissue. Specific ATDs (THOR and HIII 5th percentile female) already have load cells in the iliac wings that could be used to measure the loads needed to predict injury, but no level of loading to characterize injury has been developed. The goal of this study was to eliminate some of the complexities of the sled test environment and load the pelvis in a more-controlled experiment to produce fractures like those seen in the sled tests and capture detailed material-level deformation of the iliac wings in this condition. With this information, we will be able to design an even more-controlled experiment where we can load the pelvic wings direction to identify their fracture tolerance (Figure 1).
Figure 1 - Flow chart of planned testing to create pelvis injury criteria. Each color represents a test environment, starting with the sled test environment (blue), the non-impact dynamic environment (green), and then the
component level environment (orange). This paper's methodology covers the section in green.
II. METHODS
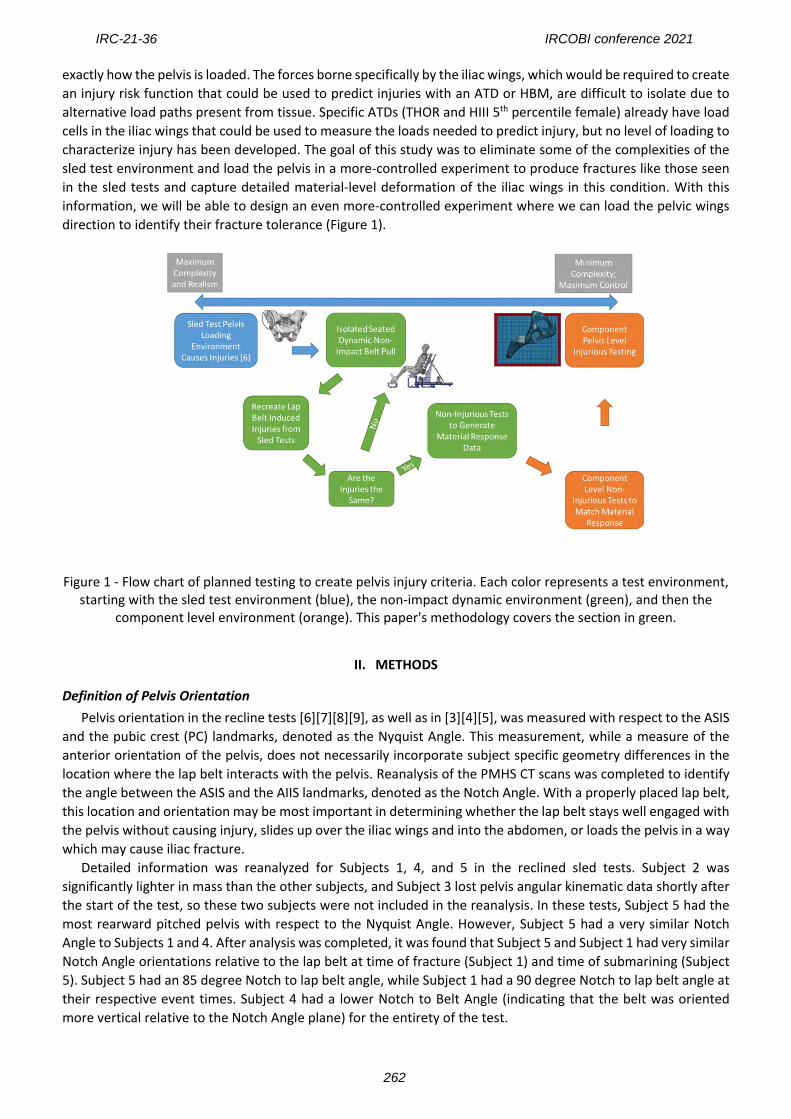
Definition of Pelvis Orientation Pelvis orientation in the recline tests [6][7][8][9], as well as in [3][4][5], was measured with respect to the ASIS
and the pubic crest (PC) landmarks, denoted as the Nyquist Angle. This measurement, while a measure of the anterior orientation of the pelvis, does not necessarily incorporate subject specific geometry differences in the location where the lap belt interacts with the pelvis. Reanalysis of the PMHS CT scans was completed to identify the angle between the ASIS and the AIIS landmarks, denoted as the Notch Angle. With a properly placed lap belt, this location and orientation may be most important in determining whether the lap belt stays well engaged with the pelvis without causing injury, slides up over the iliac wings and into the abdomen, or loads the pelvis in a way which may cause iliac fracture.
Detailed information was reanalyzed for Subjects 1, 4, and 5 in the reclined sled tests. Subject 2 was significantly lighter in mass than the other subjects, and Subject 3 lost pelvis angular kinematic data shortly after the start of the test, so these two subjects were not included in the reanalysis. In these tests, Subject 5 had the most rearward pitched pelvis with respect to the Nyquist Angle. However, Subject 5 had a very similar Notch Angle to Subjects 1 and 4. After analysis was completed, it was found that Subject 5 and Subject 1 had very similar Notch Angle orientations relative to the lap belt at time of fracture (Subject 1) and time of submarining (Subject 5). Subject 5 had an 85 degree Notch to lap belt angle, while Subject 1 had a 90 degree Notch to lap belt angle at their respective event times. Subject 4 had a lower Notch to Belt Angle (indicating that the belt was oriented more vertical relative to the Notch Angle plane) for the entirety of the test.
IRC-21-36 IRCOBI conference 2021
262
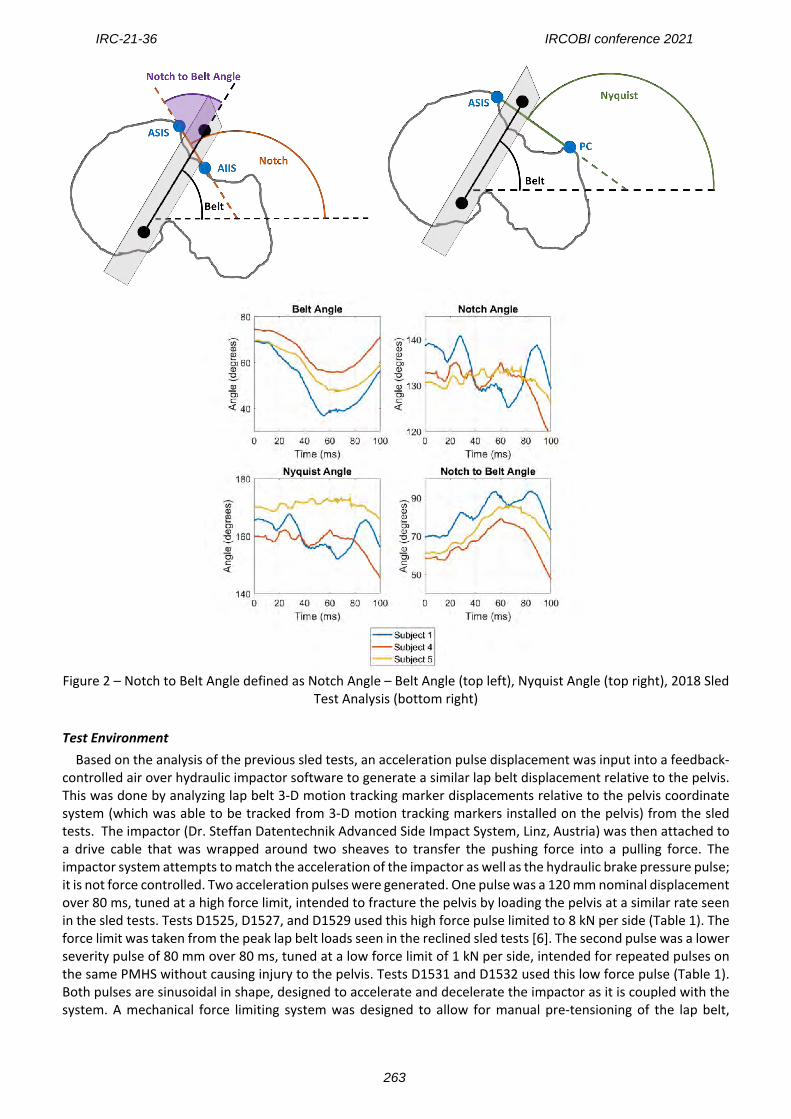
Figure 2 – Notch to Belt Angle defined as Notch Angle – Belt Angle (top left), Nyquist Angle (top right), 2018 Sled
Test Analysis (bottom right)
Test Environment Based on the analysis of the previous sled tests, an acceleration pulse displacement was input into a feedback-controlled air over hydraulic impactor software to generate a similar lap belt displacement relative to the pelvis. This was done by analyzing lap belt 3-D motion tracking marker displacements relative to the pelvis coordinate system (which was able to be tracked from 3-D motion tracking markers installed on the pelvis) from the sled tests. The impactor (Dr. Steffan Datentechnik Advanced Side Impact System, Linz, Austria) was then attached to a drive cable that was wrapped around two sheaves to transfer the pushing force into a pulling force. The impactor system attempts to match the acceleration of the impactor as well as the hydraulic brake pressure pulse; it is not force controlled. Two acceleration pulses were generated. One pulse was a 120 mm nominal displacement over 80 ms, tuned at a high force limit, intended to fracture the pelvis by loading the pelvis at a similar rate seen in the sled tests. Tests D1525, D1527, and D1529 used this high force pulse limited to 8 kN per side (Table 1). The force limit was taken from the peak lap belt loads seen in the reclined sled tests [6]. The second pulse was a lower severity pulse of 80 mm over 80 ms, tuned at a low force limit of 1 kN per side, intended for repeated pulses on the same PMHS without causing injury to the pelvis. Tests D1531 and D1532 used this low force pulse (Table 1). Both pulses are sinusoidal in shape, designed to accelerate and decelerate the impactor as it is coupled with the system. A mechanical force limiting system was designed to allow for manual pre-tensioning of the lap belt,
IRC-21-36 IRCOBI conference 2021
263
prevent extreme (tests D1525, D1527, and D1529) or any (D1531 and D1532) injury to the PMHS, as well as provide a mechanical safety displacement stop to the system. A rigid seat was constructed to allow nearly every part to translate or rotate to ease in the positioning of the subjects in a mid-crash posture. The PMHS torso was rigidly attached to the seatback using spinal mounts (see instrumentation section for more details). The seatback was designed to recline from 0 degrees (perpendicular to the ground) to 60 degrees in assisting to achieve the desired spine angle. The load cells attached to the seatback were able to translate up and down the seatback. A pelvis support plate was designed to translate and rotate relative to the seatback to assist in achieving the desired pelvis angle, as well as provide as much support to the posterior part of the pelvis as possible, with the goal of preventing as much motion of the pelvis relative to the seatback. The constraint of motion was intended to keep the loading direction as constant as possible in the condition that caused fracture in the reclined sled tests (Figure 2) [6]. The seatback, seat pan, and foot pan were all able to translate relative to each other in the X and Z directions through clamps on the tracks and adjustable legs. The lap belt cables ran through sheaves that were able to translate in the X direction to create a continuous range of lap belt angles. The adjustability was designed to create maximum flexibility and ease in matching lap belt with respect to Notch angles that caused fracture in the sled tests. This environment was not designed to replicate all of the pelvis kinematics seen in a sled test, but isolate a single posture and Notch to Belt angle.
Figure 3 - Full test fixture (top) and force limit system (bottom)
Subjects All tissue donation, testing, and handling procedures were approved by the University of Virginia Institutional
Review Board – Human Surrogate Use (IRB-HSU) Committee (Charlottesville, VA, USA). The PMHS were fresh frozen (unembalmed), and screened/negative for blood-borne pathogens including HIV and Hepatitis B and C. An initial full body computed tomography (CT) scan confirmed the absence of bone injury and abnormalities, and dual-energy X-ray absorptiometry (DXA) was used to measure bone mineral density. T-Score is a comparison of bone quality to the average person, where a negative value means a lower bone quality.
The subjects’ upper extremities were amputated at either the mid humerus and/or at the glenohumeral joint to facilitate both subject positioning and lap belt marker visibility. The lower extremities were left intact to ensure correct boundary conditions and to assist with positioning. While the intended lap belt interaction abdominal areas were left exposed, subject anonymity was preserved throughout the course of the testing. The intended lap belt interaction area was left exposed.
IRC-21-36 IRCOBI conference 2021
264
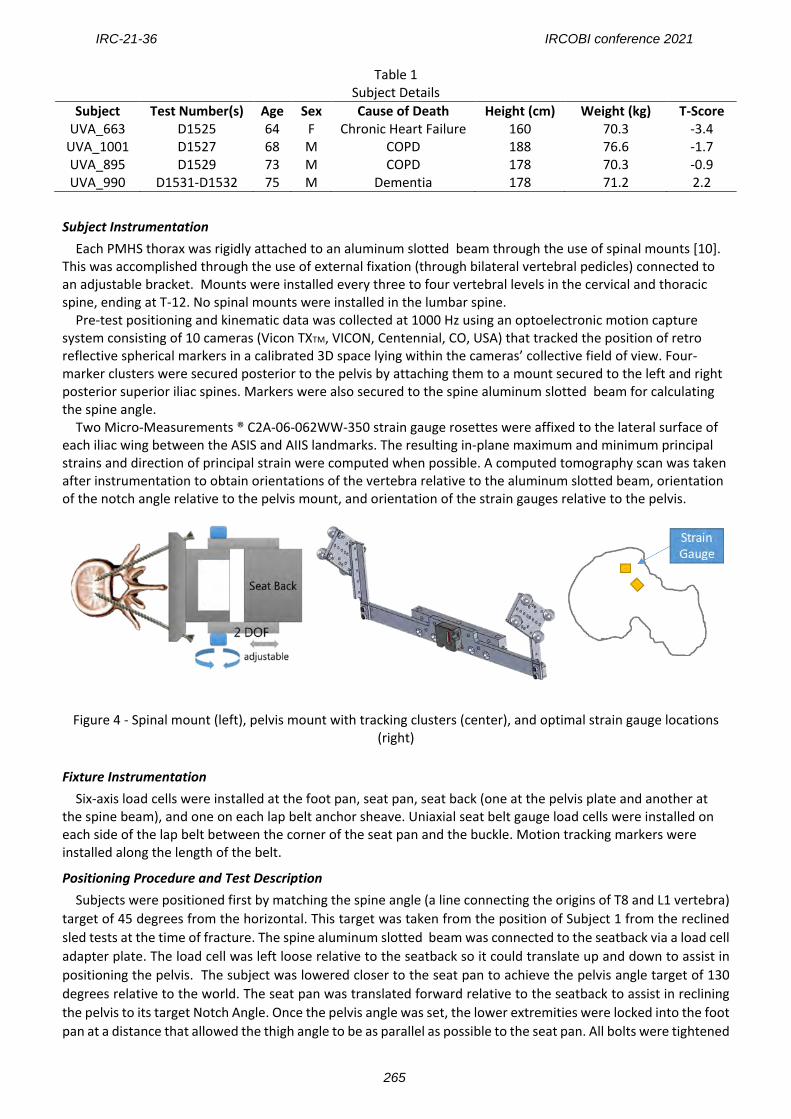
Table 1 Subject Details
Subject Test Number(s) Age Sex Cause of Death Height (cm) Weight (kg) T-Score UVA_663 D1525 64 F Chronic Heart Failure 160 70.3 -3.4
UVA_1001 D1527 68 M COPD 188 76.6 -1.7 UVA_895 D1529 73 M COPD 178 70.3 -0.9 UVA_990 D1531-D1532 75 M Dementia 178 71.2 2.2
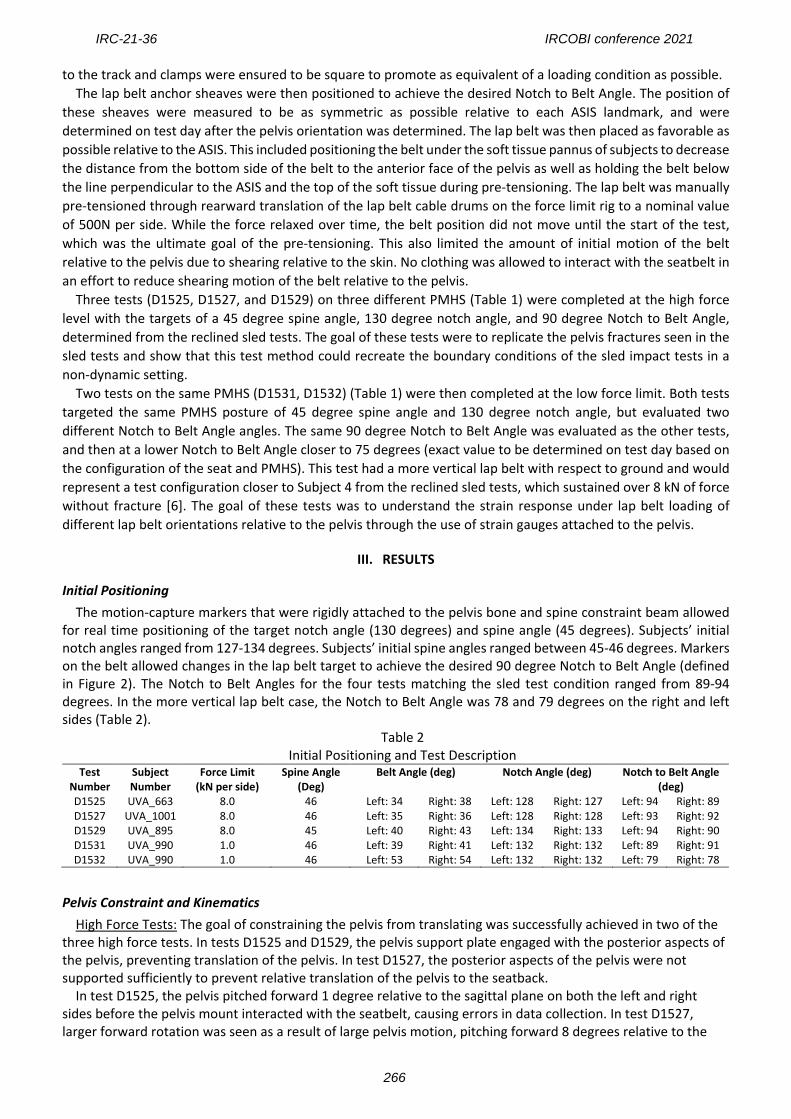
Subject Instrumentation Each PMHS thorax was rigidly attached to an aluminum slotted beam through the use of spinal mounts [10].
This was accomplished through the use of external fixation (through bilateral vertebral pedicles) connected to an adjustable bracket. Mounts were installed every three to four vertebral levels in the cervical and thoracic spine, ending at T-12. No spinal mounts were installed in the lumbar spine.
Pre-test positioning and kinematic data was collected at 1000 Hz using an optoelectronic motion capture system consisting of 10 cameras (Vicon TXTM, VICON, Centennial, CO, USA) that tracked the position of retro reflective spherical markers in a calibrated 3D space lying within the cameras’ collective field of view. Four-marker clusters were secured posterior to the pelvis by attaching them to a mount secured to the left and right posterior superior iliac spines. Markers were also secured to the spine aluminum slotted beam for calculating the spine angle.
Two Micro-Measurements ® C2A-06-062WW-350 strain gauge rosettes were affixed to the lateral surface of each iliac wing between the ASIS and AIIS landmarks. The resulting in-plane maximum and minimum principal strains and direction of principal strain were computed when possible. A computed tomography scan was taken after instrumentation to obtain orientations of the vertebra relative to the aluminum slotted beam, orientation of the notch angle relative to the pelvis mount, and orientation of the strain gauges relative to the pelvis.
Figure 4 - Spinal mount (left), pelvis mount with tracking clusters (center), and optimal strain gauge locations (right)
Fixture Instrumentation Six-axis load cells were installed at the foot pan, seat pan, seat back (one at the pelvis plate and another at the spine beam), and one on each lap belt anchor sheave. Uniaxial seat belt gauge load cells were installed on each side of the lap belt between the corner of the seat pan and the buckle. Motion tracking markers were installed along the length of the belt.
Positioning Procedure and Test Description Subjects were positioned first by matching the spine angle (a line connecting the origins of T8 and L1 vertebra)
target of 45 degrees from the horizontal. This target was taken from the position of Subject 1 from the reclined sled tests at the time of fracture. The spine aluminum slotted beam was connected to the seatback via a load cell adapter plate. The load cell was left loose relative to the seatback so it could translate up and down to assist in positioning the pelvis. The subject was lowered closer to the seat pan to achieve the pelvis angle target of 130 degrees relative to the world. The seat pan was translated forward relative to the seatback to assist in reclining the pelvis to its target Notch Angle. Once the pelvis angle was set, the lower extremities were locked into the foot pan at a distance that allowed the thigh angle to be as parallel as possible to the seat pan. All bolts were tightened
IRC-21-36 IRCOBI conference 2021
265
to the track and clamps were ensured to be square to promote as equivalent of a loading condition as possible. The lap belt anchor sheaves were then positioned to achieve the desired Notch to Belt Angle. The position of
these sheaves were measured to be as symmetric as possible relative to each ASIS landmark, and were determined on test day after the pelvis orientation was determined. The lap belt was then placed as favorable as possible relative to the ASIS. This included positioning the belt under the soft tissue pannus of subjects to decrease the distance from the bottom side of the belt to the anterior face of the pelvis as well as holding the belt below the line perpendicular to the ASIS and the top of the soft tissue during pre-tensioning. The lap belt was manually pre-tensioned through rearward translation of the lap belt cable drums on the force limit rig to a nominal value of 500N per side. While the force relaxed over time, the belt position did not move until the start of the test, which was the ultimate goal of the pre-tensioning. This also limited the amount of initial motion of the belt relative to the pelvis due to shearing relative to the skin. No clothing was allowed to interact with the seatbelt in an effort to reduce shearing motion of the belt relative to the pelvis.
Three tests (D1525, D1527, and D1529) on three different PMHS (Table 1) were completed at the high force level with the targets of a 45 degree spine angle, 130 degree notch angle, and 90 degree Notch to Belt Angle, determined from the reclined sled tests. The goal of these tests were to replicate the pelvis fractures seen in the sled tests and show that this test method could recreate the boundary conditions of the sled impact tests in a non-dynamic setting.
Two tests on the same PMHS (D1531, D1532) (Table 1) were then completed at the low force limit. Both tests targeted the same PMHS posture of 45 degree spine angle and 130 degree notch angle, but evaluated two different Notch to Belt Angle angles. The same 90 degree Notch to Belt Angle was evaluated as the other tests, and then at a lower Notch to Belt Angle closer to 75 degrees (exact value to be determined on test day based on the configuration of the seat and PMHS). This test had a more vertical lap belt with respect to ground and would represent a test configuration closer to Subject 4 from the reclined sled tests, which sustained over 8 kN of force without fracture [6]. The goal of these tests was to understand the strain response under lap belt loading of different lap belt orientations relative to the pelvis through the use of strain gauges attached to the pelvis.
III. RESULTS
Initial Positioning The motion-capture markers that were rigidly attached to the pelvis bone and spine constraint beam allowed
for real time positioning of the target notch angle (130 degrees) and spine angle (45 degrees). Subjects’ initial notch angles ranged from 127-134 degrees. Subjects’ initial spine angles ranged between 45-46 degrees. Markers on the belt allowed changes in the lap belt target to achieve the desired 90 degree Notch to Belt Angle (defined in Figure 2). The Notch to Belt Angles for the four tests matching the sled test condition ranged from 89-94 degrees. In the more vertical lap belt case, the Notch to Belt Angle was 78 and 79 degrees on the right and left sides (Table 2).
Table 2 Initial Positioning and Test Description
Test Number
Subject Number
Force Limit (kN per side)
Spine Angle (Deg)
Belt Angle (deg) Notch Angle (deg) Notch to Belt Angle (deg)
D1525 UVA_663 8.0 46 Left: 34 Right: 38 Left: 128 Right: 127 Left: 94 Right: 89 D1527 UVA_1001 8.0 46 Left: 35 Right: 36 Left: 128 Right: 128 Left: 93 Right: 92 D1529 UVA_895 8.0 45 Left: 40 Right: 43 Left: 134 Right: 133 Left: 94 Right: 90 D1531 UVA_990 1.0 46 Left: 39 Right: 41 Left: 132 Right: 132 Left: 89 Right: 91 D1532 UVA_990 1.0 46 Left: 53 Right: 54 Left: 132 Right: 132 Left: 79 Right: 78
Pelvis Constraint and Kinematics High Force Tests: The goal of constraining the pelvis from translating was successfully achieved in two of the three high force tests. In tests D1525 and D1529, the pelvis support plate engaged with the posterior aspects of the pelvis, preventing translation of the pelvis. In test D1527, the posterior aspects of the pelvis were not supported sufficiently to prevent relative translation of the pelvis to the seatback. In test D1525, the pelvis pitched forward 1 degree relative to the sagittal plane on both the left and right sides before the pelvis mount interacted with the seatbelt, causing errors in data collection. In test D1527, larger forward rotation was seen as a result of large pelvis motion, pitching forward 8 degrees relative to the
IRC-21-36 IRCOBI conference 2021
266
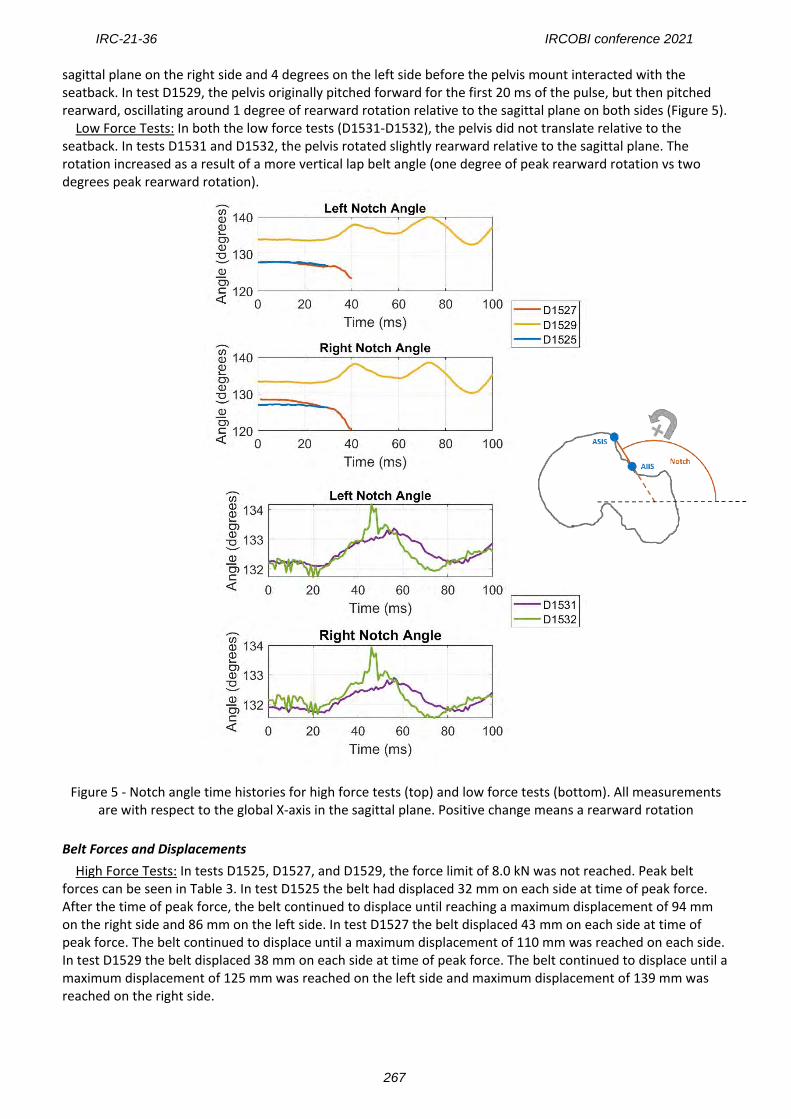
sagittal plane on the right side and 4 degrees on the left side before the pelvis mount interacted with the seatback. In test D1529, the pelvis originally pitched forward for the first 20 ms of the pulse, but then pitched rearward, oscillating around 1 degree of rearward rotation relative to the sagittal plane on both sides (Figure 5). Low Force Tests: In both the low force tests (D1531-D1532), the pelvis did not translate relative to the seatback. In tests D1531 and D1532, the pelvis rotated slightly rearward relative to the sagittal plane. The rotation increased as a result of a more vertical lap belt angle (one degree of peak rearward rotation vs two degrees peak rearward rotation).
Figure 5 - Notch angle time histories for high force tests (top) and low force tests (bottom). All measurements are with respect to the global X-axis in the sagittal plane. Positive change means a rearward rotation
Belt Forces and Displacements High Force Tests: In tests D1525, D1527, and D1529, the force limit of 8.0 kN was not reached. Peak belt forces can be seen in Table 3. In test D1525 the belt had displaced 32 mm on each side at time of peak force. After the time of peak force, the belt continued to displace until reaching a maximum displacement of 94 mm on the right side and 86 mm on the left side. In test D1527 the belt displaced 43 mm on each side at time of peak force. The belt continued to displace until a maximum displacement of 110 mm was reached on each side. In test D1529 the belt displaced 38 mm on each side at time of peak force. The belt continued to displace until a maximum displacement of 125 mm was reached on the left side and maximum displacement of 139 mm was reached on the right side.
IRC-21-36 IRCOBI conference 2021
267
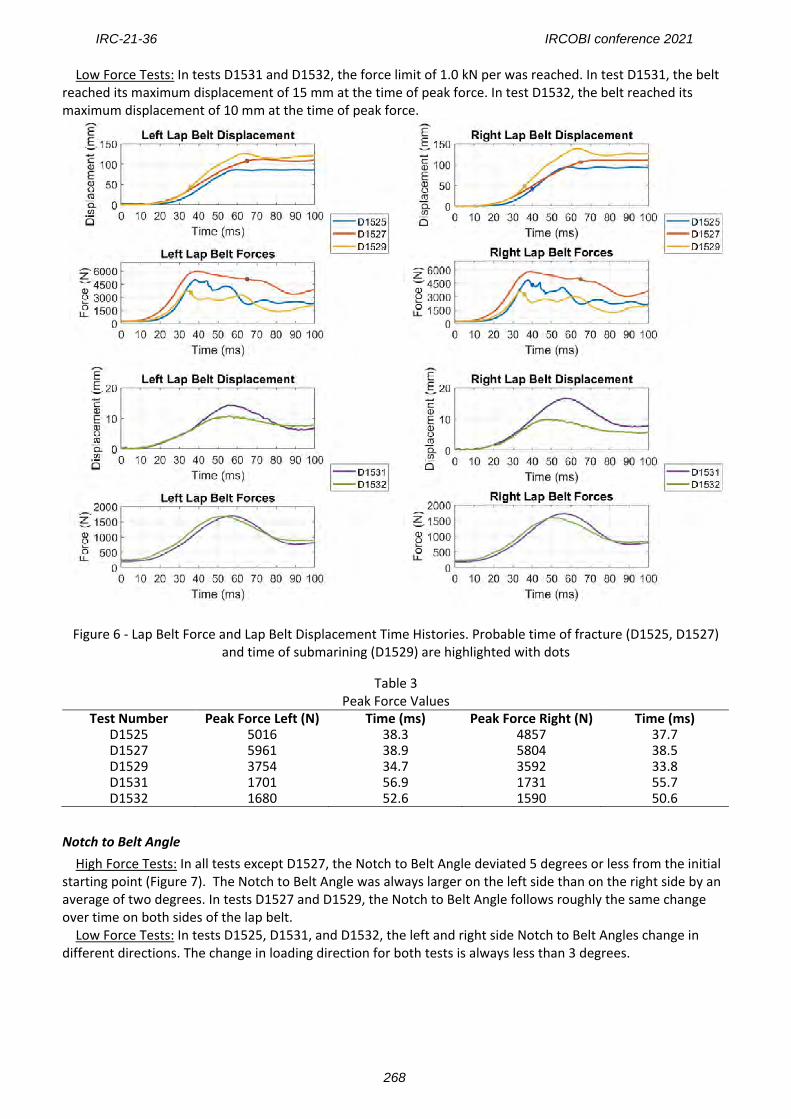
Low Force Tests: In tests D1531 and D1532, the force limit of 1.0 kN per was reached. In test D1531, the belt reached its maximum displacement of 15 mm at the time of peak force. In test D1532, the belt reached its maximum displacement of 10 mm at the time of peak force.
Figure 6 - Lap Belt Force and Lap Belt Displacement Time Histories. Probable time of fracture (D1525, D1527) and time of submarining (D1529) are highlighted with dots
Table 3 Peak Force Values
Test Number Peak Force Left (N) Time (ms) Peak Force Right (N) Time (ms) D1525 5016 38.3 4857 37.7 D1527 5961 38.9 5804 38.5 D1529 3754 34.7 3592 33.8 D1531 1701 56.9 1731 55.7 D1532 1680 52.6 1590 50.6
Notch to Belt Angle High Force Tests: In all tests except D1527, the Notch to Belt Angle deviated 5 degrees or less from the initial starting point (Figure 7). The Notch to Belt Angle was always larger on the left side than on the right side by an average of two degrees. In tests D1527 and D1529, the Notch to Belt Angle follows roughly the same change over time on both sides of the lap belt.
Low Force Tests: In tests D1525, D1531, and D1532, the left and right side Notch to Belt Angles change in different directions. The change in loading direction for both tests is always less than 3 degrees.
IRC-21-36 IRCOBI conference 2021
268
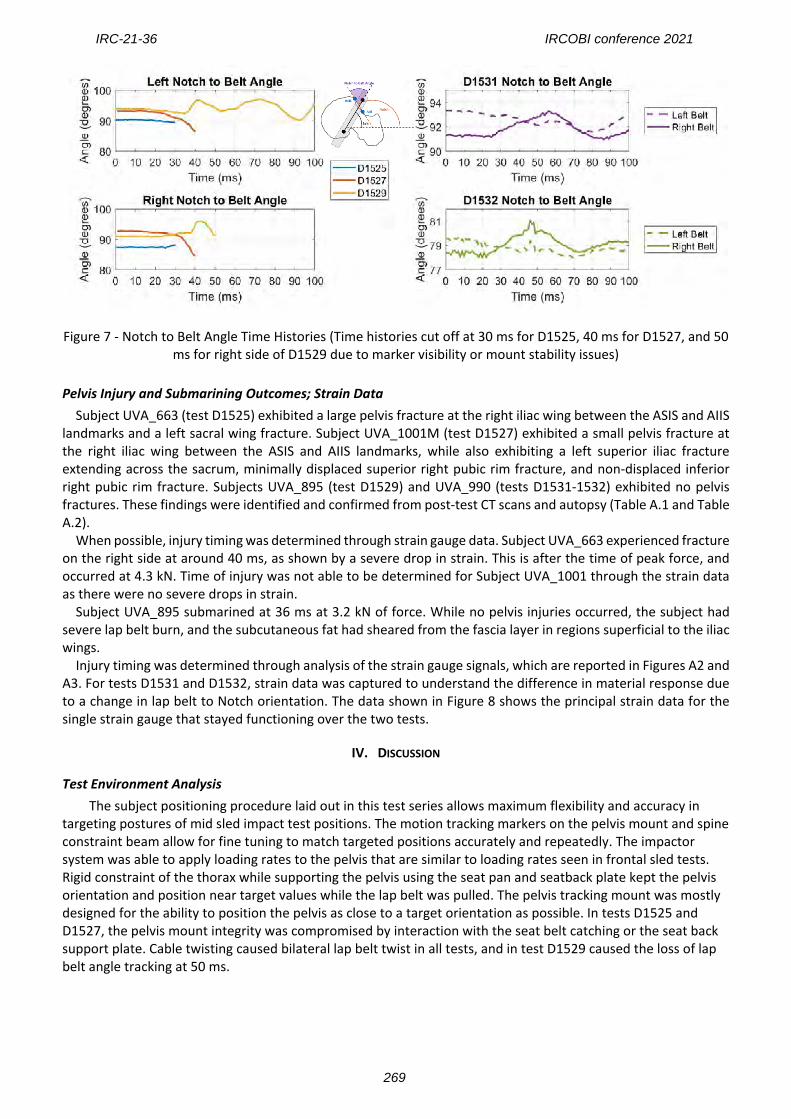
Figure 7 - Notch to Belt Angle Time Histories (Time histories cut off at 30 ms for D1525, 40 ms for D1527, and 50
ms for right side of D1529 due to marker visibility or mount stability issues)
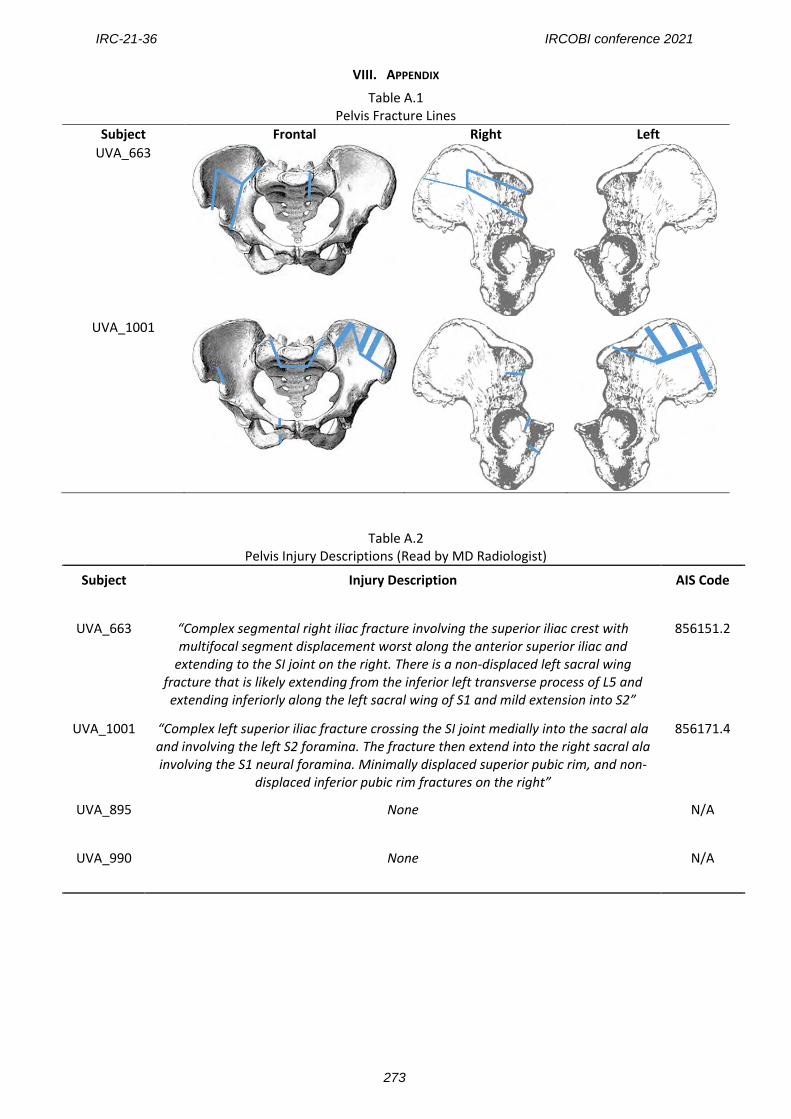
Pelvis Injury and Submarining Outcomes; Strain Data Subject UVA_663 (test D1525) exhibited a large pelvis fracture at the right iliac wing between the ASIS and AIIS
landmarks and a left sacral wing fracture. Subject UVA_1001M (test D1527) exhibited a small pelvis fracture at the right iliac wing between the ASIS and AIIS landmarks, while also exhibiting a left superior iliac fracture extending across the sacrum, minimally displaced superior right pubic rim fracture, and non-displaced inferior right pubic rim fracture. Subjects UVA_895 (test D1529) and UVA_990 (tests D1531-1532) exhibited no pelvis fractures. These findings were identified and confirmed from post-test CT scans and autopsy (Table A.1 and Table A.2).
When possible, injury timing was determined through strain gauge data. Subject UVA_663 experienced fracture on the right side at around 40 ms, as shown by a severe drop in strain. This is after the time of peak force, and occurred at 4.3 kN. Time of injury was not able to be determined for Subject UVA_1001 through the strain data as there were no severe drops in strain.
Subject UVA_895 submarined at 36 ms at 3.2 kN of force. While no pelvis injuries occurred, the subject had severe lap belt burn, and the subcutaneous fat had sheared from the fascia layer in regions superficial to the iliac wings.
Injury timing was determined through analysis of the strain gauge signals, which are reported in Figures A2 and A3. For tests D1531 and D1532, strain data was captured to understand the difference in material response due to a change in lap belt to Notch orientation. The data shown in Figure 8 shows the principal strain data for the single strain gauge that stayed functioning over the two tests.
IV. DISCUSSION
Test Environment Analysis The subject positioning procedure laid out in this test series allows maximum flexibility and accuracy in
targeting postures of mid sled impact test positions. The motion tracking markers on the pelvis mount and spine constraint beam allow for fine tuning to match targeted positions accurately and repeatedly. The impactor system was able to apply loading rates to the pelvis that are similar to loading rates seen in frontal sled tests. Rigid constraint of the thorax while supporting the pelvis using the seat pan and seatback plate kept the pelvis orientation and position near target values while the lap belt was pulled. The pelvis tracking mount was mostly designed for the ability to position the pelvis as close to a target orientation as possible. In tests D1525 and D1527, the pelvis mount integrity was compromised by interaction with the seat belt catching or the seat back support plate. Cable twisting caused bilateral lap belt twist in all tests, and in test D1529 caused the loss of lap belt angle tracking at 50 ms.
IRC-21-36 IRCOBI conference 2021
269
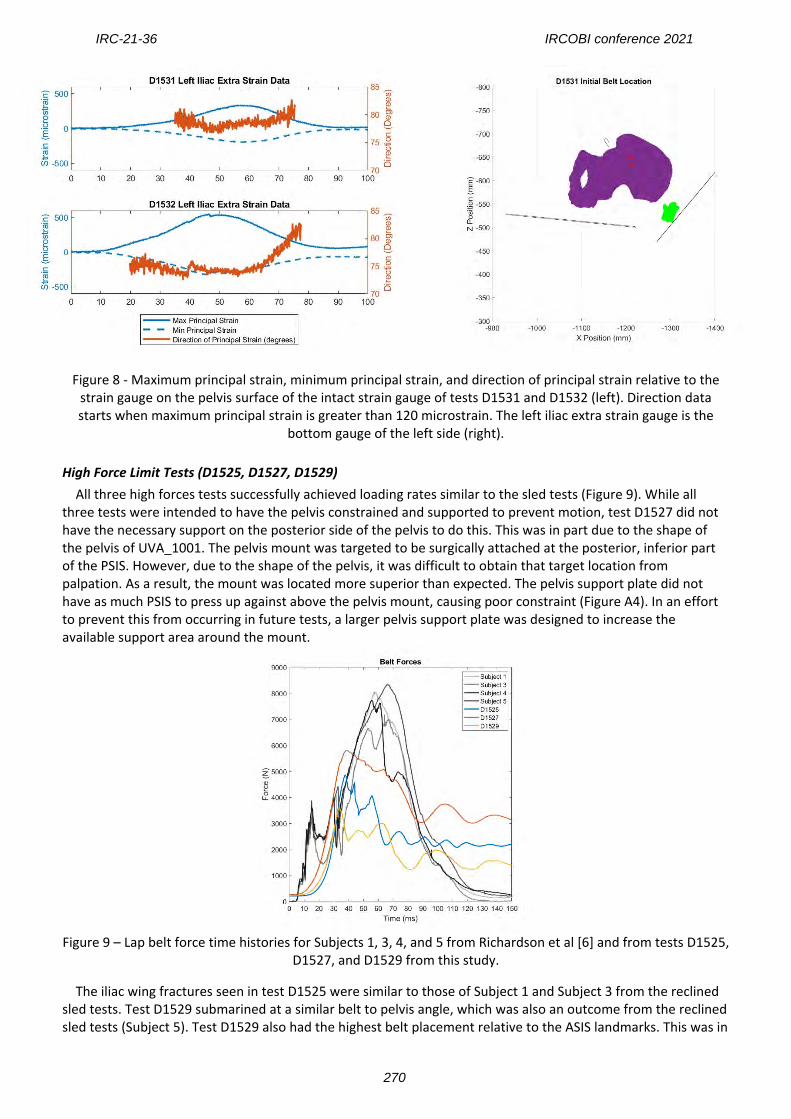
Figure 8 - Maximum principal strain, minimum principal strain, and direction of principal strain relative to the strain gauge on the pelvis surface of the intact strain gauge of tests D1531 and D1532 (left). Direction data starts when maximum principal strain is greater than 120 microstrain. The left iliac extra strain gauge is the
bottom gauge of the left side (right).
High Force Limit Tests (D1525, D1527, D1529) All three high forces tests successfully achieved loading rates similar to the sled tests (Figure 9). While all three tests were intended to have the pelvis constrained and supported to prevent motion, test D1527 did not have the necessary support on the posterior side of the pelvis to do this. This was in part due to the shape of the pelvis of UVA_1001. The pelvis mount was targeted to be surgically attached at the posterior, inferior part of the PSIS. However, due to the shape of the pelvis, it was difficult to obtain that target location from palpation. As a result, the mount was located more superior than expected. The pelvis support plate did not have as much PSIS to press up against above the pelvis mount, causing poor constraint (Figure A4). In an effort to prevent this from occurring in future tests, a larger pelvis support plate was designed to increase the available support area around the mount.
Figure 9 – Lap belt force time histories for Subjects 1, 3, 4, and 5 from Richardson et al [6] and from tests D1525,
D1527, and D1529 from this study.
The iliac wing fractures seen in test D1525 were similar to those of Subject 1 and Subject 3 from the reclined sled tests. Test D1529 submarined at a similar belt to pelvis angle, which was also an outcome from the reclined sled tests (Subject 5). Test D1529 also had the highest belt placement relative to the ASIS landmarks. This was in
IRC-21-36 IRCOBI conference 2021
270
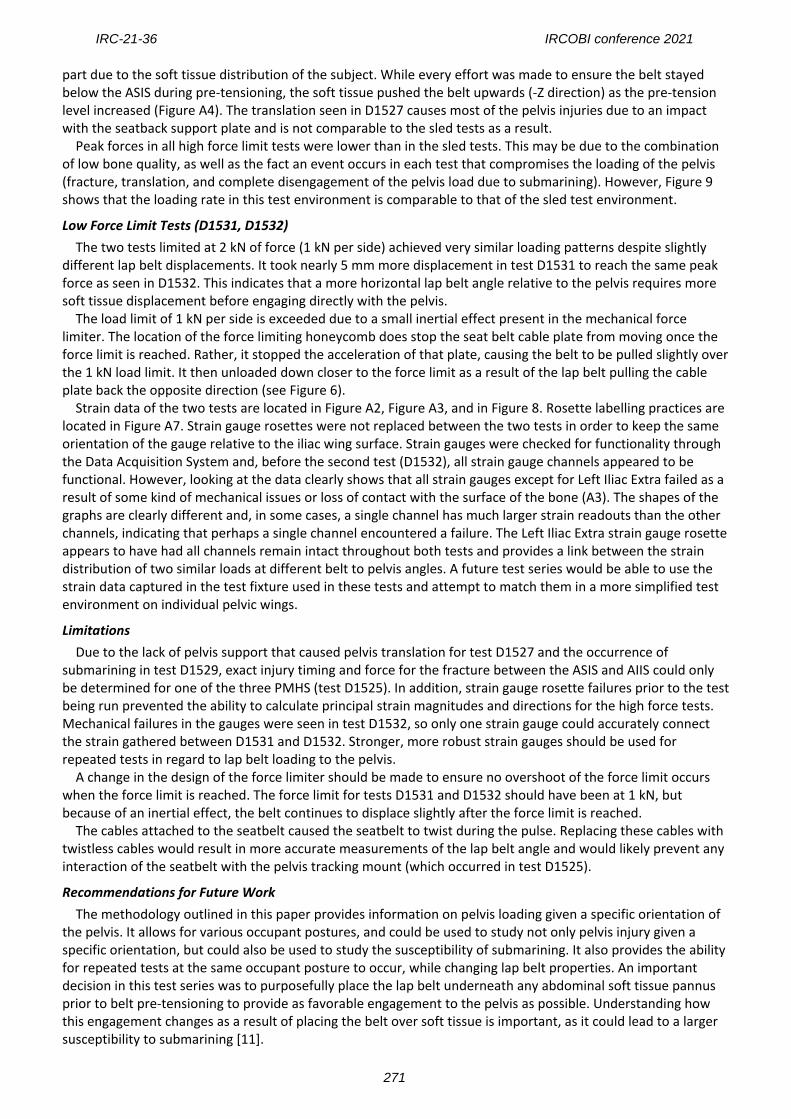
part due to the soft tissue distribution of the subject. While every effort was made to ensure the belt stayed below the ASIS during pre-tensioning, the soft tissue pushed the belt upwards (-Z direction) as the pre-tension level increased (Figure A4). The translation seen in D1527 causes most of the pelvis injuries due to an impact with the seatback support plate and is not comparable to the sled tests as a result.
Peak forces in all high force limit tests were lower than in the sled tests. This may be due to the combination of low bone quality, as well as the fact an event occurs in each test that compromises the loading of the pelvis (fracture, translation, and complete disengagement of the pelvis load due to submarining). However, Figure 9 shows that the loading rate in this test environment is comparable to that of the sled test environment.
Low Force Limit Tests (D1531, D1532) The two tests limited at 2 kN of force (1 kN per side) achieved very similar loading patterns despite slightly different lap belt displacements. It took nearly 5 mm more displacement in test D1531 to reach the same peak force as seen in D1532. This indicates that a more horizontal lap belt angle relative to the pelvis requires more soft tissue displacement before engaging directly with the pelvis. The load limit of 1 kN per side is exceeded due to a small inertial effect present in the mechanical force limiter. The location of the force limiting honeycomb does stop the seat belt cable plate from moving once the force limit is reached. Rather, it stopped the acceleration of that plate, causing the belt to be pulled slightly over the 1 kN load limit. It then unloaded down closer to the force limit as a result of the lap belt pulling the cable plate back the opposite direction (see Figure 6). Strain data of the two tests are located in Figure A2, Figure A3, and in Figure 8. Rosette labelling practices are located in Figure A7. Strain gauge rosettes were not replaced between the two tests in order to keep the same orientation of the gauge relative to the iliac wing surface. Strain gauges were checked for functionality through the Data Acquisition System and, before the second test (D1532), all strain gauge channels appeared to be functional. However, looking at the data clearly shows that all strain gauges except for Left Iliac Extra failed as a result of some kind of mechanical issues or loss of contact with the surface of the bone (A3). The shapes of the graphs are clearly different and, in some cases, a single channel has much larger strain readouts than the other channels, indicating that perhaps a single channel encountered a failure. The Left Iliac Extra strain gauge rosette appears to have had all channels remain intact throughout both tests and provides a link between the strain distribution of two similar loads at different belt to pelvis angles. A future test series would be able to use the strain data captured in the test fixture used in these tests and attempt to match them in a more simplified test environment on individual pelvic wings.
Limitations Due to the lack of pelvis support that caused pelvis translation for test D1527 and the occurrence of submarining in test D1529, exact injury timing and force for the fracture between the ASIS and AIIS could only be determined for one of the three PMHS (test D1525). In addition, strain gauge rosette failures prior to the test being run prevented the ability to calculate principal strain magnitudes and directions for the high force tests. Mechanical failures in the gauges were seen in test D1532, so only one strain gauge could accurately connect the strain gathered between D1531 and D1532. Stronger, more robust strain gauges should be used for repeated tests in regard to lap belt loading to the pelvis. A change in the design of the force limiter should be made to ensure no overshoot of the force limit occurs when the force limit is reached. The force limit for tests D1531 and D1532 should have been at 1 kN, but because of an inertial effect, the belt continues to displace slightly after the force limit is reached. The cables attached to the seatbelt caused the seatbelt to twist during the pulse. Replacing these cables with twistless cables would result in more accurate measurements of the lap belt angle and would likely prevent any interaction of the seatbelt with the pelvis tracking mount (which occurred in test D1525).
Recommendations for Future Work The methodology outlined in this paper provides information on pelvis loading given a specific orientation of the pelvis. It allows for various occupant postures, and could be used to study not only pelvis injury given a specific orientation, but could also be used to study the susceptibility of submarining. It also provides the ability for repeated tests at the same occupant posture to occur, while changing lap belt properties. An important decision in this test series was to purposefully place the lap belt underneath any abdominal soft tissue pannus prior to belt pre-tensioning to provide as favorable engagement to the pelvis as possible. Understanding how this engagement changes as a result of placing the belt over soft tissue is important, as it could lead to a larger susceptibility to submarining [11].
IRC-21-36 IRCOBI conference 2021
271
To the best of this author’s knowledge, this paper presents a new way of describing pelvis orientation. The Notch Angle incorporates both orientation of the pelvis and subject specific geometry in the same measurement. It appears, based on this study, that Notch Angle may be a better judge of belt to pelvis interaction (or lack of) than other descriptors. Tests D1531 and D1532 provide strain data between two different belt to pelvis conditions. The high force tests provides a link between dynamic sled impact tests and non-impact dynamic tests by reproducing the injuries seen in the sled tests and by matching the loading rate of the sled environment. The strain data in Figure A3 and Figure 8 will provide the link from the non-impact dynamic simplified testing environment to an even more simplified, component level experiment to develop an injury risk function for the Notch region between the ASIS and AIIS by testing the same, uninjured pelvis in that more simplified environment.
V. CONCLUSIONS
The following conclusions can be drawn from this study: - The methodology outlined in this study provides the ability to isolate an instance from dynamic sled
impact tests and replicate the lap belt to pelvis loading environment. This can be seen through belt force time histories that load the pelvis in a similar rate to sled tests (Figure 9), as well as the consistent directions of loading provided through the constraint of the pelvis.
- The Notch to Belt Angle definition for pelvis orientation relative to lap belt angle appears to be important in determining how an individual subject will react to a given lap belt load.
- The strain data captured in tests D1531 and D1532 will give the ability for future research to be conducted that will ultimately link loading scenarios from the methodology described in this paper to a component level examination of the anterior part of the pelvis.
VI. ACKNOWLEDGEMENT
Thank you to everyone at the Center for Applied Biomechanics who assisted with this project. Thank you to Autoliv and the RCCADS consortium for funding this project.
VII. REFERENCES
[1] Schmidt G, Kallieris D, Barz J, Mattern R. Results of 49 Cadaver Tests Simulating Frontal Collision of Front Seat Passengers. 18th Stapp Car Crash Conference, 1974, Ann Arbor, MI. [2] Fayon A, Tarriere C, Wasfish G, Got C, Patel A. Thorax of 3-Point Belt wearers During a Crash (Experiments with Cadavers). 19th Stapp Car Crash Conference, 1975, San Diego, CA. [3] Luet C, Trosseille X et al. Kinematics and Dynamics of the Pelvis in the Process of Submarining using PMHS Sled Tests. 56th Stapp Car Crash Conference, 2012, Savannah, GA. [4] Uriot J, Potier P et al. Reference PMHS Sled test to Assess Submarining. 59th Stapp Car Crash Conference, 2015, New Orleans, LA. [5] Trosseille X, Petit P et al. Reference PMHS Sled Tests to Assess Submarining of the Small Female. 62nd Stapp Car Crash Conference, 2018, San Diego, CA. [6] Richardson R, Jayathirtha M et al. Pelvis Kinematics and Injuries of Reclined Occupants in Frontal Impacts. Proceedings of IRCOBI Conference, 2020, Munich, Germany. [7] Richardson R, Donlon J P et al. Test Methodology for Evaluating the Reclined Seating Environment with Human Surrogates. 26th International Technical Conference on the Enhanced Safety of Vehicles (ESV), 2019, Eindhoven, Netherlands. [8] Richardson R, Jayathirtha M et al. Thoracolumbar spine kinematics and injuries in frontal impacts with reclined occupants. Traffic Injury Prevention, 2020, Volume 21: 1-7. [9] Richardson R, Donlon J P et al. Kinematic and Injury Response of Reclined PMHS in Frontal Impacts. 64th Stapp Car Crash Conference, 2020, Denver, CO. [10] Kim T, Park G et al. Abdominal characterization under lap belt loading. 24th International Technical Conference on the Enhanced Safety of Vehicles (ESV), Gothenburg, Sweden. [11] Reed M, Ebert S, Jones M. Posture and Belt Fit in Reclined Passenger Seats. Traffic Injury Prevention, 2019, Volume 20: S38-S42.
IRC-21-36 IRCOBI conference 2021
272
VIII. APPENDIX
Table A.1 Pelvis Fracture Lines
Subject Frontal Right Left UVA_663
UVA_1001
Table A.2 Pelvis Injury Descriptions (Read by MD Radiologist)
Subject Injury Description AIS Code
UVA_663 “Complex segmental right iliac fracture involving the superior iliac crest with multifocal segment displacement worst along the anterior superior iliac and
extending to the SI joint on the right. There is a non-displaced left sacral wing fracture that is likely extending from the inferior left transverse process of L5 and extending inferiorly along the left sacral wing of S1 and mild extension into S2”
856151.2
UVA_1001 “Complex left superior iliac fracture crossing the SI joint medially into the sacral ala and involving the left S2 foramina. The fracture then extend into the right sacral ala involving the S1 neural foramina. Minimally displaced superior pubic rim, and non-
displaced inferior pubic rim fractures on the right”
856171.4
UVA_895 None N/A
UVA_990 None N/A
IRC-21-36 IRCOBI conference 2021
273
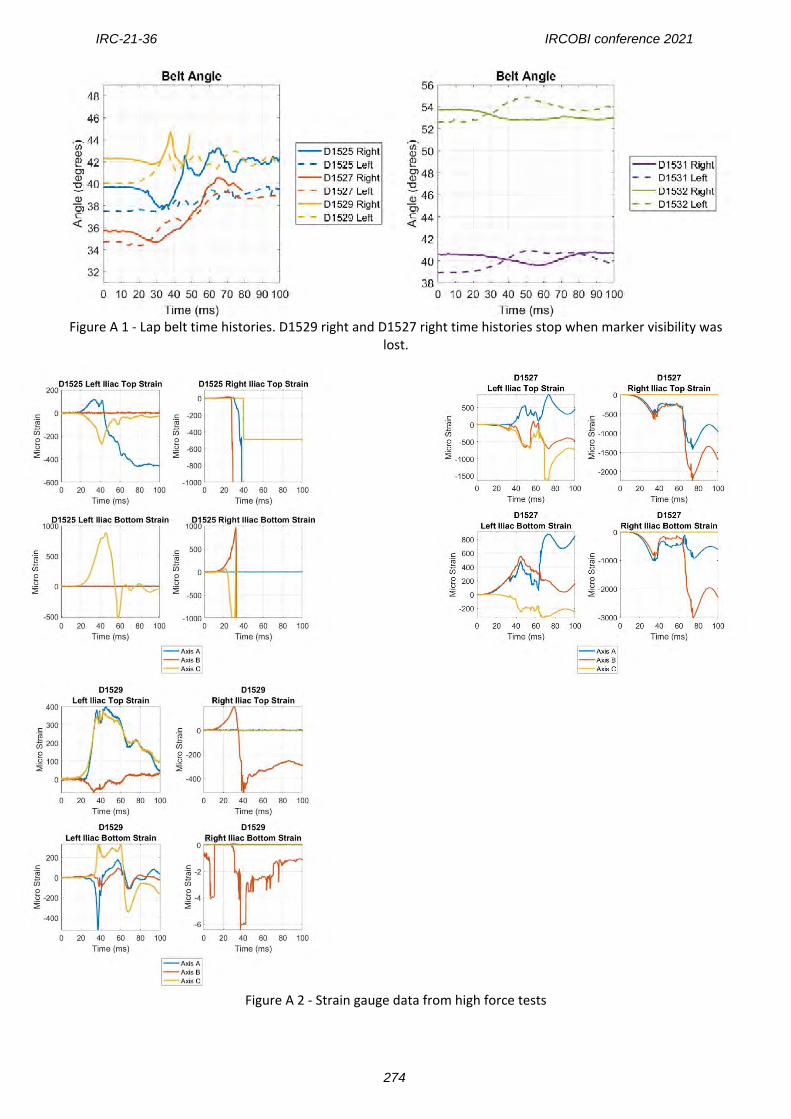
Figure A 1 - Lap belt time histories. D1529 right and D1527 right time histories stop when marker visibility was
lost.
Figure A 2 - Strain gauge data from high force tests
IRC-21-36 IRCOBI conference 2021
274
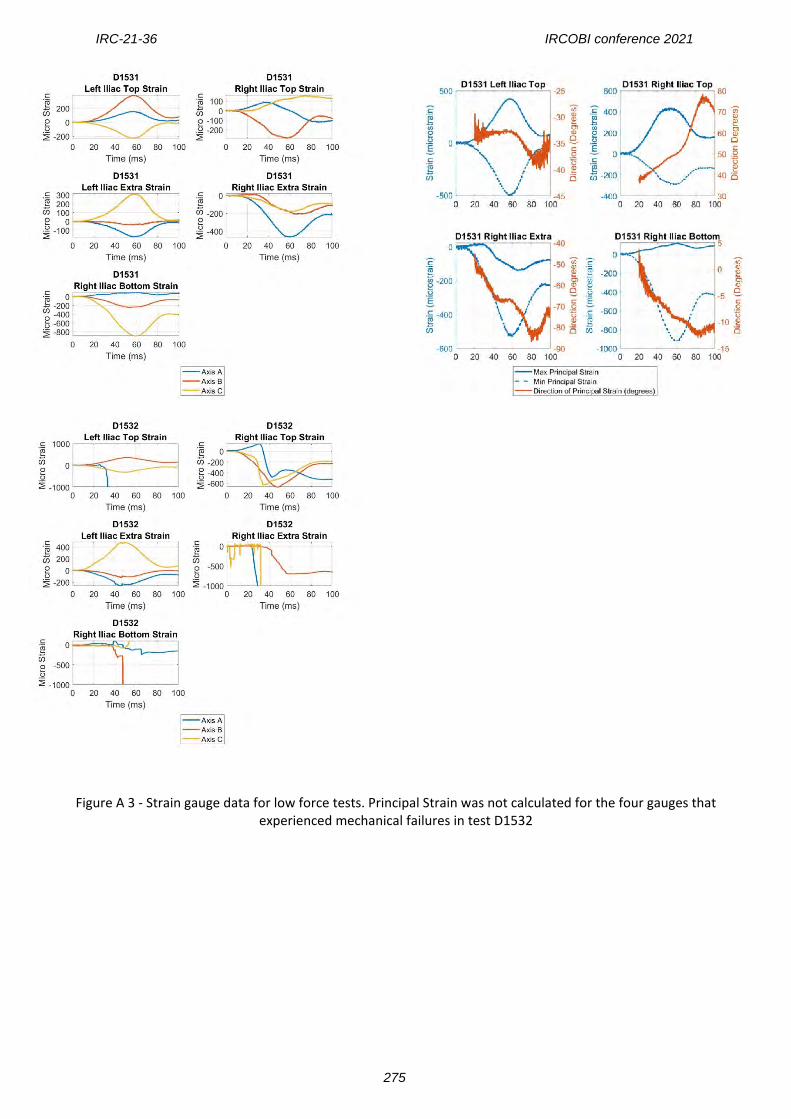
Figure A 3 - Strain gauge data for low force tests. Principal Strain was not calculated for the four gauges that experienced mechanical failures in test D1532
IRC-21-36 IRCOBI conference 2021
275
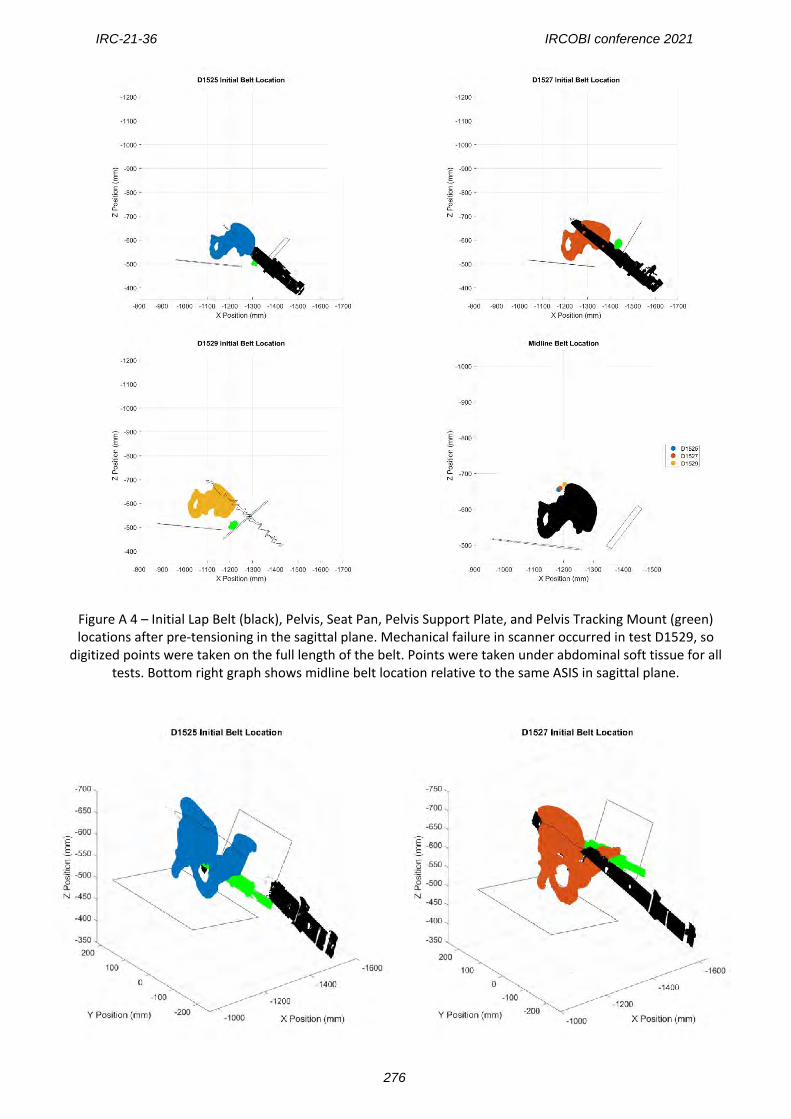
Figure A 4 – Initial Lap Belt (black), Pelvis, Seat Pan, Pelvis Support Plate, and Pelvis Tracking Mount (green) locations after pre-tensioning in the sagittal plane. Mechanical failure in scanner occurred in test D1529, so
digitized points were taken on the full length of the belt. Points were taken under abdominal soft tissue for all tests. Bottom right graph shows midline belt location relative to the same ASIS in sagittal plane.
IRC-21-36 IRCOBI conference 2021
276
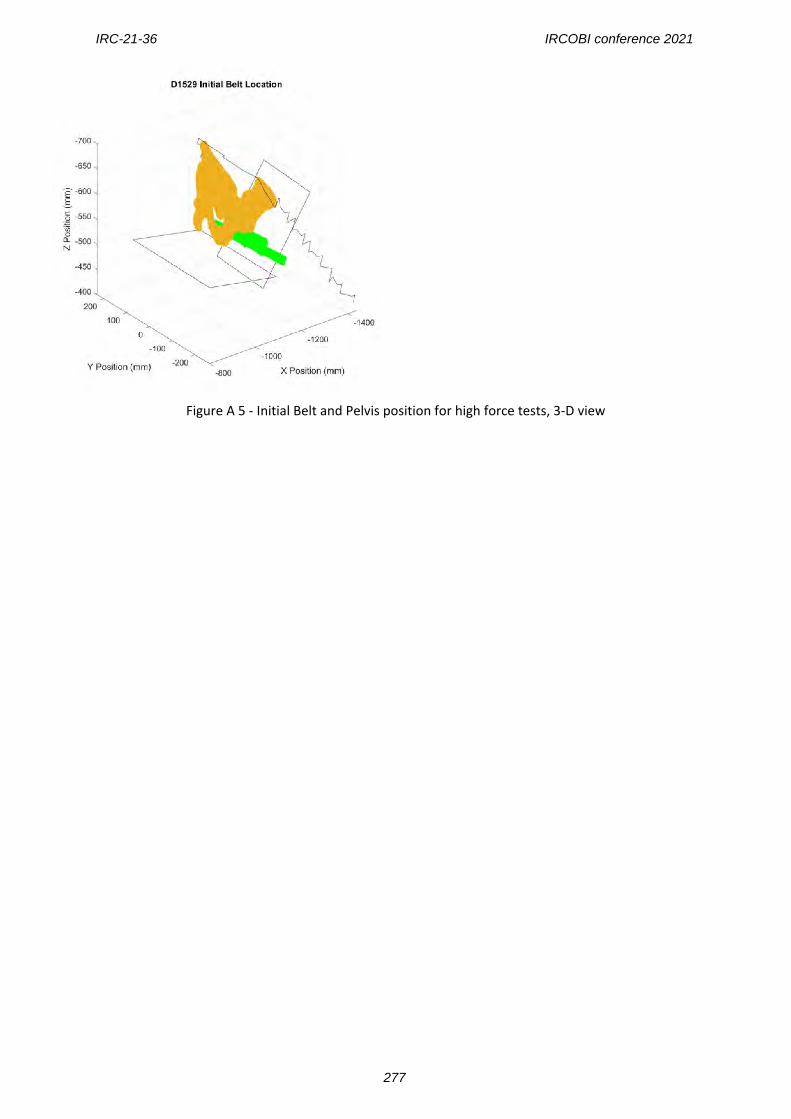
Figure A 5 - Initial Belt and Pelvis position for high force tests, 3-D view
IRC-21-36 IRCOBI conference 2021
277
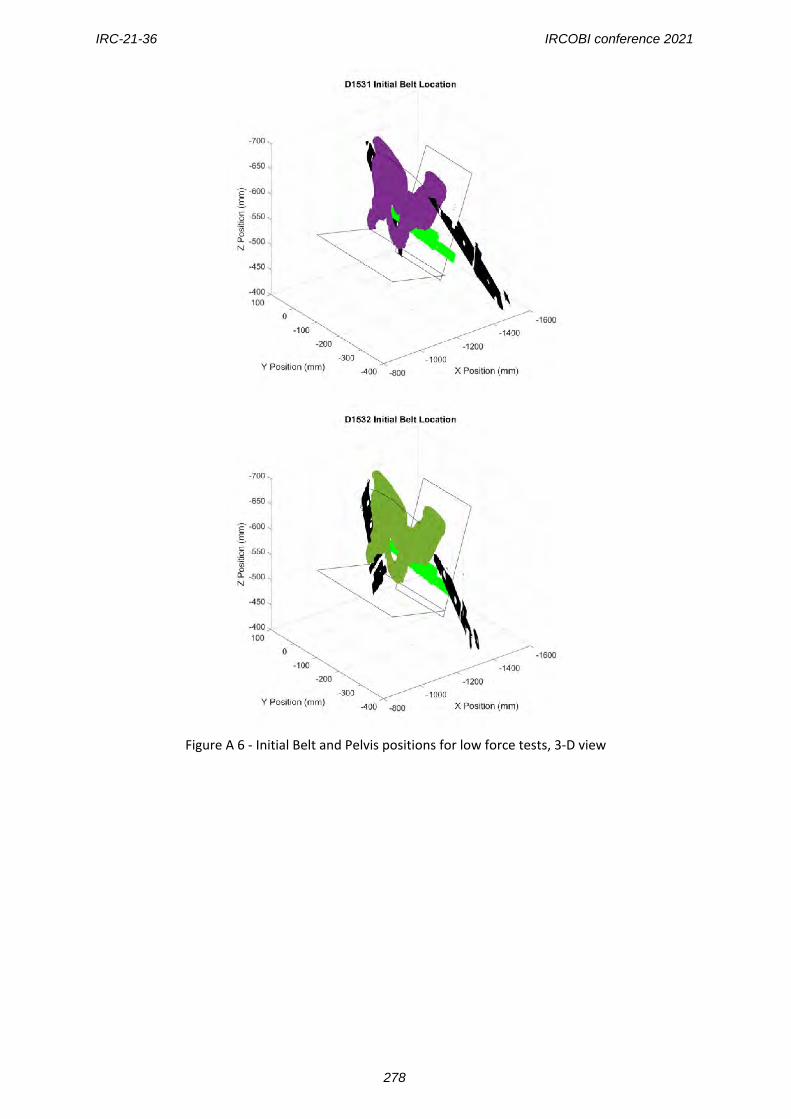
Figure A 6 - Initial Belt and Pelvis positions for low force tests, 3-D view
IRC-21-36 IRCOBI conference 2021
278
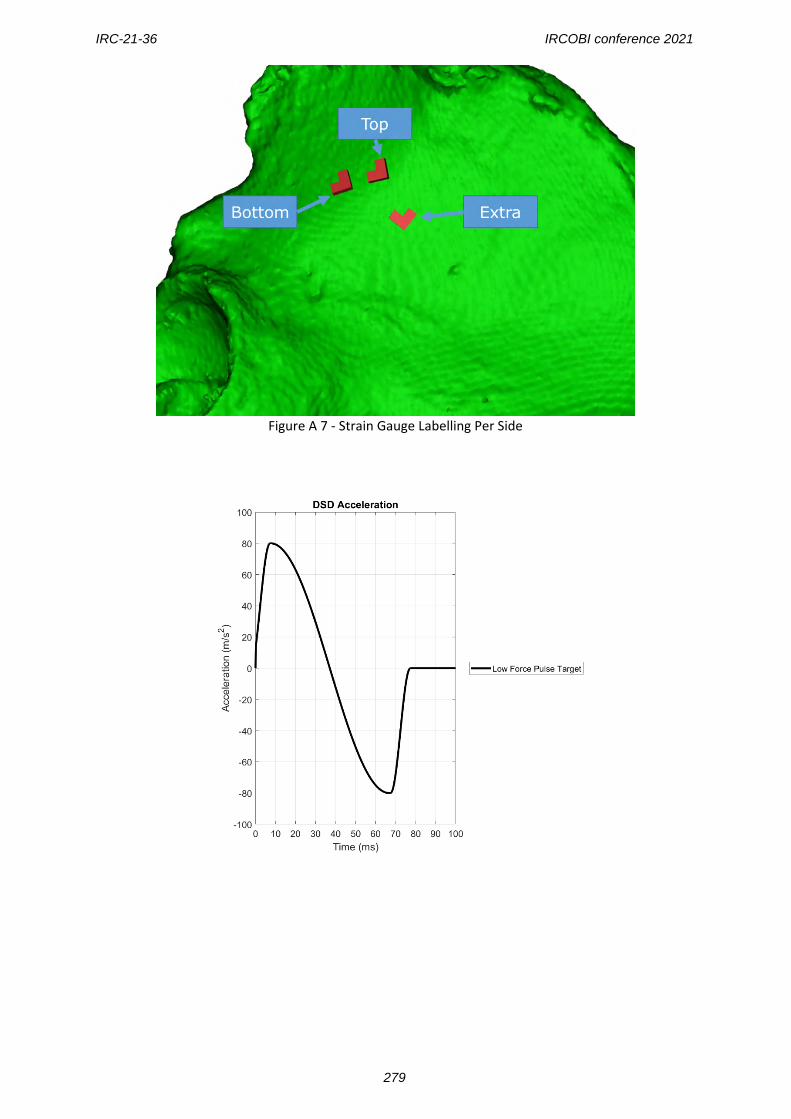
Figure A 7 - Strain Gauge Labelling Per Side
IRC-21-36 IRCOBI conference 2021
279
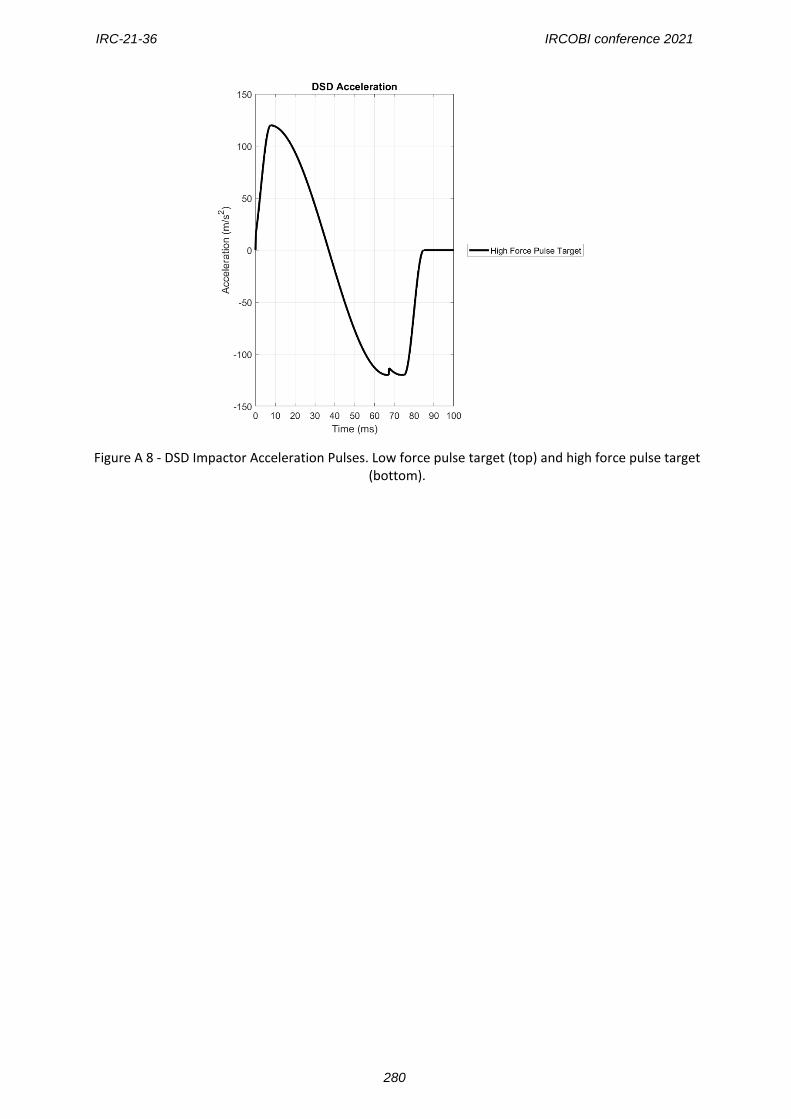
Figure A 8 - DSD Impactor Acceleration Pulses. Low force pulse target (top) and high force pulse target
(bottom).
IRC-21-36 IRCOBI conference 2021
280
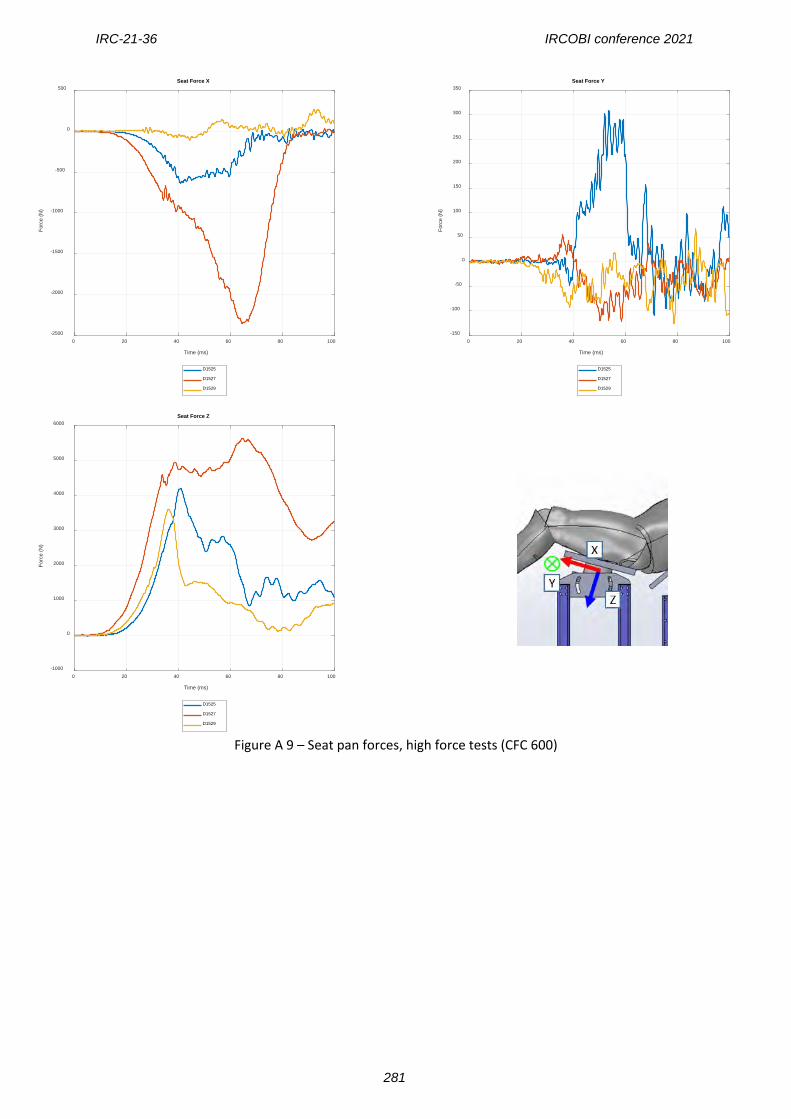
Figure A 9 – Seat pan forces, high force tests (CFC 600)
0 20 40 60 80 100
Time (ms)
-2500
-2000
-1500
-1000
-500
0
500
Forc
e (N
)
Seat Force X
D1525
D1527
D1529
0 20 40 60 80 100
Time (ms)
-150
-100
-50
0
50
100
150
200
250
300
350
Forc
e (N
)
Seat Force Y
D1525
D1527
D1529
0 20 40 60 80 100
Time (ms)
-1000
0
1000
2000
3000
4000
5000
6000
Forc
e (N
)
Seat Force Z
D1525
D1527
D1529
IRC-21-36 IRCOBI conference 2021
281
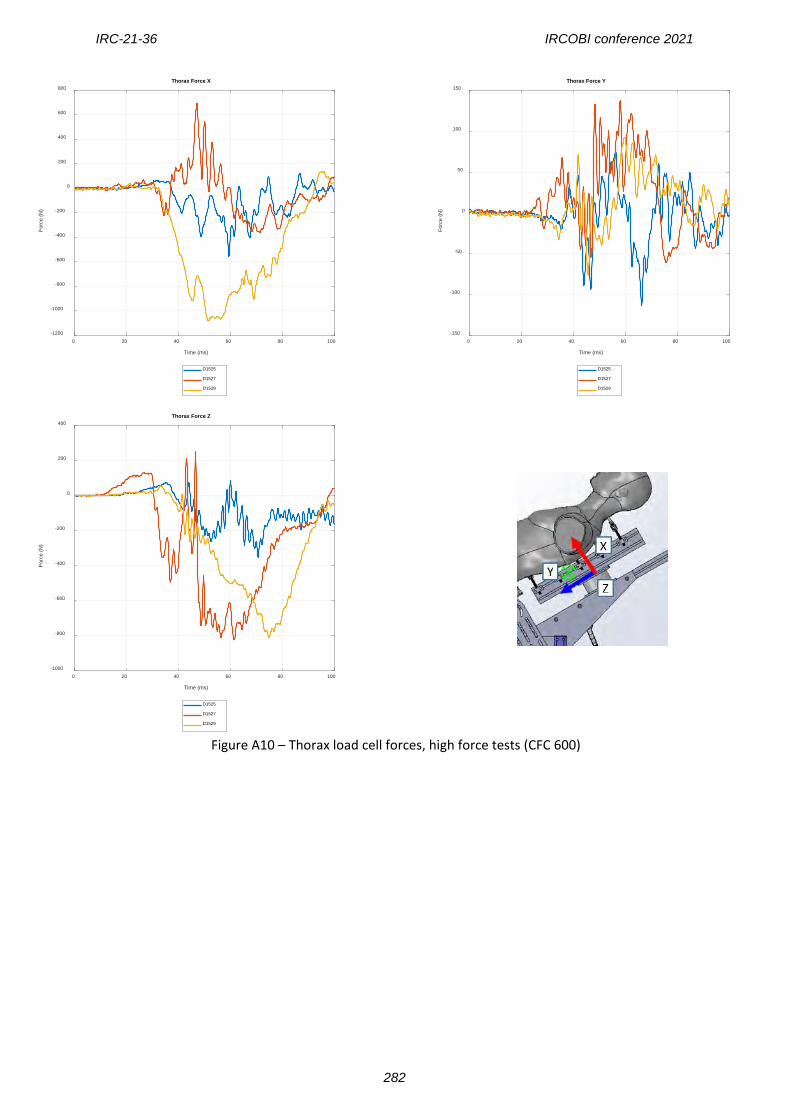
Figure A10 – Thorax load cell forces, high force tests (CFC 600)
0 20 40 60 80 100
Time (ms)
-1200
-1000
-800
-600
-400
-200
0
200
400
600
800
Forc
e (N
)
Thorax Force X
D1525
D1527
D1529
0 20 40 60 80 100
Time (ms)
-150
-100
-50
0
50
100
150
Forc
e (N
)
Thorax Force Y
D1525
D1527
D1529
0 20 40 60 80 100
Time (ms)
-1000
-800
-600
-400
-200
0
200
400
Forc
e (N
)
Thorax Force Z
D1525
D1527
D1529
IRC-21-36 IRCOBI conference 2021
282
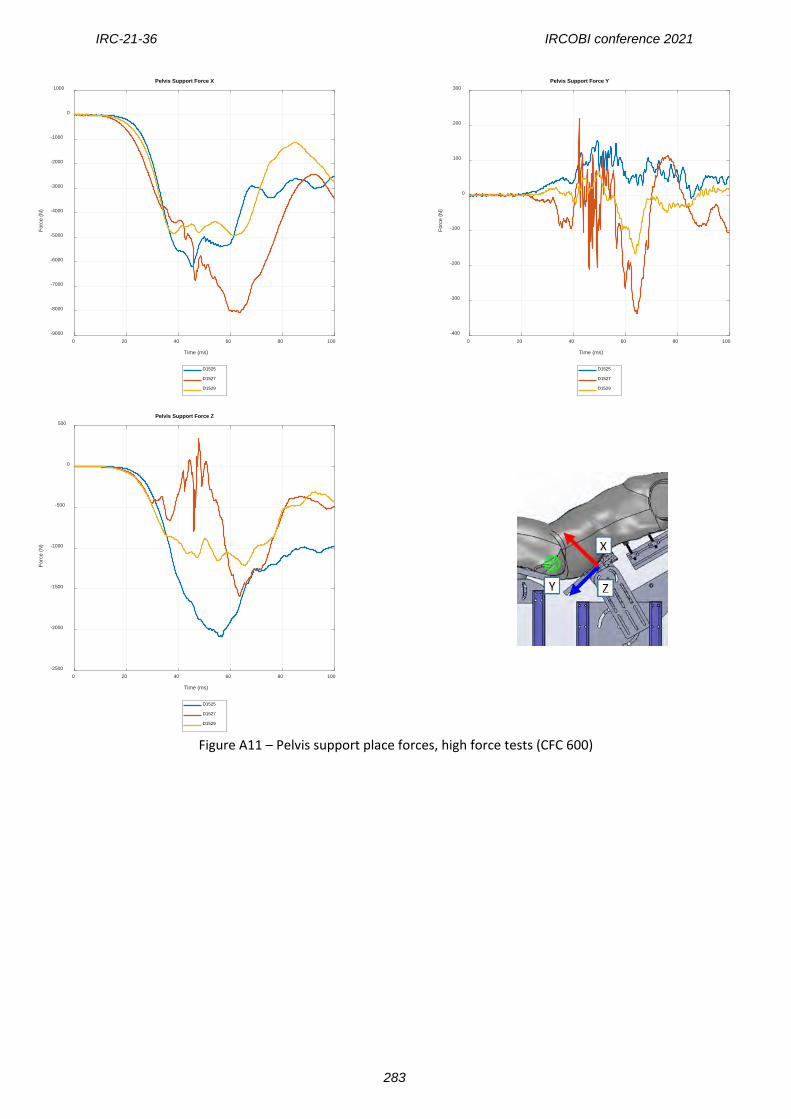
Figure A11 – Pelvis support place forces, high force tests (CFC 600)
0 20 40 60 80 100
Time (ms)
-9000
-8000
-7000
-6000
-5000
-4000
-3000
-2000
-1000
0
1000
Forc
e (N
)
Pelvis Support Force X
D1525
D1527
D1529
0 20 40 60 80 100
Time (ms)
-400
-300
-200
-100
0
100
200
300
Forc
e (N
)
Pelvis Support Force Y
D1525
D1527
D1529
0 20 40 60 80 100
Time (ms)
-2500
-2000
-1500
-1000
-500
0
500
Forc
e (N
)
Pelvis Support Force Z
D1525
D1527
D1529
IRC-21-36 IRCOBI conference 2021
283
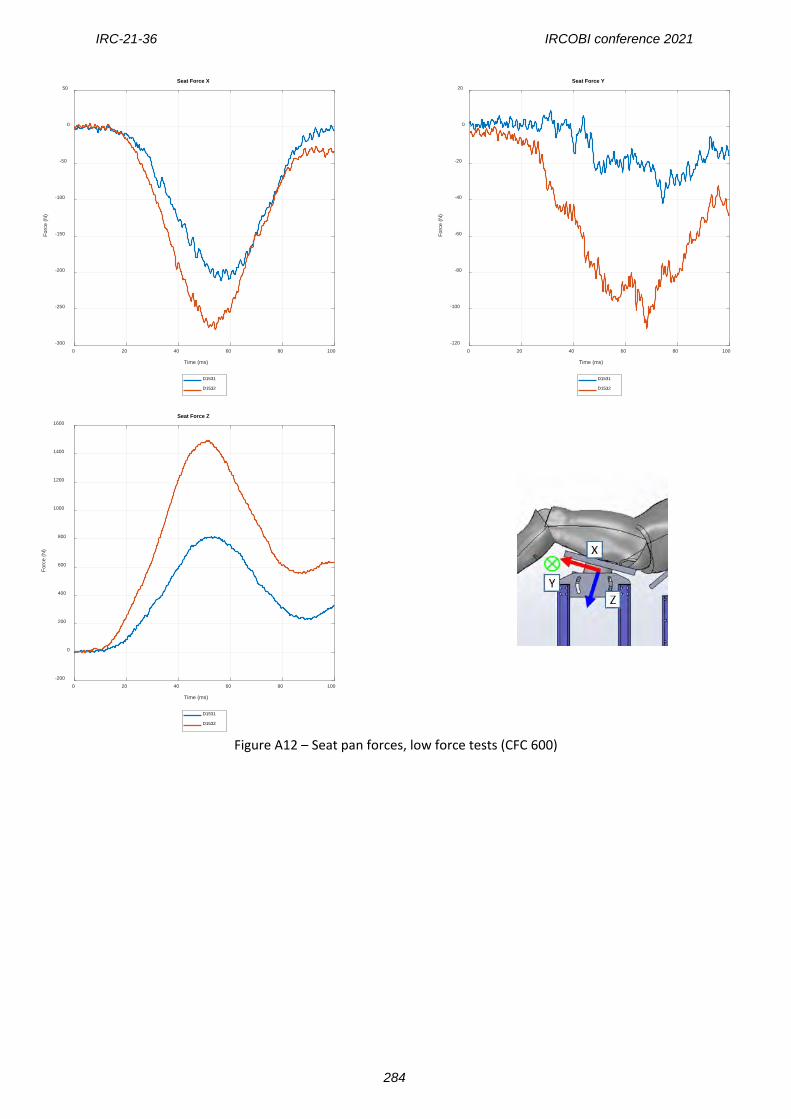
Figure A12 – Seat pan forces, low force tests (CFC 600)
0 20 40 60 80 100
Time (ms)
-300
-250
-200
-150
-100
-50
0
50
Forc
e (N
)
Seat Force X
D1531
D1532
0 20 40 60 80 100
Time (ms)
-120
-100
-80
-60
-40
-20
0
20
Forc
e (N
)
Seat Force Y
D1531
D1532
0 20 40 60 80 100
Time (ms)
-200
0
200
400
600
800
1000
1200
1400
1600
Forc
e (N
)
Seat Force Z
D1531
D1532
IRC-21-36 IRCOBI conference 2021
284
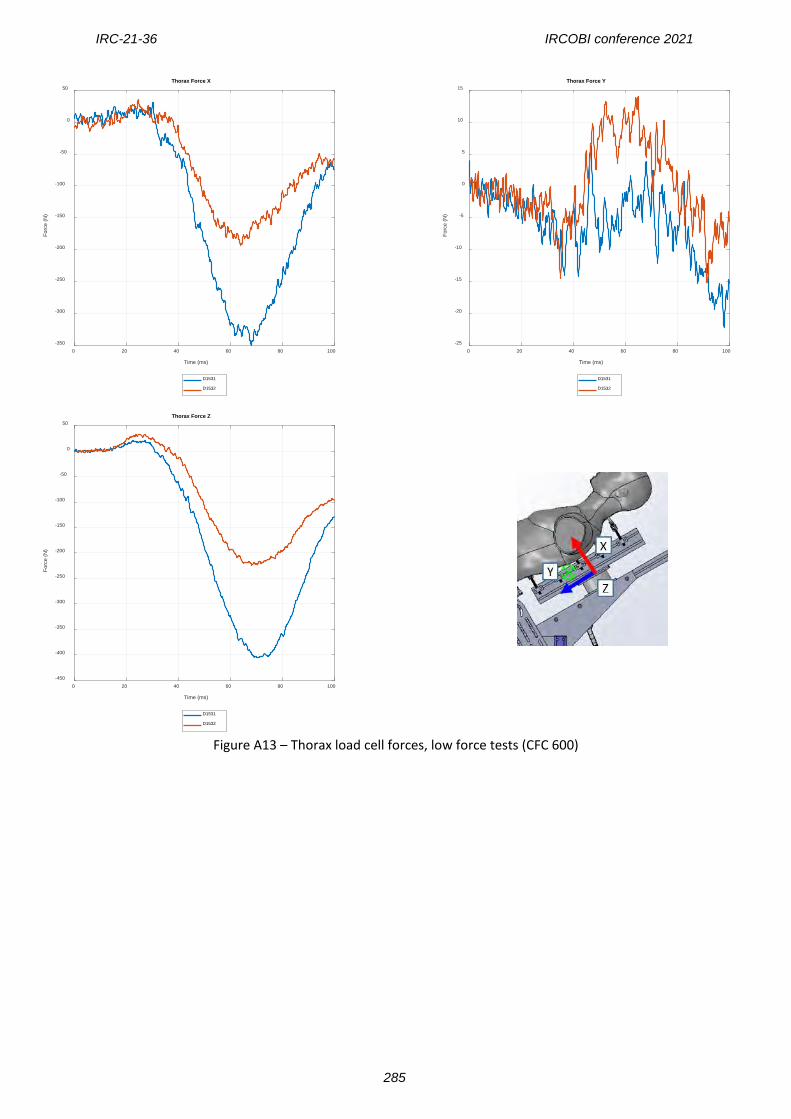
Figure A13 – Thorax load cell forces, low force tests (CFC 600)
0 20 40 60 80 100
Time (ms)
-350
-300
-250
-200
-150
-100
-50
0
50
Forc
e (N
)
Thorax Force X
D1531
D1532
0 20 40 60 80 100
Time (ms)
-25
-20
-15
-10
-5
0
5
10
15
Forc
e (N
)
Thorax Force Y
D1531
D1532
0 20 40 60 80 100
Time (ms)
-450
-400
-350
-300
-250
-200
-150
-100
-50
0
50
Forc
e (N
)
Thorax Force Z
D1531
D1532
IRC-21-36 IRCOBI conference 2021
285
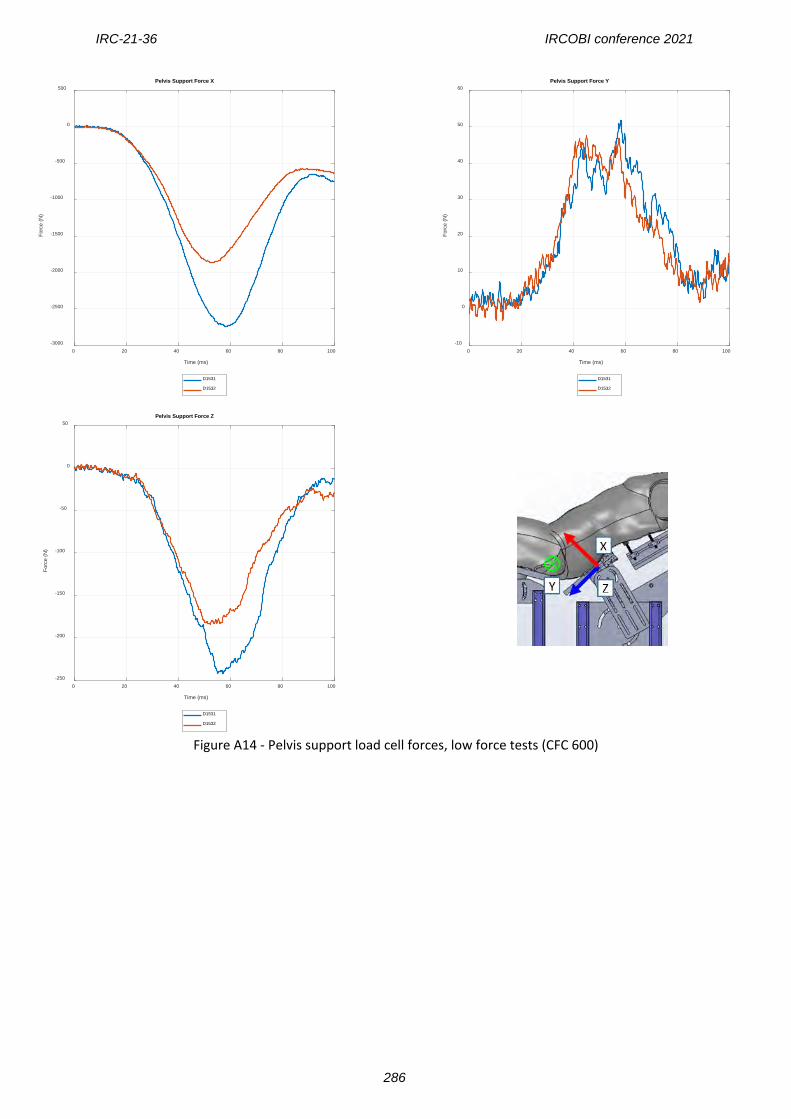
Figure A14 - Pelvis support load cell forces, low force tests (CFC 600)
0 20 40 60 80 100
Time (ms)
-3000
-2500
-2000
-1500
-1000
-500
0
500
Forc
e (N
)
Pelvis Support Force X
D1531
D1532
0 20 40 60 80 100
Time (ms)
-10
0
10
20
30
40
50
60
Forc
e (N
)
Pelvis Support Force Y
D1531
D1532
0 20 40 60 80 100
Time (ms)
-250
-200
-150
-100
-50
0
50
Forc
e (N
)
Pelvis Support Force Z
D1531
D1532
IRC-21-36 IRCOBI conference 2021
286
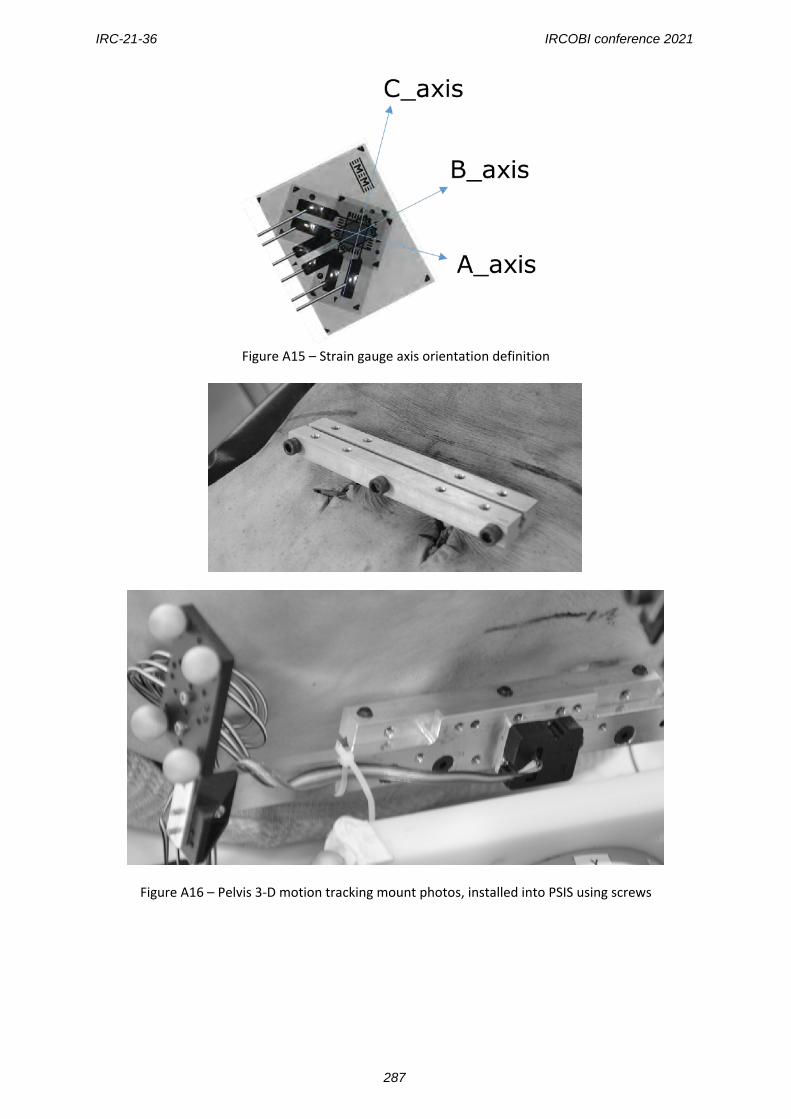
Figure A15 – Strain gauge axis orientation definition
Figure A16 – Pelvis 3-D motion tracking mount photos, installed into PSIS using screws
IRC-21-36 IRCOBI conference 2021
287