Embed Size (px)
Citation preview

A micro simulation model for projecting family and kinship
networks in Britain
Prepared for ESRC Micro-simulation Seminar
Series, Leeds, 2nd July 2009. Michael Murphy
London School of Economics
UK

Modelling Needs and Resources of Older People to
2030 (MAP2030) LSE Social Policy & PSSRU (Mike Murphy,
Raphael Wittenberg & colleagues)
University of Leicester (Carol Jagger & colleagues)
LSHTM (Emily Grundy & colleagues)
PPI (Chris Curry & colleagues)
UEA (Ruth Hancock & colleagues)
(http://www.lse.ac.uk/collections/MAP2030/)
The background to the programme
• A series of (mainly) micro-simulation models looking at mortality (WP1), health status (WP2), family & kinship (WP3), household & family resources (WP4) and how they interact with pensions and long-term care (WP5).
• A Green Paper on Long-term Care policy options is expected very soon
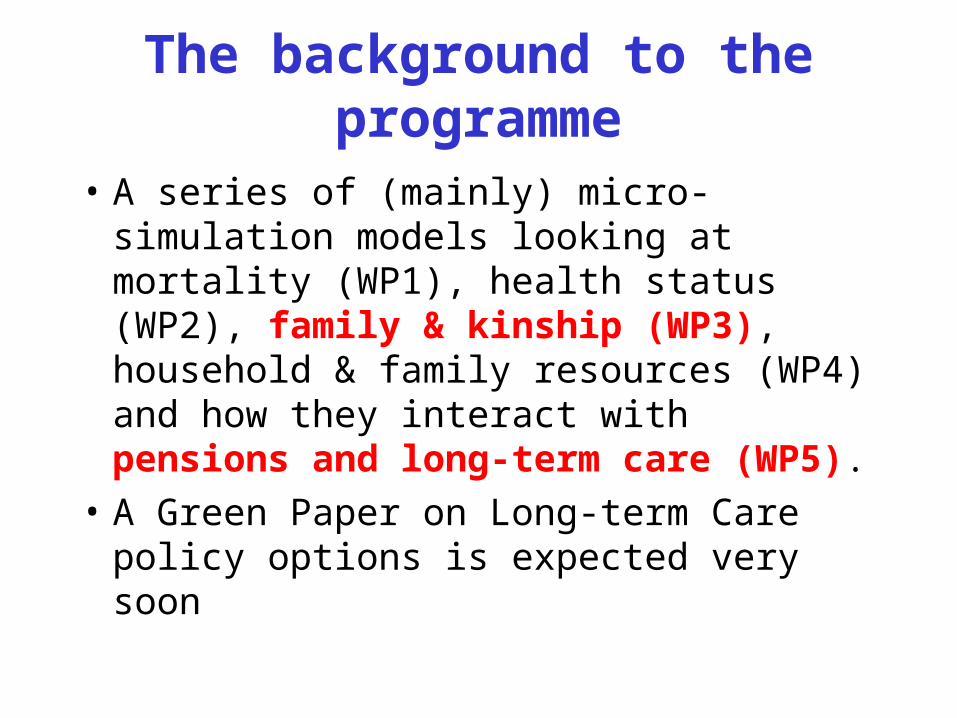
The structure of the programme

The background to the research
• The number of people aged 80 and over, where care needs are greatest, is set to double in the next 25 years.
• A key issue is likely changes in family circumstances on the availability of informal sources of care and the way these influence policy options for long-term care.
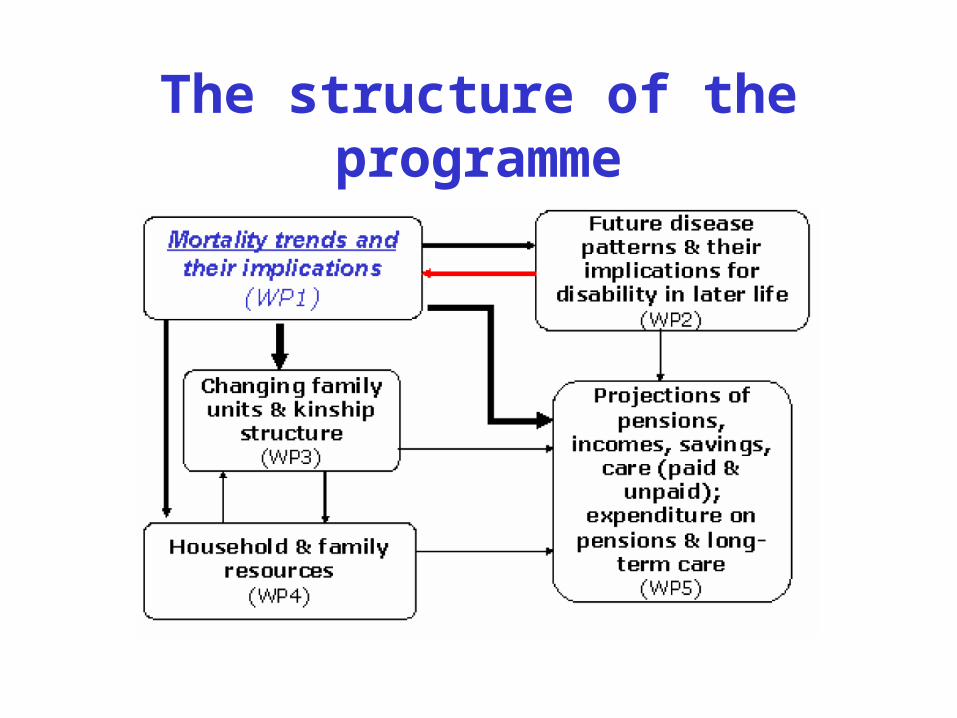
Introduction
Main demographic trends of first demographic transition in now-developed societies:– fertility declined from a level of about five children
per woman in 19th century to 'below-replacement level fertility' today
– mortality has declined with e0 around 1900 of about 40 years but double that today
– populations have aged with proportions aged 65 & over now often approaching 20%.

Introduction (contd.)
Main demographic trends of second demographic transition in now-developed societies:– substantial reductions in nuptiality– increases in:
• non-marital cohabitation
• divorce
• the proportion of births outside marriage.

Impacts on:
• those directly involved
• national population structure
• families and kin

A complete kinship network within a single framework, permitting analysis of the key
family & kin networks of older people:
• in a cross-national European survey, 49% of family carers of cared-for elderly people were children & 22% were spouses/partners (EUROFAMCARE consortium, 2006).
• divorced fathers have less contact with their adult children than fathers who did not divorce; for mothers the effects of divorce is small (de Graaf & Fokkema, 2007)
• grandparental role is important: 75% of relationships were ‘highly’ or ‘very highly’ emotionally close in Germany (Sticker, 1991)

Kinship and family the background
• Kinship distribution at a time point is determined solely by the fertility, mortality, nuptiality, divorce and cohabitation experienced by the population for many decades earlier
• The contemporary pattern of kinship is strongly influenced by recent trends, especially where step-kin are considered
• Little information available in Britain (or elsewhere) on kinship in large nationally-representative data sources.

Micro-simulation model based on individual-level rules
• We start with known or assumed population characteristics, and then simulate individual demographic events.
• This produces a set of individual records, with a statistical pattern of individual demographic events similar to what would be observed in a real population.
Special aspects of demographic kinship modelling
• Not contemporary survey oriented
• Conceptually more complex than e.g. household modelling (or policy microsimulation)
• Requires new methods of analysis.

The question to be addressed:
• What changes in family and kin constellations have occurred over the period since 1950 and what are key features of future family and kinship networks in Britain up to 2050

Method: demographic microsimulation using the Berkeley SOCSIM model
• an initial population of size 40,000 with the population distribution of England in 1751 subject to appropriate rates of fertility, mortality and nuptiality (including divorce) for the period since 1751 (cohabitation from 1950)
• the population in 1751 comprises unrelated individuals, but, over time, a full set of kinship links is constructed as the individuals marry and procreate

SOCSIM demographic microsimulation model
• initial population subject to appropriate rates of fertility, mortality and nuptiality, these individuals age month by month; some will marry (or cohabit) with each other, give birth, divorce or remarry, and finally they die
• Monte Carlo method• model builds up kinship links for an initial
population of unrelated and never-married people
Marriage in SOCSIM• the model is closed so that partners have to
be found within the existing simulation population
• the model includes a prohibition on incest between siblings and parents and children
• in recent decades, cohabitation which has become increasingly important, is also included
• any kinship relationship through blood or marriage may be traced through living and/or dead kin.
Features of system
• Written in C (formerly Fortran & Pascal)• “if it ain’t broke …”• Heavy use of pointers for sufficient
statistics to determine kinship network• Output consists of file of individual-level
records c.f. vital or parish records• Post-processed using R using standard
approaches

Features of system
• Flexible– Heterogeneity in rates
– Correlated behaviour of partners (assortative mating)
– Intergenerational transmission of behaviours
– Permits complex questions to be addressed (e.g. MRCA of mankind)
• Continuous time model– Competing risks framework with event queue
– Population & rates updated month-by-month
Features of system
• Limitations– Undocumented & unsupported
– includes minimal covariates at present (historically oriented)
– requires long-run of historical parameters to initialise contemporary population structure
• Run takes approx 20 min with large population– Running the simulation
– Post-processing data

Any kinship relationship may be analysed

Main assumptions: summary
Decade TFR
Life expectancy at birth (e0)
Average age at first marriage
Births outside marriage (%) Males Females Males Females
1950-60 2.4 68.1 73.6 24.8 23.2 5.5
2000-10 1.8 80.0 85 30.2 27.9 42.0
2010-20 1.9 83.5 86.5 30.3 28.4 39.8
2020-30 1.9 86.2 89.8 30.4 28.8 40.4
2030-40 1.9 85.5 87.7 30.5 28.6 40.6
2040-50 1.9 88.5 89.1 30.4 28.7 40.2
Method: demographic microsimulation using the Berkeley SOCSIM model
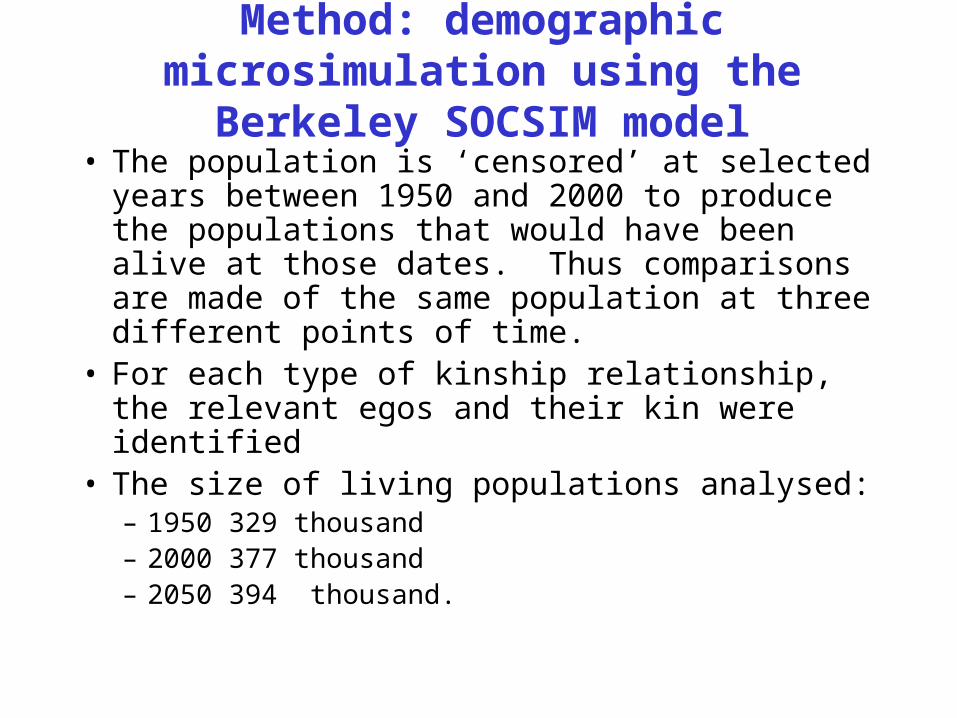
• The population is ‘censored’ at selected years between 1950 and 2000 to produce the populations that would have been alive at those dates. Thus comparisons are made of the same population at three different points of time.
• For each type of kinship relationship, the relevant egos and their kin were identified
• The size of living populations analysed:– 1950 329 thousand– 2000 377 thousand– 2050 394 thousand.
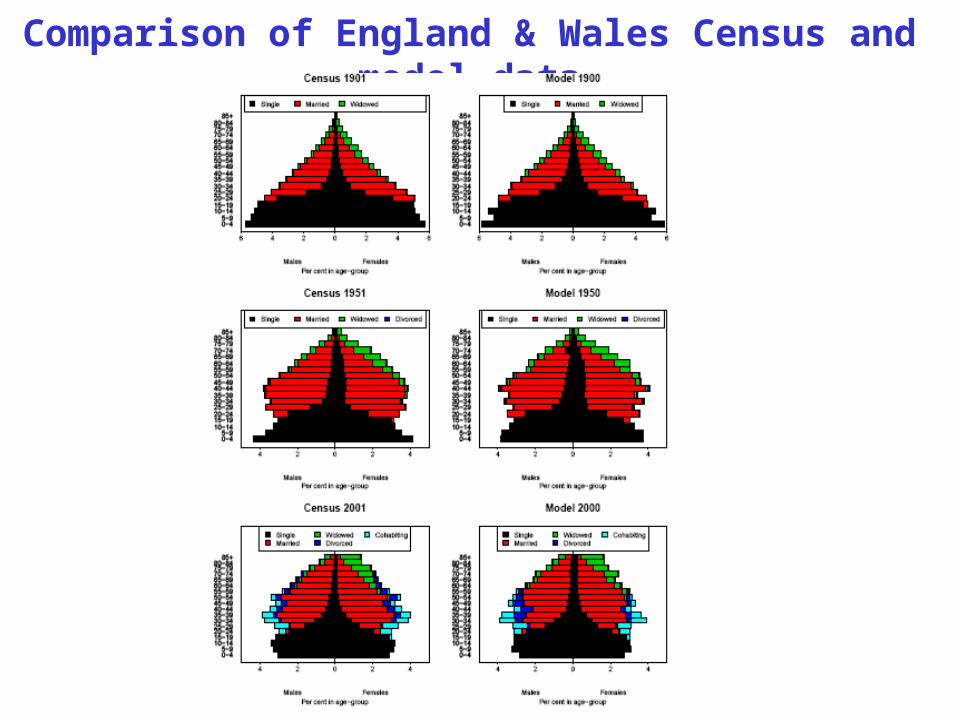
Comparison of England & Wales Census and model data

Average number of living kin: comparison of survey and model data
Grundy E, M Murphy, and N Shelton (1999) Looking beyond the household: inter-generational perspectives on living kin and contacts with kin in Great Britain. Population Trends 97:19-27
Principal trends in family and kin structures: Partners
• In the North Western European marriage pattern, historically marriage was relatively late and high proportions never married
• marriage rates were particularly low in the 1920s and 1930s
• in the period from 1945 to about 1970 many countries experienced an unprecedented marriage boom
• recently, a substantial decline in marriage• cohabitation has increased, but insufficient to
offset the decline in marriage.

Proportion with current and former partners

Principal results of family and kin structures: Partners
• highest proportions currently in a partnership, marital or cohabiting, are found among those in their mid-30s in 1975 (and around 60 in 2000) - those born in the 1940s are likely to be the most advantaged in terms of having a living partner
• for those at e.g. age of 55 in 2050, under the assumption of largely constant partnership behaviour in the Twenty-First Century, the proportions in a partnership would be about 15 percentage points lower, with about one third not being in a partnership at that age.
• at older ages the patterns are different with the highest proportions in a partnership are likely to be found in 2050
• the existence of living former partners following cohabitation breakdown or divorce will increase

Principal trends in family and kin structures: Children & Parents
• fertility rates were particularly low in the 1920s and 1930s
• in the period from 1945 to about 1970 many countries experienced a fertility boom
• recently, a substantial decline in fertility, but increase in extra-marital (mainly cohabiting union) childbearing
• re-partnering has become more common, with effects on ‘incomplete families’

Average number of living children and parents: a long-term view
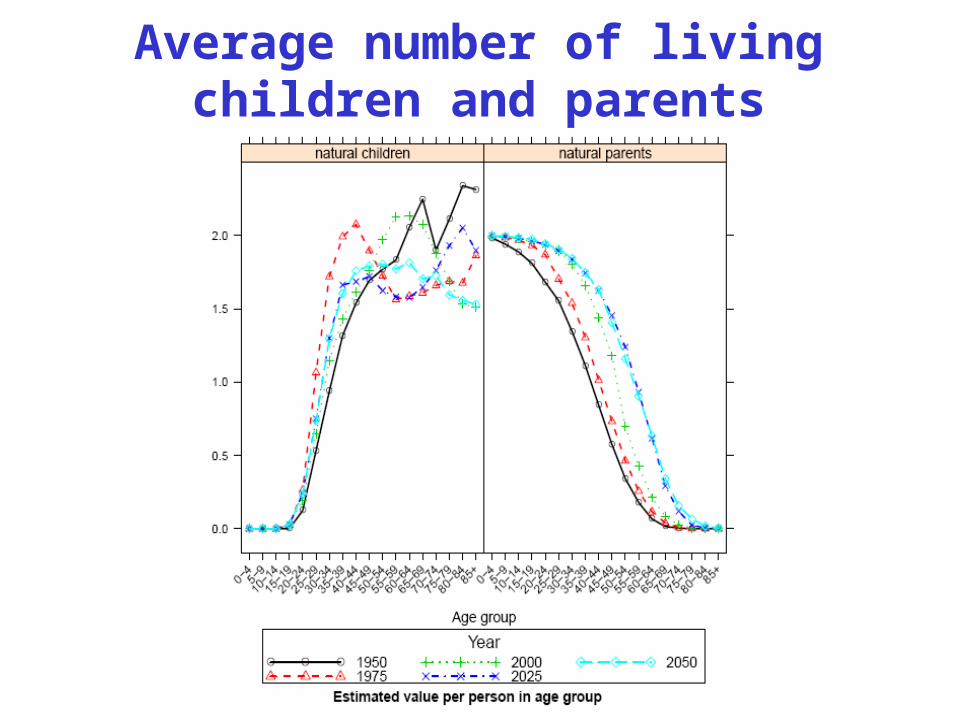
Average number of living children and parents

Principal results of family and kin structures: Parents & children
• trends for living children and parents are different – the peak number of living children, 2.4, for older people in 1950 and for
those aged around 55 in 2000 – the proportion aged 60 with a living child could be one fifth lower in 2050
than the peak value around 2000.• in the next 50 years, those of late working age will be much more
likely to have parents alive than people today (‘care gap’)– age when half had lost both parents: early 40s in 1950 but 60 in 2050.– the median age for having at least one living parent increased as nearly
much in the last 25 years - from 49 to 55 years - as in the previous century - from about 43 to 49 years
• there is an ageing of generational relations: age after which people more likely to have a living child than a living parent– 1950 below age 40– 2000 about age 45– 2050 about age 50

Average number of living grand children and grand parents (complete)
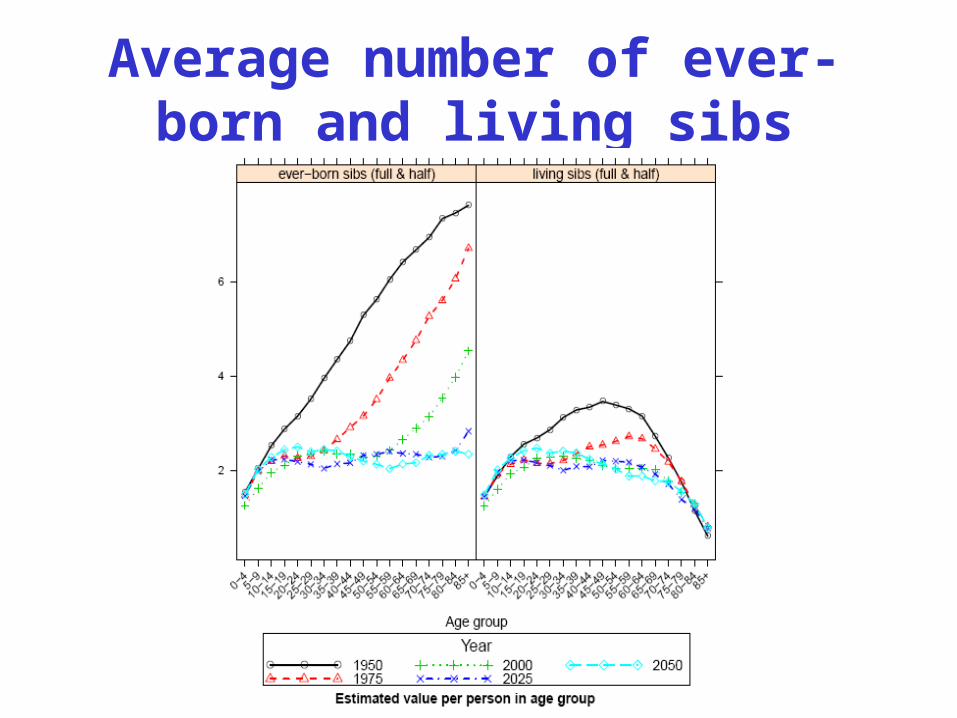
Average number of ever-born and living sibs

Average number of ever-born and living sibs: a long-term view
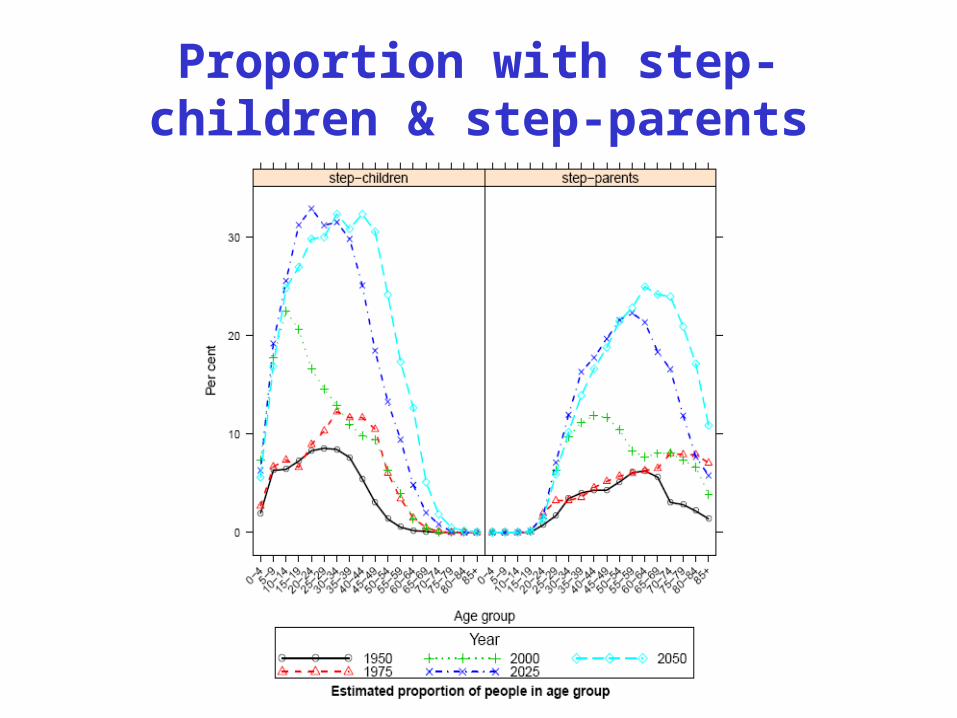
Proportion with step-children & step-parents

Proportion with lone mothers and lone children
Conclusions and implications
• emerging patterns will lead to many more 'incomplete' kin relationships than in the past, such as step families
• kin relations are likely to become more 'vertical' than 'horizontal‘
• the ageing of populations will have an independent and sometimes reinforcing impact on kin relations in that there will be an ageing of generation relationships

Conclusions and implications (contd.)
• Micro-simulation provides a useful integrated approach to elucidating the full range of family and kinship ties

Additional ReferencesGrundy E, M Murphy, and N Shelton (1999) Looking beyond the household: inter-generational
perspectives on living kin and contacts with kin in Great Britain. Population Trends 97:19-27.Grundy, E., and Murphy, M. (2006) Marital status and family support for the oldest-old in Great Britain.
Pp. 415-436 in J-M Robine et al (eds.) Human Longevity: Individual Life Duration and the Growth of the Oldest-Old Population. Dordrecht: Springer.
Hammel EA, C Mason, and KW Wachter (1990) SOCSIM II, a sociodemographic microsimulation program, rev. 1.0, operating manual: Graduate Group in Demography Working Paper No. 29. Berkeley, California, University of California, Institute of International Studies, Program in Population Research.
Hammel, E.A. ‘Demographic dynamics and kinship in anthropological populations’, Proceedings of the National Academy of Sciences 102, (2005), 2248-53.
Kalogirou S. and M Murphy, ‘Marital status of people aged 75 and over in nine EU countries in the period 2000-2030’, European Journal of Ageing 3, 2 (2006), 74-81.
Murphy M (2003) Bringing behaviour back into micro-simulation: Feedback mechanisms in demographic models. Pp 159-174 in Francesco Billari and Alexia Prskawetz (eds.) Agent-Based Computational Demography: Using Simulation to Improve our Understanding of Demographic Behaviour. Heidelberg: Physica-Verlag
Murphy M (2004) Tracing very long-term kinship networks using SOCSIM. Demographic Research 10: 171-195.
Murphy M (2006) The role of assortative mating on population growth in contemporary developed societies. Pp 61-84 in Billari F, Fent T, Fuernkranz-Prskawetz A, Scheffran J (eds.) Agent-based Modelling in Demography, Economics and Environmental Sciences. Physica Verlag, Heidelberg.
Murphy M, and D Wang (1999) Forecasting British families into the 21st century. Pp 100-137 in S McRae (ed) Changing Britain: Families and Households in the 1990s. Oxford: Oxford University Press.
Murphy M, P Martikainen, and S Pennec (2006) Demographic change and the supply of potential family supporters in Britain, Finland and France in the period 1911-2050. European Journal of Population 22(3): 219-40
Van Imhoff E and Post W (1998) Microsimulation methods for population projection. Population: An English Selection, special issue New Methodological Approaches in the Social Sciences , 97-138.

Thank you