Embed Size (px)
Citation preview
Journal of Magnetic Resonance 247 (2014) 22–30
Contents lists available at ScienceDirect
Journal of Magnetic Resonance
journal homepage: www.elsevier .com/locate / jmr
A miniaturized NQR spectrometer for a multi-channel NQR-baseddetection device
http://dx.doi.org/10.1016/j.jmr.2014.08.0021090-7807/� 2014 Elsevier Inc. All rights reserved.
⇑ Corresponding author.E-mail address: [email protected] (Z. Trontelj).URL: http://fizika.imfm.si (Z. Trontelj).
Samo Beguš a, Vojko Jazbinšek b, Janez Pirnat b, Zvonko Trontelj b,⇑a University of Ljubljana, Faculty of Electrical Engineering, Ljubljana, Sloveniab Institute of Mathematics, Physics and Mechanics, University of Ljubljana, Ljubljana, Slovenia
a r t i c l e i n f o a b s t r a c t
Article history:Received 12 June 2014Revised 1 August 2014Available online 14 August 2014
Keywords:Nuclear quadrupole resonancePortable spectrometerSoftware defined radio platformIllicit substances detectionLabView Virtual instrument
A low frequency (0.5–5 MHz) battery operated sensitive pulsed NQR spectrometer with a transmitterpower up to 5 W and a total mass of about 3 kg aimed at detecting 14N NQR signals, predominantly ofillicit materials, was designed and assembled. This spectrometer uses a standard software defined radio(SDR) platform for the data acquisition unit. Signal processing is done with the LabView Virtual instru-ment on a personal computer. We successfully tested the spectrometer by measuring 14N NQR signalsfrom aminotetrazole monohydrate (ATMH), potassium nitrate (PN), paracetamol (PCM) and trinitrotolu-ene (TNT). Such a spectrometer is a feasible component of a portable single or multichannel 14N NQRbased detection device.
� 2014 Elsevier Inc. All rights reserved.
1. Introduction
Nuclear quadrupole resonance (NQR), a younger sister ofnuclear magnetic resonance (NMR), is a non-invasive radiofre-quency (RF) spectroscopic method. The Hamiltonian is based onthe electric interaction between nuclei with nonzero electricquadrupole moment and the internal electric field gradient createdby the surrounding electrons whose distribution is determined bythe crystal structure of the solid material: H ¼ Q � rE, where Q isthe tensor of electric quadrupole moment describing the chargedistribution in the nucleus andrE is the tensor of electric field gra-dient at the nucleus. 14N nuclei have spin I ¼ 1 and nonzero electricquadrupole moment. Since nitrogen is present in a large number oforganic and inorganic compounds, 14N NQR can be very effective instudying their structure, polymorphism and structural dynamics,as well as in detecting the presence of nitrogen-containing illicitmaterials like narcotics, explosives (improvised, the residues ofexplosives after the ceased armed actions or attacks) and counter-feit medicines [1–4]. The detection of the mentioned illicit materi-als in particular caused a renaissance in NQR RF spectroscopy andits applications, together with several improvements in the signal-to-noise (S/N) ratio in the last 10 years or so. That was necessarymainly owing to the fact that in these cases low frequency nitrogenNQR (14N NQR) is almost exclusively detected. For 14N with spin
I ¼ 1, the NQR energy levels and allowed transitions between themare shown in Fig. 1. The corresponding frequencies are equal to[5,6]:
mþ ¼ e2qQ4h
3þ gð Þ; m� ¼ e2qQ4h
3� gð Þ and m0 ¼ e2qQ2h
g ð1Þ
Here, e2qQ=h ¼ Qcc is the quadrupole coupling constant where eQ isthe nuclear electric quadrupole moment, eq ¼ qzz is the maximalcomponent of the electric field gradient tensor, e is the unit charge,h the Planck constant, and g ¼ ðqxx � qyyÞ=q is the asymmetryparameter.
When using a 14N NQR spectrometer in the detection device forillicit materials, we are often faced with the requirement for ageometrically small device which can be adapted for particulardetection purposes, sometimes in a multi-NQR frequency, ie amultichannel configuration. Another need for a small NQR spec-trometer is in the on-line monitoring of possible appearance ofpolymorphism in the chemical industry, mainly in the productionof medicines.
The aim of this work was thus to design and build a lowfrequency (0.5–5 MHz) battery operated highly sensitive pulsedNQR spectrometer with a transmitter power of up to 5 W and atotal mass of about 3 kg or less. Due to low power the pulsesequences will be longer in comparison to an equivalent classicallaboratory NQR spectrometer, in particular, the p=2 pulse is longer,the excitation bandwidth is narrower and we have to consider thatthe sample volume, which is irradiated with the magnetic part ofRF, is smaller.

Fig. 1. Quadrupole energy levels and allowed transitions for the spin 1 nucleus.
S. Beguš et al. / Journal of Magnetic Resonance 247 (2014) 22–30 23
The miniaturization of RF spectrometers is today theoreticallyand practically a feasible project [7–9]. We used a field-program-mable gate array (FPGA) and software in the form of LabViewVirtual instruments. The resulting low frequency and low powerminiaturized NQR spectrometer was tested by measuring 14NNQR signals from samples of aminotetrazole monohydrate (ATMH)– CH3N5 �H2O, potassium nitrate (PN) – KNO3, paracetamol (PCM)– C8H9NO2 and trinitrotoluene (TNT) – C7H5O6N3.
2. Experimental
2.1. The concept of a miniaturized NQR spectrometer
Fig. 2 shows the block scheme of the miniaturized NQRspectrometer. Since we expected a maximal power of 5 W to besufficient, all electronic elements were small and we mountedthem in the form of a close packed hybrid structure. The frontend of the miniaturized NQR spectrometer was a standard onewith a tank circuit and matching circuit as it will be described indetails in Section 2.2. The preamplifier, signal amplifier and poweramplifier were chosen to obtain a miniaturized yet still functionalNQR spectrometer. The software defined radio platform N200,from Ettus ResearchTM [10] was used for data acquisition andsignal generation. The platform includes a dual, 14 bit, 100 megasamples per second (MSPS) analogue-to-digital converter (ADC)and dual, 16 bit, 400 MSPS digital-to-analogue converter (DAC),FPGA, as well as a 1 Gbit Ethernet interface.
2.2. Tank circuit, matching circuit and planar coils
Tank circuit was realized in two forms (i) with a standard sole-noidal coil: length l = 8 cm, diameter d = 12 mm and (ii) with a pla-nar (2D) coil: inner radius r1 = 1 cm and outer radius r2 = 6 cm anda variable high voltage capacitor for frequency tuning. Two planarcoils can be combined in a gradiometer configuration. In the case ofplanar coil configuration the coil is placed close to the measured
Fig. 2. Block scheme of miniaturized NQR spectrometer for 14N NQR detection.
object, for instance near a box of suspicious - counterfeit medicine.The planar coil design was based on an Archimedean spiraldescribed in polar coordinates as
rðuÞ ¼ a2p
uþ r1; ~r ¼ rðuÞcos usinu
� �; ð2Þ
where parameter a represents a constant radius increment in oneturn when the polar angle u is increased by 2p. Higher constancyof the magnetic field magnitude near the coil plane was searchedfor with a modified Archimedean spiral
rðuÞ ¼ a2p
u� �p
þ r1; ð3Þ
where the exponent p provides either an increase of space betweenturns (p > 1) or its decrease (p < 1) when increasing the polar angleu. Magnetic field at the site ~r0 for a constant current I along thespiral was calculated with a numerical integration of Biot–Savartlaw
H!ð~r0Þ ¼ I
4pXu0þ2pn
u¼u0
~t � ð~r0 �~rÞj~r0 �~rj3
Du; ð4Þ
where~r is defined in (2) or (3),~t ¼ @~r@u is a tangent on the spiral curve
(direction of the current element I~tDu) and n is a number of coilturns. Fig. 3(a) and (b) displays geometry of the Archimedean coilwith a n = 16 turns and the modified coil with a p ¼ 0:1. Fig. 4(a)and (b) shows corresponding calculated magnetic field above thecoil, respectively.
The induced NQR signal amplitudes are very small and there-fore high amplification of the detected signal is needed. That wasachieved by using two amplifiers: a preamplifier and a signalamplifier. Several preamplifiers were tested (Miteq AU-1579 lownoise 50 X preamplifier, Hi-Z low noise preamplifier HVA-200M-40-F and a BF998 Hi-Z custom-built preamplifier).
Two impedance matching and duplexer circuit were used. Aconfiguration with a high-impedance preamplifier (Fig. 5(a)) andone with a low-input impedance preamplifier (Fig. 5(b)).
Only minor differences in performance were observed.
2.3. Signal amplifiers
As a signal amplifier we constructed a two stage circuit. The 1ststage was the Norton Noiseless Feedback Amplifier [11] withappropriate input protection against high voltage pulses, whilethe 2nd stage was a wide bandwidth current feedback operationalamplifier (Figs. 6 and 8(a)). The output stage of the signal amplifierwas designed to limit its output voltage to safe values for the dataacquisition board.
2.4. Power amplifier
A home built wide bandwidth power amplifier was based onthe operational amplifier LT1210.
The LT1210 needs only an output impedance matching circuitand a simple interface for switching between normal operationand the disabled state. It has in-built thermal protection andshort-circuit protection, which add to the ruggedness of the ampli-fier, especially when operating with non-optimally matched loads.The circuit is shown in Fig. 7. Considering that we use at most onlyabout 3% of measuring time as an active RF radiation time we cansafely apply the linear power amplifier architecture. The efficiencyof the power amplifier ðPout=PinÞ used is up to 26%, depending onoperating conditions.
The power amplifier was built inside the N200 case owing to itssmall size and is marked by a rectangle in Fig. 8(b).

(a) (b)
Fig. 3. Geometry of coils (a) the Archimedean coil with a n ¼ 16 turns and (b) the modified coil with a p ¼ 0:1. Coordinates are in units of the coil half widthw ¼ ðr2 � r1Þ=2 ¼ 2:5 cm, where r1 ¼ 1 cm is the inner radius and r2 ¼ 6 cm is the outer radius. The coil started with the polar angle u0 ¼ �p, while r1; r2 (marked with �)and 2w (dashed line) are defined with the polar angle u ¼ 0.
(a) (b)
Fig. 4. Magnetic field magnitude above (a) the Archimedean coil and (b) the modified coil with p ¼ 0:1 from Fig. 3. Magnetic field is calculated at different distances zmeasured in units of the coil half width w ¼ 2:5 cm. Dashed vertical lines denote the inner (r1) and the outer (r0), and the dashed-dot line the mean coil radius.
Fig. 5. Matching, preamplifier and duplexer circuit. L1 is the sample-coil. The C2–L2 resonant circuit is used for voltage step-up transformation to efficiently couple RF energyto the sample coil L1 via coupling diodes D5 and D6. The C8–L3–C9 circuit is a lumped-element equivalent of the quarter wavelength cable used for duplexer, capacitor C7 isused for impedance matching.
Fig. 6. Signal amplifier with Norton Noiseless stage and wide bandwidth current feedback operational amplifier.
24 S. Beguš et al. / Journal of Magnetic Resonance 247 (2014) 22–30
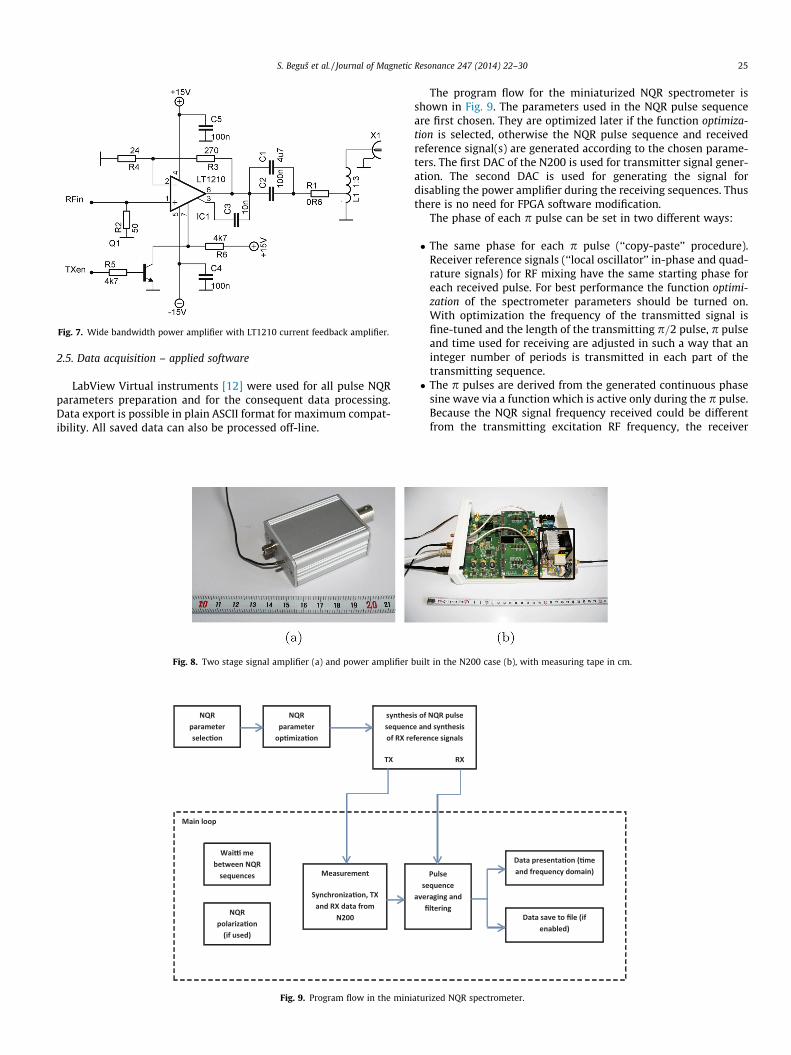
Fig. 7. Wide bandwidth power amplifier with LT1210 current feedback amplifier.
S. Beguš et al. / Journal of Magnetic Resonance 247 (2014) 22–30 25
2.5. Data acquisition – applied software
LabView Virtual instruments [12] were used for all pulse NQRparameters preparation and for the consequent data processing.Data export is possible in plain ASCII format for maximum compat-ibility. All saved data can also be processed off-line.
Fig. 8. Two stage signal amplifier (a) and power amplifier
NQRparameterselec�on
NQRparameterop�miza�on
synthessequencof RX re
TX
Main loop
Wai�mebetween NQRsequences
NQRpolariza�on(if used)
Measurement
Synchroniza�on, TXand RX data from
N200
Fig. 9. Program flow in the mini
The program flow for the miniaturized NQR spectrometer isshown in Fig. 9. The parameters used in the NQR pulse sequenceare first chosen. They are optimized later if the function optimiza-tion is selected, otherwise the NQR pulse sequence and receivedreference signal(s) are generated according to the chosen parame-ters. The first DAC of the N200 is used for transmitter signal gener-ation. The second DAC is used for generating the signal fordisabling the power amplifier during the receiving sequences. Thusthere is no need for FPGA software modification.
The phase of each p pulse can be set in two different ways:
� The same phase for each p pulse (‘‘copy-paste’’ procedure).Receiver reference signals (‘‘local oscillator’’ in-phase and quad-rature signals) for RF mixing have the same starting phase foreach received pulse. For best performance the function optimi-zation of the spectrometer parameters should be turned on.With optimization the frequency of the transmitted signal isfine-tuned and the length of the transmitting p=2 pulse, p pulseand time used for receiving are adjusted in such a way that aninteger number of periods is transmitted in each part of thetransmitting sequence.� The p pulses are derived from the generated continuous phase
sine wave via a function which is active only during the p pulse.Because the NQR signal frequency received could be differentfrom the transmitting excitation RF frequency, the receiver
built in the N200 case (b), with measuring tape in cm.
is of NQR pulsee and synthesisference signals
RX
Pulsesequence
averaging andfiltering
Data presenta�on (�meand frequency domain)
Data save to file (ifenabled)
aturized NQR spectrometer.

26 S. Beguš et al. / Journal of Magnetic Resonance 247 (2014) 22–30
reference signals (‘‘local oscillator’’ in-phase and quadraturesignals) for the RF mixing are calculated to have zero phase justat the center between two p pulses (NQR echo center).
We applied predominately the first (‘‘copy-paste’’) procedure. Inthe main loop (Fig. 9) the previously prepared pulse sequence istransmitted and the NQR signal received. When using polarizationenhancement [3], the appropriate auxiliary control signals are gen-erated. The signals received are averaged to improve the S/N ratio.The averaged received signal is filtered by a low-pass and a high-pass filter with adjustable filter order and corner frequencies toenhance the displayed signal in the time domain. Irrespective ofthe setting of the displayed signal, all the data are saved in anunfiltered state. Due to high sampling frequency (up to 20 MHz)the saved signals are filtered (low-pass filter with a corner fre-quency of 250 kHz) and resampled at 1 MHz sampling frequencyso that the usable signal bandwidth is limited to ±250 kHz of thereceived frequency, combining in-phase and quadrature signals.
The number of pulses in the sequence used for averaging can bechosen arbitrarily.
The phase cycling can be turned on to suppress the ringingeffect. Here, the p pulse phase of every second sequence iterationis inverted, thus producing ringing with the opposite phase whichcan be suppressed by averaging.
In both, data acquisition and data analysis, we gain from theuser friendly program steps which are part of the LabView applica-tion. All modifications which are necessary, when different sam-ples are measured, can be introduced transparently and quickly.
2.6. Measurement of the performance of the miniaturized NQRspectrometer
We checked the performance of the miniaturized NQR spec-trometer by measuring the 14N NQR signals of the characteristic
Fig. 10. Aminotetrazole monohydrate (ATMH).
0 20 40 60 80−3
−2
−1
0
1
2
3 x 10⁻⁵
Time [ms]
Am
plitu
de [a
.u.]
(a)
Fig. 11. Aminotetrazole monohydrate sample 14N NQR signal after 1000 averaged pulse sshown. The signal bandwidth is 5 kHz, 2nd order Butterworth band-pass filter. The peakequal to 1200 kHz.
compounds ATMH [13], PN [14], PCM [28] and TNT [3], studiedpreviously by a classical pulse NQR spectrometer. In all cases thevolumes of typical samples (with specific density approx. 1 g/ccm) were less than 10 ccm. That means we used for these smallsample volumes (ATMH, PN, TNT and PCM) a cylindrical solenoidcoil: length 8 cm, diameter 1.2 cm. In addition, we also made a testwith the planar coil: inner diameter 2 cm, outer diameter 12 cm,equidistant spacing between turns. Generally, the planar coilrequires larger amount of tested material (Fig. 14).
2.6.1. 14N NQR in aminotetrazole monohydrateThe tetrazole ring CH2N4 (TZ) appears in a number of new phar-
maceutical products as a functional group [15–18]. TZ can also actas a starting point for new explosives [19–21], for anti-corrosivecoatings [22], for information recording systems [23], and in manysynthetic pathways as the precursor of various nitrogen-containingheterocycles. Investigation of tetrazole compounds is relevant tostudies of the application of 14N NQR for the detection ofexplosives, as well as the study of polymorphism in some pharma-ceuticals [24].
Determination of 14N frequency and optimized 14N NQR param-eters for the m0 line of nitrogen atom number 5 in ATMH (Fig. 10) inthe temporal and frequency domain with the miniaturized NQRspectrometer are shown in Fig. 11(a) and (b). As expected thep=2 pulse is longer (125 ls) in comparison to our earlier measure-ments (30 ls) on a classical pulse NQR spectrometer [13]. How-ever, we were still able to position 20 p pulses in the modifiedCarr–Purcell (CP) sequence and obtained a very good S/N ratio forthis low frequency line. In the experiment [13] 30 p pulses wereincluded in the modified Carr–Purcell (CP) sequence.
In Fig. 12 the LabView Virtual instrument is shown used forreading and post-processing the saved data. The central frequencycan be changed and corner frequencies, filter order and time frameof the displayed data can be set. The number of averaged echoes inone sequence can be set arbitrarily.
2.6.2. 14N NQR in potassium nitrateKNO3 belongs to the class of nitrates which are often applied for
improvised explosive devices. The molecule of PN contains onenitrogen atom and one potassium atom. Therefore both, 14N NQRand 39K NQR can be used to detect the presence of PN. At roomtemperature we observed one 39K NQR line at 666.4 kHz and oneset of 14N NQR lines (567 kHz and 559 kHz for the mþ and m� tran-sition frequencies) which indicates the equivalence of all nitrogenpositions in the crystal lattice. Potassium nitrate has an ortho-rhombic crystal structure at room temperature, which transforms
0 10 20 30 40
0.2
0.4
0.6
0.8
1
Frequency offset [kHz]
Rel
ativ
e In
tens
ity [a
.u.]
(b)
equences with 20 pulses (panel a) in each sequence. A whole sequence of 20 pulses isin the frequency domain plot is at 1213.6 kHz (panel b). The frequency zero value is
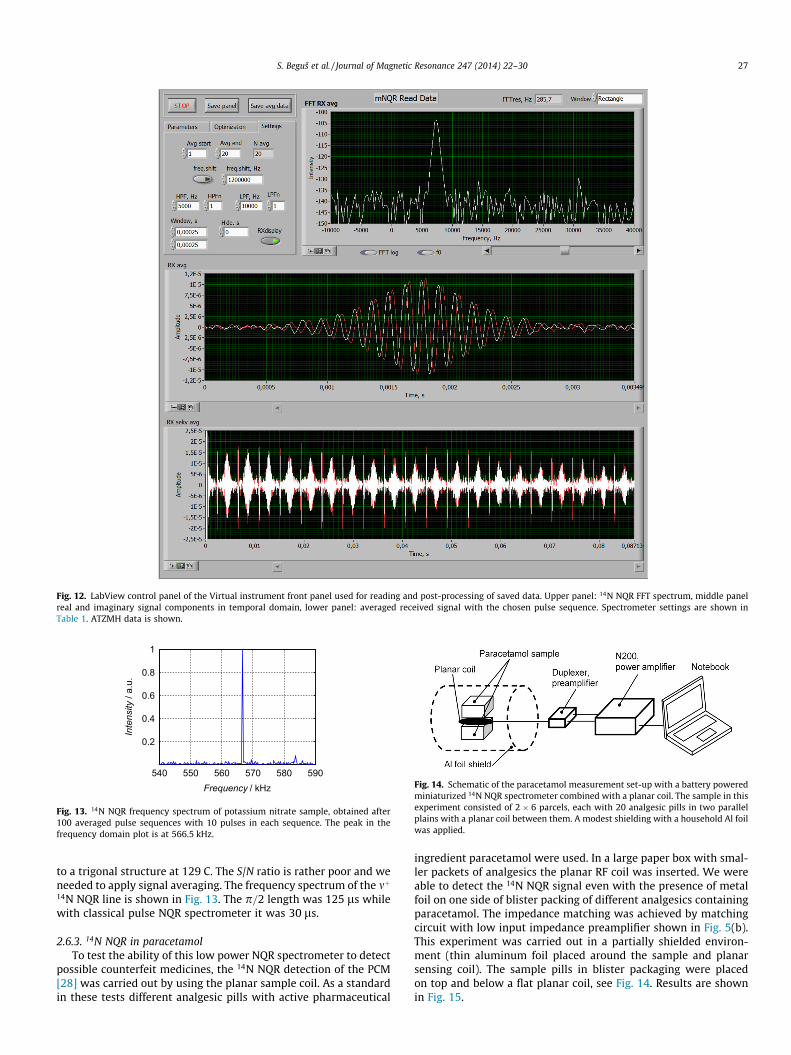
Fig. 12. LabView control panel of the Virtual instrument front panel used for reading and post-processing of saved data. Upper panel: 14N NQR FFT spectrum, middle panelreal and imaginary signal components in temporal domain, lower panel: averaged received signal with the chosen pulse sequence. Spectrometer settings are shown inTable 1. ATZMH data is shown.
540 550 560 570 580 590
0.2
0.4
0.6
0.8
1
Frequency / kHz
Inte
nsity
/ a.
u.
Fig. 13. 14N NQR frequency spectrum of potassium nitrate sample, obtained after100 averaged pulse sequences with 10 pulses in each sequence. The peak in thefrequency domain plot is at 566.5 kHz.
Fig. 14. Schematic of the paracetamol measurement set-up with a battery poweredminiaturized 14N NQR spectrometer combined with a planar coil. The sample in thisexperiment consisted of 2 � 6 parcels, each with 20 analgesic pills in two parallelplains with a planar coil between them. A modest shielding with a household Al foilwas applied.
S. Beguš et al. / Journal of Magnetic Resonance 247 (2014) 22–30 27
to a trigonal structure at 129 C. The S/N ratio is rather poor and weneeded to apply signal averaging. The frequency spectrum of the mþ14N NQR line is shown in Fig. 13. The p=2 length was 125 ls whilewith classical pulse NQR spectrometer it was 30 ls.
2.6.3. 14N NQR in paracetamolTo test the ability of this low power NQR spectrometer to detect
possible counterfeit medicines, the 14N NQR detection of the PCM[28] was carried out by using the planar sample coil. As a standardin these tests different analgesic pills with active pharmaceutical
ingredient paracetamol were used. In a large paper box with smal-ler packets of analgesics the planar RF coil was inserted. We wereable to detect the 14N NQR signal even with the presence of metalfoil on one side of blister packing of different analgesics containingparacetamol. The impedance matching was achieved by matchingcircuit with low input impedance preamplifier shown in Fig. 5(b).This experiment was carried out in a partially shielded environ-ment (thin aluminum foil placed around the sample and planarsensing coil). The sample pills in blister packaging were placedon top and below a flat planar coil, see Fig. 14. Results are shownin Fig. 15.

2550 2560 2570 2580 2590
0.2
0.4
0.6
0.8
1
Frequency / kHz
Inte
nsity
/ a.
u.
Fig. 15. 14N NQR frequency spectrum of paracetamol, obtained after 20 averagedpulse sequences with 100 pulses in each sequence.
28 S. Beguš et al. / Journal of Magnetic Resonance 247 (2014) 22–30
2.6.4. 14N NQR in trinitrotoluene14N NQR detection of the well known and broadly applied
explosive TNT still presents a challenge. The reason is in the weakquadrupole coupling of nitrogen in the NO2 groups and conse-quently the low 14N NQR transition frequencies with a very lowS/N ratio of the 14N NQR signals. With two crystallographicallyinequivalent molecules in the unit cell we expect 6 mþ and 6 m�lines (3 in-equivalent nitrogen nuclei in a molecule).
In addition, TNT appears in two different crystallographic mod-ifications, orthorhombic and monoclinic [4]. Hence we have twodifferent NQR spectra, each consisting of 6 lines for the mþ and 6
−20 −10 0 10 200
0.2
0.4
0.6
0.8
1A
Frequency [kHz]
Rel
ativ
e In
tens
ity [a
.u.] Monoc.
(a)
Fig. 16. 14N NQR spectra of monoclinic phase (a) and orthorhombic phase (b) of TNT855 kHz.
Fig. 17. 14N NQR spectra of monoclinic phase (a) and orthorhombic phase (b) of TNT ofrequency zero is equal to 855 kHz.
for the m� 14N NQR transition frequencies. The existence of two dif-ferent crystallographic modifications makes the detection of TNTdifficult as it is not known in advance which modification is preva-lent. This problem can be successfully solved because the differentpolymorphic forms of TNT have different 14N NQR resonance lines,as expected [4]. Namely, the 14N nuclei in the different polymorphsexhibit different electric field gradients at their positions in thecrystal structure. This fact enabled us to determine the crystalmodification of the measured TNT sample. Fig. 16(a) and (b) pres-ent the 14N NQR mþ frequency spectra of monoclinic and ortho-rhombic TNT samples. The lower frequency resolution of theminiaturized 14N NQR spectrometer is clearly evident in the closelylying 14N NQR lines at 844.3 kHz and 842.8 kHz for monoclinicTNT, denoted by A in Fig. 16(a), which cannot be resolved with thisspectrometer. The same is true for the closely lying 14N NQR linesat 846.8 kHz and 848.3 kHz for orthorhombic TNT, denoted by B(Fig. 16(b)). We only can see that the unresolved NQR lines inmonoclinic and orthorhombic TNT are broader and the line B inthe Fig. 16(b) has an additional shoulder. For comparison seeFig. 17 obtained with a classical NQR spectrometer, where the cor-responding NQR lines A1 and B1 are resolved. The frequency reso-lution Df is determined by the acquisition time – T or equivalentlyby the number of samples N and sampling frequency –f s ðDf ¼ f s=N ¼ 1=T). These parameters were chosen according tothe detected material properties and the requirement to get thebest S/N ratio. In our case we have for the ATMHT = 4.00 ms � 0.25 ms = 3.750 ms; 1/T = 0.27 kHz and for the TNT
−20 −10 0 10 200
0.2
0.4
0.6
0.8
1B
Frequency [kHz]
Rel
ativ
e In
tens
ity [a
.u.] Ortor.
(b)
obtained with the miniaturized NQR spectrometer. The frequency zero is equal to
btained with a classical 500 W pulsed NQR spectrometer, working with 60 W. The
Table 1Settings used with miniaturized NQR spectrometer and a classical high-power (HiPwr) pulsed NQR spectrometer (for TNT only).
k n t0 [s] tm [min] f rx [kHz] f tx [kHz] Ptx [W] tp=2 [ms] trx [ms] f r [kHz]
ATZMH 1000 20 3 50 1206 1213.5 1 0.125 4.00 0.27KNO3 100 10 15 25 564 567.0 1 0.175 4.00 0.27PCM 20 100 15 5 2560 2564.0 2 0.400 2.00 0.57�TNT 16 10 30 8.4 840 837.0 3 0.125 1.25 1.00
16 10 30 8.4 840 843.0 3 0.125 1.25 1.0016 10 30 8.4 840 847.5 3 0.125 1.25 1.0016 10 30 8.4 840 860.0 3 0.125 1.25 1.0016 10 30 8.4 840 869.5 3 0.125 1.25 1.00
�TNTHiPwr 10 15 30 5 845 845.0 60 0.03 2.048 0.610 15 30 5 845 865.0 60 0.03 2.048 0.6
k – number of sequence iterations; n – number of p pulses; t0 – time between iterations; tm – measurement time; f rx – receiver local oscillator frequency; � – polarizationenhancement used; f tx – transmitter frequency; Ptx – transmitter output power; tp=2 – p=2 pulse duration; trx – receiving time; f r – FFT spectrum frequency resolution.
Table 2Optimized settings used with miniaturized NQR spectrometer.
f rx [kHz] tp=2 [ms] tp=2o [ms] f tx [kHz] f txo [kHz] trx [ms] trxo [ms]
ATZMH 1206 0.125 0.12525 1213.5 1213.5888 4.00 3.99970KNO3 564 0.175 0.17637 567.0 567.0000 4.00 4.00000PCM 2560 0.400 0.40010 2564.0 2564.1208 2.00 1.99990TNT 840 0.125 0.12665 837.0 836.8035 1.25 1.25000
840 0.125 0.12575 843.0 842.8992 1.25 1.25045840 0.125 0.12510 847.5 847.4296 1.25 1.25085840 0.125 0.12550 860.0 860.5852 1.25 1.25030840 0.125 0.12650 869.5 869.5652 1.25 1.25120
f rx – receiver local oscillator frequency; tp=2 – p=2 pulse duration; tp=2o – optimized p=2 pulse duration; f tx – transmitter frequency; f txo – optimized transmitter frequency;trx – receiving time; trxo – optimized receiving time.
S. Beguš et al. / Journal of Magnetic Resonance 247 (2014) 22–30 29
sample T = 1.25 ms � 0.25 ms = 1.00 ms; 1/T = 1 kHz. We have con-sidered the removal of transients after the p pulse by subtractingapproximately 0.25 ms.
Table 1 shows the settings used with the miniaturized NQRspectrometer and the classical 500 W – however, working herewith 60 W – pulsed NQR spectrometer (for TNT only). Polarizationenhancement for TNT samples mentioned in Section 2.5 and inTable 1 was performed with the permanent FeNdB magnet [29].The polarization time for protons was about 15 s, magnetic fieldat the center of the sample was about 300 mT, the demagnetizationtime was between 300 ms and 500 ms and the measured signalintensity enhancement factor for the mþ line at 870 kHz in mono-clinic TNT was about 10. Detail of polarization enhancementdevice, which we applied, is in [3,29]. Table 2 shows the optimizedsettings used with the miniaturized NQR spectrometer. The trans-mitter frequencies used were the same for both crystallographicmodifications.
3. Discussion and conclusions
NQR spectroscopy was demonstrated already in the middle ofprevious century to be able to detect the nitrogen (14N) nuclearquadrupole resonance, [5]. Practically all 14N NQR lines are below5 MHz and therefore it was difficult (in the past) to achieve in rea-sonably short measuring time a high enough S/N ratio for any prac-tical application, like the detection of nitrogen-containing illicitmaterials. In the last ten or fifteen years, some new approachesappeared [2,3,25–27] and the S/N ratio was improved to the extentthat presently we can contactless detect the most important illicitmaterials reasonably rapidly in a laboratory environment.
Today’s requirements are directed towards a low power 14NNQR spectrometer that may lead to a portable multi-channelNQR device which would be able to rapidly detect several illicitmaterials. We showed in this work that such a type of 14N NQR
spectrometer functions well in all cases where the 14N NQR lineparameters (line width, T2; T1) also allow a longer duration of ppulses. This miniaturized 14N NQR spectrometer was constructedwith commercially available microelectronic components. It is asingle channel pulsed 14N NQR spectrometer of around 2 kg mass(without the battery) and operates with a maximal RF power of5 W. A note-book PC is needed for communication with the spec-trometer and for data acquisition and analysis.
We tested the usual notebook Li-ion rechargeable battery of0.33 kg and 55 W h capacity. With this battery the miniaturizedNQR spectrometer can operate for about 4 h. As a test of a batteryoperated miniaturized NQR spectrometer, equipped with the pla-nar coil, a measurement of genuine paracetamol sample, Fig. 15,was taken in the main parcel sorting building at the airport. Allother samples, discussed in this article were taken in the labora-tory and the measuring system was mains powered. Li-ionrechargeable battery we used has approximately equal operationtime as a notebook in the battery powered mode. A modest shield-ing in form of a thin aluminum foil metal cylinder or a metal meshwith about 1 mm opening helps when electromagnetic distur-bances are present. Gradiometric configuration of the pick-up coilwas also tested and improvement in signal to noise ratio wasobtained.
In conclusion, we were able to detect all the usually met explo-sives (including trinitrotoluene – TNT – with polarization enhance-ment) and improvised explosives in reasonable measuring times. Amulti-channel detection device, based on the detection of 14N NQRseems to be a feasible project.
Acknowledgments
This research was partly funded by the Slovenian Research Pro-grams P2-0348, P2-0250 and by the EC FP-7 Project under GrantNo. 261670.

30 S. Beguš et al. / Journal of Magnetic Resonance 247 (2014) 22–30
References
[1] J. Seliger, V. Zagar, R. Blinc, A new highly sensitive 1H–14N nuclear-quadrupoledouble-resonance technique, J. Magn. Reson. Ser. A 106 (1994) 214–222.
[2] V.S. Grechishkin, N.J. Sinjavsky, New technologies: nuclear quadrupoleresonance as an explosive and narcotic detection technique, Phys. – Uspekhi40 (1997) 393–404.
[3] J. Luznik, J. Pirnat, V. Jazbinšek, T. Apih, A. Gregorovic, R. Blinc, J. Seliger, Z.Trontelj, Polarization enhanced ‘‘single shot’’ 14N nuclear quadrupoleresonance detection of trinitrotoluene at room temperature, Appl. Phys. Lett.89 (2006) 123509.
[4] R.A. Marino, R.F. Connors, Orthorhombic and monoclinic TNT: a nitrogen14NQR study, J. Mol. Struct. 111 (1983) 323–328.
[5] T.P. Das, E.L. Hahn, Nuclear Quadrupole Resonance Spectroscopy, AcademicPress, New York, 1958.
[6] A. Abragam, The Principles of Nuclear Magnetism, Clarendon, Oxford, 1961.[7] http://www.spincore.com/products/iSpinNMR/iSpin-NMR.shtml.[8] N. Sun, T.J. Yoon, H. Lee, W. Andress, R. Weissleder, D. Ham, Palm NMR and 1-
Chip NMR, IEEE J. Solid-State Circ. 46 (2011) 342–352.[9] G. Eidmann, R. Savelsberg, P. Blumler, B. Blümich, The NMR MOUSE, a mobile
universal surface explorer, J. Magn. Reson. A 122 (1) (1996) 104–109.[10] http://www.ettus.com/product/details/UN200-KIT.[11] D.E. Norton, F.P. Allen, Transistor Amplifier with Impedance Matching
Transformer, Patent 3891934, 1975.[12] http://www.ni.com/labview/.[13] J. Pirnat, J. Luznik, V. Jazbinšek, V. Zagar, J. Seliger, Thomas M. Klapötke, Z.
Trontelj, 14N NQR in the tetrazole family, Chem. Phys. 364 (2009) 98–104.[14] A.N. Garroway, M.L. Buess, J.P. Yesinowski, J.B. Miller, Narcotics and explosives
detection by 14N pure NQR, Proc. SPIE 2092 (1993) 318–327.[15] L.V. Myznikov, A. Hrabalek, G.I. Koldobskii, Drugs in the tetrazole series, Chem.
Heterocycl. Compd. 43 (2007) 1–9.[16] S. Harkishan, A.S. Chawla, V.K. Kapoor, D. Paul, R.K. Malhotra, Medicinal
chemistry of tetrazoles, Prog. Med. Chem. 17 (1980) 151.
[17] R.J. Herr, 5-Substituted-1H-tetrazoles as carboxylic acid isosteres: medicinalchemistry and synthetic methods, Bioorg. Med. Chem. 10 (2002) 3379–3393.
[18] E.B. Baker, A.I. Popov, Nitrogen-14 nuclear magnetic resonance study of 1,5-disubstituted tetrazoles, J. Phys. Chem. 76 (1972) 2403–2404.
[19] T.M. Klapötke, High energy density materials, Struct. Bond. 125 (2007) 85–121.
[20] T.M. Klapötke, N.K. Minara, J. Stierstorfer, Investigations ofbis(methyltetrazolyl)triazenes as nitrogen-rich ingredients in solid rocketpropellants – synthesis, characterization and properties, Polyhedron 28 (2009)13–26.
[21] T.M. Klapötke, M. Sabate, Bistetrazoles: nitrogen-rich, high-performing,insensitive energetic compounds, Chem. Mater. 20 (2008) 3629–3637.
[22] K.F. Khaled, M.M. Al-Quahtani, The inhibitive effect of some tetrazolederivatives towards Al corrosion in acid solution: chemical, electrochemicaland theoretical studies, Mater. Chem. Phys. 113 (2009) 150–158.
[23] G.I. Koldabskii, V.A. Ostrovskii, Usp. Khim. 63 (1994) 847–865.[24] Z. Lavric, J. Pirnat, J. Luznik, J. Seliger, V. Zagar, Z. Trontelj, S. Srcic, Application
of 14N NQR to the study of piroxicam polymorphism, J. Pharm. Sci. 99 (2010)4857–4865.
[25] J. Seliger, R. Blinc, H. Arend, R. Kind, Proton-14N double resonance study of thestructural phase transitions in the perovskite type layer compound(CH3NH3)2CdCl4, Z. Phys. B 25 (1976) 189–195.
[26] D. Stephenson, J.A.S. Smith, Nitrogen-14 quadrupole cross-relaxationspectroscopy, Proc. Roy. Soc. A 416 (1988) 149–178.
[27] J. Seliger, V. Zagar, Measurement of the 14N nuclear quadrupole resonancefrequencies by the solid effect, J. Magn. Reson. 193 (2008) 54–62.
[28] J. Luznik, J. Pirnat, V. Jazbinšek, Z. Lavric, S. Srcic, Z. Trontelj, The influence ofpressure in paracetamol tablet compaction on 14N nuclear quadrupoleresonance signal, Appl. Magn. Reson. 44 (2013) 735–743.
[29] J. Luznik, J. Pirnat, V. Jazbinšek, Z. Lavric, T. Apih, R. Blinc, J. Seliger, Z. Trontelj,Improved 14N nuclear quadrupole resonance detection of trinitrotoluene usingpolarization transfer from protons to 14N nuclei, J. Appl. Phys. 102 (2007)084903.


![Fraunhofer Food Chain Management Alliance...[1] Gas Sensor - IME, IPM [5] Color Detector - EMFT [9] Miniaturized IR Spectrometer - IPMS [2] UV Filter in Package - IVV [6] 3D Sheet](https://img.pdfslide.net/doc/110x75/5f104e1e7e708231d448737b/fraunhofer-food-chain-management-alliance-1-gas-sensor-ime-ipm-5-color.jpg)