Embed Size (px)
Citation preview

A MODEL FOR PREDICTING THE THERMAL RADIATION HAZARDS FROM LARGE-SCALE HORIZONTALLY RELEASED NATURAL GAS JET FIRES *
A.D. Johnson, H.M. Brightwell and A.J. Carsley Shell Research Ltd., Thornton Research Centre, P.O. Box 1, Chester CHI 3SH
A new model is described for predicting the size and orientation of large-scale, accidental, horizontally released natural gas jet fires and the thermal radiation emitted to external objects. The flame is represented by a frustum of a cone. The relative influences of the jet momentum flux, buoyancy forces and the wind momentum flux are determined by correlations, derived from large-scale experiments carried out over a wide range of release and weather conditions. The surface radiative emission, from the ends and sides of the model flame shape, differs in a way that is representative of the variation of radiative emission with emitting path length through the flame. Predictions and experimental measurements are compared. The model can be implemented on personal computers.
KEYWORDS: Horizontal Natural Gas Jet Fire Model, Thermal Radiation
INTRODUCTION
Process engineers are required to design systems for the safe disposal of high-pressure gases from process plant under certain operational and emergency conditions. For flammable gases, it is important to be able to predict the thermal radiation transferred to objects outside an ignited release. The orientation of an accidental release could be in any direction, but perhaps the most hazardous orientation is a horizontal release because the resulting jet fire may be brought closer to nearby people and process plant, with consequent increases in thermal radiation fluxes and probability of flame impingement. Inclined flare systems have been installed on offshore platforms, because the flare stack can be shorter if the flame is carried away from the platform. This also enables aerial access during an emergency.
A model for predicting the flame shape and external thermal radiation arising from ignited horizontal natural gas releases is presented. The model is an extension and improvement of an earlier Shell model, which was developed specifically for vertical and inclined flares(l). The flame is idealised as a frustum of a cone, which emits thermal radiation from its surface. The model flame shape and radiative properties are described by simple correlations, based on measurements from 27 large-scale experiments. The experiments form part of a large programme of horizontally released natural gas and pressurised liquid propane experiments carried out with British Gas pic from 1987 to 1990, and partly funded by the European Community(2).
The effect of buoyancy lifting the flame above the horizontal is considered, as too is the effect of wind momentum, which convects and straightens the flame when the wind blows in the same
* Copyright © Shell Internationale Research Maatschappij B.V.
123

I CHEM E SYMPOSIUM SERIES No. 134
direction as the release, or deflects the flame sideways in a cross-wind. The earlier model was designed for cases the wind momentum dominates over buoyancy to keep the flame below the inclination of the release. A new model has also been derived, which accounts for variation of thermal radiative emission over the flame surface.
There are many methods for predicting the thermal radiation from gaseous jet fires, ranging from crude, point-source techniques, such as given in API RP521(3), to complex computational-fluid-dynamics calculations(4), requiring many hours' work on large computer workstations and a very high level of scientific input. However, engineers working on a day-to-day basis need tools that give predictions of sufficient accuracy to match their requirements, with the minimum of detailed technical input, in the shortest possible time. The model described in this paper is suitable for implementation on a personal computer, and its accuracy is clearly stated, so that safety engineers can have confidence when making predictions for release scenarios that he within the range of the experiments from which the model was derived.
RRTRF DHSCRTPTTON OF MODEL
The flame is modelled as the truncated frustum of a cone, shown in Figure 1, which emits thermal radiation from its surface. The flame shape is specified relative to Cartesian (x,y,z) coordinates, with the x-axis pointing in the direction of the release, the y-axis pointing vertically upwards and the z-axis pointing horizontally, perpendicular to the release direction. The variables defining the flame shape are:
The coordinates of the centre of the end of the frustum in m; The maximum flame width, W2 in m; The minimum flame width, W1 in m and, The flame lift-off, b in m.
The original idea for the characterisation of the model flame geometry came from Becker et al. (5), who suggested that the trajectory of laboratory-scale horizontally released flames in still air could be parameterised by two non-dimensional numbers, representing the balance between the initial momentum flux of the jet and, respectively, the buoyancy force and the wind momentum flux. The idea was supported by slightly larger scale laboratory experiments in still air by Gore and Jian(6).
The model outlined here requires a description of the flame shape from horizontal releases, with the wind blowing from an arbitrary direction relative to the release. The flame trajectory is then determined by three non-dimensional numbers, representing the balance between the initial momentum flux of the jet and, respectively, the buoyancy force and the wind momentum flux in the direction of the release and perpendicular to the direction of the release. The characterisation of both the buoyancy force and the wind momentum force requires a typical flame length scale over which the forces act. The length scale used is the flame length for vertical releases in still air, from the correlation by Kalghatgi(7). For those flame shape parameters that are affected by variations in wind momentum flux, the model correlations are taken to be the product of a term giving the still air characterisation and a term giving the wind momentum effect.
The thermal radiation in natural gas jet fires comes from the hot gaseous combustion products and incandescent soot particles deep within the flame. Natural gas jet flames contain relatively low
124

I CHEM E SYMPOSIUM SERIES No. 134
concentrations of soot particles compared to flames fuelled by heavier hydrocarbon molecules. As a result, the spectral radiative emission from shorter paths through a flame, of the order of 5 m say, shows peaks from gaseous emission against a lower background continuum emission from the hot soot. As the radiative pathlength through the flame increases, the contribution from the soot emission increases and the total wavelength integrated radiative emission increases until, for pathlengths of the order of 10-20 m the emission spectrum becomes black body in nature at an emission temperature of around 1500 K. Thereafter, no further increase in the radiative emission occurs for increasing radiative pathlengths through the flame. The same change in radiative emission with scale of fire has been observed for the flames above pools of burning liquefied natural gas(8).
Account therefore has to be taken of the size of the flame when making the transformation from the volume radiative emission of the real flame to the model surface radiative emission. For horizontally released flames, objects in the direction of the release receive radiation from emitting paths roughly equal to the flame length, which is much larger than the flame width. A different surface emissive power is thus assigned to the ends of the model flame shape from the SEP used for the sides of the model flame shape.
The thermal radiative flux q (kW/m2 ) at a surface element outside the flame is given by:
w h e r e i s the view factor, is the surface emissive power (SEP) in kW/m2 and is the atmospheric transmissivity, the fraction of emitted energy not absorbed or scattered by the atmosphere.
The subscripts side and end refer to values calculated for the sides and ends of the model flame shape.
The view factor VF quantifies the geometric relationship between the model flame shape and receiving surface; it describes how much of the field of view of the receiving surface is filled by the flame. The view factor equals 1 if the flame fills the field of view of the receiving surface, otherwise it is a fraction of 1. The view factors for the ends and sides of the model flame shape are calculated separately using a contour integration technique(9,10).
is an effective atmospheric transmissivity for all the paths through the atmosphere from points on the flame surface to the receiving surface. The atmospheric transmissivity is calculated using an efficient algorithm developed by Wayne(ll). The algorithm is based on the assumptions that the flame is a black body source at 1500 K, that CO2 and H2O are the only absorbing gases in the atmosphere and that atmospheric scattering is negligible. The transmissivity can be calculated for absorbing paths 10 to 1000 m long dirough atmospheres of any relative humidity, at temperatures between 253 and 313 K. For atmospheric pathlengths less than 10 m, x is set to unity and for pathlengths greater than 1000 m, 1 is set to its value at 1000 m.
The pathlength is taken to be the distance from the receiving point to the geometric centre of the model frustum. This model gives reasonable estimates of the atmospheric transmissivity for pathlengths up to about 50 m, which corresponds to the distance from the centre of the experimental flames to the radiometers where measured heat fluxes were about 1 kW/m .
125

I CHEM E SYMPOSIUM SERIES No. 134
EXPERIMENTAL AND DATA ANALYSIS
The experiments used in the derivation of the new model were carried out at the British Gas test site at Spadeadam in Cumbria. Full experimental details are given in reference 2 and the individual test data reports. The release conditions mostly conformed to one of four standard types, B, C, D or E, listed in Table 1, except for test 1046, which has the same release configuration as for types B and C, but a mass flow rate of 5 kg/s, and test 1045, in which a square-edged orifice was used, with the same cross-sectional area as for types B and C. The flames were released 3.2 m or 1.7 m above ground level. The source diameter was varied by placing 20 mm or 75 mm diameter circular orifices, or a square edged orifice as in test 1045, on the end of the pipe, or leaving the end open for a full-bore 152 mm diameter release. The molar composition of the fuel was approximately 94% methane, 5.31% ethane, 0.425% nitrogen and 0.265% propane and other hydrocarbons. All data were averaged over a period of about 10-20 seconds when the flame was in a relatively steady state. The ambient temperature, relative humidity, and the wind velocity were measured during the steady period.
The mass flow rate, m, was calculated from the pressure and temperature measurements 400 mm upstream of the release point using an isentropic flow equation, together with a correction factor for non-uniform flow across the pipe cross-section, derived from orifice plate measurements of the mass flow during a later series of experiments.
Flame shapes were obtained by image analysis of a video recording of the test in side view. The boundary of each image-analysed instantaneous flame shape is the projection of the luminous flame envelope onto a vertical plane containing the release axis. The measured mean flame shape was derived by superimposing the instantaneous flame shapes from every video frame during an averaging period and selecting all those areas for which flame was present for more than 50% of the averaging period. The amount of flame fluctuation during an averaging period can be estimated from the 5% occurrence of flame contour.
In some tests temperatures within the flame were measured using thermocouples mounted on arrays of poles fixed to the ground. The poles did not affect the overall flame behaviour. However, part of the poles occasionally reflected light from the flame so strongly that they were discriminated as flame by the image analysis system. Thus some of the 5% and 50% occurrence measured flame contours have small fin-shaped blips on their lower edges. This error meant that maximum flame widths had to be measured by hand perpendicular to the local mean flame centreline.
Since there were no video cameras looking down, it was impossible to use video information to determine how much the wind deflected the real flames away from the release axis. There is evidence from the temperature measurements inside the flames that the flames were deflected off axis by cross-winds. However, the thermocouple arrays were placed at the same height as the release point and the bulk of the buoyant flame, which would have been deflected the most, was always above the thermocouples. The most reliable measure of the amount that the flame was deflected comes from the radiation heat flux measurements at radiometers placed symmetrically on either side of the flame.
In all the natural gas flames there is a region nearest the release point, which burns as a blue flame. This region is almost invisible on the video records and consequently is not discriminated as part of the measured flame shape. It is therefore impossible to measure the true flame lift-off distance, the length of the initial part of the jet that cannot support combustion because of the strong
126

I CHEM E SYMPOSIUM SERIES No. 134
hydrodynamic shear in the part of the jet that is flammable. The size of this blue flame region is an increasing fraction of the overall flame length as the jet source strength increases. However, the thermal radiation from the blue flame region is small compared to that from the luminous yellow flame region further downstream, which contains incandescent soot. Therefore, the measured flame lift-offs and minimum widths were taken from the end of the 50% occurrence contour nearest the release point, with the minimum width measurement taken by hand across the first portion of flame where the width is almost constant.
External thermal radiation measurements were made using radiometers of either Medtherm or Land type. The field of view derived from the orientation and position of each radiometer was compared with the measured mean flame shape to ensure that it received thermal radiation from the whole of the flame.
MODEL FLAME SHAPE CORRELATIONS
The initial jet behaviour, when the gas expands down to atmospheric pressure, is calculated in the same way as described by Chamberlain(l). Hence the expanded jet momentum flux G is given by,
w h e r e i s the expanded jet density in kg/nr, is the expanded jet velocity in m/s and is the expanded jet diameter in m.
and dj are defined using the equations in the Appendix of reference 1.
The balance between the initial jet momentum flux and buoyancy is characterised by the Richardson number, given by
L is a typical length scale of the flame, over which the buoyancy force acts.
The length scale used is the flame length for a vertical flame in still air The flame length in still air is determined by a correlation derived by Kalghatgi(7) using vertical laboratory-scale
127

I CHEM E SYMPOSIUM SERIES No. 134
releases. The form of the correlation for is similar to that originally derived by Becker and Liang(12). is given by the solution of the equation
The initial jet momentum flux varied from 383 N to 6828 N, the wind speed varied from 0.3 m/ s to 10.9 m/s and the wind direction varied from coflowing with the jet to perpendicular to the jet release direction.
The correlation defining the x-position of the end of the flame takes the form of a term for releases in still air, multiplied by a term defining the influence of the wind momentum in the release direction. Although it is expected that a strong cross-wind will bend the flame away from the release direction and reduce the x-position of the flame end, no evidence for this could be discerned for the
Kalghatgi's equation (4) was derived for However, the experiments of Becker and Liang suggest that the correlation is valid for values of up to about 20.
The balance between the wind momentum flux and the initial jet momentum flux is expressed by two non-dimensional parameters, representing balance between the initial jet momentum flux and, respectively, the wind momentum flux in the release or x-direction and the wind momentum flux in the z-direction, perpendicular to the jet. These parameters are given by
128
I CHEM E SYMPOSIUM SERIES No. 134
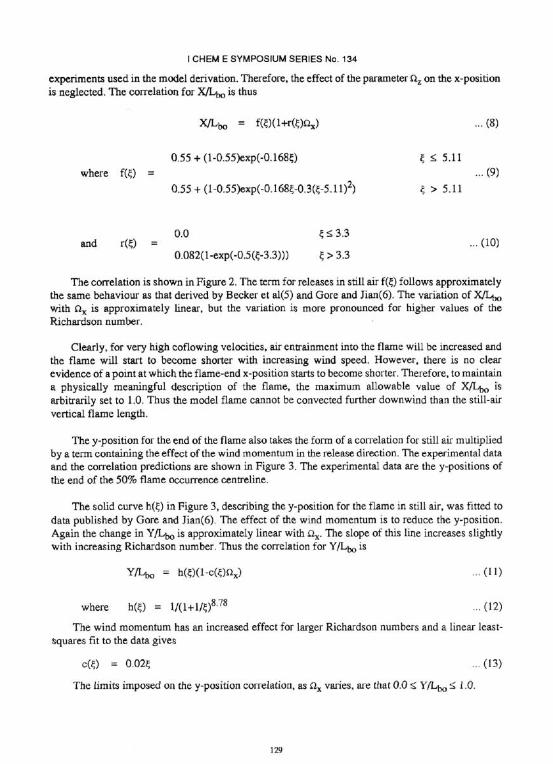
experiments used in the model derivation. Therefore, the effect of the parameter on the x-position is neglected. The correlation for , is dius
The correlation is shown in Figure 2. The term for releases in still air follows approximately the same behaviour as that derived by Becker et al(5) and Gore and Jian(6). The variation of with is approximately linear, but the variation is more pronounced for higher values of the Richardson number.
Clearly, for very high coflowing velocities, air entrainment into the flame will be increased and the flame will start to become shorter with increasing wind speed. However, there is no clear evidence of a point at which the flame-end x-position starts to become shorter. Therefore, to maintain a physically meaningful description of the flame, the maximum allowable value of is arbitrarily set to 1.0. Thus the model flame cannot be convected further downwind than the still-air vertical flame length.
The y-position for the end of the flame also takes the form of a correlation for still air multiplied by a term containing the effect of the wind momentum in the release direction. The experimental data and the correlation predictions are shown in Figure 3. The experimental data are the y-positions of the end of the 50% flame occurrence centreline.
The solid curve in Figure 3, describing the y-position for the flame in still air, was fitted to data published by Gore and Jian(6). The effect of the wind momentum is to reduce the y-position. Again the change in is approximately linear with The slope of this line increases slightly with increasing Richardson number. Thus the correlation for
The wind momentum has an increased effect for larger Richardson numbers and a linear least-squares fit to the data gives
129

I CHEM E SYMPOSIUM SERIES No. 134
The maximum width of the experimental flame shapes occurs about two-thirds of the way along each flame. However, a conical frustum flame shape with the same width at two-thirds of the flame length would have a grossly overpredicted width at the end of flame. Therefore, the maximum width measurements are used as the maximum widths of the model flame shapes. The parameter W2/Lbxy, for both the measurements and the model correlation, is plotted against Richardson number in Figure
is given by
where X and Y are given by Equations (8) and (11) respectively.
appears to vary linearly with the Richardson number in still air. For a given value of the Richardson number, appears to decrease linearly with increasing Thus the correlation defining the maximum model flame width is
W2 must be greater than or equal to the minimum flame width Wi and less than Lbx y , for a physically realistic flame shape prediction.
Ricou and Spalding(13) suggested that the air entrainment per unit length into a jet flame is proportional to the square root of the product of the local jet momentum and the local air density. Jets with high initial momentum thus entrain more air per unit length, in the initial convection-dominated part of the jet, and burn more as a premixed blue flame, than jets with lower initial momentum. Further down the jet, less air is entrained per unit length, the combustion is less efficient, and sooting occurs, leading to a luminous flame. The luminous flame lift-off, b is thus found to be given by.
The correlation is shown in Figure 5. No wind effects could be observed.
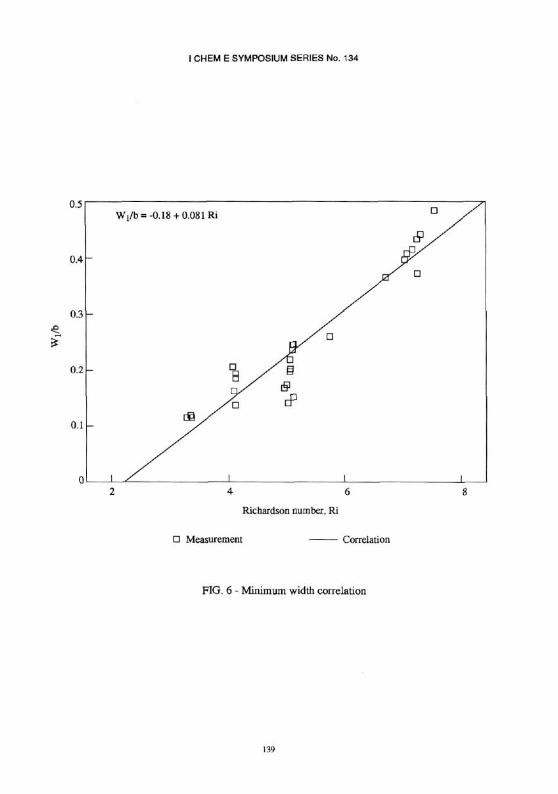
The minimum flame width, Wi correlates with the flame lift-off and the flame Richardson number. No wind momentum effects were observed.
The correlation is shown in Figure 6. The minimum observed value of is approximately 0.12. This corresponds to the jet spread coefficient (2CS= 0.118) for forced convection jets reported by Becker and Yamazaki( 14) for vertical free turbulent diffusion flames. The jet cannot become any narrower than in the forced convection limit. Thus the minimum allowed value of is set to 0.12.
The deflection of the flame by a cross-wind was estimated by moving the model flame shape until the predicted heat fluxes at radiometers, placed symmetrically either side of the release axis, were in the same proportion to the measurements. These deflections were found to correlate with the balance between the wind momentum force perpendicular to the release axis and the initial jet momentum flux. The correlation is given by
130

I CHEM E SYMPOSIUM SERIES No. 134
where a is the angle that the projection of the frustum axis onto the horizontal plane makes with the release axis. Z is thus the z-position of the end of the flame. The linear correlation with Qz has a correlation coefficient of 0.9.
THERMAL RADIATION CORRELATIONS
The radiative emission from a flame can be related to the SEP and the model flame shape by a factor, describing the fraction of heat energy radiated from the idealised flame surface, which is the ratio
of the rate of radiative energy release to the power that would be released if all the fuel supplied to the flame were to burn stoichiometrically and adiabatically. In a jet flame, F s depends on the efficiency of combustion within the flame, the amount of energy lost by convection to entrained air and the radiative properties of the combustion products. Soot is a much more efficient radiator than gaseous products, and radiation increases with pathlength through a flame.
The SEP, from large-scale flames, with emitting pathlengths long enough for the emission to be that of a black body, is thus given by,
w h e r e i s the total model flame surface area in m , is the net heat released as combustion in kW and is the F s factor for flames which emit black body radiation.
The effect of varying pathlengths through the flame is taken into account by assigning different values of SEP, S, for the ends and sides of the model flame shape using a grey gas approximation.
where k is a grey gas absorption coefficient in m"1 and L is a lengthscale in m representing the emitting pathlength.
The length scale, L, representative of the average emitting path length was taken to be the predicted maximum width W 2 and frustum length Ri respectively for emission through the sides and ends of the model flame shape.
The form of and the value of k were obtained in the following manner. For each of the heat flux measurements at radiometers to one side of the release, which did not receive radiation from the ends of the predicted flame frustum, Equations (19) and (20) were used with Equation (1) (note that
to calculate a value of such that the predicted heat flux matched the measured heat flux. The average of these values for each test is plotted in Figure 7 as a square, together with their standard deviation. An estimate was then made for the value of k and the form of
The correlation for should be similar to that in the model derived by Chamberlain for vertical releases, since the derived factor was for very large flames. Values of were then predicted using Equations (19) and (20). Then, for each heat flux measurement at radiometers downstream of the release, Equation (1) was used to calculate a value of such that the prediction and the measurement matched. Hence, using Equations (19) and (20), an estimate of the required
131

I CHEM E SYMPOSIUM SERIES No. 134
Figure 8 shows a comparison between measured and predicted shapes for examples of flame types B,C, D and E. The buoyancy is slightly over predicted for the flame type B, which can be explained partly by the fact mat the flame was released at a height of 1.7 m and tended to hug the ground. It was not possible to include this phenomenon in the model correlations. The flame lengths, maximum and minimum widths and lift-offs are reasonably well predicted. Tables 2-5 show a comparison of the measured and predicted radiation heat fluxes values for these tests, together with the location and orientation of the radiometers and all the input data necessary to use the model.
Figure 9 shows a comparison of the measured and predicted radiation heat fluxes for all 242 radiometers for which valid experimental measurements were available. Most of the predictions lie within 15% of the measurements. Of the 192 measurements, which were greater than 2.5 kW/m2, only 5% are underpredicted by more than 20%. Similarly, only 10% of these are overpredicted by more than 20%. During the experimental averaging periods, when the flames were nominally steady, the radiometer measurements showed fluctuations of the order of 5% of the average measurements. Thus, the model can be considered to be accurate to within about 15-20%, which is sufficient for safety engineers to make useful design calculations. None of the measurements, which were less than 2.5 kW/m , were underpredicted by more than 1 kW/m , and only seven were over predicted by more than 1 kW/m2.
The two outstanding overpredictions of heat fluxes beyond the end of the flame, where the measured fluxes are about 8 kW/m and the predictions are about 16 kW/m , are for radiometers that are within 5m of the flame surface. At this proximity to the flame surface, the assumption that the flame can be modelled as a surface emitter begins to break down. The one outstanding underprediction occurs for radiometer 12 on the north side of the flame from test 1037. This was the only type C test with gas released from 1.7 m above the ground. As in Figure 8(a) the flame hugged the ground for the first 18 m or so from the release point; consequently, the flame buoyancy is overpredicted and the radiation heat fluxes are underpredicted.
132

I CHEM E SYMPOSIUM SERIES No. 134
CONCLUSIONS
1. The radiation field around horizontally released natural gas jet flames can be described well by a model in which the flame is idealised as a surface emitter in the shape of a cone frustum. The model is an extension and improvement of an earlier Shell model, which is specifically designed for vertical flares, or inclined flares when the wind momentum is strong enough to keep the flame below the inclination of the release.
2. The correlations defining the model flame shape take proper account of the balance between the initial jet momentum flux and the forces applied to the flame due to buoyancy and wind momentum.
3. The model is simple enough to be implemented on a personal computer.
4. The radiative emission from natural gas jet flames varies with jet exit velocity and emitting pathlength through the flame. The emission along a given path through the flame increases exponentially with path length until it reaches a maximum and saturates. Consequently, for all but very large jet flames, the radiative emission through the ends of the flame is greater than the radiative emission through the sides. There is a realistic difference in SEP for the ends and sides of the frustum model flame shape.
5. For both horizontal and vertical releases of natural gas, the average fraction of energy emitted as radiation is the same.
6. The accuracy of radiation predictions is sufficient for the model to provide a reliable basis for thermal radiation hazards analysis.
ACKNOWLEDGEMENTS
The authors would like to thank all those within Shell International who sponsored this work and those who carried out or sponsored the large-scale experimental work described in this paper.
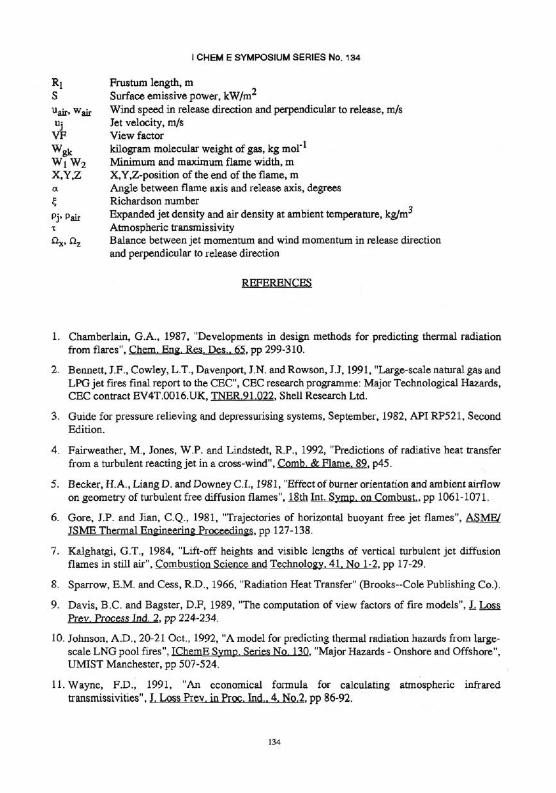
NOMENCLATURE
Total model flame surface area, m Flame lift-off, m Jet diameter and effective source diameter, m F factor Initial jet momentum flux, N Grey gas absorption coefficient (0.4 m-1 ) Flame length, Lj, is still air, m Radiative heat flux, kW/m2
Net heat released by combustion, kW
133
I CHEM E SYMPOSIUM SERIES No. 134
1. Chamberlain, G.A., 1987, "Developments in design methods for predicting thermal radiation from flares", Chem. Eng. Res. Pes.. 65. pp 299-310.
2. Bennett, J.F., Cowley, L.T., Davenport, J.N. and Rowson, J.J, 1991, "Large-scale natural gas and LPG jet fires final report to the CEC", CEC research programme: Major Technological Hazards, CEC contract EV4T.0016.UK, TNER.91.022. Shell Research Ltd.
3. Guide for pressure relieving and depressurising systems, September, 1982, API RP521, Second Edition.
4. Fairweather, M., Jones, W.P. and Lindstedt, R.P., 1992, "Predictions of radiative heat transfer from a turbulent reacting jet in a cross-wind", Comb. & Flame. 89. p45.
5. Becker, H.A., Liang D. and Downey C.I., 1981, "Effect of burner orientation and ambient airflow on geometry of turbulent free diffusion flames". 18th Int. Symp. on Combust., pp 1061-1071.
6. Gore, J.P. and Jian, C.Q., 1981, "Trajectories of horizontal buoyant free jet flames", AS ME/ JSME Thermal Engineering Proceedings, pp 127-138.
7. Kalghatgi, G.T., 1984, "Lift-off heights and visible lengths of vertical turbulent jet diffusion flames in still air". Combustion Science and Technology. 41. No 1-2. pp 17-29.
8. Sparrow, E.M. and Cess, R.D., 1966, "Radiation Heat Transfer" (Brooks-Cole Publishing Co.).
9. Davis, B.C. and Bagster, D.F, 1989, "The computation of view factors of fire models", L Loss Prev. Process Ind. 2. pp 224-234.
10. Johnson, A.D., 20-21 Oct., 1992, "A model for predicting thermal radiation hazards from large-scale LNG pool fires", IChemE Symp. Series No. 130. "Major Hazards - Onshore and Offshore", UMIST Manchester, pp 507-524.
11. Wayne, F.D., 1991, "An economical formula for calculating atmospheric infrared transmissivities", J. Loss Prev. in Proc. Ind.. 4. No.2. pp 86-92.
134

I CHEM E SYMPOSIUM SERIES No. 134
12. Becker, H.A. & Liang, D., 1978, "Visible length of vertical free turbulent diffusion flames", Combustion and Flame. 32. pp 115-137.
13. Ricou, P.P. and Spalding, D.B., 1961, J. Fluid Mech. 11. p 21.
14. Becker, H.A. and Yamazaki, S., 1978, "Entrainment, momentum flux and temperature in a vertical free turbulent diffusion flame", Combustion and Flame. 33. pp 123-149.
TABLE 1: Experimental conditions
TABLE 2: Comparison of calculated radiation levels wim measured values Test 1040. type B
Origin at release point. All radiometers oriented horizontally, pointing perpendicular to release. North is in the -z direction.
135

I CHEM E SYMPOSIUM SERIES No. 134
TABLE 3: Comparison of calculated radiation levels with measured values Test 1083. type C
Origin at release point. All radiometers oriented horizontally. Radiometers 1-6 point perpendicular to release axis. Radiometers 10-14 point back along release axis towards origin. North is in the -z direction.
TABLE 4: Comparison of calculated radiation levels with measured values Test 1033. Type D
Origin at release point. All radiometers oriented horizontally, pointing perpendicular to release. North is in the -z direction.
136

I CHEM E SYMPOSIUM SERIES No. 134
137

I CHEM E SYMPOSIUM SERIES No. 134
138
I CHEM E SYMPOSIUM SERIES No. 134
FIG. 6 - Minimum width correlation
139

I CHEM E SYMPOSIUM SERIES No. 134
140

141

I CHEM E SYMPOSIUM SERIES No. 134
142