Embed Size (px)
Citation preview

Brigham Young University Brigham Young University
BYU ScholarsArchive BYU ScholarsArchive
Theses and Dissertations
2013-02-15
A Model of Digital Textbook Quality from the Perspective of A Model of Digital Textbook Quality from the Perspective of
College Students College Students
TJ Bliss Brigham Young University - Provo
Follow this and additional works at: https://scholarsarchive.byu.edu/etd
Part of the Educational Assessment, Evaluation, and Research Commons
BYU ScholarsArchive Citation BYU ScholarsArchive Citation Bliss, TJ, "A Model of Digital Textbook Quality from the Perspective of College Students" (2013). Theses and Dissertations. 3424. https://scholarsarchive.byu.edu/etd/3424
This Dissertation is brought to you for free and open access by BYU ScholarsArchive. It has been accepted for inclusion in Theses and Dissertations by an authorized administrator of BYU ScholarsArchive. For more information, please contact [email protected], [email protected].
A Model of Digital Textbook Quality from
the Perspective of College Students
TJ Bliss
A dissertation submitted to the faculty of Brigham Young University
in partial fulfillment of the requirements for the degree of
Doctor of Philosophy
Richard R Sudweeks, Chair Lane Fischer
Joseph A. Olsen David A. Wiley
David D. Williams
Educational Inquiry, Measurement, and Evaluation Program
Brigham Young University
February 2013
This work by TJ Bliss is licensed under a Creative Commons Attribution 3.0 Unported License

ABSTRACT
A Model of Digital Textbook Quality from the Perspective of College Students
TJ Bliss Educational Inquiry, Measurement, and Evaluation Program, BYU
Doctor of Philosophy
The cost of textbooks is a financial burden on many college students. Fortunately the advent of open educational resources (OER) has allowed for the development of textbooks and other materials at significantly reduced costs to students. Many faculty are using OER to develop customized textbooks for their students, usually published digitally online. These faculty desire high fidelity feedback from their students to help them improve their texts. However, there is no general model of what digital textbook quality means to college students. Such a model would allow for the development of a measure of digital textbook quality that could provide highly valid and reliable student feedback for faculty to use in improving their open textbooks. This study describes a mixed-methods approach for developing a model of digital textbook quality from the college student perspective. An instrument for measuring the components of this model is also described. This dissertation can be freely accessed and downloaded from http://etd.byu.edu/ or from http://tjbliss.org/dissertation.
Keywords: open educational resources, thematic analysis, confirmatory factor analysis,
instructional materials, educational technology, Digital Textbook Quality Questionnaire

ACKNOWLEDGEMENTS
It is with immense gratitude that I acknowledge the support and help of my committee
chair, Dr. Richard R Sudweeks, who has exhibited enduring wisdom and persistent patience in
his support of me as an individual and as a professional. From the first time he provided me with
measurement advice when I was an undergraduate student 8 years ago (a meeting he may not
even recall) to our latest discussions about the material in this dissertation, Dr. Sudweeks has
been a true mentor. I also thank his wife, Jo, for her willingness to patch through early morning
and late-night phone calls from needy graduate students like myself.
I am also indebted to my committee members for their several contributions to this work,
as well as to my personal growth. Dr. David Wiley has been a true friend and mentor, infecting
me with his passion for openness and equity in education. Dr. Lane Fischer has been the
embodiment of kindness and heartfelt concern, as well as a model teacher and gracious friend.
Dr. David Williams has given me a completely new perspective on the world. And Dr. Joseph
Olsen has provided wonderfully deep insight on issues related to factor analysis and data
treatment.
I share the credit of my work with my fellow EIME students, especially T. Jared
Robinson, Matthew Wilcox, and Dan Allen, who have provided ongoing emotional and strategic
support for the many varied projects I have undertaken during my time at BYU. In addition, my
success in graduate school would not have been possible without my former advisors. Dr. Chad
Brassil was instrumental in helping me overcome my math phobia and was the one who first
recognized and helped me act on my passion for education research. Dr. Thomas Powers taught
me the value of persistence and dedication, especially when the task at hand was tedious or
difficult. And Dr. Byron Adams has given me perhaps the sagest advice I’ve ever received,

including the counsel to always “follow your bliss” and to “not let school get in the way of your
education.”
I owe my deepest gratitude to my family. My parents, Larry and Marilyn, along with my
several siblings, have been constant and unwavering in their support of me and my
accomplishments. They have each been a pillar of strength and love through good times and bad.
My children, Sophie, Henry, Hallie, and Rose, each deserve hugs and kisses for never
complaining about their absentee father and for loving him all the more just for coming home
from work. My wife, Debra, has been both an anchor and a lighthouse to me. I cannot adequately
express my gratitude for her support, encouragement, wisdom, patience, and love. She, more
than any other, deserves what reward comes with the successful completion of my degree.
Finally, I thank my Heavenly Father and His Son, Jesus Christ, for their constant guidance and
love. I have truly seen the hand of the Divine as I have progressed through my life.

v
TABLE OF CONTENTS
List of Tables ................................................................................................................................. ix
List of Figures ..................................................................................................................................x
Chapter 1: Introduction ....................................................................................................................1
Textbook Quality .........................................................................................................................3
Open Digital Textbooks ...............................................................................................................4
Study Purpose and Questions.......................................................................................................5
Delimitations ................................................................................................................................6
Chapter 2: Literature Review ...........................................................................................................7
Search Strategy ............................................................................................................................8
Criteria for Evaluating Textbooks ...............................................................................................9
Cost ..........................................................................................................................................9
Sensitivity to Diversity ..........................................................................................................10
Content ...................................................................................................................................11
Readability .............................................................................................................................12
Educational Impact ................................................................................................................13
Pedagogical Aids ...................................................................................................................14
Interaction ..............................................................................................................................14
Criteria Imposed on Students for Evaluating Textbooks ...........................................................15
Human Interest .......................................................................................................................15
Learnability ............................................................................................................................16
Pedagogical Aids ...................................................................................................................16
Other Criteria .........................................................................................................................17
vi
Criteria for Evaluating Digital Textbooks .................................................................................17
Chapter 3: Method .........................................................................................................................19
Study Context............................................................................................................................19
Qualitative Method ....................................................................................................................20
Sample....................................................................................................................................20 Questionnaires ........................................................................................................................21 Interviews ...............................................................................................................................21 Literature Survey ...................................................................................................................22 Data Analysis .........................................................................................................................23 Standards for Qualitative Studies ...........................................................................................23
Quantitative Method ..................................................................................................................24
Sample....................................................................................................................................24 Item Writing ...........................................................................................................................25 Conceptual Model Development ...........................................................................................26 Item Analysis .........................................................................................................................26
Confirmatory Factor Analysis (CFA) ....................................................................................32
First-Order Confirmatory Factor Analysis.........................................................................34
Second-Order Confirmatory Factor Analysis ....................................................................34
Second-Order Exploratory Factor Analysis in the Confirmatory Framework (E/CFA) ....34
Chapter 4: Results ..........................................................................................................................36
Themes Derived from Qualitative Analysis ..............................................................................36
Navigation Features ...............................................................................................................36 Access Features ......................................................................................................................37

vii
Technical Performance ..........................................................................................................38 Relevance ...............................................................................................................................39 Interaction Characteristics .....................................................................................................40 Presentation Characteristics ...................................................................................................41 Educational Impact ................................................................................................................43 Sensitivity to Diversity ..........................................................................................................44
Quantitative Analysis .................................................................................................................45
Item Analysis .........................................................................................................................45 Confirmatory Factor Analysis (CFA) ....................................................................................45
First-Order Confirmatory Factor Analysis.........................................................................45 Second-Order Confirmatory Factor Analysis ....................................................................50
Second-Order Exploratory Factor Analysis in the Confirmatory Framework (E/CFA) ....56
Summary ...................................................................................................................................61
Chapter 5: Discussion ....................................................................................................................62
Summary of Qualitative Analysis ..............................................................................................62
Summary of Quantitative Analysis ............................................................................................63
Conclusions ................................................................................................................................66
Desirable Characteristics of a High Quality Digital Textbook ..............................................66 Preferred Factor Models ........................................................................................................66 Evidence of Reliability and Validity ......................................................................................67
Contributions of this Study to the Literature on Textbook Evaluation ......................................67
Limitations .................................................................................................................................69
Sampling Inadequacies ..........................................................................................................69

viii
Lack of Cross-Validation .......................................................................................................71
Recommendations .....................................................................................................................71
Use of the Model ....................................................................................................................71 Use of the Measurement Instrument ......................................................................................72 Further Research ....................................................................................................................72
Final Thoughts ...........................................................................................................................74
References ......................................................................................................................................75
Appendix A ....................................................................................................................................86 Appendix B ....................................................................................................................................94

ix
LIST OF TABLES
Table 1 .......................................................................................................................................21 Sample Characteristics of the Qualitative Study
Table 2 .......................................................................................................................................25 Sample Characteristics of the Quantitative Study
Table 3 .......................................................................................................................................49 First-Order Model Fit and Comparative Statistics
Table 4 .......................................................................................................................................52 Standardized Parameter Estimates for Model 10
Table 5 .......................................................................................................................................54 Estimated Factor Correlation Matrix for Model 10
Table 6 .......................................................................................................................................54 Subscale Reliabilities for Model 10
Table 7 .......................................................................................................................................57 Second-order Model Fit and Comparative Statistics
Table 8 .......................................................................................................................................57 Standardized Parameter Estimates for Model 1h
Table 9 .......................................................................................................................................58 Second-order EFA Factor Loading Estimates
Table 10 .....................................................................................................................................58 Parallel Analysis of Second-order EFA Eigenvalues
Table 11 .....................................................................................................................................60 Standardized Parameter Estimates for Model 2h

x
LIST OF FIGURES
Figure 1 ......................................................................................................................................27 Path Diagram of Hypothesized First-order Model
Figure 2 ......................................................................................................................................28 Path Diagram of Hypothesized Second-order Model
Figure 3 ......................................................................................................................................46 Category Probability Curves for Poor Functioning Items
Figure 4 ......................................................................................................................................47 Category Probability Curves for Well Functioning Items
Figure 5 ......................................................................................................................................51 Path Diagram of Model 10
Figure 6 ......................................................................................................................................55 Path Diagram of Model 1h
Figure 7 ......................................................................................................................................59 Path Diagram of Model 2h

1
Chapter 1
Introduction
Any philosophic explanation of Quality is going to be both false and true precisely
because it is a philosophic explanation.
– Robert M. Pirsig
Education is vital to all people, both individually and collectively. Indeed, there is little
argument about the importance of education as a means of enriching individuals and societies
(Dewey, 1897). Because so many agree on the importance of education, in many countries a
great deal of public money is spent on schooling. It is becoming rapidly apparent, however, that
the education received in grades K-12 is not sufficient to provide children with the skills they
need to succeed in their careers and to maximize their potential to advance society. Thus, a
growing number of high school graduates are seeing the need for higher education. In most
cases, students do not receive higher education as a public good, but must find means of their
own to cover its costs. These costs can include (a) tuition, (b) fees, (c) housing, (d)
transportation, (e) technology, and (f) instructional materials. Costs continue to rise in each of
these areas.
The cost of tuition specifically has seen a dramatic increase in the past few years with the
average annual cost of college tuition (including room and board) now at $17,464, up from
$7,685 in 1980 (U.S. Department of Education, 2011). Similarly, the costs of textbooks are also
rising quickly. In fact, the average college student in the United States now spends over $900 per
year on textbooks (Allen, 2010), and this expense can be a large fraction of the overall cost of a
college degree. Indeed, the increasing textbook costs are making a college education
2
prohibitively expensive for many students (Kingkade, 2011). Partly in response to the rising cost
of textbooks, Open Educational Resources (OER) have been developed to reduce the cost of
educational content, including textbooks. Recent research has shown that high quality, openly
licensed textbooks can be made available to students at dramatically reduced costs, essentially
eliminating the “textbook barrier” to a college education (Caswell, 2012).
OER are defined as “digitized materials freely and openly available for educators,
students, and self-learners to use and reuse for teaching, learning, and research” (OECD, 2007, p.
2). Currently, OER are being implemented as digital textbooks at colleges and universities
around the world, providing great economic benefits to scores of students. Moreover, faculty
who write or piece together their own open digital textbooks are able to continuously edit and
improve these resources to meet the specific learning needs of their students.
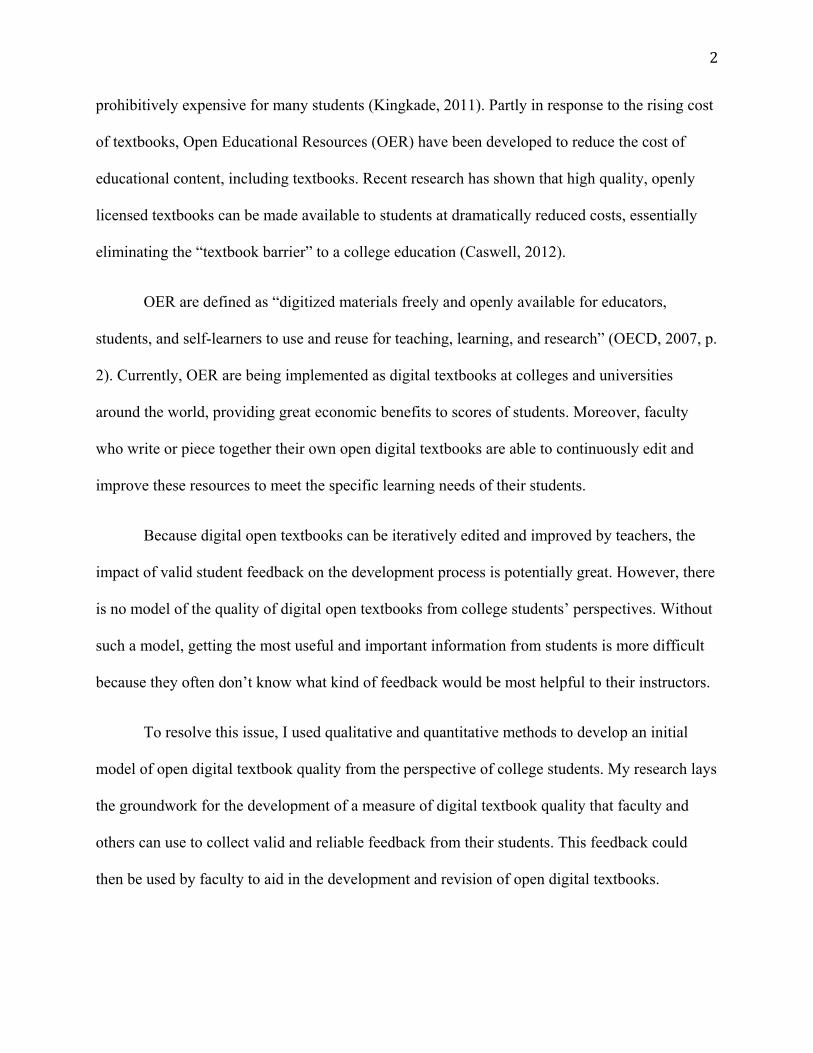
Because digital open textbooks can be iteratively edited and improved by teachers, the
impact of valid student feedback on the development process is potentially great. However, there
is no model of the quality of digital open textbooks from college students’ perspectives. Without
such a model, getting the most useful and important information from students is more difficult
because they often don’t know what kind of feedback would be most helpful to their instructors.
To resolve this issue, I used qualitative and quantitative methods to develop an initial
model of open digital textbook quality from the perspective of college students. My research lays
the groundwork for the development of a measure of digital textbook quality that faculty and
others can use to collect valid and reliable feedback from their students. This feedback could
then be used by faculty to aid in the development and revision of open digital textbooks.

3
Textbook Quality
At all levels of education, textbook development and distribution has historically been the
purview of powerful, for-profit publishing companies. At the K-12 level, schools, districts and
states have been at the mercy of these companies to provide high quality textbooks to their
students. One of the only powers these educational entities retain is the right to chose among
products: the power of textbook selection. In most cases, a few teachers, administrators, and
parents come together in a selection committee to make the final decisions about which
textbooks will be used in a school, district, or state. In higher education, the situation is similar,
except that selection committees are often comprised of a single faculty member, with the
occasional input from colleagues.
Teachers, administrators, parents, and faculty are rarely directly involved in the actual
development of the textbooks chosen for their students. Thus, the vast majority of research and
commentary on the issue of textbook quality has dealt with criteria by which selection
committees, whatever their composition, evaluate their options. Watt (2009) conducted a
literature review of the textbook selection process at the K-12 level in the United States and
concluded that most textbook selection criteria promoted by states were related to cost. Other
selection criteria commonly mentioned in the literature include (a) sensitive to cultural diversity
(Cruz, 2002), (b) content coverage (Falduto, 2009), (c) content accuracy (Steuer & Ham, 2008),
(d) readability (Gunning, 2003), (e) educational impact (Durwin & Sherman, 2008), and (f)
pedagogical aids (Honeycutt, 2007).
A few authors have discussed the role of student perceptions in evaluating textbook
options. The student viewpoint is important because students are the ones most affected by the
4
final choice made by the selection committees. In higher education, students also have to pay for
whatever textbook is selected for their use. Moreover, at least one study has shown that many
students desire to be consulted about decisions that affect their education (Shields, 2003). Yet,
only a handful of studies on textbook quality have considered students’ points of view. In these
studies, students have been asked about many different aspects of their textbooks within a variety
of subjects. These aspects include (a) overall value (Baker-Eveleth, Miller, & Tucker, 2011), (b)
format (Kelley &Warburton, 2011), (c) usability (Petrides, Jimes, Middleton-Detzner, Walling,
& Weiss, 2011), (d) pedagogical aids (Altman, Ericksen, & Pena-shaff, 2001), (e) educational
importance (Hewinson, 2007), (f) content (Besser & Stone, 1999), (g) readability (Griesinger &
Klene, 1984), (h) learnability (Britton, Van Dusen, Gulgoz, Glynn, & Sharp, 1991), and (i)
human interest (Jones & Evanciew, 1995).
Despite these examples of the use of student perspectives to evaluate textbooks, no one
has developed a general model of textbook quality from students’ point of view. In almost every
situation, the criteria for evaluating textbooks have been externally imposed on the students by
the experts, rather than asking students to indicate what characteristics of textbooks are important
to them.
Open Digital Textbooks
The usefulness of a model of textbook quality among students is magnified by the advent
of OER, which have brought the textbook development process closer to the teacher, school,
district, and state (Wiley, Bliss, & McEwen, in press). As explained earlier, there is potential for
student perceptions of textbook quality to positively influence open textbook development and
revision. In fact, a recent survey of 36 community college faculty using open textbooks showed

5
that highly valid student feedback would be somewhat or very useful to most of these faculty (94
percent) in making textbook development decisions (Bliss, Hilton, Wiley & Thanos, 2013).
Many of the open textbooks developed or implemented at the college level have been
distributed free of cost to students in a digital, online format (Petrides, et al., 2011). Some books
have also been made available for download to portable electronic devices. However, aside from
the occasional study exploring student preferences for print versus digital textbooks (Kelley &
Warburton, 2011), as with textbooks in general there is no validated theory about what makes a
digital textbook high quality from the college student point of view. Hence, even though faculty
recognize the potential value of student feedback for improving their open textbooks, getting the
most useful and important information from students is challenging. The development and
empirical validation of a general model of digital textbook quality from the perspective of
college students could lead to the development of an instrument that reliably measures students’
perceptions of quality. Results from administration of the instrument could then be used by
faculty to inform their textbook development and revision decisions.
Study Purpose and Questions
The main purpose of this study was to develop and empirically validate a model of digital
textbook quality from the perspective of college students. Hopefully, this research will contribute
to the development of a measure of digital textbook quality that faculty can be used to collect
valid feedback from their students. This feedback can then be used to inform the ongoing
development of open digital textbooks by faculty.
This study focuses on two main research questions:
6
1. What are the most desirable characteristics of a high quality digital textbook from the
perspective of college students?
2. How do these desirable characteristics translate into a model of students’ perceptions of
digital textbook quality?
a. What is the best first-order model in terms of interpretability, fit, and parsimony?
b. What evidence is there that a higher-order structure explains the relationships
among the characteristics better than a first-order model?
Delimitations
There are several perspectives by which textbooks and other instructional materials are
commonly evaluated, including the perspective of teachers, publishers, selection committees, and
students. I acknowledge that each of these perspectives is important and relevant in its own way
and context. However, this study focuses exclusively on the student perspective, particularly the
perspective of community college students.

7
Chapter 2
Literature Review
The textbook has been a key pedagogical technology in the United States since the early
1800s, and educators have long been interested in using the best textbook they can to their
students (Brandt, 1964). The desire to use high quality textbooks has meant that textbook
evaluation has been an important area of research and discussion in education for many years. In
fact, an entire book was published on the topic of textbook evaluation and selection nearly a
hundred years ago (Franzen & Knight, 1922). Indeed, there is a solid literature discussing the
criteria by which to judge and select textbooks. A very small subset of this literature also deals
with using students’ perceptions of textbook quality in making selection decisions.
Recently, the proliferation of Open Educational Resources (OER) has dramatically
changed the way textbooks are developed and used. Teachers and faculty, as well as schools,
districts and states, are now able to draw upon OER to create their own textbooks at dramatically
reduced costs. These open textbooks can also be iteratively improved by the authors from year to
year or from course to course. To make these improvements most effectively, educators need
data about the textbooks themselves. One source of this data could be students, since they are the
primary intended users and are the ones who, presumably, have spent the most time with the
textbooks. However, it is not likely that students always provide the most useful feedback,
especially when evaluation criteria are externally imposed – which is usually the case in student
textbook evaluations. There is a great need to articulate evaluation criteria that draw specifically
upon actual student perceptions of textbook quality. This is especially true for understanding
student perceptions of digital textbook quality, given the ever-increasing use of electronic
resources in the classroom.

8
The purpose of this literature review is to identify criteria (a) commonly used or
advocated for use in making textbook selection decisions, (b) commonly imposed on students
when they are asked to evaluate textbooks, and (c) unique to evaluating digital or open
textbooks, if any.
Search Strategy
The literature on textbook quality was searched using the following nine EBSCO
databases:
Academic Search Premier
Education Full Text (H.W. Wilson)
ERIC
PsycARTICLES
PsycBOOKS
PsycCRITIQUES
PsycEXTRA
Pyschology and Behavorial Sciences Collection
PsycINFO.
All searches were refined using thesaurus and subject terms as prompted by the database.
Only articles related to textbook evaluation or criteria for selecting textbooks were retained.
Searches on variants of the terms textbook quality, textbook, electronic textbooks, textbook
research, textbook evaluation, textbook selection, textbook criteria, digital textbooks, textbook
student, textbook rating, textbook standards, open textbooks, and textbook readability yielded
189 relevant articles, newspaper reports, and conference presentations. Only articles published in

9
peer-reviewed journals or academic news outlets (e.g. Chronicle of Higher Education) were
included in this review.
Criteria for Evaluating Textbooks
The literature revealed several key criteria by which textbooks are commonly evaluated.
These include (a) cost, (b) diversity, (c) content, (d) readability, (e) educational impact, (f)
pedagogical aids, and (g) interaction.
Cost. Many policy makers view cost as the most important criterion for selecting
textbooks (Watt, 2009). The literature suggests that this viewpoint is more common at the state
level than at the local level, but financial constraints almost certainly influence selection
committees in K-12 contexts. Cost does not seem to be as important a criterion to those who
select textbooks in higher education, as only a few studies have explored faculty perceptions of
textbook cost.
Ko (2010) reported results from his dissertation on the criteria and rationale that college
English faculty in Taiwan use to select textbooks. Ko’s study identified 15 main criteria
important to these faculty, including cost-effectiveness. This criterion was not among the top five
most important identified, however, falling behind level, learners' needs, authenticity, ancillary
materials, and communicative ability.
In another study, Petrides, Jimes, Middleton-Detzner, Walling, and Weiss (2011) used
survey data to show that cost was a significant factor in faculty decisions to select open
textbooks for their students, even though such adoption meant more work for the faculty. Other
criteria important to these educators in selecting open textbooks included dependable quality and
ease of use.

10
Most recently, Silver, Stevens, and Clow (2012) reported the results of a survey of 264
marketing professors from universities across the United States. On the survey, faculty were
asked to rank a set of five textbook selection criteria on a scale of 1 (most important) to 5 (least
important). Cost received an average ranking of 3.07 (SD 1.030), somewhat higher than edition
of the text (3.77, 0.921) and slightly lower than ancillary materials (3.00, 1.232). The most
important selection criterion of the five presented to these faculty was content coverage (1.28,
0.654).
The results from these few studies indicate that cost is something that college faculty
consider when selecting textbooks, but that it generally isn’t the most important criterion. At the
same time, the Petrides et al. (2012) study raises the interesting question of whether faculty who
opt to use open textbooks place greater importance on cost than those who don’t use open
textbooks. More research is needed to answer this question.
Sensitivity to diversity. Another criterion for textbook selection mentioned in the
literature is sensitivity to diverse cultures and viewpoints (Cruz, 2002; Etlin; 1994; Fiore &
Cook, 1994; Griggs, Jackson, Christopher, & Marek, 1999; Thomas, 1990). Cruz (2002), for
example, conducted an ethnic analysis of popular American History textbooks to understand how
Latinos and Latin Americans are portrayed to students. This study revealed “that school history
textbooks tend to portray Latin Americans as alternately violent, passive, lazy and unwilling to
assimilate into mainstream US society — when they are included at all” (p. 1). Cruz argued for
more analyses like hers and for greater consideration of cultural diversity in textbook selection
decisions.

11
Similarly, Etlin (1994) discussed efforts made by the National Education Association
(NEA) to promote greater representation of students’ cultural and ethnic diversity in textbooks
nationwide. Indeed, diversity ranks high on the NEA’s list of textbook selection criteria. While it
seems that few would argue that diversity is an unimportant criterion in textbook selection, I
found no studies in higher education that show faculty considering it in their decisions.
Content. Results from the survey of marketing professors by Silver et al. (2012)
discussed previously highlight the importance of content as a textbook selection criterion. Many
other authors have also addressed the consideration of content in both K-12 and higher education
selection decisions (Armstrong & Bray, 1986; Falduto, 2009; Griggs & Koenig, 2001; Meyer,
1988; Quereshi & Sackett, 1977; Rose & Lessen, 1980; Suh, 1970).
Meyer (1988) conducted an analysis of several science textbooks written for elementary
school students, and focused primarily on comparing the content coverage of the books as a
measure of their acceptability for use. Results from this study indicated that elementary science
textbooks varied widely in the content they covered, as well as in how this information was
presented. Meyer argued that because of these differences, content should be a key consideration
in the textbook selection process.
In a higher education study, Griggs and Koenig (2001) compared 15 psychology
textbooks in terms of content, length, and pedagogical aids. They found considerable variability
in the texts, especially in the content focus of each book. While such variability is often viewed
as problematic in the K-12 setting, these authors believed that such differences actually serve to
“accommodate teachers’ preferences and needs” (p. 1). It is interesting to note that students’

12
“preferences and needs” were not included in the discussion, but seemed to be subsumed within
faculty preference.
In addition to content coverage, one study looked at content accuracy as a textbook
selection criterion (Steuer & Ham, 2008). These authors contended that content accuracy is
difficult and time-consuming to evaluate because it requires high-levels of expertise and
thorough reading. To address this concern, they described a technique for efficiently evaluating
the accuracy of textbook content by random sampling of textbook chapters, followed by random
sampling of passages under second-level headings within selected chapters. These passages can
then be thoroughly examined by experts and evaluated for accuracy. Steuer and Ham also
described the results of using their technique to analyze a number psychology textbooks. In their
study, they isolated an average of nine passages per textbook and found numerous errors in the
content. This study underscores the importance of considering content accuracy in addition to
content coverage, but also provides an efficient way to do so.
Readability. A large number of textbook evaluation studies have focused on readability
issues (Gillen, 1973; Hartley, Sotto, & Fox, 2004; Jones & Evanciew, 1995; Landrigan &
Palladino 1974; Maddux & Candler; 1990; Meyer, 2003; Quereshi & Buchoski, 1979; Reitenour,
1984; Rose & Lessen, 1980; Spinks & Wells, 1993; Strunk, 1957). This criterion is so often used
and promoted that textbook evaluators employ scales to objectively measure it (see Flesch,
1948). A few example studies highlight this point.
Hartley, Sotto, and Fox (2004) used a computer-based readability scale to compare
textbooks from multiple genres, including the sciences, social sciences, and arts and humanities.

13
They found that scientific textbooks had higher readability scores because they used shorter
sentences and clearer, descriptive prose.
Jones and Evanciew (1995) used a variety of readability measures to compare the 15
most commonly used technology education textbooks in high school and college classrooms. In
addition to readability, the authors also examined human interest and writing style and ranked
the books according to their scores on all three factors. They found that all of the readability
formulas provided roughly equivalent estimates and could be used interchangeably.
While most authors argue that readability is important to consider when selecting a
textbook, some believe that there are pitfalls to relying too exclusively on such measures because
they can negatively affect overall textbook quality (Armbruster et al. 1985). The debate
continues over how much emphasis selection committees should give to readability scores
(Cunningham, 1984; Gunning, 2003).
Educational impact. Some researchers have focused their attention on exploring how
textbooks impact learning (Durwin & Sherman, 2008; Davis, 2009; Meredith, 1980; Petrides et
al., 2011; Reys, Reys, & Chavez, 2004; Spinks & Wells, 1993; Terwiliger, 1989). These studies
have explored a wide range of outcomes including knowledge, comprehension, motivation,
learning behaviors, collaboration, grades, and assessment performance.
Durwin and Sherman (2008) compared the impact of two competing physics textbooks
on student comprehension. In this study, the authors recruited 48 students enrolled in their
introductory physics courses and assigned them to use one or the other textbook. They then
constructed comprehension tests based on randomly sampled passages from the respective

14
books. Results from the tests showed that students exhibited no significant differences in
comprehension levels depending on which textbook they used.
Another recent study focused on the impact of two different mathematics textbooks on
pre-service teacher knowledge (Davis, 2009). Here, students were given a pretest and a posttest
that covered both content and pedagogical knowledge. The author reported that teachers who
used one text experienced increased content knowledge, while students using the other textbook
gained more pedagogical knowledge.
Pedagogical aids. A number of authors have explored pedagogical aids (e.g. illustrations,
online tools, glossaries) as a criterion for textbook selection (Griggs, Bujak-Johnson, Proctor,
2004; Honeycutt, 2007; Jackson, Lugo, & Griggs, 2001; Weiten, Deguara, Rehmke, & Sewell,
1999; Yasar & Seremet, 2007). In one example, Griggs et al. (2004) conducted a thorough
analysis of the glossaries of 44 introductory psychology textbooks. In this study, the authors
were interested in evaluating common core vocabulary used across the books, as well as the size
and uniqueness of the glossaries. They found very little commonality among the glossaries,
including a total of 6,269 unique terms. Most striking, the authors reported that only 14 terms
showed up in all 44 glossaries. This study is an example of how analysis of pedagogical aids can
provide information for comparing textbooks and making selection decisions based on selection
committee preferences.
Interaction. Research regarding the theory of generative learning also has some
application to evaluation of instructional materials. The generative learning theory relates to the
idea that learners actively participate in the learning process and work to construct meaningful
understandings of the information in their environment (Wittrock, 1974). This position is based

15
on the assumption that the design of instructional materials, including textbooks, can affect
learning if such materials are designed to promote mental engagement and deep interaction with
the ideas presented (Grabowski, 2004). Specifically, textbooks that (a) provide objects and
adjunct questions (Wittrock, 1989), (b) include interpretation of the importance of the topics
selected (Grabowski, 2004), (c) present problems, mysteries, inconsistencies, suspense, and
enigmas (Grabowski, 2004), and (d) direct students’ voluntary attention to engagement
(Kourilsky & Wittrock, 1992) are predicted to have a greater effect on student learning than
textbooks that do not include these design elements.
Criteria Imposed on Students for Evaluating Textbooks
A few published studies have examined the textbook evaluation from the student
perspective. By far, the most common criterion students have been asked to consider in
evaluating their textbooks is readability. All of the studies cited and described above on this
topic, of necessity, use student ratings to calculate traditional readability indices. However, given
the objective nature of this criterion and its previous discussion, no more will be said about it
here.
Human interest. Many of the readability studies described in the literature also include a
measure of human interest (Croll & Moskaluk, 1977; Gillen, 1973; Gillen, Kendall, & Finch,
1977; Jones & Evanciew, 1995; Klein, Bryant, & Zillman, 1982; Maddux & Candler, 1987;
Maddux & Candler, 1990; Maddux, Irons, Candler, & Irons, 1983; Quereshi & Buchkoski,
1979). This is the second most common criterion imposed on students, though it appears to have
gone out of vogue in recent years. The readability study by Jones & Evanciew (1995) described
above also included measures of human interest, and is the most recent study to have done so.

16
Despite the finding that readability is a useful criterion for evaluating a textbook, these authors
concluded that human interest scores are not a reliable measure of reading appeal for most
students. The only exception to this is for students who have low levels of motivation or subject
interest to begin with. Most of the other studies using measures of human interest do not question
their utility or relevance, but simply report scores and make textbook recommendations based, in
part, upon those scores.
Learnability. A small number of authors have discussed the concept of learnability
(Britton, Van Dusen, Gülgöz, Glynn, & Sharp, 1991; Klein et al., 1982; Muther & Conrad, 1988;
Simpson, 1947). In these studies, learnability is operationalized as students’ perceptions of their
own content retention, but not on the depth or breadth of their understanding. Britton et al.
(1991) conducted research that explored learnability by measuring the accuracy of students’
judgments about their own retention. The authors used 20 pairs of textbook passages, with each
pair consisting of an original version and a re-written version of the passage. Empirical data
about which version was retained better allowed the authors to measure the accuracy of student
judgments. Results showed that 95 percent of students in the study were accurate in their
judgments. The authors then used this result as evidence to claim that learnability should be used
in textbook selection decisions.
Pedagogical aids. A few studies have explored student perceptions of the effectiveness
of pedagogical aids, though this literature is quite sparse (Altman, Ericksen, & Pena-shaff, 2001;
Sellnow, Child, & Ahlfeldt, 2005; Weiten et al. 1999). Sellnow et al. (2005) conducted one of
the only studies to date that focused exclusively students’ feedback about the use of pedagogical
aids, specifically supplements like self-guided quizzes and internet activities. In this study,
students in a public speaking course were asked about their perceptions of the technology

17
supplements that accompanied their textbook. The authors reported that these kinds of
pedagogical aids were perceived as most useful to students when the aids were required, related
directly to course objectives, and functioned properly.
Other criteria. A handful of additional criteria imposed on students are mentioned in the
literature, but only once or twice. These include text format (Kelley, Warburton, 2011), usability
(Berry, Cook, Hill, & Stevens, 2010; Weisberg, 2011), content coverage (Altman et al., 2001;
Besser & Stone, 1999), overall value (Baker-Eveleth et al., 2011), and importance as a
pedagogical tool (Hewinson, 2007). Given the isolated nature of these studies, no more will be
said about these criteria in this review.
Criteria for Evaluating Digital Textbooks
The recent proliferation of digital and open textbooks has not led to a similar rise in the
number of studies that have examined or discussed criteria for choosing among such texts. Of
course, most of the criteria mentioned above also apply to digital texts. However, the only unique
factor mentioned in the few studies on digital textbook evaluation related to whether students
preferred print or digital versions (Baker-Eveleth et al., 2011; Kelley & Warburton, 2011;
Petrides et al. 2011; Pomper, 2008; Weisberg, 2011; Woody, Daniel, & Baker, 2010; Young,
2009). The answer to this question is inconclusive. In some cases, most students preferred digital
versions. In others, most students preferred print versions. For now, the only answer that can be
given about student preference for digital books is that it depends on the context and the
students, and perhaps on how teachers use the textbooks.
Still, none of these studies addressed other criteria that might be important for evaluating
digital textbooks that don’t apply to print versions, including navigability, accessibility, or

18
enhanced graphics. Indeed, much work remains in order to understand the most relevant criteria
for evaluating digital textbooks. This knowledge would be useful in choosing among digital
textbooks in general, and would also assist those using digital open textbooks in their
development decisions. The study described in this dissertation is an attempt to clarify some of
the criteria for evaluating digital textbooks through the development and empirical validation a
model of digital textbook quality from the perspective of college students.

19
Chapter 3
Method
Both qualitative and quantitative methods were used to develop and evaluate a model of
digital textbook quality from the perspective of college students. In this chapter, the study
context is described first, followed by the qualitative approach used to identify the desired
characteristics of a high quality digital textbook. The quantitative approach used to develop a
conceptual model of digital textbook quality and empirically evaluate this proposed model is
described last.
Study Context
Student data for this study were collected from students in Project Kaleidoscope
(http://www.project-kaleidoscope.org), a privately funded initiative that brings together eight
community colleges to create course designs using open digital textbooks. Project partners
include five colleges in California, one college in Nebraska, and two colleges in New York.
These partner institutions collectively serve over 100,000 students per year. During the 2012
Spring Semester, 80 faculty across 31 subjects used Project Kaleidoscope open digital textbooks.
Over half of these faculty were also involved in the development of the textbooks. These core
project faculty teamed-up across the colleges to identify and evaluate existing OER for
incorporation in the Kaleidoscope course designs and texts. The emphasis on open resources in
Project Kaleidoscope is driven by two project objectives: (a) eliminating textbook costs as an
obstacle to the success of low-income students, and (b) allowing faculty greater flexibility in
sharing and improving the course resources.
20
A pilot study was conducted during the Fall 2011 semester that included a questionnaire
completed by about 130 community college students who were using digital open textbooks as
part of Project Kaleidoscope (Bliss et al., 2012). Most of these students indicated a preference for
online textbooks. A handful of themes also emerged from student responses to the question
“Overall, what did you think of the [online] textbook used in your course?” These themes
included aspects of how the material was presented (readability, organization, clarity, concision,
engagement), accessibility, content (informative, useful, effective), and cost. These preliminary
results were used as a springboard into a more in-depth qualitative and quantitative exploration
of student perspectives of digital textbooks.
Qualitative Method
Questionnaires, interviews, and published journal articles were used to identify desired
characteristics of digital textbooks from the perspective of college students.
Sample. Community college students enrolled in Project Kaleidoscope courses during
the Spring 2012 term were sampled for this study, and 365 of these students completed the
questionnaire items. Students from each of the eight PK partner institutions responded to the
questionnaire in variable proportions (Table 1), but these proportions were representative of the
differential participation in the PK initiative in general. That is, most students who responded to
the questionnaire were enrolled at Cerritos College, and this college had the largest number of
PK participants and courses to begin with. A subsample of 10 students from the sample of 365
participated in the interviews. Interviewees self-selected into the study by indicating a
willingness to be interviewed when they completed the questionnaire.

21
Table 1 Sample Characteristics of the Qualitative Study Gender Institution Male Female Total Cerritos College 58 83 141 Chadron College 8 12 20 Mercy College 21 41 62 Palo Verde College 2 0 2 College of the Redwoods 29 40 69 Santa Ana College 17 19 36 Santiago Canyon College 13 13 26 Tompkins-Cortland College 1 8 9 Total 149 216 365
Questionnaires. The questionnaire consisted of several open-ended, constructed
response items that asked students about their perceptions of the textbooks they were using. The
exact number of respondents to each item on the questionnaire varied. This questionnaire was a
modified version of the pilot questionnaire, using pilot results to improve item wording and
focus. At least one additional item was included on the modified questionnaire where students
were asked about digital textbooks in general. Responses to the following two open-ended items
on the modified questionnaire were used in this study:
From your perspective, what are the characteristics of a high quality digital textbook?
Overall, what did you think of the digital textbook you used in your course?
Interviews. Students who completed the questionnaire were given an opportunity to
choose to be interviewed by phone or online chat about their perceptions of the quality of digital
textbooks. Eight students were interviewed by phone and two students were interviewed via
Google chat. One or two prompts that addressed student perceptions of digital textbook quality
were used in the interviews, but all interviews followed an unstructured format to allow students

22
and myself more freedom to explore student perceptions as they arose. Each interview lasted
from 15-30 minutes and attempted to engage the students in a discussion about what made digital
textbooks useful and interesting to them. Interviewing allowed for a much deeper exploration of
students’ perceptions of textbook quality than could be obtained by questionnaire alone. For
example, conducting interviews with students allowed for focused, clarifying discussions on the
most-often mentioned characteristics of digital textbooks in the questionnaire responses.
While it is customary in qualitative studies to conduct interviews first to identify issues
and concerns in depth and then use questionnaires to assess the breadth and pervasiveness of the
interview findings, this study was constrained by access to the college student population. The
opportunity to administer questionnaires arose first and led directly to an opportunity to recruit
students to be interviewed. Hence, in this study, the questionnaires were used to identify broad
issues and the interviews were used to explore some of those issues in more depth.
Literature survey. In addition to the questionnaire and interviews, the literature on
textbook evaluation was also surveyed, with specific focus on student perceptions of textbooks.
The literature review in Chapter 2 of this dissertation is the result of this survey. The archival
data from the literature was valuable in framing the results that came from the student data
collected through interviews and questionnaires. Specifically, the results from the published
literature were compared with the themes and concerns expressed by the students. While not
much has been written about students’ perceptions of digital textbooks, beyond exploring their
preference for print versus digital formats, the literature related to students’ perceptions of
textbooks in general provides valuable insight to this study.

23
Data analysis. Data from the questionnaires, interviews, and the literature review were
explored using thematic analysis (Benner, 1985; Leininger, 1985; Taylor & Bogdan, 1984.) This
analysis occurred in seven main steps:
1. Preparation of the data for analysis by transcribing interview results, compiling
questionnaire results, and organizing summaries of relevant published articles.
2. Reading of the texts (questionnaire responses, interview transcripts, and literature
summaries) to note items of interest, get a sense of the data, and identify initial topics.
3. Sorting of the initial topics to identify and organize emergent themes relating to
similar topics.
4. Writing of provisional names and definitions for each theme.
5. Conducting of axial coding, which entails going back through the data a separate time
for each theme to further clarify thematic definitions in the context of the data and the
other themes.
6. Combination or disaggregation of themes as necessary.
7. Finalization of each theme by writing full descriptions and providing illustrations
using quotes from the data.
In this study, the finalized themes in Step 7 became the target constructs of the initial
measurement model of digital textbook quality from the perspective of college students.
Standards for qualitative studies. The qualitative portion of this study met many of the
standards for qualitative research, as defined by Williams (2013). In particular, a study designed
to explore student perceptions of digital textbook quality could potentially make a meaningful
contribution to the literature on textbook evaluation. It could also be useful for informing theory

24
that could then be used to develop a model of digital textbook quality and an instrument to
measure the components of this model. In addition, the study used several sources of data in an
effort to triangulate perceptions of textbook quality and improve study credibility. Finally, the
data collection and analysis procedures used in this study were appropriate to answer the
research question about what students perceive to be the desirable characteristics of a high
quality digital textbook. Any limitations to these procedures are discussed in detail in Chapter 5.
Quantitative Method
The themes derived from the qualitative analysis described above were used to generate a
model of digital textbook quality from the perspective of college students. Model development
and improvement occurred in three main steps:
1. Item writing
2. Conceptual model development
3. Model evaluation
Sample. Community college students enrolled in Project Kaleidoscope courses during
the Fall 2012 term were sampled for this study, and 235 students provided complete responses to
the measurement instrument described in a later section. Students from six of the eight PK
partner institutions responded to the instrument in variable proportions (Table 2). These
proportions were not representative of the differential participation in the PK initiative in
general. Rather, most responses came from two colleges, Cerritos and Santa Ana. This difference
was likely due to decreased research intensity on the part of Project Kaleidoscope researchers in
general during the Fall 2012 semester. However, the variety of courses and textbooks among the

25
participating PK faculty was quite large at these two institutions, decreasing the potential for
problematic sampling bias.
Table 2 Sample Characteristics of the Quantitative Study Gender Institution Male Female Total Cerritos College 43 84 127 Chadron College 0 1 1 Mercy College 0 1 1 Palo Verde College 0 0 0 College of the Redwoods 0 0 0 Santa Ana College 52 49 101 Santiago Canyon College 0 1 1 Tompkins-Cortland College 1 3 4 Total 96 139 235
Item writing. For each theme derived from the qualitative data, several questionnaire
items were written to measure student perceptions of their open digital textbooks. A total of 44
items were constructed, with an average of 5.5 items per theme. Experienced measurement
specialists reviewed all items as a check on general item quality and revisions were made as
necessary. In addition, cognitive interviewing (Willis, 2005) was conducted with five college
students who were using digital textbooks in a current course, but who were not part of the
Project Kaleidoscope sample.
Cognitive interviews were conducted for the purpose of improving the questionnaire by
elucidating the mental process students used to answer each item. Students were asked to read
each item aloud and then describe the thought process they used as they attempted to answer
each item. Several minor revisions to the items, including some revisions to item ordering, were
made based on results from the cognitive interviews.
26
Conceptual model development. The final themes and items were used to posit two
initial hypotheses about the structure of the measurement model of student perceptions of digital
textbook quality. The first hypothesis ignored any potential relationships among the themes
themselves and consisted of a first-order factor structure including eight separate factors (Figure
1). The second hypothesis posited potential relationships among the themes and consisted of a
more complex second-order structure to explain these relationships (Figure 2). In each case, path
diagrams are presented in Figures 1 and 2 to portray mathematical models that depict the
hypothesized conceptual models. In both diagrams, ovals represent the themes as latent factors,
rectangles represent the questionnaire items as manifest variables of the corresponding latent
factor, single-headed arrows between the factors and the variables (or between higher- and
lower-order factors) represent the pattern of item-factor or factor-factor relationships (known as
factor loadings), and double-headed arrows between factors represent factor covariances.
Residual variance, or error, is symbolized by circles and single-headed arrows between the
circles and the manifest variables.
The main advantage of representing conceptual models in a path diagram is that factor
analytic procedures, especially confirmatory factor analysis (CFA), can be used to empirically
explore the relationships between factors and variables, as well as compare and evaluate model
variations (Brown, 2006). CFA is the measurement portion of structural equation modeling and
is the main quantitative method used in this study.
Item Analysis. In order to evaluate the hypothesized conceptual models using CFA,
responses to the questionnaire items were first obtained from college students who were using a
digital textbook in one of their current courses. The 44 items were compiled into a single online
instrument (Appendix A) and an email with a link to the questionnaire was sent to all faculty

27
Figure 1. A first-order path diagram representing mathematical relationships between the eight
major themes (ovals) and the 44 questionnaire items (rectangles). Single-headed arrows between
the themes (or factors) and items represent the pattern of item-factor relationships. Double-
headed arrows between factors represent factor covariances. Circles represent residual errors.
NAV=navigation, ACC=access, PERF=performance, INT=interaction, REL=relevance,
PRES=presentation, IMP=impact, and DIV=diversity.

28
Figure 2. A second-order path diagram representing mathematical relationships between the
eight major themes (ovals), the 44 questionnaire items (rectangles) and two higher-order factors
(central ovals). Single-headed arrows between the factors and items and between the higher- and
lower-order factors represent the pattern of item-factor and factor-factor relationships,
respectively.

29
members participating in Project Kaleidoscope in Fall 2012. The email included a request for
faculty to pass the link on to their students, and students were offered a chance to win one of five
$25 gift certificates upon completion of the questionnaire. Follow-up emails were sent once a
week for three weeks, until the end of the semester.
The students’ responses to the 44 polytomous questionnaire items were initially analyzed
with the Graded Response Model (Samejima, 1969) in the Item Response Theory (IRT)
framework using the statistical software package IRTpro (Cai, Thissen, & du Toit, 2011). This
analysis was used to identify any poorly functioning items that may need to be removed prior to
evaluating the model using CFA. Three poorly functioning items were removed at this stage,
leaving a total of 41 items.
Twenty-two (53.7 percent) of the remaining 41 items in the questionnaire contained an
option allowing students to indicate that the issue referenced in the item did not apply to their
particular textbook or course (an option referred to hereafter as a “Does Not Apply”). For
example, Item 1 (“How useful to your learning is the search function in your digital textbook?”)
contained the option “There is no search function.” A similar “Does Not Apply” option was
included with each item that referred to aspects of a textbook (page numbers, interactive quizzes,
search functions, etc.) or course (exams, assignments, lectures, etc.) that could possibly be
absent. In general, the “Does Not Apply” option was used in hopes that including this option
would reduce student frustration in being expected to respond to items when such aspects were
absent from their books or courses. Decreasing student frustration was seen as vital to improving
the completion rate of the fairly lengthy questionnaire.
30
The issue of how to code responses in the “Does Not Apply” category is an important
question that has received some attention in the literature. Several different approaches have
been recommended for treating “Does Not Apply” responses when analyzing data. First, such
responses could be treated as meaningful within the context of the continuum defined by the
ordered response categories associated with an item, either as an extreme value on that
continuum or as a value equivalent to the next most extreme value (Pruchno, Kleban, & Resch,
1988). For example, the option “There is no search function” on Item 1 in my questionnaire
could be interpreted as the most extreme negative indicator of textbook quality in the context of
the item’s other options. On the other hand, the option could be collapsed into the next most
extreme option (“Not at all useful”), indicating that an endorsement of “There is no search
function” is essentially equivalent to an endorsement of “Not at all useful.” Use of this first
approach requires strong substantive justification for a meaningful interpretation of the “Does
Not Apply” option.
A second approach is to simply delete all cases who endorsed the “Does Not Apply”
option in a listwise fashion (Helmes & Campbell, 2010). Listwise deletion involves completely
removing any student from the analysis who selected “Does Not Apply” for one or more items.
This option is the least desirable, however, as it often reduces the sample size substantially and
has the potential to introduce systematic bias into the dataset.
A third approach is to treat responses in the “Does Not Apply” category as missing data,
indicating that such responses are not interpretable within the scale (Wolfe, 2010). Treating
responses in the “Does Not Apply” category as missing data requires pairwise deletion of student
responses. Pairwise deletion involves removing a student’s responses to any items on which he
endorsed the “Does Not Apply” option, but retaining that student’s responses to all other items.

31
If the percentage of “Does Not Apply” endorsements is relatively small within the dataset, this
option avoids the sample size reduction and potential for bias introduced by listwise deletion.
The missing data approach requires substantive justification that the “Does Not Apply” option
possesses little interpretability within the continuum of the scale for a particular item.
A fourth option for handling the “Does Not Apply” option is to analyze the data using
two-part growth modeling (Muthen & Asparouhov, 2002). This approach involves creating a
second binary item for each item containing a “Does Not Apply” option. For each case in the
data, these secondary items are scored “0” if the subject endorsed the “Does Not Apply” option
and “1” if the subject endorsed any other option. All items (primary and secondary) are included
in the subsequent item analysis. While more informative than the other approaches, the two-part
growth modeling approach is somewhat limited in that it requires continuous data, maximum
likelihood estimation, and a larger sample size.
A fifth and final approach is to use IRT analysis to evaluate how the “Does Not Apply”
option actually functions within each item (Helmes & Campbell, 2010). If clear results are
obtained, this information can potentially be useful in interpreting the meaning of such an
endorsement.
In this study, the “Does Not Apply” option was handled using a combination of three of
the approaches described above. For 19 (46 percent) of the 41 remaining items, the “Does Not
Apply” option was recoded to have a numerical value equal to the next most extreme value. In
each of the items handled this way (e.g., Item 1 described above), the “Does Not Apply” option
indicated that a feature was absent from the textbook. In all of these cases, I argue that the
absence of the function or feature in the textbook is an indicator of poor quality. However, it is

32
impossible to know whether the absence of the feature indicates any poorer quality than non-
usefulness of a present feature, justifying the use of this recoding approach. IRT analysis was
then used to empirically evaluate the substantive decisions to combine the “Does Not Apply”
categories with the next-most extreme category for these items. In no case did the IRT results
indicate that the “Does Not Apply” option was located at a more extreme location than the next
most extreme category. This result supports the decision to collapse the two categories into one.
For 3 of the 41 items (7 percent), the “Does Not Apply” option indicated that some aspect
of the course was not present (like assignments, lectures, or exams). Since presence or absence of
course features is not directly related to textbook quality, “Does Not Apply” endorsements for
these items were treated as missing data.
The two-part growth modeling approach was not used to handle the “Does Not Apply”
issue because the data in my study are categorical and thus violate the assumptions of maximum
likelihood estimation. In addition, increasing the number of items by nearly 50 percent would
lead to a significantly more complex model and substantially decreased power.
Confirmatory factor analysis (CFA). The recoded dataset was analyzed using CFA in
the statistical software program Mplus (Muthen & Muthen, 1998-2001). Specifically, CFA was
used to evaluate the proposed hypothetical models of digital open textbook quality. The purpose
of this evaluation was to (a) determine the best first-order model in terms of interpretability, fit,
and parsimony, and (b) acquire evidence for or against using a higher-order model to explain any
significant relationships among the lower-order factors. The initial conceptual first-order model
is depicted in Figure 1. This model contains eight factors, with several items loading on each

33
factor in a congeneric structure (no items load on more than one factor). Figure 2 depicts a
higher-order model, with the eight first-order factors loading on two second-order factors.
CFA requires estimation of multiple parameters. Because the item response data in this
study are categorical, they violate the assumption of multivariate normality necessary to justify
using maximum likelihood estimation. Hence, the nonparametric robust Weighted Least Squares
(WSLMV) estimator was used instead. The most common nonparametric estimator for
categorical data is Weighted Least Squares (WLS). However, WLSMV has two advantages over
WLS. First, WLSMV is more robust to small sample sizes than WLS. Preliminary research has
shown that accurate test statistics and parameter estimates can be obtained in samples ranging
from 100 - 1000 and under various levels of model complexity (Flora & Curran, 2004). Second,
WLSMV places fewer restrictions on how matrices are treated in the estimation process (Brown,
2006). In particular, WLSMV estimation does not require the initial variance-covariance matrix
to be positive definite, increasing the likelihood of model convergence when sample sizes are
small.
CFA results include estimates for a variety of model parameters including estimates of
factor loadings for each item and covariances between factors. Importantly, CFA provides an
standard error for each parameter estimate, allowing for tests of significance. In addition, CFA
provides several estimates of global and local fit which indicate how well the data fit the
specified model. Finally, CFA provides modification indices which indicate how much the
model-data fit is predicted to improve if specified modifications are made to the model. Taken
together, the standard errors, fit statistics, and modifications indices allow for a comprehensive
evaluation of the model and provide a basis for making informed decisions about how the model
might be improved.
34
First-order confirmatory factor analysis. In this study, standard errors, fit statistics, and
modification indices were used together to make adjustments and improvements to the proposed
first-order model, in an iterative fashion. The χ2 Difference Test (DIFFTEST) in Mplus was used
to make statistical comparisons between nested models, and the substantive interpretability of
each modification was also considered. The χ2 Difference Test provides a χ2 value and a p-value
for each model comparison. A significant χ2 value indicates that the less restrictive model has
better fit.
Second-order confirmatory factor analysis. The best first-order model in terms of
interpretability, fit, and parsimony was used as the basis for evaluating the a priori second-order
model. This evaluation occurred in two separate, but related stages. The first stage involved
imposing the proposed second-order structure on the improved first-order model as shown in
Figure 2. The second stage involved the use of exploratory factor analysis (EFA) in the
confirmatory framework (E/CFA). EFA involves conducting a factor analysis where no a priori
model is specified, all possible parameters are estimated, and no standard errors or modification
indices are calculated. In a first-order model, EFA produces an estimated factor loading for every
item on every extracted factor. In a higher-order model, EFA produces a loading estimate for
every first-order factor on every second-order factor extracted, in addition to the first-order item-
factor loadings.
Second-order exploratory factor analysis in the confirmatory framework (E/CFA). In
this study, an EFA using the correlations among the first-order factors from the improved first-
order model was also used to establish the number and composition of salient second-order
factors present in the data and to inform the structure to be specified in a subsequent second-
order CFA. The second-order EFA in this study was conducted using the FACTOR procedure in

35
SPSS Version 21.0 (IBM Corp., 2012), with Principal Axis Factoring as the extraction method
and Promax as the rotation method. Parallel analysis (Hayton, Allen, & Scarpello, 2004) was
used to determine the number of salient second-order factors to retain. Parallel analysis uses a
simulation procedure to generate many sets of random eigenvalues based on the sample size and
number of variables in the dataset to be compared. The mean or 95th percentile of these sets of
simulated eigenvalues can then be used in a comparative fashion to determine how many of the
eigenvalues in the EFA results are larger than would be predicted by chance. The number of
higher eigenvalues is equal to the number of salient factors.
Once the number and composition of the salient factors was determined, a subsequent
second-order CFA based on the EFA results was conducted in Mplus. A similar E/CFA approach
was attempted for the first-order model, but the interpretability of the resulting EFA structures
was low, favoring the direct CFA approach described previously.
Finally, the reliabilities of the subscales (factors) of the best-fitting model were calculated
using the procedure developed by Raykov (1997). This CFA-based approach to estimating
reliability uses factor loadings and error variances to estimate the true-score variance and error
variance. Raykov claims his coefficient provides a more accurate estimate of true reliability than
Cronbach’s alpha. Results from all analyses described in this chapter are described in the next
chapter.

36
Chapter 4
Results
In this chapter, results from the qualitative analysis used to identify the desired
characteristics of a high quality digital textbook are described first, followed by results from the
subsequent quantitative analysis used to develop and evaluate a model of digital textbook quality
based on the identified characteristics.
Themes Derived from Qualitative Analysis
Thematic analysis of student responses to the questionnaire and the interviews, as well as
the literature review, revealed eight major themes related to the quality of open digital textbooks
from the perspective of college students. These themes included (a) navigation features, (b)
access features, (c) technical performance, (d) relevance, (e) interaction characteristics, (f)
presentation characteristics, (g) impact, and (h) sensitivity to cultural diversity. In this section,
each theme is defined in some detail and then exemplified with several direct quotations from
students and/or summaries of the literature.
Navigation features. This theme relates to characteristics of a digital textbook that assist
or facilitate students in their attempts to maneuver through the text or to locate specific
components in the text. Students indicated that they prefer a digital search functionality,
especially one that is specific, simple, fast, easy to use, and has an option for advanced
searching. Students also indicated that high quality digital textbooks should have page numbers,
internal linking (i.e. between chapters), and bookmarking that allows students to pick up reading
where they left off. Below are several student comments related to the theme of navigation
within the context of an open digital textbook.

37
“Rather than flipping through each page, page by page by page, you can just search
straight to what you’re looking for and it just saves a lot of time when you’re trying to study the
night before a test or something.”
“[I like being] able to search for specific words and concepts.“
“Being able to search the document is a characteristic that puts the digital format above
the written format.”
“I also feel that the page number being on the textbook [sic] are important.”
“[I need] something where I can bookmark where I left off. That’s kind of like a key.
You have to remember where you leave off.”
Access features. This theme relates to how students retrieve and read a digital textbook.
Students identified four main aspects of access that are important to them in a high quality digital
textbook: (a) options, (b) mobility, (c) convenience, and (d) longevity. First, students desired
multiple options for accessing their texts, including the right to (a) print the book (in part or in
whole), (b) download an electronic copy of the book, (c) buy a printed copy of the book, or (d)
listen to the book in audio format. Second, students desired increased mobility through the right
to access the book on multiple devices, especially on e-readers that can reduce screen fatigue.
Third, students mentioned the convenience of “anytime, anywhere” access to their digital
textbooks, made possible by download capability or online hosting. Finally, students desired the
right to access the book even after the course had concluded. Below are several student
comments related to the theme of access.

38
“The best thing I’ve liked is the availability. I can, if I’m at a computer, I can get it really
quick. I can pull up the chapter or the page or whatever I need to reference. That’s great. That’s
like the greatest thing about it.”
“The only thing I guess I could ask for is maybe that whole textbook be downloadable to
a PDF file or something like that. That way you could perhaps put it on a mobile device or
something…If it was downloadable to a PDF it would make it easier to print, it would make it
easier for a lot more other mediums, of ways of using or reading the book.”
“[I want] a book that can be accessed in any device and that has printable pages”
“[A high quality digital textbook] should be accessible anywhere- just as long as you
have a computer.”
“[I want to be able] to purchase printed chapters.”
Technical performance. This theme relates to the technical functioning of the digital
textbook itself, including technical problems that might hinder access and usability. Students
mentioned that high quality digital textbooks should have minimal technological problems. They
also desired that such books be (a) easy to find and log in to, (b) be compatible with many
different web browsers and device operating systems, and (c) have fast download and upload
speeds. In short, students believe that the technology of the textbook should enhance, not hinder,
learning from a digital textbook. Below are several student comments related to the theme of
performance.
“[A high quality digital textbook] should function well in any browser. “
“[A high quality digital textbook] should be easy to log into and find.”

39
“[A high quality digital textbook] doesn’t have any problems (downloading, uploading
pages, etc.).”
“[There should be] no lagging when I access the book.”
“[A high quality digital textbook] has no bug problems.”
“The pages [should] load quickly.”
“The only things that I would come across would be every so often I would get an error
page saying that whole system was down…it only took about 30 minutes for it to come back up.
But it was kind of nerve racking [sic] for those 30 minutes.“
“[The digital textbook] must not consume too much memory and CPU resources to
render a page.”
Relevance. This theme relates to how current the content of a digital textbook is and how
well the content aligns with what is being taught in the course by the instructor. Students
indicated that high quality digital textbooks are clear, up-to-date, and contain no superfluous
pages or content. Students also recognized the value of an instructor being able to customize and
update the textbook. Below are several student comments related to the theme of relevance.
“If any information is more current, [then the teacher] can add to it or if anything needs to
be updated.”
“[A high quality digital textbook] flows well with what the instructor teaches in class as
well as the way he or she teaches.”
“[A high quality digital] textbook is relevant.”
40
“[A high quality digital textbook] should have all of the same information as what you
are learning in class.”
“The book that I used that had the online version, everything corresponded with the
chapters and we used the whole book versus, like, some classes where you get a book you only
use like maybe half it. So you waste the money on buying the whole book…[My professor]
integrated it perfectly so each chapter in that topic reflected what we were learning that lesson.”
“At the end of the chapters you would get a lot more up-to-date websites, more up-to-date
references and stuff like that, which allowed me, as a student, to have better and more reliable
resources, which I thought was great.”
“Up-to-date and relevant information is the most important aspect of the
textbook…There have been classes that I’ve been in where you look and the book was published
like eight or ten years ago. And, with this digital book, it’s a lot easier to not have to be forced to
have a book that’s been out for ten years.”
“All the chapters did have to do with what we were doing. Usually when I have a class
with a textbook, we’ll be skipping over this or that, or my teacher will be teaching it in a really
different way than the textbook.”
Interaction characteristics. This theme relates to how technology interfaces with the
content of a digital textbook. Students mentioned that high quality digital textbooks should allow
for on-screen highlighting and note-taking to enhance studying. They also cited embedded
supplementary material, including links to external content, videos, and tutorials, as important
features. Finally, students indicated that responsive quizzing with instant, directed feedback and

41
hints would improve the quality of their experience with digital textbooks. Below are several
student comments related to the theme of interaction.
“Students need to be able to take notes on the readings and make highlights if needed.”
“Interactive tutorials would be a major benefit [to a digital textbook]”
“Web links to current statistics (i.e. Department of Labor stats, unemployment stats) and
an interactive way to answer end of chapter review questions [are important characteristics of a
high quality digital textbook].”
“The material combines both video and textual content – [the textbook] should take
advantage of the technology.”
“Like the questions at the end of a chapter, maybe like in the summary, if somehow there
was a way to answer it and if you don’t get the answer it kind of directs you where you can find
it.”
“I love that [my digital textbook] has the videos on there, like links, like it shows little
videos and when it talks about a subject and then it says, ‘Well this would happen in the news.’
And then they show the clip, like a YouTube clip or whatever video and it has more links. Yeah,
that is really, it’s like, like Harry Potter, you know…it just starts coming on and people are
talking to you…right there it just does it for you, the link, so you can watch videos pertaining to
the subject or to the chapter.”
Presentation characteristics. This theme relates to how the content of the textbook is
organized and displayed to the reader. Students mentioned that high quality digital textbooks are
clear, easy to read and use, understandable, well-written, and well-organized. Students desired

42
content that was comprehensive, informative, and detailed. Students also mentioned that high
quality digital textbooks should include definitions of key words, extended glossaries, summary
sections, study guide sections, and appropriate examples. Finally, students mentioned that high
quality visual aids are an important component of digital textbooks. Below are several student
comments related to the theme of presentation.
“[A high quality digital textbook] should have a lot of examples of all the different types
of problems, not just easy ones.”
“A quality digital text book has to do with the material.”
“[A high quality digital textbook] has all of the information you need to study and
complete required assignments for the course.”
“[A high quality digital textbook has] detailed content.”
“A characteristic of a high quality digital textbook is its presentation of information.”
“I want the option to make the fonts bigger.”
“[High quality digital textbooks have] Illustrations, good colorful graphics. Charts,
statistics that are easy to understand. Logical table of contents, extensive index.”
“[A high quality digital textbook has] large print for older students, easy to comprehend
language, organized in a way that addresses the needs of disabled students and assistance phone
numbers available for questions.”
“[A high quality digital textbook has] balance in length of sections.”

43
“[My digital textbook] wasn’t hard to get through. None of the material was difficult to
understand or you have to, like, go back and re-read things to try and understand them. So it was
very clear and concise.”
Educational impact. This theme relates to the perceived or real effects a digital textbook
has on learning, motivation, or behavior. One student discussed her own perception of the impact
of her digital textbook, stating that using a digital book seemed to improve her test scores and
comprehension. A number of studies in the literature have explored textbook learning impacts,
though none has focused exclusively on digital books. These studies indicate that learning can be
impacted by the textbook used and that students can perceive these impacts. Below are several
comments from students and the literature related to the theme of impact.
“When I started to use the digital books my test scores improved drastically. I have a
learning disability and it seemed like I was doing better in my grades reading the texts online
than in my [printed] books . . . It seemed like I comprehended the material better.”
Davis (2009) reported that teachers who used one text experienced increased content
knowledge, while students using another textbook gained more pedagogical knowledge. Other
researchers have focused their attention on exploring how textbooks impact learning (Davis,
2009; Durwin & Sherman, 2008; Meredith, 1980; Petrides et al., 2011; Reys, Reys, & Chavez,
2004; Spinks & Wells, 1993; Terwiliger, 1989). These studies have explored a wide range of
outcomes including knowledge, comprehension, motivation, learning behaviors, collaboration,
grades, and assessment performance.
A small number of authors have discussed the concept of learnability (Britton, Van
Dusen, Gülgöz, Glynn, & Sharp, 1991; Klein et al., 1982; Muther & Conrad, 1988; Simpson,
44
1947). In these studies, learnability is defined as students’ perceptions of their own content
retention. Britton et al. (1991) conducted research that explored learnability by measuring the
accuracy of students’ judgments about their own retention. The authors used 20 pairs of textbook
passages, with each pair consisting of an original version and a re-written version of the passage.
Empirical data about which version was retained better allowed the authors to measure the
accuracy of student judgments. Results showed that 95 percent of students in the study were
accurate in their judgments. The authors used this result as evidence to claim that learnability
should be used in textbook selection decisions.
Sensitivity to diversity. This theme relates to a textbook’s sensitivity to differences in
diverse cultures and viewpoints. No student mentioned diversity as an important theme to
consider in a high quality digital textbook, but some of the literature on textbook quality has
addressed this theme. These studies indicate that paying attention to diversity is important in
textbook development and selection, but that faculty in higher education generally do not
consider it. This theme was included in this study because it was anticipated that students would
be capable of providing a relevant and important perspective on this issue.
Two examples from the literature exemplify the theme of diversity. Cruz (2002)
conducted an ethnic analysis of popular American History textbooks to understand how Latinos
and Latin Americans are portrayed to students. This study revealed “that school history
textbooks tend to portray Latin Americans as alternately violent, passive, lazy and unwilling to
assimilate into mainstream US society — when they are included at all” (p. 1). Cruz argued for
more analyses like hers and for greater consideration of cultural diversity in textbook selection
decisions. Similarly, Etlin (1994) discussed efforts made by the National Education Association

45
(NEA) to promote greater representation of students’ cultural and ethnic diversity in textbooks
nationwide. Indeed, diversity ranks high on the NEA’s list of textbook selection criteria.
Quantitative Analysis
In this section, the results of the initial item analysis using IRT are presented first,
followed by the results of CFA of the first-order models and then the results of CFA and E/CFA
of the higher-order models.
Item analysis. Initial analysis of student responses to the 44 items on the questionnaire
using the Graded Response Model revealed three items with poorly functioning response
options: pf5, r2, and d1. While hypothesized to load on three separate factors, these three items
all shared the common feature of reverse ordering of the response options. In all other items,
option A was the most negative indicator of textbook quality and option D was the most positive
indicator. In the three items with poor functionality, option A was the most positive indicator and
option D was the most negative. Category probability curves for each of the three poorly
functioning items are shown in Figure 3. Category probability curves for three well-functioning
items are displayed in Figure 4. Each curve in these figures represents the probability of
endorsing a particular response option relative to a students’ perceptions of digital textbook
quality as operationalized by each theme. The flattened curves in Figure 3 indicate poorly
functioning items and justify removal of these items from further analyses.
Confirmatory factor analysis (CFA). The results of the first-order CFA, second-order
CFA, and second-order E/CFA are reported next, along with reliability estimates for each model.
First-order confirmatory factor analysis. The a priori first-order model (Figure 1)
postulates that each of the 41 items would load exclusively on its respective factor. CFA of the

46
A
B
C
Figure 3. Category probability curves for item pf5, item r2, and item d1.

47
A
B
C
Figure 4. Category probability curves for item a7, item pr3, and item ip4.

48
responses to the 41 items from the 235 students showed that this proposed first-order model
(Model 1) had fairly good fit (Table 3), but that this fit would be improved if item n6 were
allowed to freely load on the PERFORMANCE factor in addition to the NAVIGATION factor.
The modified model (Model 2) with n6 freely loading on PERFORMANCE had significantly
better fit than Model 1 (χ2 = 60.703, p < 0.001). However, in Model 2 the loading of item n6 on
the NAVIGATION factor was not significant (i.e. the factor accounted for less than 10 percent
of variance in the item), so the loading was constrained to zero in Model 3.
Pairwise comparisons of the models indicated that Model 3 was not significantly worse
than Model 2 (χ2 = 2.779, p = 0.094), but modification indices indicated that this fit could be
improved by allowing item pr6 to freely load on the INTERACTION factor in addition to the
PRESENTATION factor. The resulting modification (Model 4) had significantly better fit than
Model 3 (χ2 = 50.903, p < 0.001). However, in Model 4 the loading of item pr6 on the
PRESENTATION factor was low, so the loading was constrained to zero in Model 5. The
resulting fit of Model 5 was significantly better than Model 4 (χ2 = 12.649, p < .001).
Modification indices in Model 5 indicated that model fit could be significantly improved
by allowing item a1 to freely load on the PERFORMANCE factor in addition to the ACCESS
factor. The resulting modification (Model 6) had significantly better fit than Model 5 (χ2 =
45.936, p < 0.001). However, in Model 6 the loading of item a1 on the ACCESS factor was low,
so it was constrained to zero in Model 7. The resulting fit of Model 7 was significantly worse
than Model 6 (χ2 = 11.389, p < 0.001). However, modification indices in Model 7 indicated that
fit could be improved by allowing item a2 to freely load on the PERFORMANCE factor in
addition to the ACCESS factor. The resulting modification (Model 8) had significantly better fit
than Model 7 (χ2 = 32.869, p < .001). However, in Model 8, the loading of item a2 on the

49
Table 3
First-Order Model Fit and Comparative Statistics
Model Chi-squarea CFIb TLIc RMSEAd χ2 Difference
Teste Significancef
Model 1 395.764 .832 .946 .114 n/a n/a
Model 2 356.535 .854 .954 .106 60.703 < .001
Model 3 356.109 .854 .954 .106 2.799 .094
Model 4 324.913 .873 .960 .099 50.903 < .001
Model 5 330.768 .869 .959 .100 12.659 < .001
Model 6 309.874 .882 .963 .095 31.406 < .001
Model 7 306.857 .883 .963 .095 11.389 < .001
Model 8 281.485 .898 .968 .088 32.869 < .001
Model 9 287.746 .894 .967 .089 11.809 < .001
Model 10 293.969 .891 .966 .091 23.704g < .001 Note. aχ2 is a measure of absolute fit. bCFI is a measure of comparative fit with good fit indicated by values near .90. cTLI is a measure of comparative fit with good fit indicated by values above .90. dRMSEA is a measure of parsimony with good fit indicated by values below .10.e The χ2 Difference Test for a given model is in reference to the previous model (e.g. Model 2 vs. Model 1; Model 3 vs. Model 2, etc.). fP-values relate to the χ2 Difference Test .gModel 10 vs. Model 8. The Degrees of Freedom for each difference test was equal to 1 in all cases.
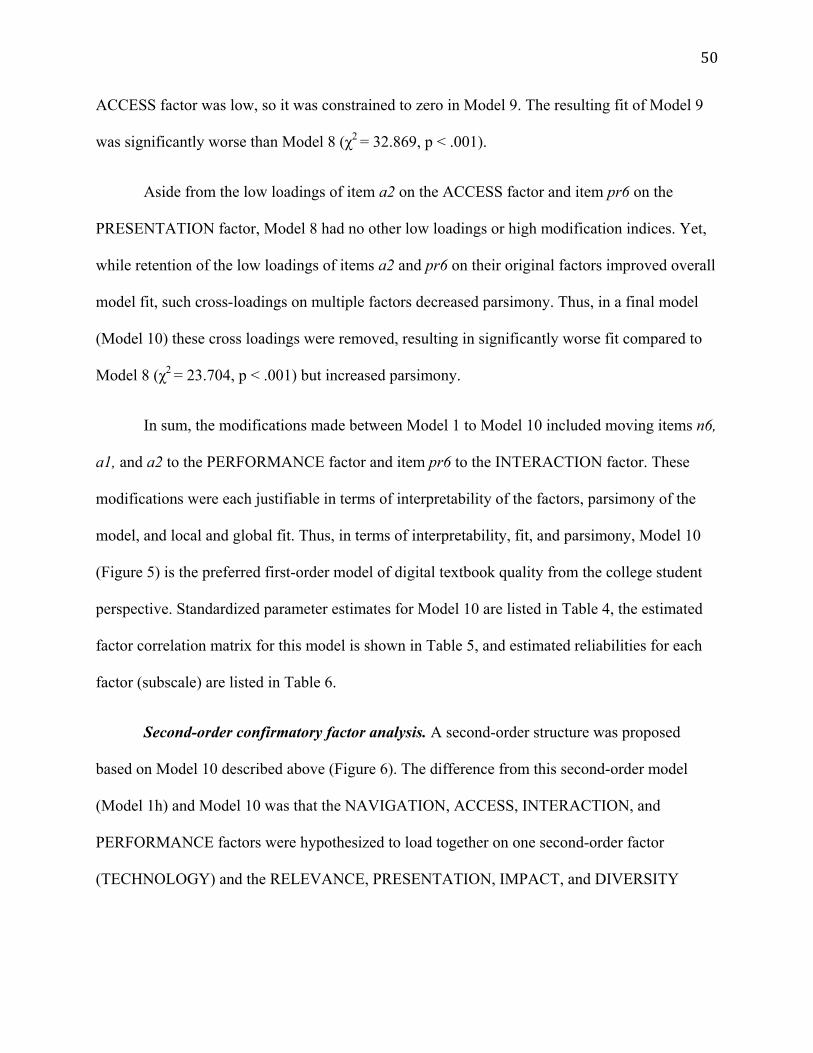
50
ACCESS factor was low, so it was constrained to zero in Model 9. The resulting fit of Model 9
was significantly worse than Model 8 (χ2 = 32.869, p < .001).
Aside from the low loadings of item a2 on the ACCESS factor and item pr6 on the
PRESENTATION factor, Model 8 had no other low loadings or high modification indices. Yet,
while retention of the low loadings of items a2 and pr6 on their original factors improved overall
model fit, such cross-loadings on multiple factors decreased parsimony. Thus, in a final model
(Model 10) these cross loadings were removed, resulting in significantly worse fit compared to
Model 8 (χ2 = 23.704, p < .001) but increased parsimony.
In sum, the modifications made between Model 1 to Model 10 included moving items n6,
a1, and a2 to the PERFORMANCE factor and item pr6 to the INTERACTION factor. These
modifications were each justifiable in terms of interpretability of the factors, parsimony of the
model, and local and global fit. Thus, in terms of interpretability, fit, and parsimony, Model 10
(Figure 5) is the preferred first-order model of digital textbook quality from the college student
perspective. Standardized parameter estimates for Model 10 are listed in Table 4, the estimated
factor correlation matrix for this model is shown in Table 5, and estimated reliabilities for each
factor (subscale) are listed in Table 6.
Second-order confirmatory factor analysis. A second-order structure was proposed
based on Model 10 described above (Figure 6). The difference from this second-order model
(Model 1h) and Model 10 was that the NAVIGATION, ACCESS, INTERACTION, and
PERFORMANCE factors were hypothesized to load together on one second-order factor
(TECHNOLOGY) and the RELEVANCE, PRESENTATION, IMPACT, and DIVERSITY

51
Figure 5. The path diagram of Model 10. The modifications from Model 1 include transfer of
items a1, a2, and n6 to the PERFORMANCE factor and item pr6 to the INTERACTION factor.
NAV=navigation, ACC=access, PERF=performance, INT=interaction, REL=relevance,
PRES=presentation, IMP=impact, DIV=diversity, TECH=technology, and CON=content.

52
Table 4
Standardized Parameter Estimates for Model 10
Factor Item Loading Estimate S.E.a Z-value Significance
NAVIGATION n1 .811 .036 22.535 < .001
NAVIGATION n2 .760 .041 18.365 < .001
NAVIGATION n3 .803 .040 20.044 < .001
NAVIGATION n4 .711 .047 15.163 < .001
NAVIGATION n5 .666 .052 12.826 < .001
ACCESS a3 .698 .046 15.276 < .001
ACCESS a4 .638 .051 12.527 < .001
ACCESS a5 .708 .055 12.875 < .001
ACCESS a6 .690 .046 14.989 < .001
ACCESS a7 .697 .051 13.578 < .001
ACCESS a8 .805 .039 20.560 < .001
PERFORMANCE pf1 .608 .052 11.690 < .001
PERFORMANCE pf2 .820 .036 22.948 < .001
PERFORMANCE pf3 .683 .054 12.534 < .001
PERFORMANCE pf5 .746 .045 16.674 < .001
PERFORMANCE a1 .762 .044 17.144 < .001
PERFORMANCE a2 .745 .052 14.401 < .001
PERFORMANCE n6 .802 .041 19.408 < .001
INTERACTION it1 .759 .041 18.327 < .001
INTERACTION it2 .708 .043 16.364 < .001
INTERACTION it3 .771 .037 20.606 < .001
INTERACTION it4 .878 .028 31.033 < .001
INTERACTION it5 .820 .031 26.064 < .001
INTERACTION pr6 .809 .040 20.283 < .001
RELEVANCE r1 .830 .047 17.670 < .001
RELEVANCE r3 .844 .037 22.912 < .001
RELEVANCE r4 .868 .031 27.963 < .001 Note. aStandard error. (Table continues)

53
Table 2 (continued)
Standardized Parameter Estimates for Model 10
Factor Item Loading Estimate S.E.a Z-value Significance
RELEVANCE r5 .783 .041 19.280 < .001
PRESENTATION pr2 .865 .026 32.633 < .001
PRESENTATION pr3 .683 .046 14.860 < .001
PRESENTATION pr4 .741 .035 21.209 < .001
PRESENTATION pr5 .821 .029 28.489 < .001
IMPACT ip1 .866 .029 30.133 < .001
IMPACT ip2 .817 .029 28.220 < .001
IMPACT ip3 .832 .028 29.768 < .001
IMPACT ip4 .938 .017 55.819 < .001
IMPACT ip5 .865 .024 35.655 < .001
IMPACT ip6 .876 .022 39.690 < .001
DIVERSITY d2 .883 .047 18.685 < .001
DIVERSITY d3 .958 .054 17.786 < .001
Note. aStandard error.
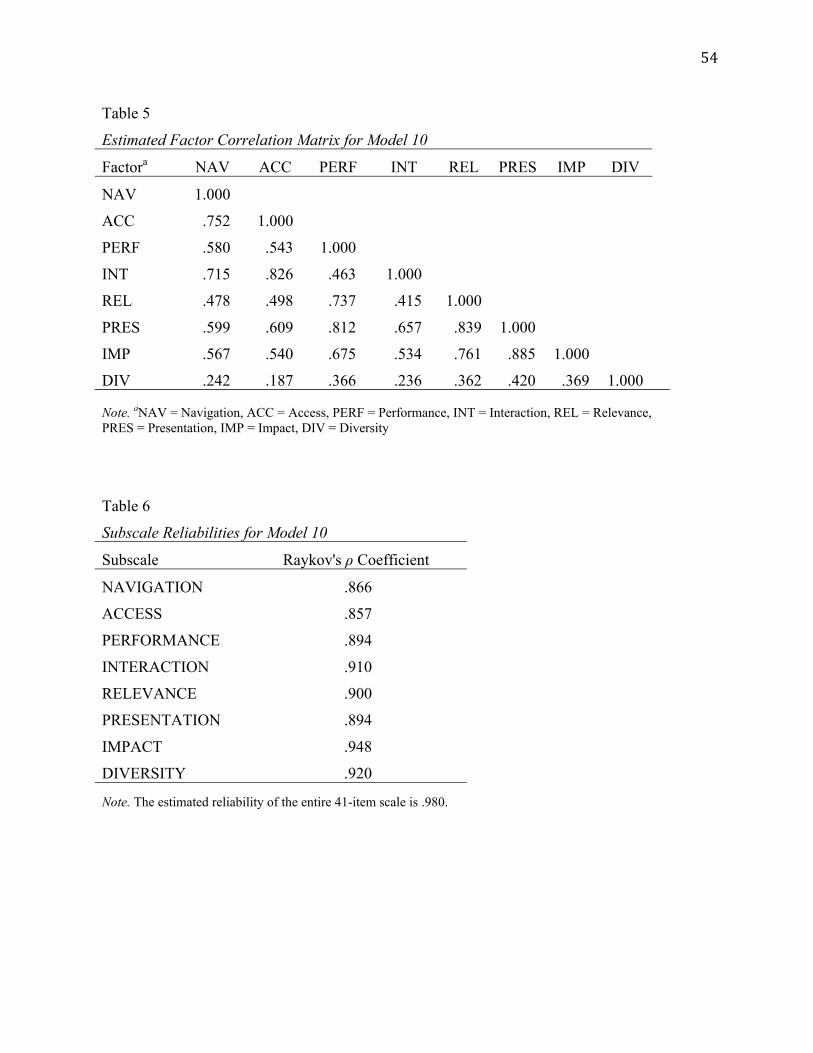
54
Table 5
Estimated Factor Correlation Matrix for Model 10
Factora NAV ACC PERF INT REL PRES IMP DIV
NAV 1.000
ACC .752 1.000
PERF .580 .543 1.000
INT .715 .826 .463 1.000
REL .478 .498 .737 .415 1.000
PRES .599 .609 .812 .657 .839 1.000
IMP .567 .540 .675 .534 .761 .885 1.000
DIV .242 .187 .366 .236 .362 .420 .369 1.000
Note. aNAV = Navigation, ACC = Access, PERF = Performance, INT = Interaction, REL = Relevance, PRES = Presentation, IMP = Impact, DIV = Diversity Table 6
Subscale Reliabilities for Model 10
Subscale Raykov's ρ Coefficient
NAVIGATION .866
ACCESS .857
PERFORMANCE .894
INTERACTION .910
RELEVANCE .900
PRESENTATION .894
IMPACT .948
DIVERSITY .920
Note. The estimated reliability of the entire 41-item scale is .980.
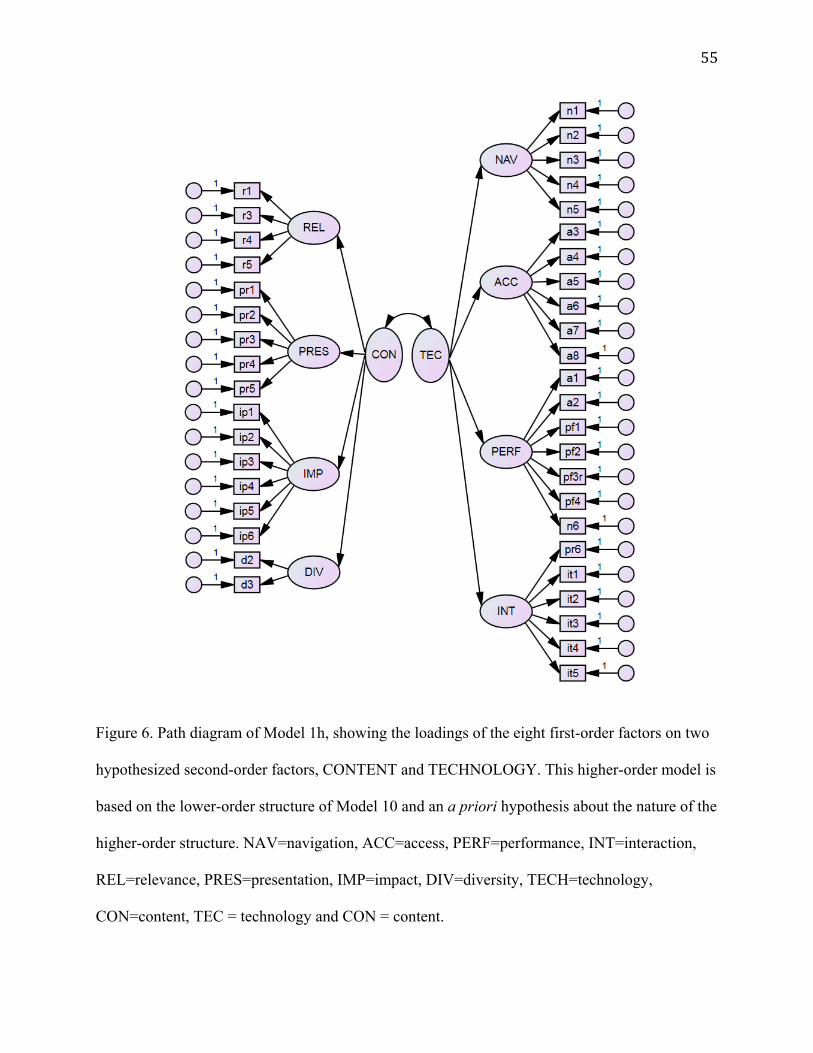
55
Figure 6. Path diagram of Model 1h, showing the loadings of the eight first-order factors on two
hypothesized second-order factors, CONTENT and TECHNOLOGY. This higher-order model is
based on the lower-order structure of Model 10 and an a priori hypothesis about the nature of the
higher-order structure. NAV=navigation, ACC=access, PERF=performance, INT=interaction,
REL=relevance, PRES=presentation, IMP=impact, DIV=diversity, TECH=technology,
CON=content, TEC = technology and CON = content.

56
factors were hypothesized to load together on another second-order factor (CONTENT). This
particular grouping was proposed because the TECHNOLOGY factors all seem to relate
specifically to characteristics unique to digital textbooks and the CONTENT factors all seem to
relate to characteristics germane to textbooks of any format.
CFA showed that Model 1h had reasonable fit, but that this fit was significantly worse
than Model 10 (χ2= 121.735, p < .001). In addition, the loading of PRESENTATION on the TEC
second-order factor was out-of-range (>1.000). This was due to a small negative residual error
variance of -0.029 for the PRESENTATION factor. Since the estimated negative value was close
to zero, this anomaly was handled by constraining the residual error variance of
PRESENTATION to zero in a subsequent analysis. Table 7 displays the fit and comparative
statistics for Model 1h with this minor modification included. Table 8 displays the factor
loadings of the first-order factors on their respective higher-order factors in Model 1h. The
estimated reliabilities of the higher-order factors in Model 1h were both equal to .884.
Second-order exploratory factor analysis in the confirmatory framework (E/CFA). An
Exploratory Factor Analysis (EFA) using the factor correlation matrix from Model 10 (see Table
5) and subsequent parallel analysis revealed two salient second-order factors in the data. Table 9
presents the factor loadings obtained from the EFA and Table 10 displays results from the
parallel analysis. Using the means of the simulated eigenvalues from the parallel analysis
produced a result equivalent to that if the 95th percentiles of the eigenvalues had been used, so
only the mean values are reported in Table 10. The data in Table 10 show that the first and
second eigenvalues are larger than would be expected by chance, pointing to a two-factor
solution. In this model (Model 2h) the relationship of the lower-order factors was slightly
different than the a priori higher-order hypothesis had predicted (Figure 7). In particular,

57
Table 7
Second-Order Model Fit and Comparative Statistics
Model Chi-
squarea CFIb TLIc RMSEAd χ2 Differencee Significancef
Model 10 293.969 .891 .966 .091 n/a n/a
Model 1h 353.566 .854 .952 .108 121.735 < .001
Model 2h 270.885 .900 .967 .090 35.230 < .001 Note. aχ2 is a measure of absolute fit. bCFI is a measure of comparative fit with good fit indicated by values near .90. cTLI is a measure of comparative fit with good fit indicated by values above .90. dRMSEA is a measure of parsimony with good fit indicated by values below .10.e The χ2 Difference test for each of the higher-order models is in reference to Model 10, the best first-order model. fP-values relate to the χ2 Difference Test. The Degrees of Freedom for each difference test was equal to 1 in all cases.
Table 8
Standardized Parameter Estimates for Model 1h
Second-order Factor First-order Factor Loading Estimate S.E.a Z-value Significance
TECHNOLOGY NAVIGATION .795 .035 22.411 < .001
TECHNOLOGY ACCESS .820 .033 24.690 < .001
TECHNOLOGY PERFORMANCE .840 .037 22.801 < .001
TECHNOLOGY INTERACTION .783 .031 25.625 < .001
CONTENT RELEVANCE .842 .029 29.207 < .001
CONTENT PRESENTATION 1.000 .000 n/a < .001
CONTENT IMPACT .882 .027 32.374 < .001
CONTENT DIVERSITY .411 .057 7.153 < .001
Note. aStandard error.
58
Table 9
Second-order EFA Factor Loading Estimates
Lower-order Factor Higher-order Factor 1 Higher-order Factor 2
NAVIGATION .137 .724
ACCESS -.190 .938
PERFORMANCE .794 .030
INTERACTION -.085 .944
RELEVANCE .929 -.085
PRESENTATION .913 .101
IMPACT .808 .090
DIVERSITY .463 -.530
Table 10
Parallel Analysis of Higher-Order EFA Eigenvalues
Factor Model Eigenvalue Mean Eigenvalue
One 4.963 1.279
Two 1.187 1.177
Three 0.749 1.093
Four 0.377 1.022
Five 0.279 0.960
Six 0.235 0.900
Seven 0.151 0.826
Eight 0.069 0.744

59
Figure 7. Path diagram of Model 2h, showing the loadings of the eight first-order factors on two
second-order factors, F1 and F2. This higher-order model is based on the lower-order structure of
Model 10 and the results of EFA using the factor covariance matrix of Model 10 (see Table 3).
Note that PERF loads with IMP, PRES, and REL and DIV loads on both second-order factors.
NAV=navigation, ACC=access, PERF=performance, INT=interaction, REL=relevance,
PRES=presentation, IMP=impact, DIV=diversity, TECH=technology, CON=content, TEC =
technology and CON = content.

60
PERFORMANCE loaded together with RELEVANCE, PRESENTATION, and IMPACT on one
second-order factor (F1), while NAVIGATION, ACCESS, INTERACTION, and DIVERSITY
loaded together on another second-order factor (F2). DIVERSITY also cross-loaded on the factor
explaining PERFORMANCE, RELEVANCE, PRESENTATION, and IMPACT.
CFA showed that Model 2h had reasonable fit (see Table 4), but this fit was significantly
worse than the fit of Model 10 (Chi-square = 36.060, p < .001). In addition, the loading of
PRESENTATION on the TEC second-order factor was out-of-range (>1.000). This was due to a
small negative residual error variance of -0.011 for the PRESENTATION factor. Since the
estimated negative value was close to zero, this anomaly was handled by constraining the
residual error variance of PRESENTATION to zero in a subsequent analysis. Table 7 provides
the fit and comparative statistics for Model 2h with this minor modification included. Factor
loadings for Model 2h are listed in Table 11. The estimated reliability of the second-order Factor
1 in Model 2h was .902 and the estimated reliability of higher-order Factor 2 was .910.
Table 11
Standardized Parameter Estimates for Model 2h Second-order Factor First-order Factor
Loading Estimate S.E.a Z-value Significance
Factor 1 PERFORMANCE .814 .032 25.089 < .001
Factor 1 RELEVANCE .840 .029 29.268 < .001
Factor 1 PRESENTATION 1.000 .000 n/a < .001
Factor 1 IMPACT .876 .028 31.124 < .001
Factor 1 DIVERSITY .412 .057 7.211 < .001
Factor 2 NAVIGATION .864 .036 24.167 < .001
Factor 2 ACCESS .903 .031 28.937 < .001
Factor 2 INTERACTION .866 .029 30.318 < .001
Note. aStandard error.

61
It was not possible to directly compare the fit statistics of Model 1h and 2h statistically,
because these models were not nested. In the end, since both higher-order models were equally
parsimonious, interpretability became the most important aspect to consider in determining
which higher-order model to retain and use going forward. Interpretability is also the main aspect
to consider in comparing the higher order models with the preferred first-order model.
Summary
This chapter presented results from the qualitative and quantitative analyses used to
develop and evaluate a model of digital textbook quality from the perspective of college
students. The qualitative analysis revealed eight major themes related to digital textbook quality
and these themes were subsequently used as the basis of a hypothesized mathematical model
amenable to empirical evaluation. Factor analytic procedures were used to evaluate variations of
the mathematical model and make improvements. The conclusions supported by this evaluation
are discussed in the next chapter.

62
Chapter 5
Discussion
The purpose of this study was to develop and empirically validate a model of digital
textbook quality from the perspective of college students. Such a model should potentially be
useful to developers and consumers of digital textbooks as a guide to product evaluation. In the
context of open educational resources, an understanding of what makes for a high quality digital
textbook could potentially help faculty and content managers in their efforts to initially develop
and/or subsequently revise their open textbooks and other openly licensed digital instructional
materials.
Development and evaluation of the model of digital textbook quality was accomplished
in two major steps. First, college students were asked directly to describe the characteristics of a
high quality digital textbook and these responses were analyzed using qualitative methods. The
results of the qualitative analysis were then used to develop a conceptual model of digital
textbook quality, which model facilitated the creation of an initial measurement instrument. A
separate group of college students were subsequently asked to respond to the items on the
measurement instrument. The responses from these students were then used to evaluate and
improve the initial model. Quantitative analysis also informed revisions and improvements to the
initial measurement instrument. The results of this two-step approach were described in Chapter
4 and are discussed next.
Summary of Qualitative Analysis
The thematic analysis of the literature review and student responses to questionnaire
items and interviews revealed eight major themes related to the quality of digital textbooks.

63
These themes related to (a) how students access their textbooks and navigate through them, (b)
how the textbooks performed technically, (c) how up-to-date and well-aligned the content was
with current knowledge and other aspects of the course, (d) how well technology interfaced with
the content through interactive content, (e) how and what material was presented, (f) how the
textbook impacted student performance, and (g) how sensitive the textbook was to diverse
cultures and viewpoints. Most of the themes were derived from student responses to
questionnaires and interviews and are characteristics of textbooks not mentioned in the literature
on textbook evaluation. Two of the themes (impact and diversity) were derived mostly from the
review of the literature and were included in the analysis because one or two students provided
comments related to these themes.
Overall, student responses to the questionnaire and interviews appeared to be thoughtful
and meaningful. The interviews especially revealed that students care about the quality of their
instructional materials and are willing to provide feedback to their instructors if they think it will
help improve the learning experience.
Summary of Quantitative Analysis
The results from the thematic analysis of the literature review and student responses
provided a framework upon which to build an initial mathematical model of digital textbook
quality from the perspective of college students. This initial mathematical model consisted of
eight factors based on the eight themes from the qualitative data and provided the blueprint for
constructing initial questionnaire items to measure each factor/theme. Student responses to these
initial items provided an opportunity to empirically evaluate the items using IRT and improve the
initial measurement model using CFA.
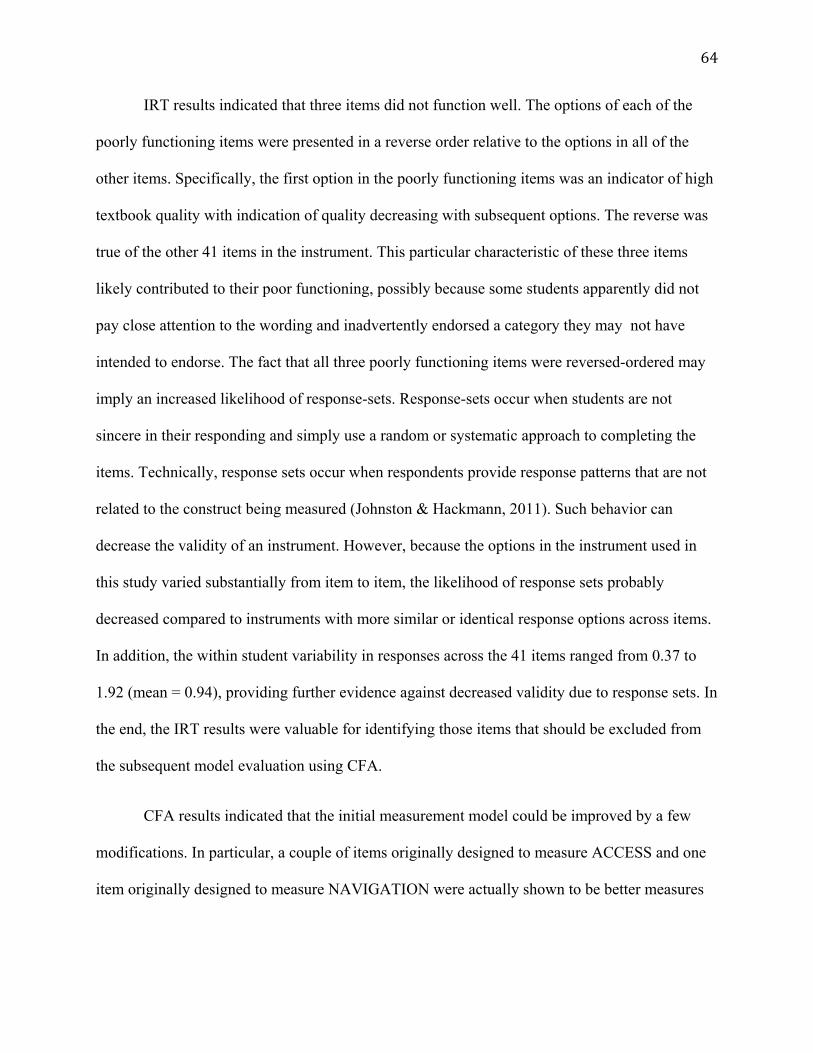
64
IRT results indicated that three items did not function well. The options of each of the
poorly functioning items were presented in a reverse order relative to the options in all of the
other items. Specifically, the first option in the poorly functioning items was an indicator of high
textbook quality with indication of quality decreasing with subsequent options. The reverse was
true of the other 41 items in the instrument. This particular characteristic of these three items
likely contributed to their poor functioning, possibly because some students apparently did not
pay close attention to the wording and inadvertently endorsed a category they may not have
intended to endorse. The fact that all three poorly functioning items were reversed-ordered may
imply an increased likelihood of response-sets. Response-sets occur when students are not
sincere in their responding and simply use a random or systematic approach to completing the
items. Technically, response sets occur when respondents provide response patterns that are not
related to the construct being measured (Johnston & Hackmann, 2011). Such behavior can
decrease the validity of an instrument. However, because the options in the instrument used in
this study varied substantially from item to item, the likelihood of response sets probably
decreased compared to instruments with more similar or identical response options across items.
In addition, the within student variability in responses across the 41 items ranged from 0.37 to
1.92 (mean = 0.94), providing further evidence against decreased validity due to response sets. In
the end, the IRT results were valuable for identifying those items that should be excluded from
the subsequent model evaluation using CFA.
CFA results indicated that the initial measurement model could be improved by a few
modifications. In particular, a couple of items originally designed to measure ACCESS and one
item originally designed to measure NAVIGATION were actually shown to be better measures

65
of PERFORMANCE. In a similar manner, one of the items designed to measure
PRESENTATION was shown to be a better measure of INTERACTION.
Closer inspection of the content of these items led me to conclude that these
modifications were justifiable. Items a1 and a2, for instance, both related to students’ satisfaction
with the performance of their accessibility options, while the remainder of the ACCESS items
dealt primarily with the availability of the textbook. Similarly, item n6 related to students’
perception of the overall ease of navigation (a PERFORMANCE-related feature), while the other
NAVIGATION items related to specific navigation functionalities like bookmarking and
searching. Finally, item pr6 related to students’ perceptions of the usefulness of study helps in
their textbook, similar to most of the INTERACTION items that related to specific pedagogical
features like interactive quizzes and links to supplementary information. The remainder of the
PRESENTATION items, on the other hand, related more generally to how content was
presented.
Overall, the modifications made as a result of CFA improved the fit and interpretability
of the initial model. This improved model was then used to explore the relationships among the
factors themselves. In particular, it was hypothesized that four of the factors –NAVIGATION,
ACCESS, PERFORMANCE, and INTERACTION – related primarily to characteristics of
digital textbooks, like technical performance and search functions. The other four factors –
RELEVANCE, PRESENTATION, IMPACT, and DIVERSITY – were characteristics germane
to textbooks of any format, digital or otherwise. In addition, these factors all appeared to relate
more particularly to the content of the textbook. A second-order CFA showed that these
hypothesized relationships were reasonably justified. EFA, together with parallel analysis,
confirmed the presence of two second-order factors, but indicated that PERFORMANCE was

66
mathematically more closely related to RELEVANCE, PRESENTATION, and IMPACT than to
NAVIGATION, ACCESS, and INTERACTION. The EFA also indicated that DIVERSITY
loaded together with NAVIGATION, ACCESS and INTERACTION on one second-order factor,
with a cross-loading on the other second-order factor. It is difficult to interpret the meaning of
these relationships, however, since none of the PERFORMANCE items relate to content and
neither of the DIVERSITY items relate to the technical aspects of the digital textbook.
Conclusions
This section presents conclusions related to the research questions addressed by this study
and to the measurement instrument developed as a result of this research.
Desirable characteristics of a high quality digital textbook. Eight key characteristics
of high quality digital textbooks were derived from student responses to questionnaires and
interviews, and from the literature. These characteristics included navigation features, access
features, technical performance, relevance, interaction features, presentation features,
educational impact, and sensitivity to diversity.
Preferred factor models. Based on the foregoing analyses, the best first-order model
was Model 10 (Figure 5). However, there was evidence that a second-order model explained the
relationships among the first-order factors better than the first-order model. Indeed, Model 1h
(the second-order model based on a priori theory, Figure 6) was preferable to Model 10 (the best
first-order model) and to a second-order model based on EFA (Model 2h, Figure 7). This
conclusion is justified based on several reasons. Specifically, Model 1h (a) was more
interpretable than Model 2h, (b) accounted for relationships among the factors better than Model
10, (c) had good fit, and (d) was reasonably parsimonious compared to the other models.

67
Evidence of reliability and validity. Scores obtained from the revised measurement
instrument (Appendix B) based on Model 1h are estimated to have to have high subscale and
composite reliability (see Table 6). The second-order factors also have high estimated reliability.
In addition, the qualitative approach used in this study provided built-in content validity in a
manner similar to that conferred by a table of specifications used in test construction.
Furthermore, the CFA provided some evidence of construct validity. While further research is
needed to provide even more evidence of validity, the instrument in its current form is
recommended for use by developers and users of digital textbooks, especially open digital
textbooks. Given the structure of Model 1h and the high scale-score reliabilities, it is
recommended that a separate score be used for each first-order factor and for each second-order
factor, in addition to a total score for the entire instrument.
Contributions of This Study to the Literature on Textbook Evaluation
The findings from this study are consistent with the literature on textbook evaluation in
only a small number of ways. In particular, textbook selection committees have used aspects of
some of the themes suggested by students as important indicators of textbook quality. These
aspects include quality of pedagogical aids, educational impact, and content accuracy, which are
aspects of the presentation, impact, and relevance themes in this study, respectively. In addition,
the theme of interaction as defined by student responses was related to the general idea of
interaction presented in the literature in that it dealt with particular components of digital
textbooks designed to promote learning through interaction. These elements included things like
interactive quizzes and links to external supplementary materials.

68
In general, however, textbook selection committees do not commonly use most of the
characteristics that students identified as important criteria for evaluating digital textbooks.
Similarly, the students in this study did not identify most of the criteria used by selection
committees in their evaluation decisions. One reason for this discrepancy may be that most
students are likely not capable of accurately using the textbook evaluation criteria commonly
used by selection committees. For instance, textbook selection committees often focus on
readability, content coverage, and cost. While some students may be capable of detecting
readability differences, most are not knowledgeable enough to make evaluation decisions based
on content coverage. In addition, it doesn’t appear from this study that cost is something students
associate with quality. Also, this study did not explicitly address cost because the Project
Kaleidoscope textbooks were provided to students for free in most cases.
Another possible reason for the discrepancy between the textbook evaluation criteria
important to students and the criteria important to selection committees may be that textbook
selection committees have not, for whatever reasons, paid enough attention to student
perspectives of textbook quality. It is particularly interesting to note that several textbook
evaluation studies have focused on measures of human interest as a criterion for evaluating
textbooks. Presumably, these evaluators see human interest as something that should be
important to students. However, no student in my study indicated that it is important for a high
quality digital textbook to be “interesting.”
Finally, at least some of the criteria I have defined apply to a specific class of textbooks
(i.e. textbooks presented in a digital format), while the criteria recommended in the literature for
use by textbook adoption committees have been developed to apply primarily to traditional

69
printed texts. The focus on digital textbooks highlights one way that this study has extended the
literature on textbook evaluation.
Indeed, this study has extended the literature on textbook evaluation in several important
ways. First, this study has added another perspective relevant to textbook evaluation in general:
the perspective of college students. In particular, the study has identified eight criteria that can be
valuable when students are asked to evaluate their textbooks. These criteria could also be
valuable to developers of textbooks and others involved in textbook design. Second, this study
has added understanding to the evaluation of digital textbooks in particular, something that is
lacking almost completely from the literature. As more and more digital instructional materials
are developed, an accurate understanding of what makes for a high quality digital textbook will
become increasingly important. Third, this study has provided a factor model and a measurement
instrument that can be used together for development and evaluation purposes. Finally, this study
has shown the usefulness of using a mixed-methods approach to instrument development. In
particular, this study has shown that using end-user perspectives to inform quantitative analysis
is a methodologically sound approach to product evaluation.
Limitations
This study had at least two main limitations that should be considered when interpreting
results. These limitations included sampling inadequacies and lack of cross-validation.
Sampling inadequacies. There were several sampling inadequacies in this study. First,
because student respondents were recruited through their instructors, there was little control over
which instructors promoted the questionnaire and interview requests to their students. Faculty
decisions to send the questionnaire on to their students could have been a factor of the

70
instructors’ perceptions of textbook quality (or lack thereof). For instance, an instructor’s
motivation to pass the questionnaire request on to his students could have been influenced by the
instructor’s perception that the textbook he was using was of particularly high or low quality. In
the end, the nature of the sampling design potentially limited the representativeness of the
student sample.
Second, only community college students in a small number of institutions located in
only a few parts of the United States were included in the sample for this study. The perspectives
of other types of students (e.g. university, liberal arts college, K-12) and students from other
parts of the country were not included, further limiting the representativeness of the sample.
However, it is not clear why criteria would be expected to vary across type of student or
geographic location. Further research would be needed to shed light on this issue.
Third, this study was limited to a single type of digital textbook: an open digital textbook
developed as part of Project Kaleidoscope. Students in this study did not use other types of
digital textbooks, especially those distributed by for-profit publishers. The differences between
digital textbooks developed through Project Kaleidoscope and those developed by private, for-
profit publishers have not been well studied. Thus, the results of this study apply particularly to
open digital textbooks developed through faculty collaboration.
Finally, the most important sampling inadequacy was small sample size. While the
sample size was quite large for the qualitative portion of the study, only 235 students completed
the questionnaire based on the initial measurement model. In particular, the limited sample may
have led to less stability in the CFA parameter estimates.

71
Lack of cross-validation. In a related way, the small sample size in this study prohibited
a cross-validation study using a split-sample approach. It is often useful to randomly divide a
sample in half and then analyze the data separately for each subgroup. The results of these
analyses can then be compared to determine whether the findings are generalizable across
subsamples. This approach may provide confirmation of the model fit and parameter estimates,
but was not possible in this study. Because the models in this study were quite complex, a
sample of 118 was not large enough for the estimation algorithm to reach convergence.
Recommendations
This section presents recommendations for (a) use of the preferred model of digital
textbook quality, (b) use of the measurement instrument, and (c) further research.
Use of the model. The following recommendations for use of the model of digital
textbook quality are made based on the findings of this study:
1. Authors and developers of for-profit digital textbooks should use the eight
criteria identified in the model of digital textbook quality when considering
how to produce high quality, educationally impactful, and profitable products.
2. Textbook selection committees should use the eight criteria to inform their
evaluation decisions. In higher education, these committees generally consist of
one or a few faculty members considering which textbook should be required
for students in a particular course. Consideration of the student perspective in
higher education seems particularly relevant.
3. Adopters and developers of open digital textbooks should use the eight criteria
to inform development and revision decisions.

72
Use of the measurement instrument. The following recommendations for use of the
measurement instrument (Appendix B) are made based on the findings of this study:
1. Authors and developers of for-profit digital textbooks should use the instrument
to acquire student feedback about their products, if they are willing to make
modifications based on such feedback.
2. Developers and adopters of open digital textbooks, like the faculty in Project
Kaleidoscope, should use the instrument frequently to inform textbook revision
decisions based direct feedback from their students. Student responses to items
on the instrument should help focus an instructor’s attention on particular
characteristics of the book that could be improved. This feedback, combined
with instructor expertise, should lead to potentially important revisions and
improvements to the open digital textbooks.
3. Educational researchers should use scores from the instrument in comparative
studies of digital textbooks, open or otherwise. It is possible that advocates of
open educational resources could use the results of such comparative studies to
debunk the frequent claims by for-profit publishers that OER are, by default, of
lower quality than publisher-produced instructional materials.
Further research. The following recommendations for further research are made based
on the findings of this study:
1. Future research on a model of digital textbook quality from the student
perspective should be based on larger sample sizes. I recommend a sample size
of at least 1000 students in order to ensure stable parameter estimates and to

73
allow for cross-validation studies. In addition to increasing the sample size, it is
also important to further expand the range of the student sample to include
university, liberal arts college, and K-12 students from a range of geographic
locations. Such studies would extend the generalizability of the results of this
study in the community college context.
2. Future research should include cross-validation studies. Such studies are
important to further refine the model of digital textbook quality from the
student perspective and provide more evidence of validity of the model.
3. Future research should explore the stability of the proposed model across
subgroups and across time. Cross-group studies would determine whether or
not the factor structure is the same across gender, ethnic, and student groupings
(university, community college, high school, etc.). Such studies could also
establish that the model is stable within groups and across time or
administrations of the instrument. Overall, factor invariance studies are
important for further establishing the generalizability of the model.
4. Future research should be conducted to improve the measurement instrument.
Specifically, a future studies should explore student sincerity in responding to
items (Browne, 2011), the effect of reverse-ordering response options on some
items, and possible ways of reducing the total number of items needed to
measure each factor. In addition, future studies should estimate the reliability of
the measurement instrument using a hierarchal linear modeling approach (Yeo,
Kim, Branum-Martin, Wayman, & Espin, 2011). Such an approach would

74
provide a more appropriate reliability estimate than a single reliability
coefficient because the textbooks being evaluated are nested within courses.
Final Thoughts
This dissertation began with a quote about quality from the novel Zen and the Art of
Motorcycle Maintenance by Robert M. Pirsig. In this quote, Pirsig claimed that “any philosophic
explanation of Quality is going to be both false and true precisely because it is a philosophic
explanation.” The purpose of this research was to identify the desired characteristics that are
indicators of high quality digital textbooks from the student point of view. The explanation of
quality I have presented in this work is certainly Persigian, in that it is dependent on the context
and the purpose for which it is used. In some contexts it will be truer than in others. Despite this,
it is hoped that the criteria identified, the model evaluated, and the instrument developed will be
useful to users and developers of digital textbooks – especially open digital textbooks.

75
References
Allen, N. (2010). A cover to cover solution: How open textbooks are the path to textbook
affordability. Retrieved from http://www.studentpirgs.org/textbooks-reports/a-cover-to-
cover-solution
Altman, W. S., Ericksen, K., & Pena-shaff, J. B. (2001). An inclusive process for departmental
textbook selection. Teaching of Psychology, 33(4), 228-231.
Armbruster, B. B., Osborn, J. H., & Davison, A. L. (1985). Readability formulas may be
dangerous to your textbooks. Educational Leadership, 42(7), 18.
Armstrong, J., & Bray, J. (1986). How can we improve textbooks? Publications, ECS
Distribution Center, Denver, CO. Retrieved from http://www.eric.ed.gov/ERICWebPortal/
contentdelivery/servlet/ERICServlet?accno=ED292208.
Baker-Eveleth, L. J., Miller, J. R., &Tucker, L. (2011). Lowering business education cost with a
custom professor-written online text. Journal of Education for Business, 86(4).
Benner, P. (1985). Quality of life: A phenomenological perspective on explanation, prediction,
and understanding in nursing science. Advances in Nursing Science, 8(1), 1-14.
Berry, T., Cook, L., Hill, N., & Stevens, K. (2010). An exploratory analysis of textbook usage
and study habits: Misperceptions and barriers to success. College Teaching, 59(1), 31-39.
doi:10.1080/87567555.2010.509376
Besser, D., & Stone, G. (1999). Textbooks and teaching: A lesson from students. Journalism &
Mass Communication Educator, 53(4), 4-17.
Bliss, T., Hilton, John III, Wiley, D., & Thanos, K. (2013). The cost and quality of open textbooks:
Perceptions of community college faculty and students. First Monday, 18 (1).

76
Boring, E. G. (1953/1963). The role of theory in experimental psychology. American Journal of
Psychology, 66, 169-184. Reprinted in E. G. Boring (1963). History, psychology, and
science (R. I. Watson & D. T. Campbell, Eds. pp. 210-225). New York: John Wiley.
Brandt, L. W. (1964). How does one select an introductory textbook? PsycCRITIQUES, 9(8),
332-332. doi:10.1037/007645
Britton, B. K., Van Dusen, L., Gülgöz, S., Glynn, S. M., & Sharp, L. (1991). Accuracy of
learnability judgments for instructional texts. Journal of Educational Psychology, 83(1), 43-
47. doi:10.1037/0022-0663.83.1.43
Brown, T. A. (2006). Confirmatory factor analysis for applied research. Guilford Press.
Browne, J. (2011). An IRT Analysis of preservice teacher self-efficacy in technology
integration. Journal of Technology and Teacher Education, 19(2), 123-140.
Cai, L., Thissen, D., & du Toit, S. H. C. (2011). IRTPRO for Windows. Lincolnwood, IL:
Scientific Software International.
Caswell, T. (2012). The Open Course Library of the Washington State Colleges. In: Oblinger, D.
G., ed. Game changers: Education and information technologies Washington D.C.:
Educause, 259-262.
Croll, W., & Moskaluk, S. (1977). Should Flesch Counts count? Teaching of Psychology, 4(1),
48.
Cruz, B. C. (2002). Don Juan and rebels under palm trees: Depictions of Latin Americans in US
History textbooks. Critique of Anthropology, 22(3), 2002.
Cunningham, P. (1984). The great readability debate. Educational Leadership, 41(7), 84.

77
Davis, J. D. (2009). Understanding the influence of two mathematics textbooks on prospective
secondary teachers’ knowledge. Journal of Mathematics Teacher Education, 12(5), 365-
389. doi:10.1007/s10857-009-9115-2
Dewey, J. (1897). My pedagogic creed. Boston: E.L. Kellog & Company.
Dempster, M., Donnelly, M., & O’Loughlin, C. (2004). The validity of the MacNew Quality of
Life in heart disease questionnaire. Health and Quality of Life Outcomes, 2, 6
doi:10.1186/1477-7525-2-6
Durwin, C. C., & Sherman, W. M. (2008). Does choice of college textbook make a difference in
students’ comprehension? College Teaching, 56(1), 28-34.
Etlin, M. (1994). Teachers press for better textbooks. NEA Today, 12(7), 6.
Falduto, V. R. (2009). A content analysis of contemporary college algebra textbooks:
Applications of visualization strategies. Dissertation Abstracts International Section A:
Humanities and Social Sciences. Nova Southeastern University.
Fiore, T. A., & Cook, R. A. (1994). Adopting textbooks and other instructional materials.
Remedial & Special Education, 15(6), 333-347.
Flesch, R. (1948). A new readability yardstick. Journal of Applied Psychology, 32, 221-233.
Flora, D. B., &Curran, P. J. (2004). An empirical evaluation of alternative methods of
estimation for confirmatory factor analysis with ordinal data. Psychological
methods, 9(4), 466.
Franzen, R. H., & Knight, F. B. (1922). Textbook Selection. York, PA: Warwick & York, Inc.
Gillen, B. (1973). Readability and human interest scores of thirty-four current introductory
psychology texts. American Psychologist, 28, 1010-1011.
Gillen, B., Kendall, P. C., & Finch Jr., A. J. (1977). Reading ease and human interest scores: A
comparison of flesch scores with subjective ratings. Teaching of Psychology, 4(1), 39.

78
Grabowski, B. L. (2004). Generative learning contributions to the design of instruction and
learning. In D.H. Jonassen (Ed.), Handbook of research on educational communications
and technology, (2nd ed., pp. 719-743). Mahwah, NJ: Erlbaum.
Griesinger, W. S., & Klene, R. R. (1984). Readability of introductory psychology textbooks:
Flesch versus student ratings. Teaching of Psychology, 11(2), 90-91.
doi:10.1207/s15328023top1102_8
Griggs, R. A., Bujak-Johnson, A., & Proctor, D. L. (2004). Using common core vocabulary in
text selection and teaching the introductory course. Teaching of Psychology, 31(4), 265-
269.
Griggs, R. A., & Koenig, C. S. (2001). Brief introductory psychology textbooks: A current
analysis. Teaching of Psychology, 28(1), 36-40.
Griggs, R. A., Jackson, S. L., Christopher, A. N., & Marek, P. (1999). Introductory psychology
textbooks: An objective analysis and update. Teaching of Psychology, 26(3), 182-189.
doi:10.1207/S15328023TOP260304
Gunning, T. G. (2003). The role of readability in today’s classrooms. Topics in Language
Disorders, 23(3), 175-189.
Hartley, J., Sotto, E., & Fox, C. (2004). Clarity across the disciplines: An analysis of texts in the
sciences, social sciences, and arts and humanities. Science Communication, 26(2), 188-210.
doi:10.1177/1075547004270164
Hayton, J. C., Allen, D. G., & Scarpello, V. (2004). Factor retention decisions in
exploratory factor analysis: A tutorial on parallel analysis. Organizational
research methods, 7(2), 191-205.
Helmes, E., & Campbell, A. (2010). Complications with assessing disability in care of
the aged: When does “does not apply” apply?. GeroPsych: The Journal of

79
Gerontopsychology and Geriatric Psychiatry, 23(3), 155.
Hewinson, M. (2007). Buy the book. Times Higher Education Supplement, (1796), 6.
Honeycutt, J. (2007). Commentary on “Business-to-business marketing textbooks: A
comparative review.” Journal of Business-to-Business Marketing, 14(4), 79-83.
doi:10.1300/J033v14n04.05
IBM Corp. Released 2012. IBM SPSS Statistics for Windows, Version 21.0. Armonk,
NY: IBM Corp.
Jackson, S. L., Lugo, S. M., & Griggs, R. A. (2001). Research methods textbooks: An objective
analysis. Teaching of Psychology, 28(4), 282-288.
Johnston, M., & Hackmann, A. (2011). Cross�validation and response sets in repeated use of
mood questionnaires. British Journal of Social and Clinical Psychology, 16(3), 235-239.
Jones, K. H., & Evanciew, C. E. (1995). Readability of textbooks for technology education.
Technology Teacher, 55(1), 28.
Kelley, M. & Warburton, B. (2011). Survey: Undergraduates prefer print over ebooks. . Library
Journal, 136(12), 14-15.
Kingkade, T. (2011). Rising costs force students to skimp on textbooks. Huffington Post.
Accessed on September 3, 2012 at http://www.huffingtonpost.com/2011/08/11/student-
advocates-sound-alarm-on-textbooks_n_924536.html
Klein, D. M., Bryant, J., & Zillmann, D. (1982). Relationship between humor in introductory
textbooks and students’ evaluations of the texts' appeal and effectiveness. Psychological
Reports, 50(1), 235-241.
Ko, W.-shan. (2010). A qualitative study of Taiwanese college English teachers’ criteria and
rationales for freshman English textbook selection. Dissertation Abstracts International
Section A: Humanities and Social Sciences. Texas A&M University.

80
Kourilsky, M., & Wittrock, M. C. (1987). Verbal and graphical strategies in the teaching of
economics. Teaching and Teacher Education, 3(1), 1-12.
Kozlowski, S. W. J., Toney, R., Mullins, M., Weissbein, D., Brown, K., & Bell, B. (2001).
Developing adaptability: A theory for the design of integrated-embedded training systems.
In E. Salas (Ed.), Advances in Human Performance and Cognitive Engineering Research
(pp. 59-124). Oxford: Elsevier Science Ltd.
Landrigan, D. T., & Palladino, J. J. (1974). “Readability and human interest scores of thirty-four
current introductory texts”: Reply. American Psychologist, 29(7), 571-572.
doi:10.1037/h0038162
Leininger, M. M. (1985). Ethnography and ethnonursing: Models and modes of qualitative data
analysis. In M. M. Leininger (Ed.), Qualitative research methods in nursing (pp. 33-72).
Orlando, FL: Grune & Stratton.
Maddux, C. D., & Candler, A. (1987). Readability, interest, and coverage of 10 textbooks on
educational assessment. Psychological Reports, 60(2), 631-636.
Maddux, C. D., & Candler, A. (1990). Readability, interest, and coverage of ten introductory
textbooks on mental retardation. Mental Retardation, 28(2), 115-118.
Maddux, C. D., Irons, T., Candler, A., & Irons, D. (1983). Readability, interest, and coverage of
24 introductory special education textbooks. Journal of Special Education, 17(3).
Meredith, G. M. (1980). Brief scale for measuring the impact of a textbook. Perceptual and
Motor Skills, 51(2), 370.
Meyer, B. J. F. (2003). Text coherence and readability. Topics in Language Disorders, 23(3),
204-224.

81
Meyer, L. A. (1988). Elementary science textbooks: Their contents, text characteristics, and
comprehensibility. Journal of Research in Science Teaching, 25(6), 435-463
Muthén, B., & Asparouhov, T. (2002). Latent variable analysis with categorical
outcomes: Multiple-group and growth modeling in Mplus. Mplus Web Notes,
4(5), 1-22.
Muthen, L. K., & Muthen, B. O. (1998-2010). Mplus version 5.1 [Computer software]. Los
Angeles, CA: Muthen and Muthen.
Muther, C., & Conrad, M. (1988). Kid-Rating: An in-depth textbook evaluation technique.
Educational Leadership, 46(2), 79.
OECD. (2007). Giving Knowledge for Free: The Emergence of Open Educational
Resources. Multilingual Summaries.
Petrides, L., Jimes, C., Middleton-Detzner, C., Walling, J., & Weiss, S. (2011). Open textbook
adoption and use: Implications for teachers and learners. Open Learning, (1), 39-49.
doi:10.1080/02680513.2011.538563
Pomper, M. (2008). Teaching upper-division math courses online. . Online Classroom, January,
1-7.
Pruchno, R. A., Kleban, M. H., & Resch, N. L. (1988). Psychometric assessment of the
multidimensional observation scale for elderly subjects (MOSES). Journal of
Gerontology, 43(6), P164-P169.
Quereshi, M. Y., & Buchkoski, J. E. (1979). Logical versus empirical estimates of readability
and human interest of general psychology textbooks. Teaching of Psychology, 6(4), 202-
205. doi:10.1207/s15328023top0604_3
Quereshi, M. Y., & Sackett, P. R. (1977). An updated content analysis of introductory
psychology textbooks. Teaching of Psychology, 4(1), 25-30.

82
Raykov, T. (1997). Scale reliability, Cronbach's coefficient alpha, and violations of
essential tau-equivalence with fixed congeneric components. Multivariate
Behavioral Research, 32(4), 329-353.
Reitenour, S. (1984). A comparison study of five music appreciation textbooks. 28 pp.Peer
Reviewed:N/APublication Date:1984Descriptors:College Programs (p. 28).
Reys, B. J., Reys, R. E., & Chávez, O. (2004). Why mathematics textbooks matter. Educational
Leadership, 61(5), 61-66.
Rose, T. L., & Lessen, E. I. (1980). Completeness and readability of 16 learning disabilities
introductory texts. Journal of Learning Disabilities, 13(9).
Samejima, F. (1969). Estimation of latent ability using a response pattern of graded scores
(Psychometric Monograph No. 17). Richmond, VA: Psychometric Society.
Sellnow, D. D., Child, J. T., & Ahlfeldt, S. L. (2005). Textbook technology supplements: What
are they good for? Communication Education, 54(3), 243-253.
doi:10.1080/03634520500356360
Shields, C. M. (2003). ‘Giving Voice’ to students: Using the Internet for data collection.
Qualitative Research, 3(3), 397-414. doi:10.1177/1468794103033007
Silver, L. S., Stevens, R. E., & Clow, K. E. (2012). Marketing professors’ perspectives on the
cost of college textbooks: A pilot study. Journal of Education for Business, 87(1), 1-6.
doi:10.1080/08832323.2010.542503
Simpson, R. H. (1947). An experiment in rating educational psychology textbooks. Journal of
Educational Psychology, 38(8), 493-498. doi:10.1037/h0057134
Spinks, N., & Wells, B. (1993). Readability: A textbook selection criterion. Journal of Education
for Business, 69(2), 83.
Spradley, J. P. (1979). The Ethnographic Interview, Holt, Rinehart, and Winston.

83
Steuer, F. B., & Ham, K. W. (2008). Psychology textbooks: Examining their accuracy. Teaching
of Psychology, 35(3), 160-168. doi:10.1080/00986280802189197
Strunk, O. (1957). Flesch counts of five social psychology textbooks. Psychological Reports, 3,
363. doi:10.2466/PR0.3..363-364
Suh, B. K. (1970). Quantitative and qualitative evaluation of social studies textbook content. . 41
pp.Peer Reviewed:N/APublication Date:1970Descriptors:Classification (p. 41).
Taylor, S. J., and Bogdan, R. (1984). Introduction to qualitative research methods: The search for
meanings. New York: John Wiley & Sons.
Terwilliger, J. S. (1989). Content validity of the gre physics test as indexed by commonly
employed textbooks. San Francisco.
Thomas, R. M. (1990). Applying a patriotism textbook-rating device: An indonesian example.
Educational Research Quarterly, 12(4), 46-52.
U.S. Department of Education, National Center for Education Statistics. (2011). Digest of
Education Statistics, 2010 (NCES 2011-015), Chapter 3 .
Watt, M. G. (2009). Research on the textbook selection process in the united states of america.
IARTEM e-Journal, 2(1).
Weiten, W., Deguara, D., Rehmke, E., & Sewell, L. (1999). University, community college, and
high school students’ evaluations of textbook pedagogical aids. Teaching of Psychology,
26(1), 19.
Weisberg, M. (2011). Student attitudes and behaviors towards digital textbooks. . Publishing
Research Quarterly, 27(2), 188-196. doi:10.1007/s12109-011-9217-4

84
Wiley, D., Bliss, T., & McEwen, M. In press. Open educational resources: A review of the
literature. Handbook of Research on Educational Communications & Technology (4th ed.).
AECT.
Williams, D.D. (2013). Qualitative inquiry in daily life. Retrieved January 11, 2013, from
http://qualitativeinquirydailylife.wordpress.com/
Willis, G. B. (2005) Cognitive interviewing: A tool for improving questionnaire design.
Thousand Oaks: Sage Publications.
Wittrock, M. C. (1974). Learning as a generative process 1. Educational Psychologist, 11(2), 87
95.
Wittrock, M. C. (1989). Generative processes of comprehension. Educational
Psychologist, 24(4), 345-376.
Wolf, K. E. (2010). Risk and crisis communication messages: The testing and
reconceptualization of the 10 best practices. (Doctoral dissertation). Retrieved from
ProQuest Dissertations and Theses.
Woody, W. D., Daniel, D. B., & Baker, C. a. (2010). E-books or textbooks: Students prefer
textbooks. Computers & Education, 55(3), 945-948. doi:10.1016/j.compedu.2010.04.005
Yasar, O., & Seremet, M. (2007). A comparative analysis regarding pictures included in
secondary school geography textbooks taught in Turkey. International Research in
Geographical and Environmental Education, 16(2), 157-188. doi:10.2167/irgee216.0
Yeo, S., Kim, D. I., Branum-Martin, L., Wayman, M. M., & Espin, C. A. (2011). Assessing the
reliability of curriculum-based measurement: An application of latent growth
modeling. Journal of School Psychology.

85
Young, J. N. (2009). This could be the year of e-textbooks. . Chronicle of Higher Education,
56(3), A1-A12.

86
Appendix A
Initial 44-Item Digital Textbook Quality Questionnaire
NAVIGATION (n)
1. How useful to your learning is the search function in your digital textbook? a. There is no search function b. Not at all useful c. Slightly useful d. Moderately useful e. Very useful
2. How accurate is the search function in your digital textbook?
a. There is no search function b. Not at all accurate c. Slightly accurate d. Moderately accurate e. Very accurate
3. How useful to your learning are the internal links (such as links between chapters or
sections) in your digital textbook? a. There are no internal links b. Not at all useful c. Slightly useful d. Moderately useful e. Very useful
4. How useful to your learning are the page numbers in your digital textbook?
a. There are no page numbers b. Not at all useful c. Slightly useful d. Moderately useful e. Very useful
5. How useful to your learning is the bookmarking or place-holding function in your digital
textbook? a. There is no bookmarking function b. Not at all useful c. Slightly useful d. Moderately useful e. Very useful

87
6. How easy is your digital textbook to navigate? a. Very difficult b. Somewhat difficult c. Somewhat easy d. Very easy
ACCESS (a)
1. To what extent are you satisfied with your current options for accessing your digital textbook? Access options might include online, download, print, e-book, etc.
a. Very dissatisfied b. Somewhat dissatisfied c. Somewhat satisfied d. Very satisfied
2. How convenient is it for you to access your digital textbook?
a. Very inconvenient b. Somewhat inconvenient c. Somewhat convenient d. Very convenient
3. How useful to your learning is the option to print your digital textbook (or parts of it)
yourself? a. There is no option to print my digital textbook b. Not at all useful c. Slightly useful d. Moderately useful e. Very useful
4. How useful to your learning is the option to download your digital textbook so that you
can read it OFFLINE on a personal device such as a computer, phone, e-reader, etc.? a. There is no option to download my digital textbook b. Not at all useful c. Slightly useful d. Moderately useful e. Very useful
5. How useful to your learning is the option to read the ONLINE VERSION of your digital
textbook on various mobile devices such as a laptop, phone, or tablet? a. There is no option to read the online version on various devices b. Not at all useful c. Slightly useful d. Moderately useful e. Very useful

88
6. How useful to your learning is the option to purchase a printed copy of your digital textbook?
a. There is no option to purchase a printed copy b. Not at all useful c. Slightly useful d. Moderately useful e. Very useful
7. After you have completed this course, how useful to your learning do you think it will be
to have continued access to your digital textbook? a. Not at all useful b. Slightly useful c. Moderately useful d. Very useful
8. How useful to your learning are the accessibility features in your digital textbook, such as
the options to increase font size or listen to an audio version? a. There are no accessibility features b. Not at all useful c. Slightly useful d. Moderately useful e. Very useful
PERFORMANCE (pf)
1. How often do you experience technical problems with your digital textbook, such as website crashes, device issues, login problems, and software incompatibility?
a. Regularly b. Frequently c. Occasionally d. Rarely e. Never
2. How easy is it for you to locate the ONLINE VERSION of your digital textbook?
a. Very difficult b. Somewhat difficult c. Somewhat easy d. Very easy
3. How easy is it for you to log in to the online version of your digital textbook?
a. I don’t need to log in to my digital textbook b. Very difficult c. Somewhat difficult d. Somewhat easy e. Very easy

89
4. How compatible is your digital textbook with the software you use to view it, such as web browsers, document viewers, and operating systems?
a. Not at all compatible b. Slightly compatible c. Moderately compatible d. Very compatible
5. *To what extent does the download/upload speed of the online version of your digital
textbook impede your learning? a. Does not impede at all b. Slightly impedes c. Moderately impedes d. Greatly impedes
INTERACTION (it)
1. How useful to your learning is the note-taking function in your digital textbook? a. There is no note-taking function b. Not at all useful c. Slightly useful d. Moderately useful e. Very useful
2. How useful to your learning is the highlighting function in your digital textbook?
a. There is no highlighting function b. Not at all useful c. Slightly useful d. Moderately useful e. Very useful
3. How useful to your learning are the interactive quizzes (quizzes that provide immediate
feedback) in your digital textbook? a. There are no interactive quizzes b. Not at all useful c. Slightly useful d. Moderately useful e. Very useful
4. How useful to your learning are the links to EXTERNAL materials in your digital
textbook, such as websites, videos, etc.? a. There are no links to external materials b. Not at all useful c. Slightly useful d. Moderately useful e. Very useful

90
5. How useful to your learning are the EMBEDDED interactive materials in your digital textbook, such as embedded videos, tutorials, interactive charts, etc.?
a. There are no embedded materials b. Not at all useful c. Slightly useful d. Moderately useful e. Very useful
RELEVANCE (r)
1. How up-to-date is the information in your digital textbook? a. Not at all up-to-date b. Slightly up-to-date c. Moderately up-to-date d. Very up-to-date
2. *In light of the stated goals for your course, how much material does your digital
textbook contain that is unnecessary? a. Very little or no amount of unnecessary material b. A slight amount of unnecessary material c. A moderate amount of unnecessary material d. A great amount of unnecessary material
3. How well is the material in your digital textbook aligned with the instruction presented
by your instructor? a. Very poorly aligned b. Somewhat poorly aligned c. Somewhat well aligned d. Very well aligned
4. How well is the material in your digital textbook aligned with the assignments given by
your instructor? a. No assignments are given b. Very poorly aligned c. Somewhat poorly aligned d. Somewhat well aligned e. Very well aligned
5. How well is the material in your digital textbook aligned with the exams given by your
instructor? a. No exams are given b. Very poorly aligned c. Somewhat poorly aligned d. Somewhat well aligned e. Very well aligned

91
PRESENTATION (pr)
1. To what extent is the information in your textbook confusing or unclear? a. Very confusing or unclear b. Fairly confusing or unclear c. Fairly straightforward or clear d. Very straightforward or clear
2. How well-organized is your digital textbook?
a. Not at all well-organized b. Slightly well-organized c. Moderately well-organized d. Very well-organized
3. How useful to your learning are the visual aids in your digital textbook, such as graphs,
pictures, charts, diagrams, maps, etc.? a. There are no visual aids b. Not at all useful c. Slightly useful d. Moderately useful e. Very useful
4. How detailed is the material in your digital textbook?
a. Not at all detailed b. Somewhat detailed c. Fairly detailed d. Very detailed
5. How useful to your learning are the examples in your digital textbook?
a. There are no examples b. Not at all useful c. Slightly useful d. Moderately useful e. Very useful
6. How useful to your learning are the study helps in your digital textbook, such as
glossaries, study guides, review sections, summary sections, etc.? a. There are no study helps b. Not at all useful c. Slightly useful d. Moderately useful e. Very useful

92
IMPACT (ip)
1. To what extent has your digital textbook affected your learning? a. Greatly impeded my learning b. Slightly impeded my learning c. Slightly enhanced my learning d. Greatly enhanced my learning
2. To what extent has your digital textbook affected your motivation to learn?
a. Greatly decreased my motivation b. Slightly decreased my motivation c. Slightly increased my motivation d. Greatly increased my motivation
3. To what extent has your digital textbook affected your exam scores in your course?
a. No exams are given b. Very negatively affected my scores c. Somewhat negatively affected my scores d. Somewhat positively affected my scores e. Very positively affected my scores
4. To what extent has your digital textbook affected your retention of the subject matter in
your course? a. Very negatively affected my retention b. Somewhat negatively affected my retention c. Somewhat positively affected my retention d. Very positively affected my retention
5. To what extent has your digital textbook BROADENED your understanding of the
subject matter in your course? (Broad understanding means surface-level knowledge of many topics.)
a. Not at all broadened my understanding b. Slightly broadened my understanding c. Moderately broadened my understanding d. Greatly broadened my understanding
6. To what extent has your digital textbook DEEPENED your understanding of the subject
matter in your course? (Deep understanding means detailed knowledge the most important topics.)
a. Not at all deepened my understanding b. Slightly deepened my understanding c. Moderately deepened my understanding d. Greatly deepened my understanding

93
DIVERSITY (d)
1. To what extent is your digital textbook biased toward a particular worldview or culture?
a. Very unbiased b. Somewhat unbiased c. Somewhat biased d. Very biased
2. How sensitive is your digital textbook to your unique background, culture, and
viewpoints? a. Very insensitive b. Somewhat insensitive c. Somewhat sensitive d. Very sensitive
3. How sensitive is your digital textbook to others’ unique backgrounds, cultures, and
viewpoints? a. Very insensitive b. Somewhat insensitive c. Somewhat sensitive d. Very sensitive

94
Appendix B
Revised 41-Item Digital Textbook Quality Questionnaire
NAVIGATION (n)
1. How useful to your learning is the search function in your digital textbook? a. There is no search function b. Not at all useful c. Slightly useful d. Moderately useful e. Very useful
2. How accurate is the search function in your digital textbook?
a. There is no search function b. Not at all accurate c. Slightly accurate d. Moderately accurate e. Very accurate
3. How useful to your learning are the internal links (such as links between chapters or
sections) in your digital textbook? a. There are no internal links b. Not at all useful c. Slightly useful d. Moderately useful e. Very useful
4. How useful to your learning are the page numbers in your digital textbook?
a. There are no page numbers b. Not at all useful c. Slightly useful d. Moderately useful e. Very useful
5. How useful to your learning is the bookmarking or place-holding function in your digital
textbook? a. There is no bookmarking function b. Not at all useful c. Slightly useful d. Moderately useful e. Very useful

95
ACCESS (a)
1. How useful to your learning is the option to print your digital textbook (or parts of it) yourself?
a. There is no option to print my digital textbook b. Not at all useful c. Slightly useful d. Moderately useful e. Very useful
2. How useful to your learning is the option to download your digital textbook so that you
can read it OFFLINE on a personal device such as a computer, phone, e-reader, etc.? a. There is no option to download my digital textbook b. Not at all useful c. Slightly useful d. Moderately useful e. Very useful
3. How useful to your learning is the option to read the ONLINE VERSION of your digital
textbook on various mobile devices such as a laptop, phone, or tablet? a. There is no option to read the online version on various devices b. Not at all useful c. Slightly useful d. Moderately useful e. Very useful
4. How useful to your learning is the option to purchase a printed copy of your digital textbook?
a. There is no option to purchase a printed copy b. Not at all useful c. Slightly useful d. Moderately useful e. Very useful
5. After you have completed this course, how useful to your learning do you think it will be
to have continued access to your digital textbook? a. Not at all useful b. Slightly useful c. Moderately useful d. Very useful

96
6. How useful to your learning are the accessibility features in your digital textbook, such as the options to increase font size or listen to an audio version?
a. There are no accessibility features b. Not at all useful c. Slightly useful d. Moderately useful e. Very useful
PERFORMANCE (pf)
1. How often do you experience technical problems with your digital textbook, such as website crashes, device issues, login problems, and software incompatibility?
a. Regularly b. Frequently c. Occasionally d. Rarely e. Never
2. How easy is it for you to locate the ONLINE VERSION of your digital textbook?
a. Very difficult b. Somewhat difficult c. Somewhat easy d. Very easy
3. How easy is it for you to log in to the online version of your digital textbook?
a. I don’t need to log in to my digital textbook b. Very difficult c. Somewhat difficult d. Somewhat easy e. Very easy
4. How compatible is your digital textbook with the software you use to view it, such as
web browsers, document viewers, and operating systems? a. Not at all compatible b. Slightly compatible c. Moderately compatible d. Very compatible
5. How easy is your digital textbook to navigate?
a. Very difficult b. Somewhat difficult c. Somewhat easy d. Very easy

97
6. To what extent are you satisfied with your current options for accessing your digital textbook? Access options might include online, download, print, e-book, etc.
a. Very dissatisfied b. Somewhat dissatisfied c. Somewhat satisfied d. Very satisfied
7. How convenient is it for you to access your digital textbook?
a. Very inconvenient b. Somewhat inconvenient c. Somewhat convenient d. Very convenient
INTERACTION (it)
1. How useful to your learning is the note-taking function in your digital textbook? a. There is no note-taking function b. Not at all useful c. Slightly useful d. Moderately useful e. Very useful
2. How useful to your learning is the highlighting function in your digital textbook?
a. There is no highlighting function b. Not at all useful c. Slightly useful d. Moderately useful e. Very useful
3. How useful to your learning are the interactive quizzes (quizzes that provide immediate
feedback) in your digital textbook? a. There are no interactive quizzes b. Not at all useful c. Slightly useful d. Moderately useful e. Very useful
4. How useful to your learning are the links to EXTERNAL materials in your digital
textbook, such as websites, videos, etc.? a. There are no links to external materials b. Not at all useful c. Slightly useful d. Moderately useful e. Very useful

98
5. How useful to your learning are the EMBEDDED interactive materials in your digital
textbook, such as embedded videos, tutorials, interactive charts, etc.? a. There are no embedded materials b. Not at all useful c. Slightly useful d. Moderately useful e. Very useful
6. How useful to your learning are the study helps in your digital textbook, such as
glossaries, study guides, review sections, summary sections, etc.? a. There are no study helps b. Not at all useful c. Slightly useful d. Moderately useful e. Very useful
RELEVANCE (r)
1. How up-to-date is the information in your digital textbook? a. Not at all up-to-date b. Slightly up-to-date c. Moderately up-to-date d. Very up-to-date
2. How well is the material in your digital textbook aligned with the instruction presented
by your instructor? a. Very poorly aligned b. Somewhat poorly aligned c. Somewhat well aligned d. Very well aligned
3. How well is the material in your digital textbook aligned with the assignments given by
your instructor? a. No assignments are given b. Very poorly aligned c. Somewhat poorly aligned d. Somewhat well aligned e. Very well aligned
4. How well is the material in your digital textbook aligned with the exams given by your
instructor? a. No exams are given b. Very poorly aligned c. Somewhat poorly aligned d. Somewhat well aligned e. Very well aligned

99
PRESENTATION (pr)
1. To what extent is the information in your textbook confusing or unclear? a. Very confusing or unclear b. Fairly confusing or unclear c. Fairly straightforward or clear d. Very straightforward or clear
2. How well-organized is your digital textbook?
a. Not at all well-organized b. Slightly well-organized c. Moderately well-organized d. Very well-organized
3. How useful to your learning are the visual aids in your digital textbook, such as graphs,
pictures, charts, diagrams, maps, etc.? a. There are no visual aids b. Not at all useful c. Slightly useful d. Moderately useful e. Very useful
4. How detailed is the material in your digital textbook?
a. Not at all detailed b. Somewhat detailed c. Fairly detailed d. Very detailed
5. How useful to your learning are the examples in your digital textbook?
a. There are no examples b. Not at all useful c. Slightly useful d. Moderately useful e. Very useful f.
IMPACT (ip)
1. To what extent has your digital textbook affected your learning? a. Greatly impeded my learning b. Slightly impeded my learning c. Slightly enhanced my learning d. Greatly enhanced my learning
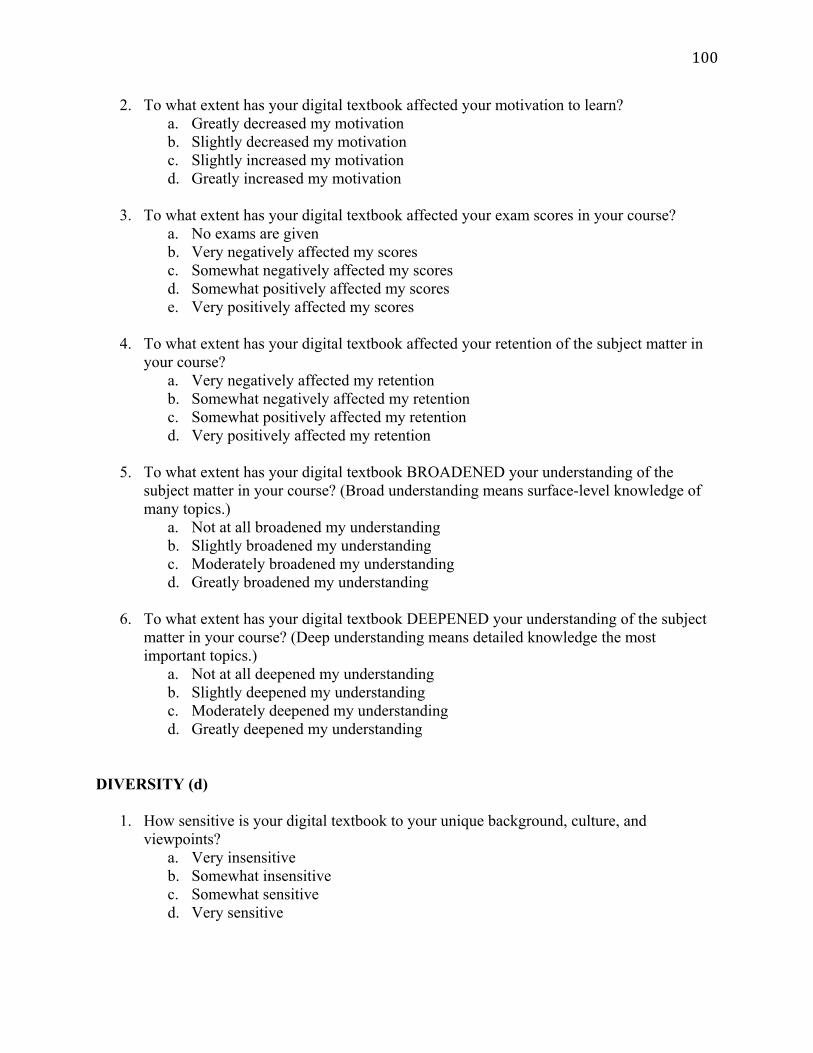
100
2. To what extent has your digital textbook affected your motivation to learn? a. Greatly decreased my motivation b. Slightly decreased my motivation c. Slightly increased my motivation d. Greatly increased my motivation
3. To what extent has your digital textbook affected your exam scores in your course?
a. No exams are given b. Very negatively affected my scores c. Somewhat negatively affected my scores d. Somewhat positively affected my scores e. Very positively affected my scores
4. To what extent has your digital textbook affected your retention of the subject matter in
your course? a. Very negatively affected my retention b. Somewhat negatively affected my retention c. Somewhat positively affected my retention d. Very positively affected my retention
5. To what extent has your digital textbook BROADENED your understanding of the
subject matter in your course? (Broad understanding means surface-level knowledge of many topics.)
a. Not at all broadened my understanding b. Slightly broadened my understanding c. Moderately broadened my understanding d. Greatly broadened my understanding
6. To what extent has your digital textbook DEEPENED your understanding of the subject
matter in your course? (Deep understanding means detailed knowledge the most important topics.)
a. Not at all deepened my understanding b. Slightly deepened my understanding c. Moderately deepened my understanding d. Greatly deepened my understanding
DIVERSITY (d)
1. How sensitive is your digital textbook to your unique background, culture, and viewpoints?
a. Very insensitive b. Somewhat insensitive c. Somewhat sensitive d. Very sensitive

101
2. How sensitive is your digital textbook to others’ unique backgrounds, cultures, and viewpoints?
a. Very insensitive b. Somewhat insensitive c. Somewhat sensitive d. Very sensitive