Embed Size (px)
Citation preview

A MODEL OF EDUCATIONAL EXPANSION ANDLABOUR MARKET ADJUSTMENT APPLIED
TO KENYA
Paul Collier and Arne Bigsten
I INTRODUCTION
The apparent experience of the Kenya labour market has been influential in theformulation of theories of segmented labour markets (SLM) in opposition to thetraditional human capital framework. The ILO (1972) concluded from the evidenceof the 1960s that wage rigidity was responsible for heavy urban unemployment.House and Rempel using data for the period 1968-72 concluded:
The primary question asked in this study was whether the increase in the supplyof labour available in Kenya was exerting significant downward pressure on thewage structure in the modern sector. On the basis of the evidence considered inthis study the conclusion reached is that wage levels have not been responsiveto the growing labour supply pressures (1978, p. 175).
Harris and Todaro (1970), formulated a model in which starting from the assumptionof wage rigidity, voluntary search unemployment was derived as a consequence.1Fields (1974), postulated a refined version of this model in which in addition to wagerigidity, it was assumed that employers screened applicants according to the number ofyears of education they had received. This model predicted explosive growth ineducational output combined with 'bumping': a process in which the educatedgradually displace the less educated out of job opportunities. Both models wereoriginally developed in Kenya.
In this paper we examine in some detail the wide array of data now available onthe Kenyan labour market. We conclude that none of the simple models fits the facts.In their place we propose a framework more compatible with the recent behaviour ofthe labour market. In Section II we document changes in employment and earningsby occupation over the period 1964-77. In Section III earnings broken down byeducation are introduced for the period 1968-78. In Section IV changes in employ-ment prospects and migration broken down by education are presented for the sameperiod. Section V proposes a theory which is compatible with these observations.Finally, Section VI offers a summary and conclusion.
II EMPLOYMENT AND EARNINGS BY OCCUPATION 1964-77
Using the Manpower Survey of 1964 (Ministry of Economic Planning, 1970), and theEmployment and Earnings Surveys of 1964, 1969, 1972 and 1977 (Central Bureau of
1An expanded version of this model applied to East Africa is presented in Collier (1979).31

32 BULLETIN
Statistics, 1963-77), we are able to build up a picture of changes in the occupationalcomposition of the labour force in the formal sector.
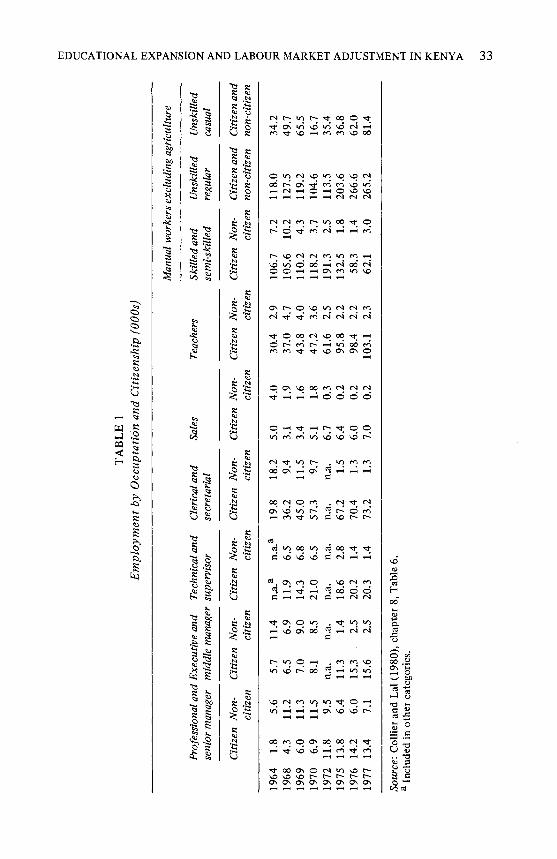
Table 1 shows the data by citizenship and sector for the years 1964-77. The figureson skilled manual employment are almost certainly subject to unspecified reclassifica-tion between 1964 and 1969 and between 1972 and 1977. This makes comparisonsbetween the development of skilled and unskilled manual labour impossible. Threefactors are particularly noteworthy. First, among citizens the proportion in white-collar jobs has risen strongly throughout the period. Secondly, among manual workersthe share of casual employees fell between 1968 and 1970 and then rose, stronglybetween 1970 and 1977. Thirdly, there has been a decline in the number of non-citizens. The exit of approximately 35 000 non-citizens between 1965 and 1977 musthave had a substantial impact upon the citizen wage structure. For example, duringthe decade 1967-77 citizen 'high wage'2 employment grew by 50 500 from a base ofonly 27 200 (of whom 8600 were non-Africans). Half of this expansion was accountedfor by the exit of 25 300 non-citizens.
Average earnings in specific occupational groups are known only for the years1968-77, and even in these years no differentiation by citizenship is possible. Sincethe non-citizens had higher average earnings than the citizens and the proportion ofnon-citizens in the labour force decreased over the period, the increase in citizenearnings will exceed that for all employees.
Clearly, in 1976 and 1977 many workers previously classified as 'skilled' werereclassified as 'unskilled'. Since these reclassified workers would tend to be semi-skilled with earnings between the means for skilled and unskilled workers, theirreclassification has the effect of raising the unskilled and the skilled wage in 1976and 1977 relative to the earlier periods. No allowance has been made for this in thefigures shown in Table 2. No reliable data are available for casuals, but such workersare commonly hired at daily rates which correspond to the minimum wage. Thisdoubled between 1972 and October 1977, and thus was raised at a rate slightly abovethe inflation rate. Between 1968 and 1972 the minimum wage was unchanged innominal terms and so fell by 13 per cent in real terms.
From Table 2 we see that with the exception of top-level jobs there has been atendency for real wages to fall, in some cases quite sharply. Relative earnings showconsiderable flexibility but little systematic change.
The period of falling wages approximately coincides with the period of 'IncomesPolicy'. The evidence does not support the hypothesis, however, that the fall in wageswas policy-induced. The evidence for this is twofold. First, the policy 'guidelines'were changed from year-to-year so as to follow market conditions, for example,during the coffee boom, the guidelines were substantially liberalized. Secondly, andmost important, the actual bargains concluded bear little relation to the guidelines,occasionally exceeding them, almost invariably falling below them, and in aggregate
2We define high wage arbitrarily as that wage which divides the top 25 per cent of wage earnersfrom the remaining 75 per cent. In 1977 this was 1394 spm and in 1967 462 spm. The totalnumber of employees in Kenya earning above the level was 96 094 in 1977 and 70 855 in 1967.The number of non-citizens in wage employment was 18 387 in 1977 and 43 661 in 1967. Weassume that all non-citizens are in the top 25 per cent of wage earners. The figures do not allowfor the small numbers of people who changed citizenship post-1967.
Sour
ce: C
ollie
r an
d L
ai (
1980
), c
hapt
er 8
, Tab
le 6
.a
Incl
uded
in o
ther
cat
egor
ies.
TA
BL
E 1
Em
ploy
men
t by
Occ
upta
tion
and
Citi
zens
hip
100
Os)
Man
ual w
orke
rs e
xclu
ding
agr
icul
ture
1964
1.8
5.6
5.7
11.4
n.aa
n.a.
a19
.818
.25.
04.
030
.42.
910
6.7
7.2
118.
034
.219
684.
311
.26.
56.
911
.96.
536
.29.
43.
11.
937
.04.
710
5.6
10.2
127.
549
.719
696.
011
.37,
09.
014
.36.
845
.011
.53.
41.
643
.84.
011
0.2
4.3
119.
265
.519
706.
911
.58.
18.
521
.06.
557
.39.
75.
11.
847
.23.
611
8.2
3.7
104.
616
.719
72 1
1.8
9.5
n.a.
n.a.
n.a.
n.a.
n.a.
n.a.
6.7
0.3
61.6
2.5
191.
32.
511
3.5
35.4
1975
13.
86.
411
.31.
418
.62.
867
.21.
56.
40.
295
.82.
213
2.5
1.8
203.
636
.819
76 1
4.2
6.0
15.3
2.5
20.2
1.4
70.4
1.3
6.0
0.2
98.4
2.2
58.3
1.4
266.
662
.019
77 1
3.4
7.1
15.6
2.5
20.3
1.4
73.2
1.3
7.0
0.2
103.
12.
362
.13.
026
5.2
81.4
Prof
essi
onal
and
Exe
cutiv
e an
dT
echn
ical
and
Cie
,-ic
al a
ndSa
les
Tea
cher
sSk
illed
and
Uns
kille
dU
nski
lled
seni
or m
anag
er m
iddl
e m
anag
er s
uper
viso
rse
cret
aria
lse
mi-
skill
edre
gula
rca
sual
Citi
zen
Non
-C
itize
n N
on-
Citi
zen
Non
-C
itize
n N
on-
Citi
zen
Non
-C
itize
n N
on-
Citi
zen
Non
-C
itize
n an
dC
itize
n an
dci
tizen
citiz
enci
tizen
citiz
enci
tizen
citiz
enci
tizen
non-
citiz
enno
n-ci
tizen

TA
BL
E 2
Ear
ning
s by
Occ
upat
iona
(sp
m a
t cur
rent
pri
ces)
aEm
ploy
men
t and
Ear
ning
s (C
entr
al B
urea
u of
Sta
tistic
s, 1
963-
77)
for
1972
and
197
7 an
d H
ouse
and
Rem
pel (
1978
), T
.2.4
for
196
8.b
For
1972
-7 th
e G
DP
defl
ator
is 1
.96.
The
Nai
robi
hig
her-
, mid
dle-
and
low
er-i
ncom
e in
dexe
s of
con
sum
er p
rice
s ro
se b
y 1.
87, 1
.84
and
2.00
res
pect
ivel
y. F
or 1
968-
72 th
e G
DP
defl
ator
is 1
.145
.
Dir
ecto
rsM
iddl
e le
vel
Cle
rica
l!T
each
ers
adm
inis
trat
ion
exec
utiv
e an
d se
cret
aria
lan
d pr
ofes
sion
alm
anag
eria
l
Oth
erw
hite
-col
lar
Tec
hnic
ians
fore
man
Man
ual s
kille
dan
d se
mi-
skill
edM
anua
l uns
kille
dre
gula
r(n
on-a
gric
ultu
ral)
1968
2168
2304
692
541
734
1252
327
253
1972
2621
2092
783
564
796
1565
363
271
1977
6083
3212
1190
862
1397
1851
1001
447
(A)
Nor
mal
ized
(m
anua
l uns
kille
d ea
rnin
gs =
1: 1
977:
447
= 1
; 197
2: 2
71 =
1; 1
968:
253
1)
1968
8.57
9.11
2.74
2.14
2.90
4.95
1.29
1.00
1972
9.67
7.72
2.89
2.01
2.94
5.77
1.34
1.00
1977
13.6
17.
192.
621.
933.
134.
142.
241.
00
(B)
Nor
mal
ized
(19
72 r
eal e
arni
ngs;
GD
P de
flat
or u
sedb
)
1968
0.95
1.26
1.01
1.13
1.06
0.92
1.03
1.07
1972
1.00
1.00
1.00
1.00
1.00
1.00
1.00
1.00
1977
1.18
0.78
0.78
0.81
0.90
0.60
1.41
0.84

EDUCATIONAL EXPANSION AND LABOUR MARKET ADJUSTMENT IN KENYA 35
being only one half to three quarters of the maximum permitted increase. Theguidelines also attempted to narrow earnings differentials by granting larger increasesto the lower paid. Differentials between skilled and unskilled wage earners, however,probably tended to widen over the period. Hence,we may conclude that the IncomesPolicy probably contributed little to the sharp fall in real wages. Indeed, to theextent that the guidelines provided unions with both a target and a legal means ofattaining it (by appeal to the Industrial Court) the policy perhaps tended to raisewages.
III EDUCATION AND EARNINGS
No comprehensive data exists on earnings broken down by education. There have,however, been two sample surveys, the IBRD Laborforce Survey of 1968 and theNairobi High and Middle Level Manpower Survey (NHMLMS) (Thias and Carnoy,1972), conducted by the Central Bureau of Statistics in 1978 and analysed for thefirst time below. The Laborforce Survey had a total sample size of 4237 of which85 per cent were randomly selected from the private sector and 15 per cent werenon-randomly selected from the public sector. The NHMLMS sample size was 533randomly drawn from the private sector. Since the survey covered only non-manualemployment the number of workers with secondary education is very similar in thetwo samples. The Laborforce Survey covered Nairobi, Mombasa and Nakuru whilstthe NHMLMS covered only Nairobi. The Laborforce Survey was heavily weightedtowards Nairobi, however. Among form IV leavers, the group on which we will con-centrate, 82 per cent of the sample worked in Nairobi and a further 15 per cent inMombasa where the wage structure was found to be very similar.
Regression analysis of the Laborforce Survey by Thias and Carnoy establishedthat the number of years of education was generally a significant explanatory vari-able of earnings. Controlling for age, an extra year of schooling was associated withan increase in earnings of 9 per cent. A similar regression was run on the NHMLMSdata. Education was the most important of five explanatory variables. The resultsbeing given below:
S = 7749 + 607Er + 1O7AX + 52XX + 799P + 4481 (1)(36) (13) (18) (245) (231)
r2 = 0.52
where S = salary in shillings per month (mean = 3270)E = years of educationA = age in yearsX = years of experience in jobF = full-time training course attendedI in-service trainingx = significant at the 1 per cent level
standard errors being shown in parentheses.
An extra year of education was associated with an increase in salary of 19 per cent.

36 BULLETIN
Hence, in both surveys the level of education appears to have a powerful influence onearnings.
Salaries by education level in the two surveys are shown in Table 3. It must bestressed that the coverage of the two surveys differs.3 For example, the few workerswith only primary education who nevertheless have achieved high- or middle-levelpositions in 1978 are in no sense representative of all primary-school leavers, and sotheir earnings cannot be compared with earnings of primary-school leavers in 1968.The high age of those with only primaiy-school education relative to those with moreeducation in the 1978 sample indicates the extent to which this group has beendisplaced by higher educational cohorts. The decline in mean age as years of educa-tion rise up to form IV for the 1978 survey suggests that education cohorts below thislevel are experiencing displacement from this category of manpower.
TABLE 3Age and Salary by Education, 1968 and 1978
a African males only.b NHMLMS printout.c Thias and Carnoy (1972) Table 3.6.d Ibid. Table 3.10.e Ibid. Table 3.11
Derived from Thias and Carnoy (1972) including those below completed primary education.
The restricted coverage of the 1978 survey,however, is useful in addressing the keyquestion of whether occupation-specific wage rates have adjusted along the lines of the
3Thias and Carnoy do not report the mean wage of their sample. From their published tables,however, thia can be derived at approximately 521 spm. This is well below the mean wage reportedin the Employment and Earnings Survey (Central Bureau of Statistics, 1963-77) (using the Thiasand Carnoy weights for the three cities) of 666 spm. Either this is because of discrepancies inreporting wages between the two surveys or because the Thias and Carnoy sample is biased. Theformer is unlikely since the Thias and Carnoy survey procedure involved cross-checking earningswith employers, and any tendency to overstate earnings so as to appear to comply with minimumwage legislation would be common to both surveys. The latter is rather more likely since thesample represents only 1.8 per cent of the relevant labour force and the public sector is known tohave been under-represented in the sample. Differential reporting of unskilled wages would in anycase not affect the reporting of wages for the non-manual labour force which is what we areconcerned with in the NHMLMS. We will therefore take the reported wages as being correct forparticular education and age categories.
Education Mean age Mean salary (s pm)
1968a 1978b 1968a 1978b
Completed primary 28.8e 38.3 4Ol 1827Form II secondary 26.8e 34.0 2366Form IV secondary 25.4'- 29.8 2667Form VI secondary 27.9' 28.8 1 121d 441University 304e 36.1 2429e 7171All (including less
than completedprimary education) 32.8e 32.2 S2l 3273
EDUCATIONAL EXPANSION AND LABOUR MARKET ADJUSTMENT IN KENYA 37
human capital model or whether the educational complexion of occupations hasaltered but wage rates have been rigid along the lines of the SLM model. Prior to 1968educated manpower was so scarce in Kenya that virtually all form IV leavers were ableto enter the non-manual wage labour market. The enormous subsequent expansion insecondary education, however, has meant that by 1978 this was no longer true.Substantial numbers of form IV leavers had to accept manual jobs which wereexcluded from the 1978 survey sample. Since our questions require information onsalaries for a given set of jobs, however, the restricted coverage of the 1978 survey iswhat we need. For to discover whether the presence of many unsuccessful job seekingform IV leavers has any impact upon the salaries offered to those who succeed ingaining non-manual jobs, we need to know the earnings, not of all form IV leavers,but of successful form IV leavers.
Changes in non-manual earnings by age and education are reported in Table 4.Normalized on the relevant urban mean earnings in each year (B) in all cases the ageand education specific salary shows a strong rise between 1968 and l978. In all casesthis rise exceeds the 28 per cent by which the Employment and Earnings survey for1967 (Central Bureau of Statistics, 1963-77) mean earnings (666 spm) exceeds themean sample earnings (521 spm) in the Laborforce Survey. Thus the increase cannotbe ascribed to underestimation of earnings in the Thias and Carnoy procedure. The(unweighted) mean increase of the nine comparable cases is 60 per cent, with thatof the three cases of form IV being 33 per cent.
Normalized on the age group 25-29 (C), there appears to have been a steepeningof age scales. For example, the (unweighted) mean of the three education groupsfor the age group 35-44 was 1.27 in 1968 and 1.64 in 1978. This change did notoccur among those with form IV education, however. In both years this group hadthe steepest age scale. This would suggest that, whilst the supply price of form IVleavers is much lower than that for the other groups, those selected then acquireexperience on the job which raises their productivity at the same rate as for othergroups. Thus, whilst job seekers' initial pay prospects are very sensitive to their educa-tional credentials, incremental pay prospects are independent of education; the lesseducated do not catch up lost ground but do not fall further behind.
Normalized on form IV (D), the differential between forms IV and VI has widenedbetween 1968 and 1978 but that between form 1V and graduates has remained un-changed except for the highest age group.
Normalized on real earnings in 1968 (E) we find that in all cases where comparisonscan be made real wages rose over the period. Whilst several qualifications must bemade of the data5 these are not sufficient to inhibit the weaker assertion that nosignificant fall occurred in real earnings.
4The mean wage reported in the Employment and Earnings Survey for 1967 weighted for thethree cities was 666 spm, that for Nairobi alone being 731 spm, In early 1978 for Nairobi this hadrisen to about 1296 spm (from Central Bureau of Statistics (1963-77)). We use these meanearnings as the numeraire.
5First, the 1968 sample included some 5 per cent from Nakuru where earnings were somewhatbelow Nairobi and Mombasa whilst the 1978 survey was confined to Nairobi. Secondly, the 1968survey did, as we have noted, understate mean earnings relative to those recorded in the Employ-ment and Earnings Survey. Thirdly, whilst the 1968 survey was confined to Africans the 1978

a Numbers in parentheses denote small cell sizes.
38 BULLETIN
TABLE 4Salaries by Age and Education a
Age Education
Form IV Form VI University
1968 1978 1968 1978 1968 1978
(A) spm17-19 405 (1922) - (1550) - -20-24 619 1705 (714) 2161 1100 (1820)25-29 830 2123 1326 3670 2205 569330-34 1182 3003 1325 5616 2661 680135-44 1372 3762 1259 6625 2679 787345-54 - 7185 (3020) 9914 - 1005755+ - 7250 - - - (5100)
(B) Normalized (1968:666= 1;1978: 1296=1)17-19 0.61 - - -20-24 0.93 1.32 - 1.67 1.65 -25-29 1.25 1.64 1.99 2.83 3.31 43930-34 1.77 231 1.99 4.33 4.00 5.2535-44 2.06 2.83 1.89 5.11 4.02 6.0745-54 - 5.54 - 7.65 - 7.7655+ - 5.59 - - - -(C) Normalized (25-29 = 1)17-19 0.49 - - - - -20-24 0.74 0.8 - 0.59 0.50 -25-29 1.0 1.0 1.0 1.0 1.0 1.030-34 1.42 1.41 1.0 1.53 1.21 1.2035-44 1.65 1.73 0.95 1.80 1.21 1.3845-54 - 3.38 - 2.70 - 1.7755+ - 3.41 - - -(D) Normalized on Form IV = 117-19 1.0 1.0 - - - -20-24 1.0 1.0 - 1.27 1.25 -25-29 1.0 1.0 1.59 1.73 2.64 2.6830-34 1.0 1.0 1.12 1.87 2.26 2.2735-44 1.0 1.0 0.92 1.81 1.95 2.1445-54 1.0 1.0 - 1.38 - 1.4055+ 1.0 1.0 - - - -(E) Normalized on 1968 real earnings17-19 1.0 - - - - -20-24 1.0 1.28 - - 1.0 -25-29 1.0 1.19 1.0 1.29 1.0 1.2030-34 1.0 1.18 1.0 1.97 1.0 1.1935-44 1.0 1.25 1.0 2.45 1.0 1.3745-54 - - - - - -55+ - - - - - -

EDUCATIONAL EXPANSION AND LABOUR MARKET ADJUSTMENT IN KENYA 39
A salient feature is the increase in relative earnings of those who are both olderand well educated. Those both aged over 30 and possessing form VI or higher educa-tion raised their salaries relative to mean urban earnings (B) by 93 per cent, comparedto an increase of only 36 per cent for the remainder of the group. A possible explana-tion for this is the Africanization of higher level manpower noted in Section II. Thishas increased the demand for highly educated, senior Africans. Further, in 1968Europeans with form VI education were paid on average 149 per cent more thanAfricans and European graduates 40 per cent more than African graduates. As jobswere Africanized, had the existing wage rates been maintained, this would haveincreased African earnings substantially.
IV EDUCATION, EMPLOYMENT OPPORTUNITIES AND MIGRATION
We now combine the NHMLMS data for Nairobi males with data from the NationalDemographic Survey (NDS) for 1977 (Central Bureau of Statistics, unpublished). InTable 5 we present an estimate of the male population of Nairobi with at least second-ary education, for January 1978, the month of the NHMLMS. This is derived fromthe NDS estimate for January 1977, correcting for the aging and migration whichoccurred during the year.
TABLE 5Nairobi Males by Age and Education 1978
Age Education
Form 1-III Form IV-VI University
Sources: For aging, death and migration, Collier and Lai (1980).For 1977 figures, Central Bureau of Statistics (unpublished).
survey included a few non-Africans (though virtually none at the form IV level of education).Fourthly, it might be that the minimum occupation included in the 1978 survey was substantiallyhigher than that which form IV leavers in the period prior to 1968 could be assured of entering.Whilst this is theoretically possible it does not appear to be the case to any significant extent. Wewill show subsequently that about 60-65 per cent of the form IV leavers of the mid 1970s whowere resident in Nairobi in 1978 were in occupations covered by the 1978 survey, and that around80-90 per cent of the form IV leavers of the mid-1960s who were resident in Nairobi in 1978 hadoccupations included in the 1978 survey. Perhaps up to 20 per cent of form IV wage earners in1968 had jobs inferior to the minimum coverage of the 1978 survey. The earnings of this 20 percent would therefore tend to be below the remaining 80 per cent so that the mean earnings ofthe 80 per cent would be a few percentage points above the mean earnings of all form IV wageearners.
20-24 10206 2067925-29 7896 15167 233830-34 3828 8855 267335-39 2497 4789 192840+ 2243 4197 3488

40 BULLETIN
Let us now assume that all males over the age of 24 with university education wereemployed in high- or middle-level jobs. That is, we assume that the sample of workerswith these characteristics observed in the NHMLMS is a sample of the set of 10 427males with university education. We then apply this sampling fraction to the otherworkers observed in the NHMLMS sample to yield the approximate number of Nairobimales in high- and middle-level jobs. The size of the male sample of NHMLMS thenpredicts the non-manual labour force in Nairobi to be 62 413. The last published datafor male non-manual employment is for 1976 (Central Bureau of Statistics, 1963-77).This gives employment of 51 086, which suggests that as an estimate of employmentin 1978 the procedure is probably accurate to within 10 per cent. The resultingestimated employment by age and education is shown in Table 6.
TABLE 6Nairobi High- and Middle-level Male Employment
by Age and Education, 1978
Age Education
Form I-III Form 11/ Form VI University
Source: NHMLMS printout.
Both the labour supply and the employment estimates are subject to error. Thesupply figures are more accurate for 10-year than 5-year groups since the adjustmentfor aging and migration could only be done crudely. The resulting profiles look reason-able, however.6
The NDS does not distinguish between forms IV and VI. We shall make two alter-native assumptions: (a) that form VI leavers have employment priority over form IVleavers, so that the employment estimates for form VI leavers (Table 5) are equal to thelabour supply, and (b) that form VI leavers have the same employment opportunitiesas form IV leavers. Kenyan experience is likely to be somewhere between these twocases. These assumptions enable us to estimate the labour supply of form IV leaversresidually. In Table 7 we show the proportion of the labour force in white-collar
6 There is one massive discrepancy, namely that there is a large excess of employment oversupply of form IV and form VI educated males aged over 40, The explanation for this may lie inthe differing enumeration points of the NDS and the NHMLMS. In the former, young enumeratorswent to the home and asked about education characteristics of each member of the household. Inthe latter, highly educated young CBS employees enumerated at the place of work. lt is not un-likely that senior managers aged over 40 who in fact had only primary education, should, perhapsin the presence of their better educated junior employees, tend to overstate their educationalattainments.
20-24 125 9386 1877 -25-29 1406 8441 1082 216530-34 1895 6791 632 221135-39 1305 3913 326 260940+ 1550 12051 1205 3443

EDUCATION EXPANSION AND LABOUR MARKET ADJUSTMENT IN KENYA 41
TABLE 7Access to High- and Middle-level Employment by Age and Education
a See footnote 6, page 40.
employment by age for those with secondary education up to form IV. We haveassumed that all those with education above form IV had access to such employment(column a) or alternatively., that form VI leavers have the same opportunities as formIV leavers (column b). The change of assumption makes very little difference to theestimated proportions.
The results suggest that whilst the proportion of those with only partial secondaryeducation in white-collar employment is much lower for younger age groups, than forform IV leavers, whilst it falls with age, is high for all age groups. The change in theproportion by age cohort is an indication of past conditions in the labour market.Since unsuccessful young job seekers are likely to abandon Nairobi, however, thecohort 30-34 in 1978 has lost the unsuccessful job seekers of 1968 whilst the 20-24cohort in 1978 still contains the unsuccessful job seekers of 1968. This tends toproduce a spurious decrease in the proportion of form IV leavers in white-collar jobs inthe first two age cohorts, and particularly the 20-24 age cohort relative to the oldercohorts. For example, we know from the Kinyanjui tracer survey of 1968 of form IVleavers that 14 per cent were unemployed after 1 year. We also know that the un-employment rate among those aged over 30 is very low indeed. If the 20-24 cohort of1978 suffered the same 14 per cent unemployment as the same cohort in 1968 thenthe proportion of employed members of the cohort in white-collar jobs lies not in therange 5 1-54 per cent but in the range 59-63 per cent.7 Thus, in the 1960s perhapsbetween 80 and 90 per cent of form IV leavers who gained employment in Nairobigained white-collar jobs, and in the 1970s perhaps 60-65 per cent did.
51/(100-14) = 59;54/(100-14) = 63.
Age Education
Supply Employment Proportion in white-collar employment
Forms I-III20-24 10206 125 0.0125-29 7896 1406 0.1830-34 3828 1895 0.5035-39 2497 1305 0.5240+ 2243 1550 0.69
Form IV(a) (b)
20-24 18445 9386 0.51 0.5425-29 13677 8441 0.62 0.6230-34 8259 6791 0.82 0.8225-39 4491 3913 0.87 0.8740+ 3134 (12051)a

42 BULLETIN
Whilst the employment opportunities of those form IV leavers resident in Nairobihave not markedly deteriorated since the 1960s, the national output of form IVleavers has expanded enormously. The propensity of a non-Nairobi form IV leaver tomigrate to Nairobi in search of a job must therefore have declined. This can in factbe quantified by using data independent of the NHMLMS, in Table 8. Whereas 51 percent of form IV leavers had migrated to Nairobi in the period 1964-68, by 1973-76only 11 per cent of form IV leavers chose to migrate.
TABLE 8Migration Propensities of Form IV Leavers
a From Ministry of Education (1975), Table 20.b Using the proportion cited in Bigsten (forthcoming), Table XII; 2.c Unpublished data from Ministry of Education.d Nairobi growth rate 1962-9 correcting for boundary changes was 5.3 per cent pa (see Central
Bureau of Statistics (1972a), Table 1). The natural increase of the urban male population was1.99 per cent pa (Table 2A) so net migration 1964-8 was around 34 500 applying the growthrates for the períod 1962-9 to the sub-period 1964-8. The Rempel survey (Rempel, Harris andTodaro, 1970) found that 23 per cent of male migrants had form IV education. Applying this tothe net migration figure yields 7900 form IV migrants. This indirect procedure can be checkedagainst the Kinyanjui surveys 1965-8 which find a propensity of 0.56 (see Kinyanjui (1974),Table 3:10).
e The sum of the positive net migration flow 1969-73 for those aged over 20 is 38 000 (fromCollier and Lai (forthcoming), chapter 10, Table 4). In the period 1964-8 23 per cent of migrantshad form IV education whilst in the period 1969-77 as a whole this had risen to 27 per cent.We assume that for the sub-period 1969-73 the proportion was 25 per cent, yielding 9500 formIV migrants.Total form IV migration 1969-77 is 17 500 (from Collier and Lai (forthcoming), chapter 10,Table 8). That in the sub-period 1969-73 was 9500 (see note e above).
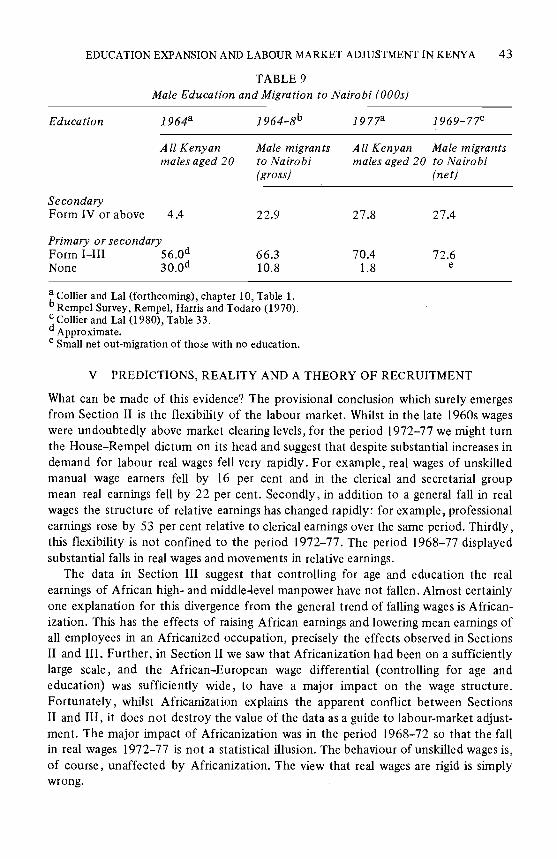
Finally, we investigate whether the reduced propensity of form IV leavers tomigrate was nevertheless sufficient to 'bump' out the less educated from job search.A reasonable proxy for this is the educational composition of male migrants. FromTable 9 it can be seen that whilst the share of form IV leavers did rise it was still onlya small component of total migration. The decline in the proportion of migrants withno primary education is mainly accounted for by the push towards universal primaryeducation.
1964-68 1969-73 1973-6
National output of leavers(000s) 545a 799a
Nairobi output of leavers(000s) 1o.Oc
Non-Nairobi output of leavers(000s) 15.7 47.7 69.9
Migrants with form IV (000s) 95e
Propensity of Non-Nairobi FormIV leavers to migrate toNairobi 0.51 0.20 0.11
Education
EDUCATION EXPANSION AND LABOUR MARKET ADJUSTMENT IN KENYA 43
TABLE 9Male Education and Migration to Nairobi (000s)
1964a 1964_8b 1977a
All Kenyan Male migrants All Kenyan Male migrantsmales aged 20 to Nairobi males aged 20 to Nairobi
(gross) (net)
a Collier and Lai (forthcoming), chapter 10, Table 1.b Rempel Survey, Rempel, Harris and Todaro (1970).c Collier and LaI (1980), Table 33.dApproximate.e Small net out-migration of those with no education.
V PREDICTIONS, REALITY AND A THEORY OF RECRUITMENT
What can be made of this evidence? The provisional conclusion which surely emergesfrom Section II is the flexibility of the labour market. Whilst in the late 1960s wageswere undoubtedly above market clearing levels, for the period 1972-7 7 we might turnthe HouseRempel dictum on its head and suggest that despite substantial increases indemand for labour real wages fell very rapidly. For example, real wages of unskilledmanual wage earners fell by 16 per cent and in the clerical and secretarial groupmean real earnings fell by 22 per cent. Secondly, in addition to a general fall in realwages the structure of relative earnings has changed rapidly: for example, professionalearnings rose by 53 per cent relative to clerical earnings over the same period. Thirdly,this flexibility is not confined to the period 1972-77. The period 1968-77 displayedsubstantial falls in real wages and movements in relative earnings.
The data in Section III suggest that controlling for age and education the realearnings of African high- and middle4evel manpower have not fallen. Almost certainlyone explanation for this divergence from the general trend of falling wages is African-ization. This has the effects of raising African earnings and lowering mean earnings ofall employees in an Africanized occupation, precisely the effects observed in SectionsII and III. Further, in Section II we saw that Africanization had been on a sufficientlylarge scale, and the African-European wage differential (controlling for age andeducation) was sufficiently wide, to have a major impact on the wage structure.Fortunately, whilst Africanization explains the apparent conflict between SectionsII and III, it does not destroy the value of the data as a guide to labour-market adjust-ment. The major impact of Africanization was in the period 1968-72 so that the fallin real wages 1972-77 is not a statistical illusion. The behaviour of unskilled wages is,of course, unaffected by Africanization. The view that real wages are rigid is simplywrong.
SecondaryForm IV or above 4.4 22.9 27.8 27.4
Primary or secondaryForm L-III 560d 66.3 70.4 72.6None 300d 10.8 1.8 e

44 BULLETIN
The data of Sections III and IV remain hard to reconcile with the standard 'bump-ing' migration and job-search model. Real earnings of young African form IV leaverswho gain access to good jobs have not fallen despite a massive increase in supply. Thiswould imply institutionally determined wage rigidity. Such wage rigidity for form IVleavers, however, is implausible in the face of general wage flexibility. Further, the'bumping' model would predict that wage rigidity would be combined with the dis-placement of the less educated by form IV leavers throughout the range of formalsector job search. Yet the evidence is that such displacement has not occurred. Instead,the proportion of form IV leavers who migrate to Nairobi has fallen so sharply thatthose who do migrate still have a very good prospect of a non-manual job.
The facts throw up a series of paradoxes. If education is a selection criterion whyhas not more 'bumping' occurred; if it is not, why are the educated paid so much morethan the less educated? Since wages are flexible why have the earnings of form IVleavers not fallen in response to the huge expansion in supply? Why is Nairobi notcongested with form IV leavers who are either unemployed or in manual employment:i.e. why has the propensity to migrate borne all of the adjustment instead of adjust-ment being shared with the probability of access? Perhaps we have missed somethingout?
Consider just this possibility, for indeed there are some employee characteristicssuch as willingness to work and examination grade which are both economicallyproductive and observable by firms at the time of employee recruitment yet arenormally unobserved by those compiling socioeconomic statistics. Other productivecharacteristics, such as skills and level of education are observable both by the firmand the economist. Might the omission of the former characteristics bias economicanalysis?
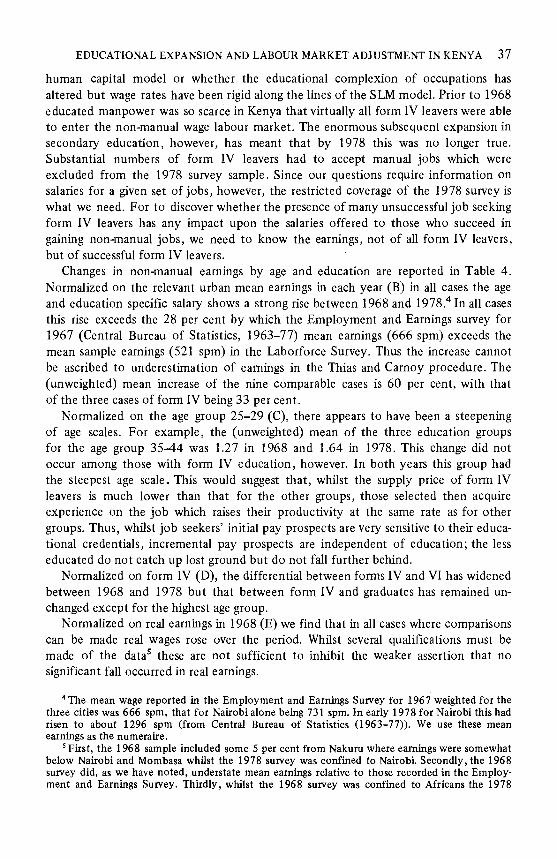
In Fig. 1 the horizontal axis denotes a ranking of some particular characteristicunobservable to the economist, say willingness to work (Z). The schedule Z(W)denotes the maximum mean willingness to work which can be achieved by selectionof recruits for a given quantity of recruitment of labour in efficiency units. The higherthe wage (W) the more applicants come forward and the higher the selection standardswhich may be imposed. The schedule APL(Z) denotes, for a given quantity of
Z (W) APL(Z)
Fig. 1.

EDUCATION EXPANSION AND LABOUR MARKET ADJUSTMENT IN KENYA 45
recruitment and employment in efficiency units of labour, the average productivityof recruits as a function of their willingness to work. The negative second orderderivative of this function denotes diminishing returns to this characteristic. Theprofit maximization problem facing the firm for any given recruitment requirementin efficiency units is to maximize q = APL(Z) - Z(W) with respect to Z. Clearly, thisoccurs at Z where the first order derivatives are equal, the firm paying the wage Win order to secure this level of Z.
In some occupations, the cost of monitoring productivity is so high as to preventthe introduction of piece-rates. In this case, regardless of variations in willingness towork among recruits, all recruits will receive the wage W. Where the firm is free tovary the wage in line with variations in productivity there will be a dispersion of wagesassociated with the dispersion in marginal products of different qualities of labour,but the cost minimizing mean wage will remain at W.
Consider a supply change in the labour market. Suppose that firms require a givenlevel of educational attainment in addition to willingness to work. An expansion inthe educational system relative to employment opportunities will shift the Z(W)curve to the right since a given wage will attract a larger pool of applicants (see Fig.2). The increase supply of those with education enables the firm to be more selective
Fig. 2.
with respect to the other characteristics of candidates for recruitment. Thus, thewage required to attract a sufficiently large or hard-working pool of applicants for thefirm to recruit on average high.Z applicants, will fall. The reservation price at whicheducated labour will transfer its search to lower level occupations, however, is under-pinned by the income level in these occupations. As a result, the wage required torecruit on average low-Z applicants will fall by less than that required to recruithigh-Z applicants. Even if the percentage fall in the wage required in the two caseswas the same, the absolute fall would be greater for the high-Z applicants. Hence, theZ(W) curve flattens as well as shifting. The flatter the Z(W) curve the more rewardingfor the firm is an increase in mean wages in terms of increased willingness to work ofrecruits. Hence, an increased supply of educated labour may be associated with anincrease in or stability of the wage at which such labour is recruited. This situation, in

46 BULLETIN
which firms are displaying rational cost minimization, is characterized by an apparentdownwards wage rigidity in the face of increased supply ofjob seekers and is thereforeeasy to confuse with a market imperfection.
Both job seekers and firms might or might not be able to identify at the time ofrecruitment these characteristics unobserved by the economist. Consider first acharacteristic such as examination grade. This information is known both by theemployer and the applicant at the time of recruitment. If potential applicantscorrectly perceive the critical grade below which employers refuse the job applicationthen wage differentials will not induce job search unemployment. Only to the extentthat job seekers are misinformed or employers depart from their recruiting conven-tions will there be an excess supply of unsuitable applicants.
The account is at least compatible with the behaviour of the labour market forform IV leavers. The enormous increase in supply enabled employers to discriminateby grade. If employers did this, it would have put upward pressure on wages, off-setting the downward pressure of increased supply. Thus it would explain theresilience of earnings by education. lt would also explain why the propensity of formIV leavers to migrate to Nairobi fell so drastically, whilst those who did migrate foundlittle difficulty in gaining access to good jobs. The consequence would be that, sincethe grade is achieved in a non-repeatable examination, the returns to form IV educa-tion would have fallen without an increase in job search unemployment. The theoryfits the facts but is there any direct evidence for it?
There is powerful evidence of the introduction of screening by grade. For example,in 1974 the government formally raised its minimum recruitment standards for high-and middle-level positions to form IV grade 3 where previously no grade had beenspecified.
The Ministry of Labour's Annual Report noted in 1972 'nearly all employers areasking for good passes [in EACE] . . . and it is easy to place these good passes'. Againin 1974 the Annual Report noted 'problem areas continue to be form IV low grades-those below Division 2. Form IV Divisions 3, 4 and Fail may have to compete withother job seekers for unskilled jobs'. Evidence that those with low grades knew thátthis process was happening and revised their plans for job search accordingly is pre-sented in Table 10.
Sample surveys for 1968, 1970 and 1974 show the unemployment rate by graderelative to the unemployment rate for all form IV leavers in Nairobi. In 1968 Failureshad the highest unemployment rate, followed by those with Division 4. By 1970Failures had a relatively low unemployment rate and Divisions 4 and 3 shared thehighest rate. By 1974 Failures had the lowest unemployment rate of all grades,Division 4 unemployment had fallen relative to 1972 and the incidence of unemploy-ment was strongly peaked amongst those with Division 3. Thus, those with poorgrades perceived their poor chances of gaining non-manual wage employment and didnot attempt job search unemployment.
Having considered the case in which a characteristic is known by both employersand job seekers prior to recruitment, we now turn to those characteristics whichneither employers nor applicants can measure accurately upon recruitment, such aswillingness to work. Unobservable characteristics are most likely to predominate over

EDUCATION EXPANSION AND LABOUR MARKET ADJUSTMENT IN KENYA 47
TABLE 10Unemployment Prospects by Examination Performance, 1968-74
Sources: Kinyanjui (1974), and Ministry of LabourAnnualReports, 1970 and 1974.For derivation see Collier and Lai (forthcoming), chapter 14, Table 11.
observable characteristics in occupations which require few readily testable skills. Themajor occupation with these features is unskilled manual labour. In such occupationswe might expect firms to recruit employees for a probationary period during whichcharacteristics unobservable upon recruitment could be identified. Since lazy proba-tioners will not be retained in the permanent workforce, however, the mean pro-ductivity of probationers will be lower than that of the permanent workforce. Thefirm might therefore have a separate recruitment grade with a lower wage rate than thepermanent workforce.
This account appears to describe well the relationship between the casual andregular unskilled manual labour markets. Commonly, firms will recruit to the regularunskilled labour force from among their casual workers rather than from off the street.Further, casual workers have considerably lower wages than regular unskilled manualemployees. Common practice is for casual workers to be paid only the minimum wage,whilst in 1977, for example, the mean wage of unskilled manual regular employeeswas28 per cent above the minimum wage. Such a wage premium is otherwise ratherpuzzling. Since regular employees possess greater job security than casual employeeswe would expect that, in the absence of institutional factors, if characteristics wereidentical, regular employees would earn less than casual employees. If, however, weattribute the earnings premium of regular workers to an institutional distortion suchas union negotiated wage rates, we might expect that, over time, firms would casualizetheir unskilled labour force. Yet this has not happened: the proportion of the un-skilled manual labour force in casual employment was 22 per cent in 1964 and 23 percent in 1977.
Clearly, one explanation for the observed earnings differential is that regularworkers, although classified as 'unskilled', have more on-the-job experience thancasual workers. Our additional explanation is, however, that the wage differentialreflects the difference in 'unobserved' characteristics between probationâry andpermanent workers.
The role of the casual employment contract as a probationary period for manuallabour has an important implication which offers an explanation of a remaining
Score/grade Relative unem ploy men t prospect (percentagein unemployment/percen tage in lab ourforce)
1968 1970 1974
1-19 1 0 0.08 0.2220-29 2 0 0.54 0.9030-39 3 0.49 1.78 1.9540-49 4 1.13 1.78 1.1350-54 Fail 2.16 0.62 0.19All 1.0 1.0 1.0

48 BULLETIN
paradox. Because of their ability to gather information on potential regular employeesthrough a probationary period, firms do not generally need to impose a crude proxyfor unobserved characteristics by using education as a screening device for unskilledlabour. The absence of education as a screen for unskilled labour explains the failureof form IV leavers to 'bump' primary school leavers out of the urban wage labourmarket and is therefore consistent with the continued flow of primary school leaversto Nairobi documented in Table 9.
VI CONCLUSION
The experience of the Kenya labour market has been shown to be at variance bothwith conventional descriptions of that market and with the predictions of theoriesinspired by casual observations of its features. Neither the level of wages nor thewages structure has been rigid in the 1970s. Form IV leavers appear not to have'bumped' primary school leavers out of the urban labour market. In the face ofconstant or rising real wages for form IV leavers their propensity to migrate fell sodrastically that non-manual employment access for those who did migrate remainedeasy.
We have suggested that the explanation for the gulf between prediction and realityis that, by ignoring what they cannot observe, economists have produced biasedmodels of the recruitment process. A more realistic account of recruitment yieldspredictions consistent with Kenyan experience. Our proposed model, whilst potenti-ally compatible with either the screening or human capital frameworks, is clearly in-compatible with currently accepted models within those frameworks. The supplychange of form IV leavers induced neither bumping nor wage changes. Further, theimplications of our model for the interactions between educational and employmentexpansion are sufficiently different from those of the current 'bumping' and humancapital models to cast doubt on their utility in the evaluation of education policy.
Institute of Economics and Statistics, Oxford.Institute for Development Studies, Nairobi.
REFERENCES
Bigsten, A. (forthcoming). Regional Inequality and Development: A Case Study ofKenya, Department of Economics, Gothenburg, Farnborough, Gower.
Central Bureau of Statistics (1963-77). Employment and Earnings (annual), Nairobi,Government of Kenya.
Central Bureau of Statistics (1960-77). StatisticalAbstract (annual), Nairobi, Govern-ment of Kenya.
Central Bureau of Statistics (1969). Census 1969, Nairobi, Government of Kenya.Central Bureau of Statistics (1972a). Kenya Statistical Digest, Vol. X, No. 3,
September.Central Bureau of Statistics (l972b). Kenya Statistical Digest, Vol. X, No. 4,
December.

EDUCATION EXPANSION AND LABOUR MARKET ADJUSTMENT IN KENYA 49
Central Bureau of Statistics (unpublished). 1977 National Demographic Survey, CBSprintout.
Central Bureau of Statistics (1973). Demographic Baseline Survey Report, Nairobi,Government of Kenya.
Central Bureau of Statistics (1976). Demographic Working Paper No. 1, Nairobi,Government of Kenya.
Central Bureau of Statistics (1976). Demographic Working Paper No. 3, Nairobi,Government of Kenya.
Central Bureau of Statistics (1977). Integrated Rural Survey I, 19 74/5, Nairobi,Government of Kenya.
Collier, P. (1979). 'Migration and Unemployment: A Dynamic General EquilibriumAnalysis Applied to Tanzania',Oxford Economic Papers, July.
Collier, P. and Lai, D. (1980). Poverty and Growth in Kenya, IBRD Working PaperNo. 389, January.
Collier, P. and Lai, D. (forthcoming). Coercion, Compassion and Competition: Wageand Employment Trends and Structures in Kenya 1800-1980, IBRD.
Fields, G. S. (1974). 'The Private Demand for Education in Relation to Labour MarketConditions in Less Developed Countries' ,Economic Journal, Vol. 84, No. 336.
Harris, J. R. and Todaro, M. P. (1970). 'Migration, Unemployment and Development:A Two Sector Analysis',American Economic Review, Vol. 60, No. 1.
House, W. S. and Rempel, H. (1978). The Kenya Employment Problem: An Analysisof the Formal LabourMarket, Nairobi, Oxford University Press.
International Labour Office (1972). Employment Incomes and Equality: A Strategyfor Increasing Productive Employment in Kenya, Geneva.
Kinyanjui, K. (1974). In Court, D. and Ghai, D. (eds). Education,SocietyandDevelop-ment, Nairobi, Oxford University Press.
Ministry of Education (1975). AnnuaiReport, Nairobi, Government of Kenya.Ministry of Economic Planning (1970). High-level Manpower 1964-70, Nairobi,
Government of Kenya.Rempel, H., Harris, J. and Todaro, M. (1970). Rural-Urban LaborMigration: a Tabula-
tion of Responses to the Questionnaire used in the Migration Survey, IDS Discus-sion Paper 92, Nairobi.
Thias, H. H. and Carnoy, M. (1972). Cost-Benefit Analysis in Education: a Case Studyof Kenya, IBRD, Washington.