Embed Size (px)
Citation preview
HAL Id: hal-00550175https://hal.archives-ouvertes.fr/hal-00550175
Submitted on 24 Dec 2010
HAL is a multi-disciplinary open accessarchive for the deposit and dissemination of sci-entific research documents, whether they are pub-lished or not. The documents may come fromteaching and research institutions in France orabroad, or from public or private research centers.
L’archive ouverte pluridisciplinaire HAL, estdestinée au dépôt et à la diffusion de documentsscientifiques de niveau recherche, publiés ou non,émanant des établissements d’enseignement et derecherche français ou étrangers, des laboratoirespublics ou privés.
A modified servo-hydraulic machine for testing atintermediate strain-rates
Ramzi Othman, Pierrick Gu’Egan, Georges Challita, Franck Pasco, DanielLebreton
To cite this version:Ramzi Othman, Pierrick Gu’Egan, Georges Challita, Franck Pasco, Daniel Lebreton. A modifiedservo-hydraulic machine for testing at intermediate strain-rates. International Journal of ImpactEngineering, Elsevier, 2008, 36 (3), pp.460-467. �10.1016/j.ijimpeng.2008.06.003�. �hal-00550175�

Please cite this article as: Othman R, Gu´egan P, Challita G, Pasco F, LeBreton D. A modified servo-hydraulic machine for testing at intermediate strain-rates, International Journal of Impact Engineering (2008), doi: 10.1016/j.ijimpeng.2008.06.003
This is a PDF file of an unedited manuscript that has been accepted for publication. As a service to our customers we are providing this early version of the manuscript. The manuscript will undergo copyediting, typesetting, and review of the resulting proof before it is published in its final form. Please note that during the production process errors may be discovered which could affect the content, and all legal disclaimers that apply to the journal pertain.
Accepted Manuscript
Title: A modified servo-hydraulic machine for testing at intermediate strain-rates
Authors: Ramzi Othman, Pierrick Gu´egan, Georges Challita, Franck Pasco, Daniel LeBreton
PII: S0734-743X(08)00122-X
DOI: 10.1016/j.ijimpeng.2008.06.003
Reference: IE 1604
To appear in: International Journal of Impact Engineering
Received Date: 28 June 2007
Revised Date: 9 June 2008
Accepted Date: 10 June 2008

TPIRCSUNAM DETPECCA
ARTICLE IN PRESS
A modified servo-hydraulic machine for
testing at intermediate strain-rates
Ramzi Othman a, Pierrick Guegan a, Georges Challita a,b,
Franck Pasco a, Daniel LeBreton a
aInstitut de Recherche en Genie Civil et Mecanique, Ecole Centrale de Nantes, 1
Rue de la Noe BP 92101, 44321 Nantes cedex 3, France
bDepartement de Mecanique, Faculte de Genie Branche 2, Universite Libanaise,
Beyrouth Liban.
Abstract
Assessing the mechanical properties of materials at intermediate strain rates (1-
200/s) is one of the major concerns in impact engineering. Servo-hydraulic machines
are usually used at this range of strain rates. However, detrimental oscillations
appear on the measured load for strain rates above 10/s. In this paper, we present
a modified servo-hydraulic machine. The load is measured by a Hopkinson bar-like
technique. Besides, the BCGO wave separation method is used to overcome the
limited test duration problem. Moreover, the strain in the sample is measured using
Digital Speckle Photographs (DSP) which are captured via high-speed video camera.
This modified machine is an equivalent and alternative solution to the slow bar
technique. It is applied to aluminium 2017 T4 alloy at strain-rates of approximately
100/s. Compared to the piezoelectric force sensor, the Hopkinson bar-like method
gives less-oscillating signals. The sample attaching device is also taken into account.
It is considered as a rigid mass. This simple assumption is valid up to strain-rates
Preprint submitted to Int. J. Impact Eng. 27 June 2008

TPIRCSUNAM DETPECCA
ARTICLE IN PRESSof some hundreds per second.
Key words: Intermediate strain rate, wave separation, Servo-hydraulic machine,
Hopkinson bar, Aluminium.
PACS:
1 Introduction
In several engineering applications, such as crashworthiness, anti-seismic pro-
tection [1] and dynamic forming processes [2], materials may be subject to in-
termediate strain rates (1-200/s). The choice of material constitutive equations
and the identification of the model parameters depend on the measurement
of mechanical properties at these strain rates. However, no reliable technique
exists at this range of strain rates.
Conventional quasi-static machines are valid up to strain rates of 0.1/s. Split
Hopkinson bar (SHB) method is applied to tests at strain rates ranging from
200 to 5000/s. Servo-hydraulic machines have been regarded as a solution to
characterisation of materials at intermediate strain rates. Nevertheless, mea-
surements are distorted by the inertia and elastic response of the experimental
set-up. The measured load exhibits some oscillations which are due to the natu-
ral frequencies of the experimental structure [2]. Consequently, servo-hydraulic
machines give reliable measurements only at strain rates lower than 10/s [3].
Alternatively to servo-hydraulic machines, dropweight towers can be used to
generate data at intermediate strain-rates [4–9]. However, the load is measured
Email address: [email protected] (Ramzi Othman).
2

TPIRCSUNAM DETPECCA
ARTICLE IN PRESSwith a piezoelectric force sensor [3] as in servo-hydraulic machines. Unless
special care is paid to the design of the load cell or to the processing of load
cell signals, large oscillations appear [1,10]. These oscillations may be large
enough to obscure the real force applied to the specimen [3]. Therefore, drop-
weight towers are generally applied to the measurement of the crash response
of structures [10,11].
The elastic response of the experimental set-up is one of the major problems
in dynamic tests. The main asset of the SHB technique is the simplicity of
the experimental set-up: two (visco-)elastic bars. Therefore, the (visco-)elastic
response is simply and finely taken into account. The SHB is limited to high
strain rates, on account of the limited test duration. Assuming that the sam-
ple is deformed at a constant strain rate ε, the maximum recorded strain is
therefore εmax = εΔt, where Δt is the test duration. For conventional SHB the
test duration is rarely above 500μs. Hence, at a mean strain rate of 100/s, the
maximum measured strain is 5%. This leads many authors [12–25] to develop
wave separation techniques which increase the test duration.
A second problem is also encountered in intermediate strain rate tests with
SHB. Indeed, low impact velocities of the striker are needed. This yields low
kinetic energy in the striker which is not sufficient to induce large strains in
the sample. Thus, an alternative loading technique is required. A hydraulic
jack is proposed in [15,26–28]. It applies a continuous load during the test
duration. Alternatively, LeBlanc & Lassila [3] proposed a hybrid technique
which combines the loading capabilities of a servo-hydraulic machine and the
measurement technique of a Hopkinson bar. The assets of this method are:
(i) continuous loading during the test which supplies the sufficient energy to
induce important strain in the sample at intermediate strain rates and (ii)
3

TPIRCSUNAM DETPECCA
ARTICLE IN PRESSa reliable force and consequently stress measurement. However, in this work,
only one gauge station is used on the bar (regarded as an output bar in a SHB
technique). The gauge station is not far from the sample-bar interface. There-
fore, the test duration is approximately twice the duration of a conventional
SHB, i.e., no more than 1ms, that is not enough yet.
To maximize the test duration, Quirion & Lesaffre [29] proposed the appli-
cation of a wave separation technique to servo-hydraulic machines. They in-
strumented the anvil with two gauges stations. They recovered the force using
the wave separation technique developed in [12,13]. However, two problems
were not considered. The first one is that the Lundberg-Henchoz-Yanagihara
method [12,13] neglects wave dispersion. The anvil has a diameter of 22mm.
Consequently, geometry effects on wave dispersion are important and can not
be neglected. Thus, an alternative wave separation technique, which takes
into account wave dispersion, should have been used. The second problem is
relative to the strain measurements. The gauge stations are cemented approx-
imately 30mm from the anvil ends which was only 1.36 times the diameter.
Thus, the assumption of one-dimensional propagation of waves was not valid.
Indeed, it is usually recommended to record strain at distances above 10 times
the diameter.
In this paper, the hybrid technique of LeBlanc and Lassila [3] is improved by
using a wave separation technique. Consequently, the test duration is highly
increased. Instead of wave separation techniques one can use an inverse ap-
proach as proposed in [2,30]. Nevertheless, this approach has some drawbacks:
(i) it needs a parametric formulation of the recovered load; (ii) it is time
consuming compared to wave separation techniques; (iii) it is based on an op-
timisation problem which could yield a local minimum and not a global one.
4

TPIRCSUNAM DETPECCA
ARTICLE IN PRESSHence, the obtained solution has not usually a physical sense because of (i)
and (iii).
This paper aims at applying a long duration Hopkinson bar method to servo-
hydraulic machines. Therefore, a wave separation method is needed. In the
following section, a critical review of wave separation techniques is presented.
The objective of this section is to figure out the best method. In the section
3, we describe, how the selected method, can be applied to servo-hydraulic
machines. The fourth section, gives results obtained with this new technique
on aluminium 2017 T4 alloy. Less-oscillating load measurements are obtained.
Furthermore, the test duration restraint is subdued.
2 Critical review of wave separation techniques
Let us consider a straight uniform visco-elastic bar. We denote
ε(x, ω), V (x, ω) and N(x, ω) the Fourier transforms of the strain ε(x, t),
the particle velocity V (x, t) and the force N(x, t), respectively, at any
cross-section x. Assuming a one-dimensional wave propagation and
taking into account the 3D geometric effects on the wave dispersion,
these Fourier transforms are given by:
ε(x, ω) = F (ω)e−iξ(ω)x +D(ω)eiξ(ω)x (1)
V (x, ω) =ω
ξ(ω)
(−F (ω)e−iξ(ω)x +D(ω)eiξ(ω)x
)(2)
N(x, ω) = E(ω)A(F (ω)e−iξ(ω)x +D(ω)eiξ(ω)x
)(3)
where x, A, E(ω), ξ(ω), F (ω) and D(ω) are the position of the consid-
ered cross-section, the cross-sectional area of the bar, the complex
5

TPIRCSUNAM DETPECCA
ARTICLE IN PRESSYoung’s modulus, the wave dispersion relation, the forward wave
and the downward wave, respectively.
Eqs. (1-3) mean that the force and the particle velocity can be recov-
ered at any cross-section of the bar if the four following frequency-
dependent functions are known: E(ω), ξ(ω), F (ω) and D(ω). Fortu-
nately, the two former functions are characteristics of the bar and
have to be determined just once. Furthermore, the two waves F (ω)
and D(ω) can be recovered from a reduced number of measurements
on the bar. Two equations should be sufficient to do so, since we
have only two unknown functions: F (ω) and D(ω). Therefore, the
strain is measured at two different cross-sections, say x1 and x2.
Two equations can be derived from Eq. (1):
ε1(ω) = ε(x1, ω) = F (ω)e−iξ(ω)x1 +D(ω)eiξ(ω)x1 , (4)
ε2(ω) = ε(x2, ω) = F (ω)e−iξ(ω)x2 +D(ω)eiξ(ω)x2 , (5)
where ε1(ω) and ε2(ω) are the Fourier transforms of the measured
strain at the two cross-sections. If these two equations are indepen-
dent, we can simply calculate the two waves, as suggested in [15].
Unfortunately, the determinant of Eqs. (4-5) could be equal to zero
(for elastic bars) or nearly be equal to zero (for viscoelastic bars).
In the case of elastic bars, the determinant of Eqs. (4-5) equals zero
for a set of resonant frequencies defined by
Ωe = {ωn; ξ(ωn)(x2 − x1) = nπ, ∀n ∈ IN} . (6)
In the case of a viscoelastic bar, the set of resonant frequencies is theoretically
6

TPIRCSUNAM DETPECCA
ARTICLE IN PRESSreduced to Ωv = {0}. However, the denominator has a low value for all the
other frequencies in Ωe.
Using the one-dimensional wave equation for rods, Lundberg & Henchoz [12]
and Yanagihara [13] developed independently a time domain solution. The
main limitation of this method is that it does not take into account wave
dispersion effects. Therefore, it is limited to slender elastic bars. Zhao
and Gary [14,15] proposed a method which takes into account wave
dispersion. It uses also two strain measurements. In this method,
each measured strain is split into time intervals to operate suc-
cessive shifting. The length of each interval is equal to twice the
time needed by the wave to go from one gauge to the other. This
time depends on the wave velocity which is frequency-dependent.
Therefore, the interval length should depend on frequency. However,
in the Zhao and Gary works [14,15], this time is inevitably taken
frequency independent. As the method is iterative, errors will cu-
mulate. Consequently, its validity is limited to approximately some
hundreds of iterations. The test duration is considerably increased
(it can reach 200ms) but still limited.
The solutions presented in [12–15] did not thoroughly take into account wave
dispersion. Hence, Bacon [16] suggested the use of a hybrid method to subdue
this problem. The wave separation was performed in the frequency and time
domain. Since the problem with Eqs. (4-5) concerns only the frequencies that
are in Ωe, Bacon applied these two equations to the frequencies ω /∈ Ωe. For
the resonant frequencies (ωn ∈ Ωe), he used a time solution which is equivalent
to the solution presented in [12,13]. Thus, this method overcomes the problem
with resonant frequencies and includes wave dispersion effects. In line with
7

TPIRCSUNAM DETPECCA
ARTICLE IN PRESSthis work, Zhao & Lok [21] deal separately with the resonant frequencies.
On one hand, they used also Eqs. (4-5) outside Ωe. On the other hand, the
frequencies ωn ∈ Ωe, F (ωn) and D(ωn) are undefined fractions of type 0/0.
Hence, F (ωn) and D(ωn) are calculated using the Hopital’s rule. The method
presented in [16] recovers the two elementary waves in the resonant frequencies
by an iterative method. Therefore, it is time consuming. On the contrary, the
method proposed in [21] is a direct frequency method. Nevertheless, it uses
numerical differentiation of measured signals. This amplifies errors mainly at
high frequencies. The maximum test duration presented in [16] is 6ms and in
[21] is 2ms. To solve the problem of dependency in Eqs. (4-5), Bussac et al.
[19,20] proposed the integration of Fourier transforms in the lower half-plane
of the frequency complex space (=(ω) ≺ 0). This numerical tool is possible
because the Fourier transforms of the measured strains ε1(ω) and ε2(ω) are
analytical bounded functions in the lower frequency half-plane. Moreover,
the wave dispersion relation is assumed to be an analytical function in the
same half-plane and maps this half-plane to itself.
The wave separation methods presented in [16,22] and the first method pre-
sented in [20] use only two strain measurements. This would be enough if the
measured strains were perfectly free from noise, which is impossible in actual
experimental situations. Besides, these methods, as deconvolution techniques,
are an ill-posed problem. Consequently, initial noise is amplified when re-
building the force and the particle velocity [18]. It was concluded in [18]
that initial noise is highly amplified by the recovering process in the
neighbourhood of the resonant frequencies. It was then suggested in
[19,20,24] the use of redundant measurements. Jacquelin & Hamelin
[24] presented a 3-strain method. It assumes a particular relation
8
TPIRCSUNAM DETPECCA
ARTICLE IN PRESSbetween the strain gauge positions. Bussac et al. [19,20] proposed
the analysis of the measured strains, and eventually velocities, by
the maximum of likelihood method. They assumed that the exper-
imental noises are white, Gaussian and two-by-two independent.
This method, called also BCGO method, is shown to be the most
insensitive to noise in [24].
Alternatively to the redundant measurements techniques, Casem et
al. [23] proposed the use of one strain and one velocity measure-
ment at the same cross-section. The two measurements give two
independent equations for all frequencies. Hence, the initial noise is
less amplified.
To summarize, the two-strain methods are noise sensitive [12–18,21,22]. In
more general case, unless one strain and one velocity measurement are recorded
at the same cross-section, two-measurement (strain or velocity measurements)
techniques amplify noise. To reduce noise effects, one can either use one strain
measurement and one velocity measurement at the same cross-section [23] or
take advantage of redundant measurements [20,24]. In this paper the BCGO
method is used for the measurement of the load applied by the servo-hydraulic
machine because of its multiple assets which comply with situation under
study. These assets can be summarised as follows:
(1) It is the most noise-insensitive wave separation technique.
(2) Wave dispersion effects are taken into account.
(3) It does not give rise to any restraint on the test duration (the test duration
is increased to some seconds [26] which is some thousand times more
than the duration of a conventional SHB).
9

TPIRCSUNAM DETPECCA
ARTICLE IN PRESS(4) It can be used with strain and (or) velocity measurements.
(5) The error on measurements can be taken into account individually, i.e., if
the measurements have different noise levels, a weight inversely propor-
tional to the noise level can be attributed to each measurement. There-
fore, the less-noisy measurements contribute more than the others to the
recovered force and velocity [19].
(6) The accuracy of the method can be highly improved by increasing the
number of the redundant measurements.
The BCGO method will be detailed in the subsection 3.3.
3 Testing with modified servo-hydraulic machine
3.1 Experimental set-up
An MTS 819 servo-hydraulic machine, with maximum force capacity of 25 kN
and maximum velocity of 16 m/s, is used. In the standard configuration, a
piezoelectric force sensor is fixed on the upper cross head of the machine (Fig.
1a). For low strain rate tests (ε ≺ 10/s), this sensor gives reliable measure-
ments. However, for higher strain rates the force measurement is degraded
by oscillations which are induced by the elastic response of the machine [2].
To overcome this problem, an alternative force measurement is proposed (Fig.
1b). A steel bar, 0.82m in length and 16mm in diameter, is attached
to the upper cross head of the machine. Three gauge stations are
cemented on the bar at x1 = 0.2m, x2 = 0.38m and x3 = 0.64m, where the
x-origin is taken at the cross-head. The first and the third gauges are 200mm
and 180mm away from the bar ends, respectively. These gauge positions en-
10

TPIRCSUNAM DETPECCA
ARTICLE IN PRESSsure that the measured strains are in accord with the one-dimensional wave
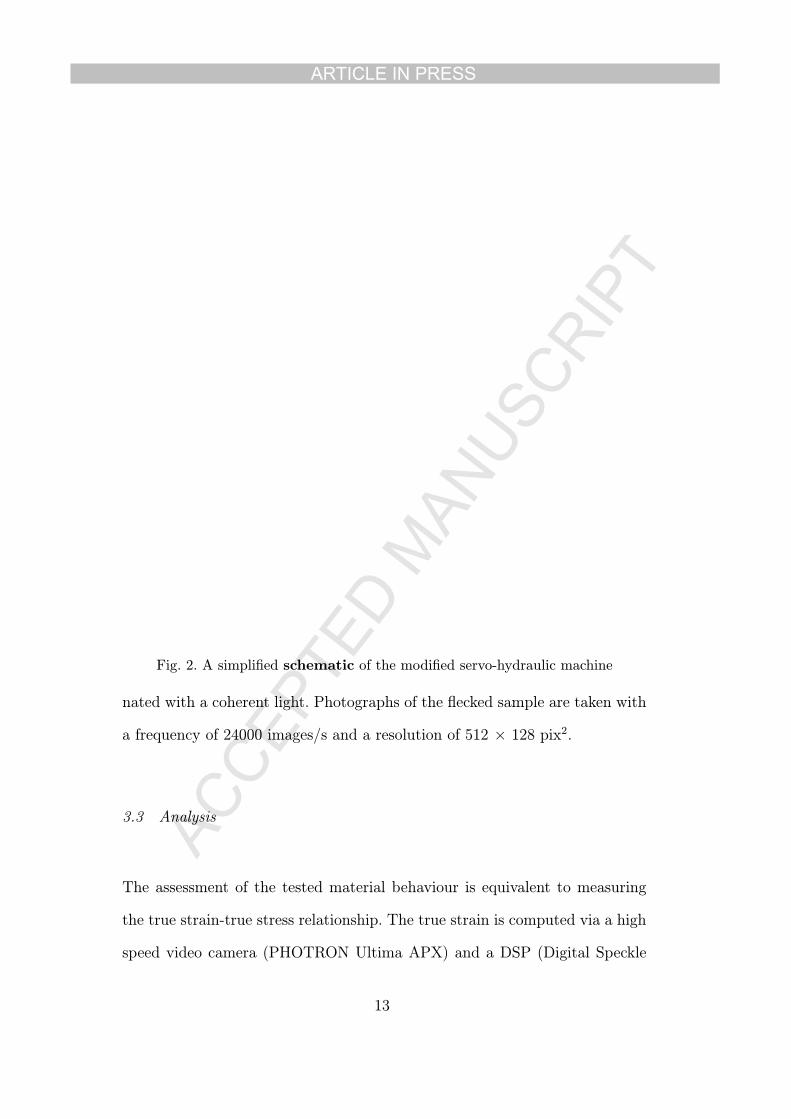
propagation theory. A simplified schematic of the new set-up is given in Fig.
2.
3.2 Experimental procedure
Firstly, the strain gauges are calibrated on the SHB set-up. The three-gauge-
MTS bar is shot by a 200mm long striker at an impact velocity of approxi-
mately 10m/s. The nominal force should be Nnom = EbAbVs/2c0 where Eb, Ab,
Vs and c0 are the bar Young’s modulus, the bar cross-sectional area, the im-
pact striker velocity and the sound velocity of the bar, respectively. Let Ui be
the nominal voltage measured on the ith gauge, the calibration coefficient for
the same gauge is αi = EbAbVs/2c0Ui. This calibration test is repeated three
times. The mean values are α1=41580 N/V, α2=41746 N/V and α3=41018
N/V. In the case of our study the calibration procedure was done just once.
After the calibration step, the bar is mounted on the upper cross head.
At the same time, a speckle pattern is painted on each specimen. After 20
minutes the specimen can be tested.
The specimen to be tested is attached to the bar and to the lower cross head
via two identical attaching devices(Fig. 1b). One attaching device is screwed
on the lower end of the bar and the other is screwed on the lower cross
head. The specimen is fixed to each device by two cap screws. A couple of
approximately 30 N.m is applied to each screw.
All measurements, gauges and video camera, are synchronised. The trigger is
given by the start-up of the lower cross head. The flecked sample is illumi-
11

TPIRCSUNAM DETPECCA
ARTICLE IN PRESS
Pie
zo-e
lect
ric
forc
e se
nso
r (f
ixed
on
th
e u
pp
er c
ross
hea
d)
Tes
t sp
ecim
en
and
fix
ing
sys
tem
Lau
nch
sys
tem
Sti
ck o
f h
ydra
ulic
jack
Hig
h s
pee
d v
ideo
ca
mer
a fo
r s
trai
n
mea
sure
men
t
Ten
sile
lo
ad
Inst
rum
ente
d b
ar
(mo
un
ted
on
th
e u
pp
er c
ross
hea
d)
Tes
ted
sp
ecim
en
and
fix
ing
dev
ice
Ten
sile
load
Ele
ctri
cal w
ires
lin
kin
g t
he
gau
ge
stat
ion
s to
th
e ac
qu
irin
g s
yste
m
Fig. 1. Experimental set-up: (a) original set-up with piezoelectric force
transducer, and (b) modified set-up with instrumented bar
12
TPIRCSUNAM DETPECCA
ARTICLE IN PRESS
Fig. 2. A simplified schematic of the modified servo-hydraulic machine
nated with a coherent light. Photographs of the flecked sample are taken with
a frequency of 24000 images/s and a resolution of 512 × 128 pix2.
3.3 Analysis
The assessment of the tested material behaviour is equivalent to measuring
the true strain-true stress relationship. The true strain is computed via a high
speed video camera (PHOTRON Ultima APX) and a DSP (Digital Speckle
13

TPIRCSUNAM DETPECCA
ARTICLE IN PRESSPhotographs) technique. Photographs are taken each 41.67μs. A small region
(the useful region) in the middle of the specimen photography taken at a
time t is compared to the same region of a reference photography (taken at
t = 0). Then a digital cross-correlation algorithm is applied to the two selected
regions [10] and calculates the in-plane displacement field. The nominal and
true (logarithmic) longitudinal strain are then deduced from the displacement
field using the conventional relation of continuum mechanics. In our study,
the recorded photographs are analysed by the ICASOFT software developed
at INSA Lyon [31].
The true stress in the sample is deduced from the force measurement assuming
volume conservation. The BCGO method is applied to recover the force at
the end of the bar (where the specimen is attached) from the three strain
measurements. Below, we will give a brief introduction to this method. For
a full development of this technique, the reader is referred to [19,20,26].
First, we assume that N strain measurements (εj(t), j = 1, .., N) are recorded
at xj, j = 1, .., N (N > 2). These measurements are subject to noise. Noises are
assumed to be statistically independent Gaussian white noises with the same
variance. This hypothesis was checked by Othman [26]. The maximum of
likelihood functional is then proportional to the functional F , which
is given by:
F =+∞∫
−∞
N∑
j=1
(εj(t)− ε(xj, t))2dt. (7)
Using Parceval relation and Eq. (7), one obtains:
F =+∞∫
−∞
N∑
j=1
∣∣∣εj(ω)− F (ω)e
−iξ(ω)xj −D(ω)eiξ(ω)xj∣∣∣2dω. (8)
14
TPIRCSUNAM DETPECCA
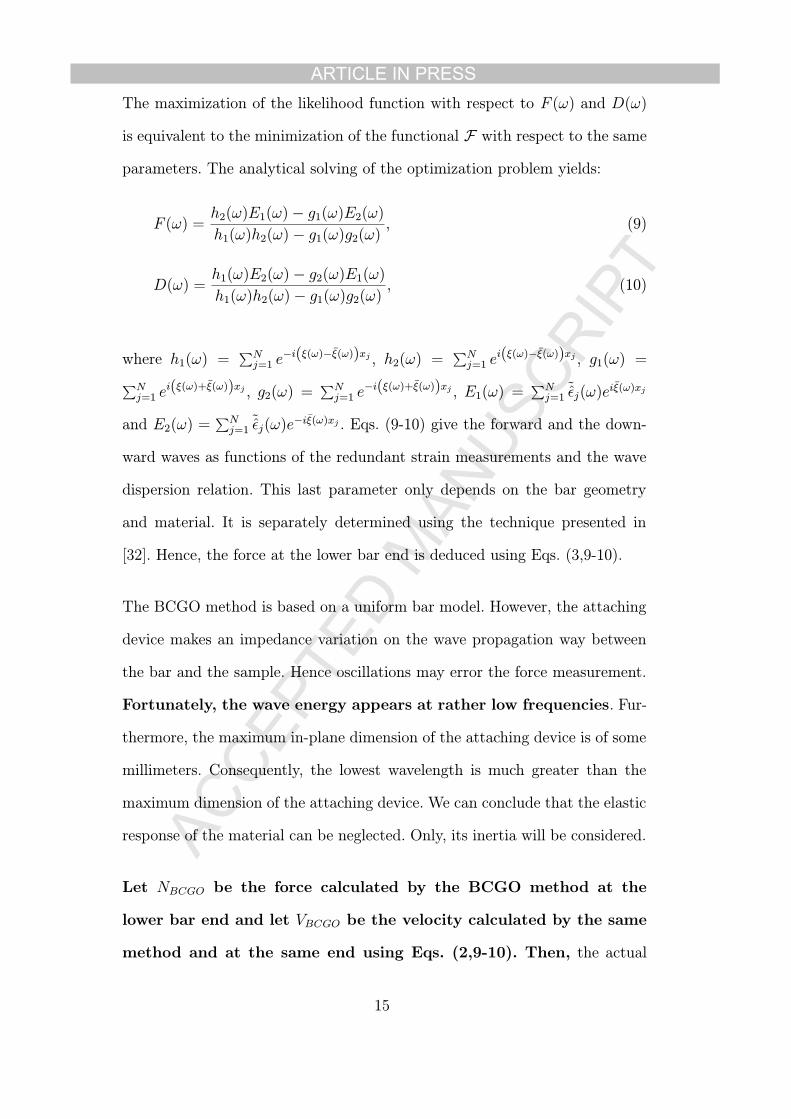
ARTICLE IN PRESSThe maximization of the likelihood function with respect to F (ω) and D(ω)
is equivalent to the minimization of the functional F with respect to the same
parameters. The analytical solving of the optimization problem yields:
F (ω) =h2(ω)E1(ω)− g1(ω)E2(ω)h1(ω)h2(ω)− g1(ω)g2(ω)
, (9)
D(ω) =h1(ω)E2(ω)− g2(ω)E1(ω)h1(ω)h2(ω)− g1(ω)g2(ω)
, (10)
where h1(ω) =∑Nj=1 e
−i(ξ(ω)−ξ(ω))xj , h2(ω) =∑Nj=1 e
i(ξ(ω)−ξ(ω))xj , g1(ω) =
∑Nj=1 e
i(ξ(ω)+ξ(ω))xj , g2(ω) =∑Nj=1 e
−i(ξ(ω)+ξ(ω))xj , E1(ω) =∑Nj=1˜εj(ω)e
iξ(ω)xj
and E2(ω) =∑Nj=1˜εj(ω)e
−iξ(ω)xj . Eqs. (9-10) give the forward and the down-
ward waves as functions of the redundant strain measurements and the wave
dispersion relation. This last parameter only depends on the bar geometry
and material. It is separately determined using the technique presented in
[32]. Hence, the force at the lower bar end is deduced using Eqs. (3,9-10).
The BCGO method is based on a uniform bar model. However, the attaching
device makes an impedance variation on the wave propagation way between
the bar and the sample. Hence oscillations may error the force measurement.
Fortunately, the wave energy appears at rather low frequencies. Fur-
thermore, the maximum in-plane dimension of the attaching device is of some
millimeters. Consequently, the lowest wavelength is much greater than the
maximum dimension of the attaching device. We can conclude that the elastic
response of the material can be neglected. Only, its inertia will be considered.
Let NBCGO be the force calculated by the BCGO method at the
lower bar end and let VBCGO be the velocity calculated by the same
method and at the same end using Eqs. (2,9-10). Then, the actual
15

TPIRCSUNAM DETPECCA
ARTICLE IN PRESSforce applied to the specimen is:
Nsample = NBCGO −mad∂VBCGO
∂t, (11)
where mad is the mass of the attaching device.
4 Results and discussion
4.1 Results
Experiments are carried out on samples cut from a commercial Al 2017 T4
sheet which is 2.5 mm thick (see Fig. 3). The parameters of these tests are
detailed in Tab. 1. An example of the recorded strains at the gauge stations is
given in Fig. 4. Strain measurements show clearly important oscillations due
to the elastic response and the inertia of the measurement system (the bar +
the specimen attaching device).
Let us now consider the impact of using the BCGO method on
force recovering. In Fig. 5, we compare the recovered force, at the attaching
device-bar interface, with the force directly measured by the gauge at the
station 1. The initial oscillations on the measured force are highly reduced.
Nevertheless, they are not completely removed. Indeed, the BCGO
method, as all wave separation techniques cited above, only takes
into account the elastic response and the inertia of the bar and
not those of the attaching device. To overcome this problem, the
actual force applied to the specimen is corrected using Eq. (11)
which includes attaching device inertia. The resulting force has much
16
TPIRCSUNAM DETPECCA
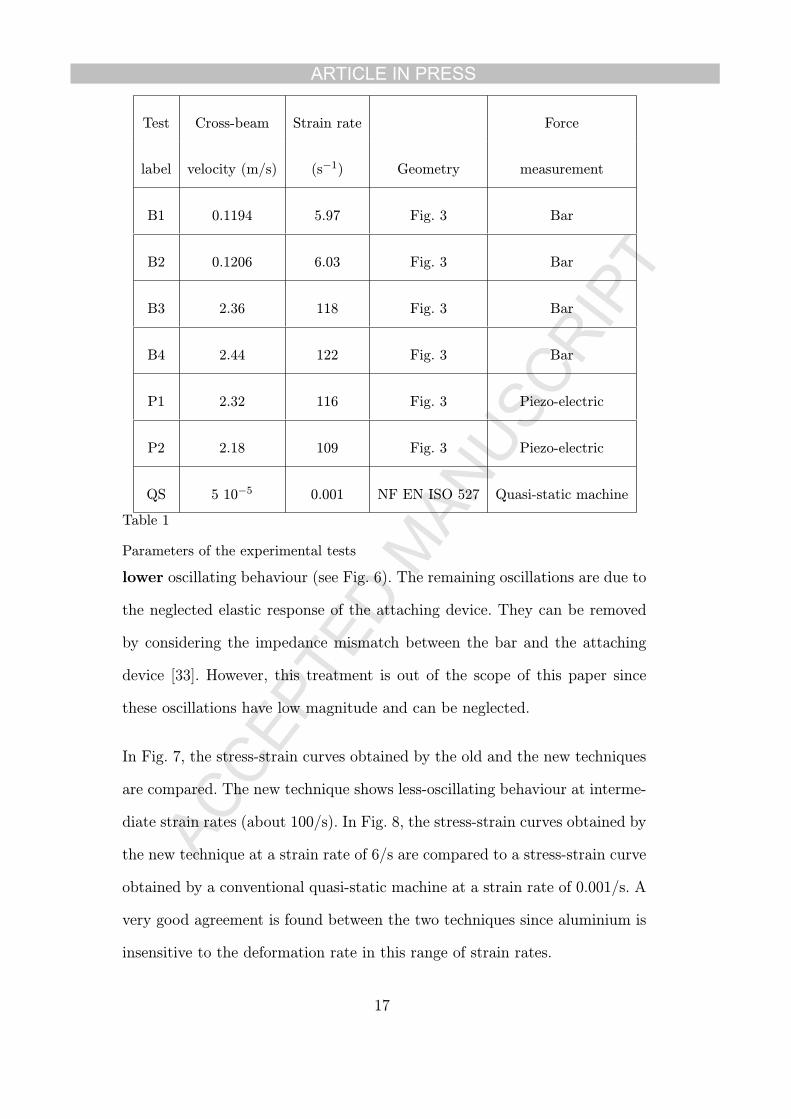
ARTICLE IN PRESS
Test Cross-beam Strain rate Force
label velocity (m/s) (s−1) Geometry measurement
B1 0.1194 5.97 Fig. 3 Bar
B2 0.1206 6.03 Fig. 3 Bar
B3 2.36 118 Fig. 3 Bar
B4 2.44 122 Fig. 3 Bar
P1 2.32 116 Fig. 3 Piezo-electric
P2 2.18 109 Fig. 3 Piezo-electric
QS 5 10−5 0.001 NF EN ISO 527 Quasi-static machine
Table 1
Parameters of the experimental tests
lower oscillating behaviour (see Fig. 6). The remaining oscillations are due to
the neglected elastic response of the attaching device. They can be removed
by considering the impedance mismatch between the bar and the attaching
device [33]. However, this treatment is out of the scope of this paper since
these oscillations have low magnitude and can be neglected.
In Fig. 7, the stress-strain curves obtained by the old and the new techniques
are compared. The new technique shows less-oscillating behaviour at interme-
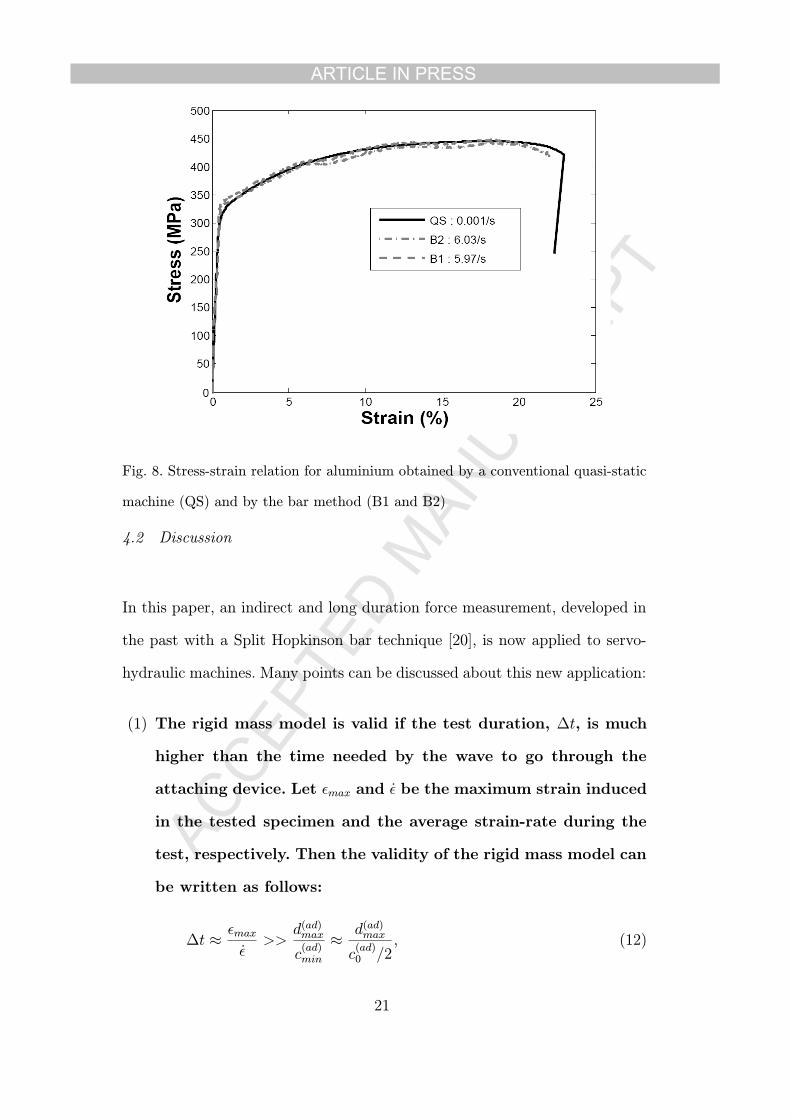
diate strain rates (about 100/s). In Fig. 8, the stress-strain curves obtained by
the new technique at a strain rate of 6/s are compared to a stress-strain curve
obtained by a conventional quasi-static machine at a strain rate of 0.001/s. A
very good agreement is found between the two techniques since aluminium is
insensitive to the deformation rate in this range of strain rates.
17

TPIRCSUNAM DETPECCA
ARTICLE IN PRESS
φ
Fig. 3. Geometry of the sample
Fig. 4. Measured strains on the gauge stations (test B4)
18

TPIRCSUNAM DETPECCA
ARTICLE IN PRESS
Fig. 5. The force at the attaching device-bar interface compared to the measured
force at gauge 1
Fig. 6. The measured force before and after removing the inertia effects of the
attaching device
19

TPIRCSUNAM DETPECCA
ARTICLE IN PRESS
Fig. 7. Stress-strain relation for aluminium obtained by the piezoelectric force trans-
ducer method (P1 and P2) and by the bar method (B3 and B4)
It is worth noticing that the test duration is considerably increased with the
new technique. Indeed, the used bar is 820mm long and has a wave velocity of
approximately 5100m/s. Using the same bar, the test duration will be 160μs
in the case of a conventional Hopkinson bar. It will be less than 320μs in the
case of the hybrid technique [3]. At a strain rate of approximately 100/s, the
maximum strain measured on the specimen will be less than 1.6% in case of
the first technique and less than 3.2% in the case of the second technique.
Using the new bar-like method, the test duration is theoretically unlimited.
It is 1.5ms in the tests B3 and B4 and 37ms in the tests B1 and B2. Besides,
the maximum measured strain is about 20%.
20
TPIRCSUNAM DETPECCA
ARTICLE IN PRESS
Fig. 8. Stress-strain relation for aluminium obtained by a conventional quasi-static
machine (QS) and by the bar method (B1 and B2)
4.2 Discussion
In this paper, an indirect and long duration force measurement, developed in
the past with a Split Hopkinson bar technique [20], is now applied to servo-
hydraulic machines. Many points can be discussed about this new application:
(1) The rigid mass model is valid if the test duration, Δt, is much
higher than the time needed by the wave to go through the
attaching device. Let εmax and ε be the maximum strain induced
in the tested specimen and the average strain-rate during the
test, respectively. Then the validity of the rigid mass model can
be written as follows:
Δt ≈εmax
ε>>d(ad)max
c(ad)min
≈d(ad)max
c(ad)0 /2
, (12)
21

TPIRCSUNAM DETPECCA
ARTICLE IN PRESS
where d(ad)max, c(ad)min, c
(ad)0 the maximum dimension, the minmum
wave speed and the sound speed, respectively, of the attaching
device. By introducing a factor 100 and replacing >> by >, Eq.
(12) yields:
ε ≤c(ad)0 εmax
200d(ad)max
. (13)
(2) The second point to be adressed is the difference of complexity
between the wave separation method and the rigid body model.
The wave separation methods take into account the stiffness and the
inertia of a uniform bar. The attaching device has non uniform cross-
section. Consequently, wave propagation is affected by the impedance
variation. Furthermore, the uniform bar wave separation methods can
not be applied to the whole system (the bar + the attaching device). In
this work the force applied to the specimen is computed in two steps. In
the first step, we calculate the force at the bar-attaching device interface
using the BCGO method. Secondly, we deduce the force applied to the
sample assuming a rigid-mass model for the attaching device. The first
model is complex but necessary, whereas the second one is rather simple
but sufficient.
The force measurement is based here on strain measurement and elas-
ticity. A long bar is used to avoid 3D effects because only the axial force is
needed here. Furthermore, transient waves become significant and should
be taken into account at intermediate strain rates. This point leads also
to long bars because transient waves in long bars are the best under-
stood and because their analysis is the simplest. Therefore, inertia and
stiffness of the measuring device can be corrected. Finally, the better
way to measure force at intermediate strain rates (and higher), using
22

TPIRCSUNAM DETPECCA
ARTICLE IN PRESSstrain measurements, is that using long (visco)-elastic bars. In addition,
the incident and reflected waves contribution are measured together
with the strain measurements, mainly at intermediate strain-rate tests.
Hence, the contributions of the two waves must be separated to cal-
culate the force at the bar end. Therefore, wave separation techniques,
despite their complexity, should be used.
The rigid model of the grip is quite simple. However, it is valid
for test durations that are much greater than the time needed
by the wave to go through the attaching device. We show in
Eq. (13), that this model is valid at least for strain-rates ε ≤
C0,adεmax/200dmax. Taking C0,ad = 5000m/s, εmax = 0.2 and dmax =
22mm, this model is valid in the range of strain-rates of some
hundreds per second.
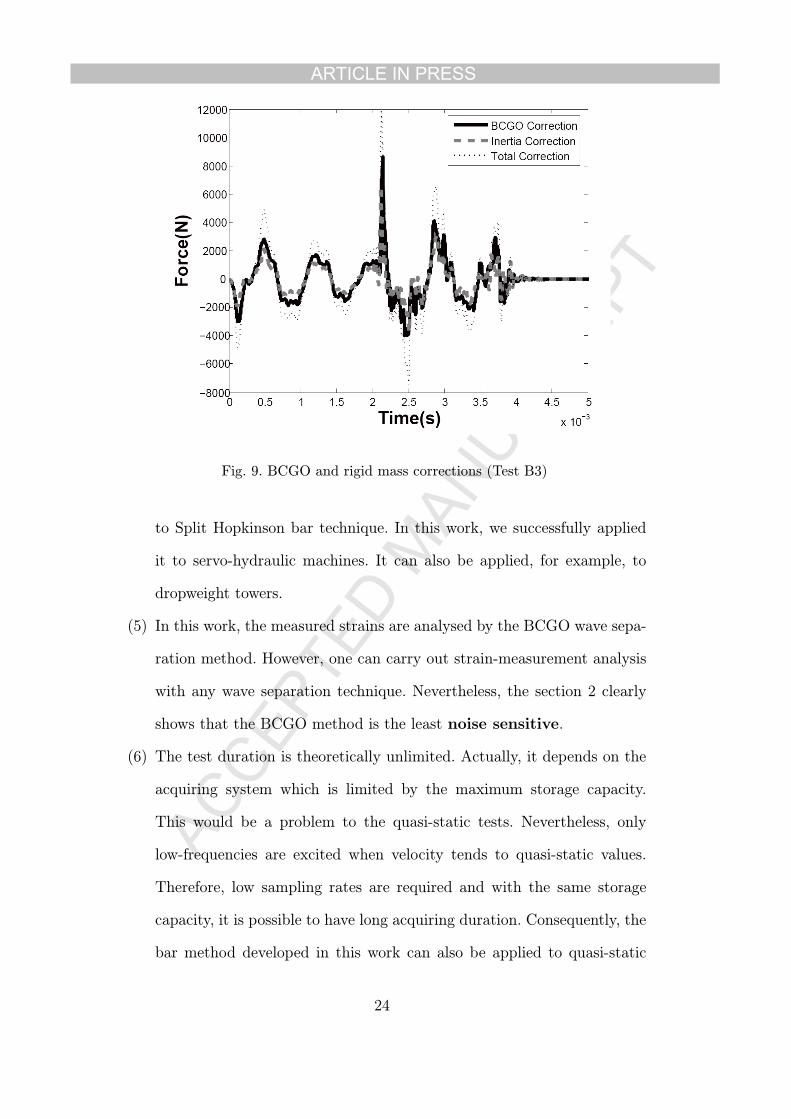
Even though the methods used in the two steps are of different
complexity, the corresponding oscillation elimination is of the same order.
In fact, wave separation methods eliminate approximately 50% of the
oscillations and the rigid body model the same amount (see Fig. 9). This
shows that the rigid mass model for the attaching device is efficient.
(3) In this work, the force applied to the specimen is computed in two steps.
Alternatively, it can be calculated within one step by taking into account
both inertia and stiffness of the bar and the attaching device. Therefore,
the bar and the attaching device can be modelled as a whole non-uniform
bar as suggested in [33]. Nevertheless, the rigid body model gives good
results in the range of strain-rates of some hundreds per second. Indeed,
the remaining oscillations have low level.
(4) The BCGO wave separation method is an indirect force measurement.
Therefore, it can be applied to any loading system. It was first applied
23
TPIRCSUNAM DETPECCA
ARTICLE IN PRESS
Fig. 9. BCGO and rigid mass corrections (Test B3)
to Split Hopkinson bar technique. In this work, we successfully applied
it to servo-hydraulic machines. It can also be applied, for example, to
dropweight towers.
(5) In this work, the measured strains are analysed by the BCGO wave sepa-
ration method. However, one can carry out strain-measurement analysis
with any wave separation technique. Nevertheless, the section 2 clearly
shows that the BCGO method is the least noise sensitive.
(6) The test duration is theoretically unlimited. Actually, it depends on the
acquiring system which is limited by the maximum storage capacity.
This would be a problem to the quasi-static tests. Nevertheless, only
low-frequencies are excited when velocity tends to quasi-static values.
Therefore, low sampling rates are required and with the same storage
capacity, it is possible to have long acquiring duration. Consequently, the
bar method developed in this work can also be applied to quasi-static
24

TPIRCSUNAM DETPECCA
ARTICLE IN PRESStests.
(7) The method developed in this paper is applied to a tensile test. It can
be easily applied to a compressive test. However, a special care should be
taken to prevent buckling.
5 Conclusion
Force measurement is one of the major concerns in impact engi-
neering. In this paper, we presented a bar-like force measurement
for servo-hydraulic machines. In the first part, wave separation techniques
were reviewed. Then we showed that the BCGO method [20] is the most
insensitive to the experimental noise. In the second part, this method is ap-
plied to improve the hybrid technique presented in [3]. Indeed, intermediate
strain rate tests are carried out without any limitation on the test duration.
The oscillations, due to the elastic behaviour and the inertia of the measuring
set-up, are almost totally removed. Results obtained at a strain rate of approx-
imately 120/s are more accurate than those obtained by a piezoelectric cell
at the same range of strain rates. Moreover, the results obtained at a strain
rate of approximately 6/s are in line with those obtained by a conventional
quasi-static machine.
References
[1] Gary G. Comportement dynamique des metaux a grande vitesse de deformation.
Modelisation. Techniques de l’Ingenieur 2001;BM 7 176:1-10.
[2] Diot S, Guines D, Gavrus A, Ragneau E. Two-step procedure for identification
25

TPIRCSUNAM DETPECCA
ARTICLE IN PRESSof metal behavior from dynamic compression tests. Int J Impact Eng
2007;34:1163-1184.
[3] LeBlanc MM, Lassila DH. A hybrid technique for compression testing at
intermediate strain rates. Exp Tech 1996;20:21-24.
[4] Lengyel B, Mohitpour M. Dynamic stress/strain data to large strains. J Inst
Metals 1972;100:1-5.
[5] Holzer AJ. A technique for obtaining compressive strength at high strain rates
using short loading cells. Int J Mech Sci 1978;20:553-560.
[6] Field JE, Swallowe GM, Pope PH, Palmer. Mechanical properties at high rates
of strain. Institute of Physics conference Series 70 (ICP, London 1984), pp 381-
384.
[7] Groves SE, Sanchez RJ, Lyon RE, Brown AE. High strain rate effects for
composite materials. Composites Materials Testing and Design, ed. E.T.
Camponeschi 1993;11 ASTM STP 1206.
[8] Hamdan S, Swallowe GM. The strain-rate and temperature dependence of the
mechanical properties of polyetherketone and polyetheretherketone. J Mater
Sci 1996;31:1415-1423.
[9] Roland CM, Twigg JN, Vu Y, Mott PH. High strain rate mechanical behavior
of polurea. Polymer 2007;48:474-478.
[10] Field JE, Walley SM, Proud WG, Goldrein HT, Siviour CR. Review of
experimental techniques for high rate deformation and shock studies. Int J
Impact Eng 2004;30:725-775.
[11] Guegan, LeBreton D, Pasco F, Othman R, Le Corre S, Poitou A. Metallic energy
absorbing inserts for formula one tyre barriers. Proc Inst Mech Eng Part D, J
Automobile Eng 2008; in press.
26

TPIRCSUNAM DETPECCA
ARTICLE IN PRESS[12] Lundberg B, Henchoz A. Analysis of elastic waves from two-point strain
measurement. Exp Mech 1977;17:213-218.
[13] Yanagihara N. New measuring method of impact force. Bull Jpn Soc Mech
Engng 1978;21:1085-1088.
[14] Zhao H, Gary G. A new method of wave separation for application to dynamic
testing. C. R. Acad. Sci. Paris 1994;319:987-992.
[15] Zhao H, Gary G. A new method for the separation of waves. Application to
the SHPB technique for an unlimited measuring duration. J Mech Phys Solids
1997;45:1185-1202.
[16] Bacon C. Separating waves propagating in an elastic or viscoelastic Hopkinson
pressure bar with three-dimensional effects. Int J Impact Eng 1999;22:55-69.
[17] Park SW, Zhou M. Separation of elastic waves in Split Hopkinson Bars using
one-point strain measurements. Exp Mech 1999;39:287-294.
[18] Jacquelin E, Hamelin P. Block-bar device for energy absorption analysis. Mech
Syst Signal Process 2001;15:603-617.
[19] Othman R, Bussac MN, Collet P, Gary G. Separation et reconstruction
des ondes dans les barres elastiques et viscoelastiques a partir de mesures
Redondantes. C R Acad Sci Ser IIb 2001;329:369-376.
[20] Bussac MN, Collet P, Gary G, Othman R. An optimisation method for
separating and rebuilding one-dimensional dispersive waves from multi-point
measurements. Application to elastic or viscoelastic bars. J Mech Phys Solids
2002;50:321-350.
[21] Zhao PJ, Lok TS. A new method for separating longitudinal waves in a large
diameter Hopkinson bar. J Sound Vib 2002;257:119-130.
27

TPIRCSUNAM DETPECCA
ARTICLE IN PRESS[22] Meng H, Li QM. An SHPB set-up with reduced time-shift and pressure bar
length. Int J Impact Eng 2003;28:677-696.
[23] Casem DT, Fourney W, Chang P. Wave sepration in viscoelastic pressure bar
using single point measurements of strain and velocity. Polym Test 2003;22:155-
164.
[24] Jacquelin E, Hamelin P. Force recovered from three recorded strains. Int J Solids
Struct 2003;40:73-88.
[25] Zhao H, Abdennadher S, Othman R. An experimental study of square tube
crushing under impact loading using a modified large scale SHPB. Int J Impact
Eng 2006;32:1174-1189.
[26] Othman R. Extension du champ dapplication du systme des barres de
Hopkinson aux essais a moyennes vitesses de deformation. Ph.D. Thesis, Ecole
Polytechnique, France, 2002.
[27] Othman R, Bussac MN, Collet P, Gary G. Testing with SHPB from quasi-static
to dynamic strain rates. Journal de Physique IV 2003; 110:397-402.
[28] Othman R, Gary G. Testing aluminum alloy from quasi-static to dynamic
strain-rates with a modified Split Hopkinson Bar method. Exp Mech
2007;47:295-299.
[29] Quirion Y, Lesaffre AS. Hydraulic machine tests for compression of a quasi-
brittle material at medium strain rate. Journal de Physique IV 2006;134:553-
558.
[30] Yang CY. Solution of an inverse vibration problem using a linear least-squares
error method. Appl Math Modelling 1996;20:785-788.
[31] http://icasoft.insa-lyon.fr
28

TPIRCSUNAM DETPECCA
ARTICLE IN PRESS[32] Othman R, Blanc RH, Bussac MN, Collet P, Gary G. Identification de la
relation de dispersion dans les barres. C R Mecanique 2002;320:849-855.
[33] Othman R. Wave separation in non-uniform Hopkinson bars using redundant
measurements. Journal de Physique IV 2006;134:571-576.
29

TPIRCSUNAM DETPECCA
ARTICLE IN PRESS
Upper cross head
Gauge 1
Gauge 2
Gauge 3
Lower cross head