Embed Size (px)
Citation preview
Energy Conversion and Management 45 (2004) 911–925www.elsevier.com/locate/enconman
A modified tracking algorithm for maximum powertracking of solar array
Chihchiang Hua a,*, Jongrong Lin b
a Department of Electrical Engineering, National Yunlin University of Science and Technology,
123 University Road Section 3, Touliu City, Yunlin County, 640 Taiwan, ROCb Department of Electrical Engineering, Kuang Wu Institute of Technology, 151 Yi-Te Street, Peito,
Taipei 112, Taiwan, ROC
Received 30 October 2002; received in revised form 3 March 2003; accepted 16 July 2003
Abstract
Maximum power point tracking (MPPT) techniques are usually used for solar power applications. This
paper discusses: (1) various connection methods between solar arrays and loads and (2) various maximum
power point control methods and MPPT algorithms. In this paper, the solar array is treated as a current
source instead of a voltage source. Analytical models are built for the solar array and converter on the basis
of the data sheet of the manufacturer and the principle of energy conservation. An improved MPPT
algorithm was proposed to reduce the power loss in the tracking process. A digital signal processor (DSP)
based controller was constructed to implement the proposed MPPT control, and the experimental resultsare presented.
� 2003 Elsevier Ltd. All rights reserved.
Keywords: DSP; MPPT; Solar array; Perturbation and observation; Incremental conductance
1. Introduction
Solar energy has become a promising alternative source due to its advantages: abundance,pollution free and renewability. The main drawbacks are that the initial installation cost isconsiderably high, and the energy conversion efficiency is relatively low. To overcome theseproblems, the following two essential ways can be used: (1) increase the efficiency of conversionfor the solar array, and (2) maximize the output power from the solar array. With the development
* Corresponding author. Tel.: +886-5-5342601x4250; fax: +886-5-5312042.
E-mail address: [email protected] (C. Hua).
0196-8904/$ - see front matter � 2003 Elsevier Ltd. All rights reserved.
doi:10.1016/S0196-8904(03)00193-6

Nomenclature
� instantaneous value of variableD indicating disturbed valuesn damping factor of transfer function, Eqs. (12) and (16)k insolation in mW/cm2
x1 angular frequency of transfer function, Eqs. (12) and (13)x2 angular frequency of transfer function, Eqs. (12) and (14)x0 natural frequency, Eqs. (12) and (15)A ideality factor for p–n junction, Eq. (1)C capacitor, Eqs. (16) and (15)D nominal duty cycle, Eq. (2)Ik current under given insolation, Eq. (1)IO output current of solar array, Eq. (1)ID average current through diode, Eq. (4)ID;rms rms current through diode, Eq. (4)IL average current through inductor, Eq. (3)IL;rms rms current through inductor, Eq. (3)IS average current through MOSFET, Eq. (3)IS;rms rms current through MOSFET, Eq. (3)Isat saturation current of solar array, Eq. (1)k amount of disturbance, Eq. (17)K Boltzmann’s constant, Eq. (1)a current constant, Eqs. (3)–(7)L inductance, Eq. (16)n simulation step, Eq. (17)PD losses of diode, Eq. (7)PMAX maximum power pointPL losses of inductor, Eq. (9)PS losses of switch, Eq. (6)PVD losses of forward voltage of diode, Eq. (8)q charge of electron, Eq. (1)RD intrinsic series resistance of diode, Fig. 6(a)Req equivalent averaged resistance, Eqs. (10) and (14)–(16)Rsh equivalent shunt resistance of solar array, Eqs. (14)–(16)RS intrinsic series resistance of solar arrayrC ESR of capacitor C, Eqs. (15) and (16)rDS resistance of MOSFET, Eq. (10)rL ESR of inductor L, Eq. (10)T temperature of solar array in Kelvin, Eq. (1)TPðSÞ transfer function of controller, Eqs. (11) and (12)TS sampling time, Eq. (2)
912 C. Hua, J. Lin / Energy Conversion and Management 45 (2004) 911–925
VD forward voltage of diode, Eq. (8)VO output voltage of solar array, Eq. (1)Vdg voltage across MOSFET from diode to inductance, Fig. 5(a)Vsg voltage across MOSFET from diode to solar array to diode, Fig. 5(a) and (c)Vref reference voltage of solar array, Eq. (17)
Subscripts
B batteryC capacitorD, F diodeL inductorO output of solar arrayS switch
AbbreviationsCCM continuous current modeDC direct currentDSP digital signal processorESR equivalent series resistanceIncCond incremental conductanceMPP maximum power pointMPPT maximum power point trackingPI proportional integralP&O perturbation and observationPWM pulse width modulationP.U. per unitrms root mean square
C. Hua, J. Lin / Energy Conversion and Management 45 (2004) 911–925 913
of technology, the cost of the solar array is expected to decrease continuously in the future,making them attractive for residential and industrial applications.
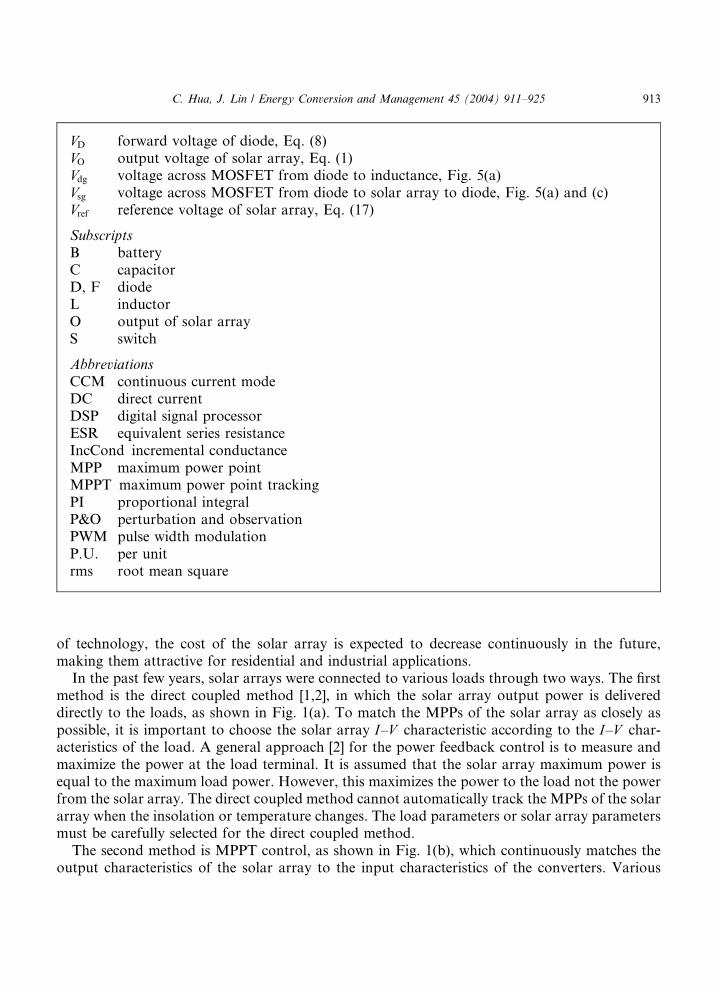
In the past few years, solar arrays were connected to various loads through two ways. The firstmethod is the direct coupled method [1,2], in which the solar array output power is delivereddirectly to the loads, as shown in Fig. 1(a). To match the MPPs of the solar array as closely aspossible, it is important to choose the solar array I–V characteristic according to the I–V char-acteristics of the load. A general approach [2] for the power feedback control is to measure andmaximize the power at the load terminal. It is assumed that the solar array maximum power isequal to the maximum load power. However, this maximizes the power to the load not the powerfrom the solar array. The direct coupled method cannot automatically track the MPPs of the solararray when the insolation or temperature changes. The load parameters or solar array parametersmust be carefully selected for the direct coupled method.
The second method is MPPT control, as shown in Fig. 1(b), which continuously matches theoutput characteristics of the solar array to the input characteristics of the converters. Various
DC Load
Solar array
(a)
Power ElectronicsComponent
Load
Controller
Solar array
(b)
Fig. 1. (a) The direct coupled system. (b) The MPPT system.
914 C. Hua, J. Lin / Energy Conversion and Management 45 (2004) 911–925
methods of MPPT have been considered in applications of solar arrays [3–11]. Previously usedmethods of achieving this goal include: (1) incremental conductance (IncCond), (2) curve fitting,(3) neural network and (4) perturbation and observation (P&O).
For the incremental conductance (IncCond) method [3], the harmonic components of thearray voltage and current need to be measured and used to adjust the array reference voltage.Thus, the system requires more conversion time, and a large amount of power loss will result.In addition to the above described, extra hardware circuitry is required to implement thesystem. The curve fitting method [4,5] used a numerical analysis method to find a linearlyapproximate relationship between the current of the maximum power point and the photo-current, which is directly proportional to the insolation. On earth, the temperature of the solararray does not keep constant because of wind, cloud, insolation level etc. Therefore, thismethod is only used in places where the temperature variation is relatively small. With theneural network based MPPT method [6,7], the neural network was trained with given data,then the optimal operating point is identified and the maximum power from the solar array isestimated. Although this method can predict the MPPs of the solar array, the data acquisitionand memory space is more important than the MPPT algorithm when the neural networkcontrol is used to achieve maximum power tracking. The perturbation and observation method[8–10], which moves the operating point toward the MPP by periodically increasing or de-creasing the solar array output voltage, is often used in many solar energy systems. It has beenshown that the perturbation and observation method works well when the insolation does notvary quickly with time. However, the perturbation and observation method fails to track themaximum power points quickly. On the contrary, if the sampling of the perturbation andobservation method is increased, then the system loss will be reduced. Moreover, this methodonly needs two sensors, which results in a reduction of the hardware requirement and cost.Therefore, a modified MPPT algorithm was used in this paper to control the output currentand voltage of the solar array. The system power loss during the tracking process can bereduced even if the insolation changes rapidly.
C. Hua, J. Lin / Energy Conversion and Management 45 (2004) 911–925 915
A microprocessor is usually used to control the DC/DC converter for optimal operation, whichadds to the overall system cost considerably [8–10]. In Ref. [9], the MPPT control using two loopcontrol is very complex in the circuit implementation. The method in Ref. [10], which regulates theoutput power by changing the number of batteries, requires extra hardware circuits. This ap-proach, neglecting the variations in the output voltage, simplifies the control circuits by elimi-nating the need to sense and multiply voltage and current. However, this method does not trackthe MPP rapidly and accurately.
In this paper, a solar power system using a digital signal processor (DSP) is proposed. TheMPPT is implemented in a software program with a self tuning function, which automaticallyadjusts the array reference voltage and voltage step size to achieve maximum power trackingunder fast changing atmospheric conditions. With a DSP based controller, real time controlmaximum power tracking can be achieved rapidly and accurately by increasing the samplingfrequency and modifying the tracking algorithm. The proposed controller features MPPT andbattery charge regulation.
2. Solar array characteristics and MPPT process control
2.1. Solar array characteristics
The electric power generated by a solar array swings depending on the solar radiation andtemperature. The characteristics of the solar array significantly affect the design of the converterand control system. The solar array is a nonlinear device and can be represented as a currentsource model, as shown in Fig. 4. RS is the intrinsic series resistance of the solar array whose valueis usually very small. Rsh is the equivalent shunt resistance of the solar array whose value is usuallyvery large. In general, the output current of a solar array is a function of the insolation and thetemperature, as given by the following equation
IO ¼ Ik � Isat expq
AKTðVO
hnþ IORSÞ
i� 1
oð1Þ
where IO and VO are the output current and output voltage of the solar array, respectively, Ik is thegenerated current under a given insolation, Isat is the saturation current of a solar array, q is thecharge of an electron, K is Boltzmann�s constant, and A is the ideality factor for a p–n junction.
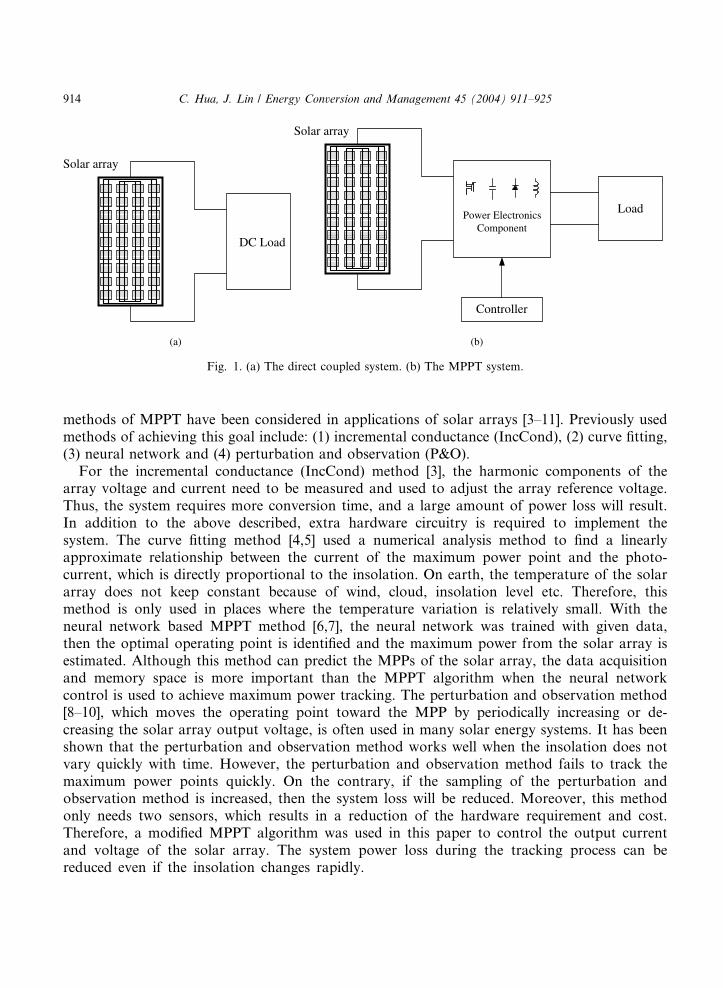
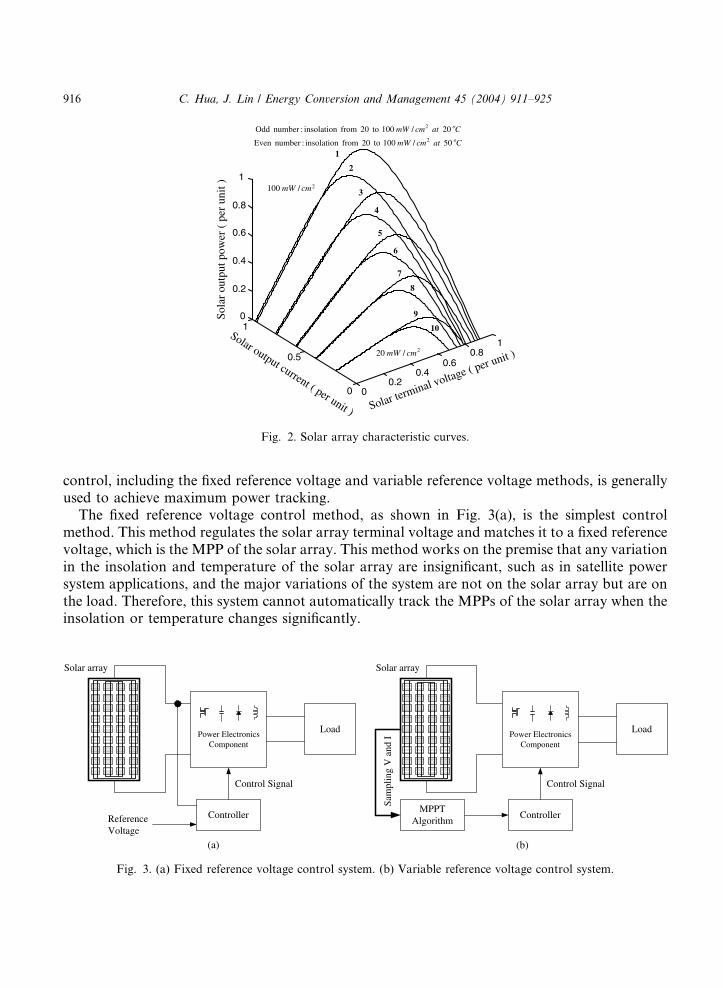
Fig. 2 illustrates the simulated characteristic curves for solar arrays at different insolations anddifferent temperatures. From these characteristic curves, it is observed that the output charac-teristics of the solar array are nonlinear and vitally affected by the solar radiation, temperatureand load condition. Each curve has only one maximum power point (MPP, PMAX), which is theoptimal operating point for efficient use of the solar array.
2.2. MPPT process control
The purpose of the MPPT controller is to control the parameters of the DC/DC converters,such as the duty cycle, in such a way as to operate the solar array close to its MPPs. Voltage
00.2
0.40.6
0.81
0
0.5
10
0.2
0.4
0.6
0.8
1
1
3
5
7
9
10
8
6
4
2
Solar terminal voltage ( per unit )
Solar output current ( per unit )
CatcmmW
CatcmmWo
o
50/010to20frominsolation:numberEven
20/010to20frominsolation:numberOdd2
2
2/100 cmmW
2/20 cmmW
Sola
r ou
tput
pow
er (
per
uni
t )
Fig. 2. Solar array characteristic curves.
916 C. Hua, J. Lin / Energy Conversion and Management 45 (2004) 911–925
control, including the fixed reference voltage and variable reference voltage methods, is generallyused to achieve maximum power tracking.
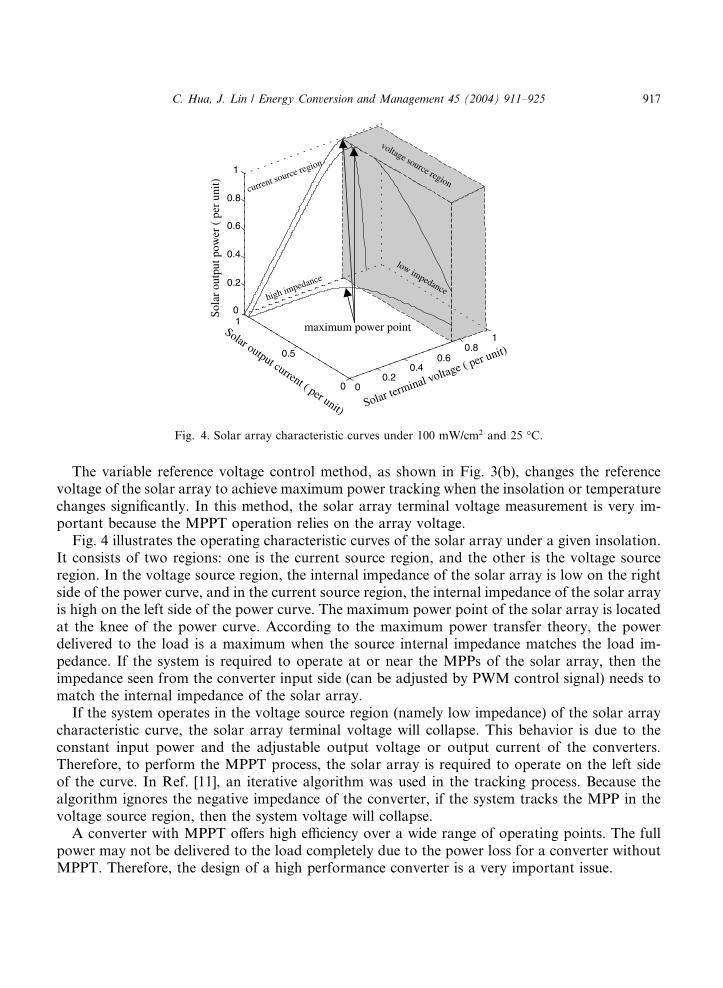
The fixed reference voltage control method, as shown in Fig. 3(a), is the simplest controlmethod. This method regulates the solar array terminal voltage and matches it to a fixed referencevoltage, which is the MPP of the solar array. This method works on the premise that any variationin the insolation and temperature of the solar array are insignificant, such as in satellite powersystem applications, and the major variations of the system are not on the solar array but are onthe load. Therefore, this system cannot automatically track the MPPs of the solar array when theinsolation or temperature changes significantly.
Power ElectronicsComponent
Load
Controller
Solar array
ReferenceVoltage
Control Signal
(a)
Power ElectronicsComponent
Load
Controller
Solar array
Control Signal
MPPTAlgorithm
Sam
plin
g V
and
I
(b)
Fig. 3. (a) Fixed reference voltage control system. (b) Variable reference voltage control system.
current source region
high impedance
Solar terminal voltage ( per unit)
Solar output current ( per unit)
Sola
r ou
tput
pow
er (
per
uni
t)
00.2
0.40.6
0.81
0
0.5
10
0.2
0.4
0.6
0.8
1
low impedance
voltage source region
maximum power point
Fig. 4. Solar array characteristic curves under 100 mW/cm2 and 25 �C.
C. Hua, J. Lin / Energy Conversion and Management 45 (2004) 911–925 917
The variable reference voltage control method, as shown in Fig. 3(b), changes the referencevoltage of the solar array to achieve maximum power tracking when the insolation or temperaturechanges significantly. In this method, the solar array terminal voltage measurement is very im-portant because the MPPT operation relies on the array voltage.
Fig. 4 illustrates the operating characteristic curves of the solar array under a given insolation.It consists of two regions: one is the current source region, and the other is the voltage sourceregion. In the voltage source region, the internal impedance of the solar array is low on the rightside of the power curve, and in the current source region, the internal impedance of the solar arrayis high on the left side of the power curve. The maximum power point of the solar array is locatedat the knee of the power curve. According to the maximum power transfer theory, the powerdelivered to the load is a maximum when the source internal impedance matches the load im-pedance. If the system is required to operate at or near the MPPs of the solar array, then theimpedance seen from the converter input side (can be adjusted by PWM control signal) needs tomatch the internal impedance of the solar array.
If the system operates in the voltage source region (namely low impedance) of the solar arraycharacteristic curve, the solar array terminal voltage will collapse. This behavior is due to theconstant input power and the adjustable output voltage or output current of the converters.Therefore, to perform the MPPT process, the solar array is required to operate on the left sideof the curve. In Ref. [11], an iterative algorithm was used in the tracking process. Because thealgorithm ignores the negative impedance of the converter, if the system tracks the MPP in thevoltage source region, then the system voltage will collapse.
A converter with MPPT offers high efficiency over a wide range of operating points. The fullpower may not be delivered to the load completely due to the power loss for a converter withoutMPPT. Therefore, the design of a high performance converter is a very important issue.
918 C. Hua, J. Lin / Energy Conversion and Management 45 (2004) 911–925
3. Model and control of the proposed system
3.1. System model
The state space averaging approach [12] is widely used to derive expressions and analyses thesmall signal characteristics of pulse width modulation (PWM) controlled DC/DC converters.Although it can predict the dynamic performance of the PWM converters, the computationprocess is very complicated when the converter equivalent circuit contains a large number ofelements (including parasitic components). The principle of energy conservation [13] is used in thispaper to derive the circuit model and transfer function, which has the advantages: (1) switchedresistors are replaced by the equivalent averaged resistors, (2) it can be used in multi-switchcircuits, (3) it can be easily applied in a circuit that consists of many nonswitch elements, and (4)the simulation and analysis of the circuit model is easy.
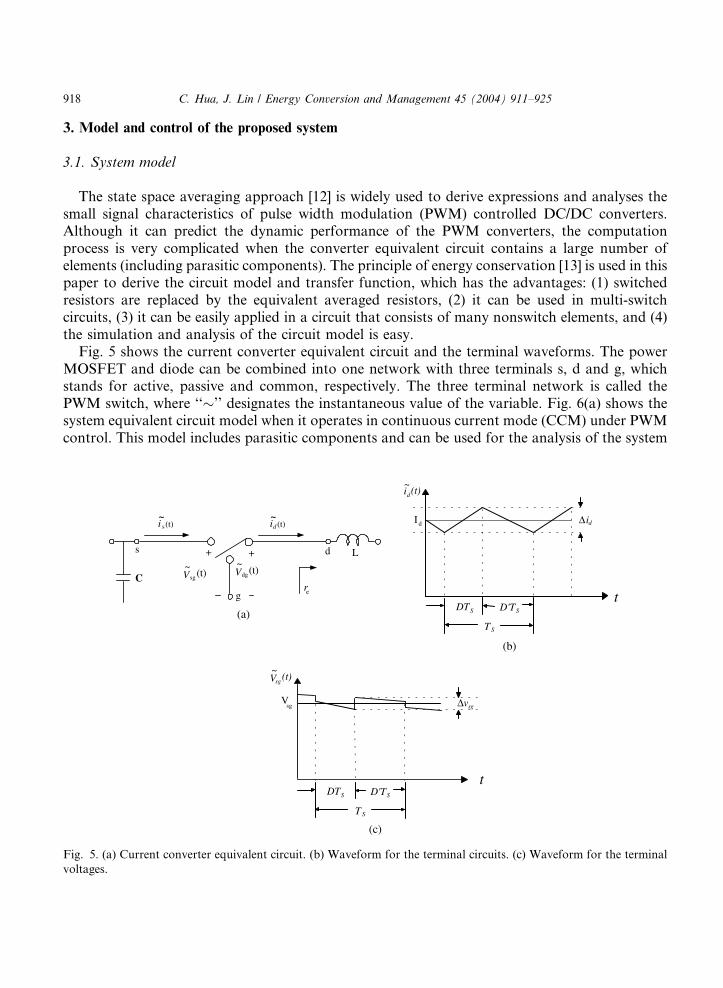
Fig. 5 shows the current converter equivalent circuit and the terminal waveforms. The powerMOSFET and diode can be combined into one network with three terminals s, d and g, whichstands for active, passive and common, respectively. The three terminal network is called thePWM switch, where ‘‘�’’ designates the instantaneous value of the variable. Fig. 6(a) shows thesystem equivalent circuit model when it operates in continuous current mode (CCM) under PWMcontrol. This model includes parasitic components and can be used for the analysis of the system
s
g
+ d L
C
i (t)s~
i (t)d~
Vsg
~(t) Vdg
~(t)
re
+
(a)
tDT D'T
T
i∆ dId
id(t)~
S S
S
(b)
t
Vsg v∆ sg
sgV (t)~
DT D'T
T
S S
S
(c)
Fig. 5. (a) Current converter equivalent circuit. (b) Waveform for the terminal circuits. (c) Waveform for the terminal
voltages.

RDS
C
L
i (t)D~
i (t)s~
VD
VB~
R shrc
rL
R D
i (t)L~VSD
~VLD~
v (t)o~
(a)
Vo
DilC
L
R shrc
ildIL
dVo
DVo~
Vb~
~
~
~
R eq
(b)
Fig. 6. (a) Equivalent circuit for PWM converter. (b) Small signal model.
C. Hua, J. Lin / Energy Conversion and Management 45 (2004) 911–925 919
under different modes. RDS is the resistance of the transistor, VD is the threshold voltage of thediode, RD is the forward resistance of the diode, rL is the equivalent series resistance (ESR) of theinductor L, rC is the equivalent series resistance (ESR) of the capacitor, Rsh is the equivalent shuntresistance of the solar array. The small signal model of the system can be obtained and shown inFig. 6(b).
The equation of the inductor current, as shown in Fig. 6(a), is
~iiL ¼
DiLDTS
t þ IL �DiL2
0 < t6DTS
� DiLð1� DÞTS
ðt � DTSÞ þ IL þDiL2
DTS < t6 TS
8>><>>: ð2Þ
3.1.1. Switch current
The current into the switch is approximately ~iiL during the switch ON interval (0 < t6DTS), andthe rms value of the switch current is
IS;rms ¼ IS
ffiffiffiffiffiffiffiffiffiffiffiffiffi1þ a2
D
rð3Þ
where a ¼ VBð1�DÞTSffiffiffiffi12
pLIL
and IS is the average of ~iiS.
3.1.2. Diode current
The diode current is approximately ~iiL during the diode ON interval (DTS < t6 TS), and the rmsvalue of the diode current is
ID;rms ¼ ID
ffiffiffiffiffiffiffiffiffiffiffiffiffi1þ a2
1� D
rð4Þ
where ID is the average of ~iiD.
3.1.3. Inductor currentThe rms value of the inductor current is
IL;rms ¼ IL �ffiffiffiffiffiffiffiffiffiffiffiffiffi1þ a2
pð5Þ
where IL is the average of ~iiL.

920 C. Hua, J. Lin / Energy Conversion and Management 45 (2004) 911–925
The losses of the switch, diode and inductor are expressed as
PS ¼ I2S � rDS �1þ a2
Dð6Þ
PD ¼ I2D � RF �1þ a2
1� Dð7Þ
PVD ¼ VD � ID ð8Þ
PL ¼ rL � I2L;rms ð9Þ
The reflection rule can be applied to move parasitic components from one branch to another,and the disturbances of the voltage, current and duty cycle can be expressed as the combination ofthe AC and DC components, as shown in Fig. 6(b). The nonlinear terms are neglected. In Fig.6(b), Req is the equivalent averaged resistance and can be expressed as
Req ¼ rL þ ½D� RDS þ ð1� DÞ � RD� � ð1þ a2Þ ð10Þ
3.1.4. Transfer functionThe charging voltage usually rises slowly, and therefore, the voltage is assumed constant as seen
from the battery side. The disturbance of the battery voltage is represented by a voltage per-turbation eVVB. The solar array is taken as a current source in this paper, and thus, the solar arrayterminal voltage has to be adjusted to deliver the maximum power. The effect of a small per-turbation of the solar array terminal voltage on system stability has to be considered carefully.The small signal model of the control to output transfer function is expressed as
TPðSÞ ¼eVVOðSÞdðSÞ
�����eVV B¼0
ð11Þ
From the circuit in Fig. 6(b), the transfer function is
TPðSÞ ¼eVVOðSÞdðSÞ
�����eVV B¼0
¼ VOrCDðRsh þ rCÞ
� ðS þ w1ÞðS þ w2ÞS2 þ 2nw0S þ w2
0
ð12Þ
where
w1 ¼1
rCcð13Þ
w2 ¼ � 1
LðD2Rsh � ReqÞ ð14Þ
w0 ¼
ffiffiffiffiffiffiffiffiffiffiffiffiffiffiffiffiffiffiffiffiffiffiffiffiffiffiReq þ RshD2
2CðRsh þ rCÞ
sð15Þ
C. Hua, J. Lin / Energy Conversion and Management 45 (2004) 911–925 921
n ¼ ½ReqðRsh þ rCÞ þ RshrCD2� � C þ L
2ffiffiffiffiffiffiffiffiffiffiffiffiffiffiffiffiffiffiffiffiffiffiffiffiffiffiffiffiffiffiffiffiffiffiffiffiffiffiffiffiffiffiffiffiffiffiffiffiffiffiffiffiffiffiLCðRsh þ rCÞðReq þ RshD2Þ
p ð16Þ
Rsh is the output resistance of the solar array.
3.2. System control
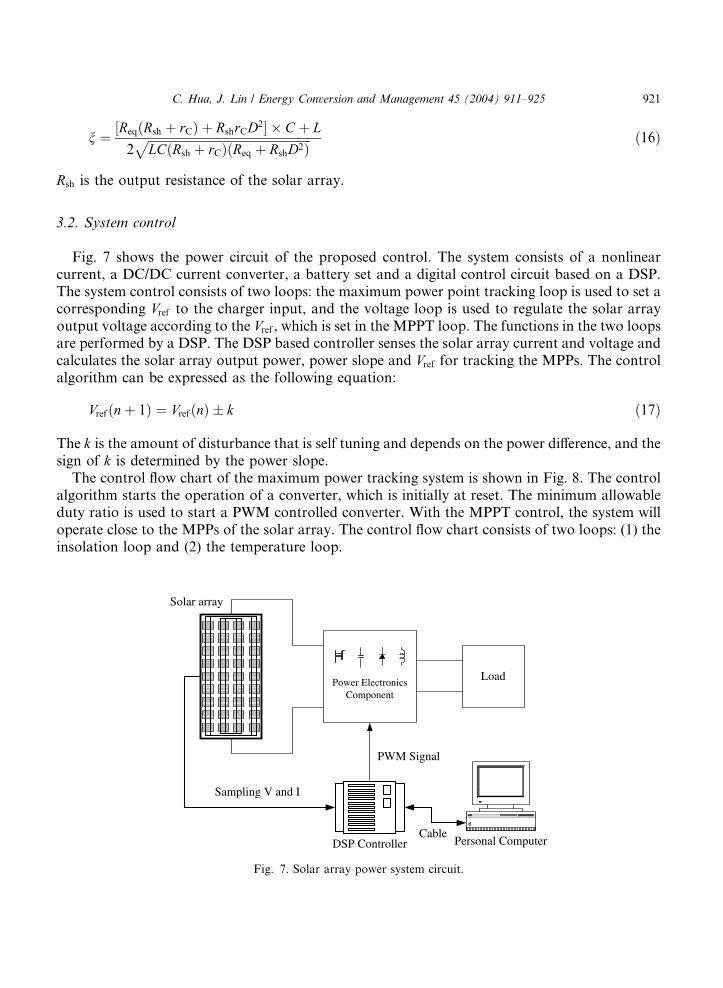
Fig. 7 shows the power circuit of the proposed control. The system consists of a nonlinearcurrent, a DC/DC current converter, a battery set and a digital control circuit based on a DSP.The system control consists of two loops: the maximum power point tracking loop is used to set acorresponding Vref to the charger input, and the voltage loop is used to regulate the solar arrayoutput voltage according to the Vref , which is set in the MPPT loop. The functions in the two loopsare performed by a DSP. The DSP based controller senses the solar array current and voltage andcalculates the solar array output power, power slope and Vref for tracking the MPPs. The controlalgorithm can be expressed as the following equation:
Vrefðnþ 1Þ ¼ VrefðnÞ � k ð17Þ
The k is the amount of disturbance that is self tuning and depends on the power difference, and thesign of k is determined by the power slope.
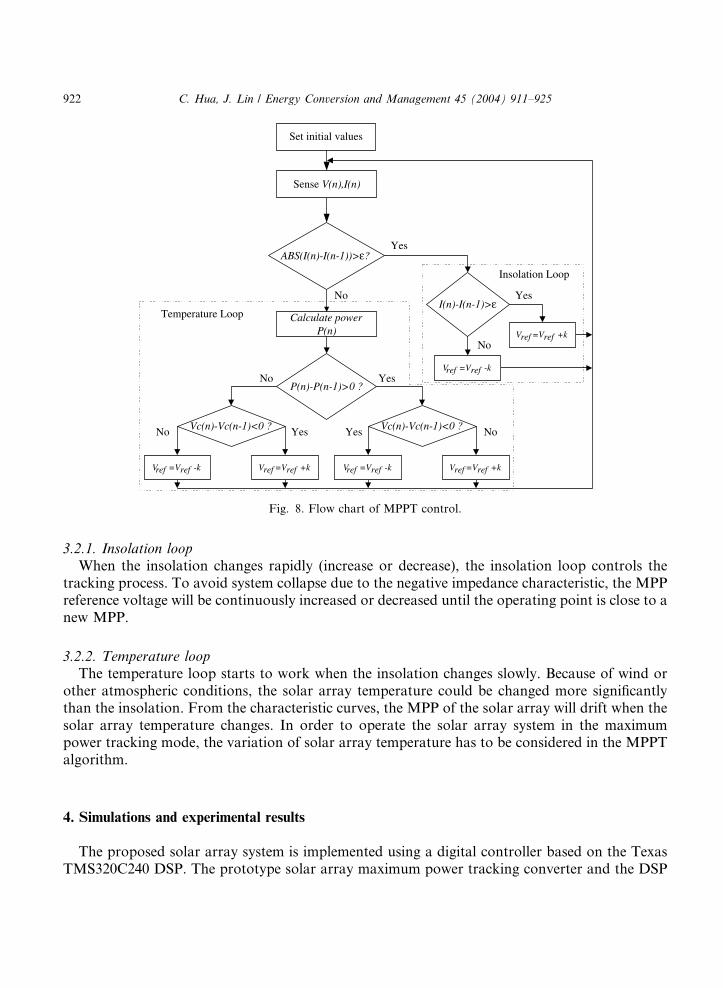
The control flow chart of the maximum power tracking system is shown in Fig. 8. The controlalgorithm starts the operation of a converter, which is initially at reset. The minimum allowableduty ratio is used to start a PWM controlled converter. With the MPPT control, the system willoperate close to the MPPs of the solar array. The control flow chart consists of two loops: (1) theinsolation loop and (2) the temperature loop.
Power ElectronicsComponent
Load
Solar array
PWM Signal
Sampling V and I
Personal ComputerDSP ControllerCable
Fig. 7. Solar array power system circuit.
Calculate powerP(n)
Set initial values
ABS(I(n)-I(n-1))>ε?
I(n)-I(n-1)>ε
No
Yes
Yes
P(n)-P(n-1)>0 ?No
Vc(n)-Vc(n-1)<0 ? YesNo Vc(n)-Vc(n-1)<0 ?Yes No
No
Insolation Loop
Temperature Loop
Yes
V =V +kref ref
V =V -kref ref
V =V -kref ref V =V +kref ref V =V -kref ref V =V +kref ref
Sense V(n),I(n)
Fig. 8. Flow chart of MPPT control.
922 C. Hua, J. Lin / Energy Conversion and Management 45 (2004) 911–925
3.2.1. Insolation loopWhen the insolation changes rapidly (increase or decrease), the insolation loop controls the
tracking process. To avoid system collapse due to the negative impedance characteristic, the MPPreference voltage will be continuously increased or decreased until the operating point is close to anew MPP.
3.2.2. Temperature loopThe temperature loop starts to work when the insolation changes slowly. Because of wind or
other atmospheric conditions, the solar array temperature could be changed more significantlythan the insolation. From the characteristic curves, the MPP of the solar array will drift when thesolar array temperature changes. In order to operate the solar array system in the maximumpower tracking mode, the variation of solar array temperature has to be considered in the MPPTalgorithm.
4. Simulations and experimental results
The proposed solar array system is implemented using a digital controller based on the TexasTMS320C240 DSP. The prototype solar array maximum power tracking converter and the DSP
C. Hua, J. Lin / Energy Conversion and Management 45 (2004) 911–925 923
controller were built and tested. The National Instruments Company AT-MIO-16E-10 is used asthe data acquisition board with Libview software drive for interfacing. Twenty modules of solararray (PTA-50ps) in series were used in the system. Each module has a maximum power output of50 W. The control software was written in DSP language and was tested and debugged using theTMS320 simulator running on the host PC. Finally, the software was downloaded to the DSPboard.
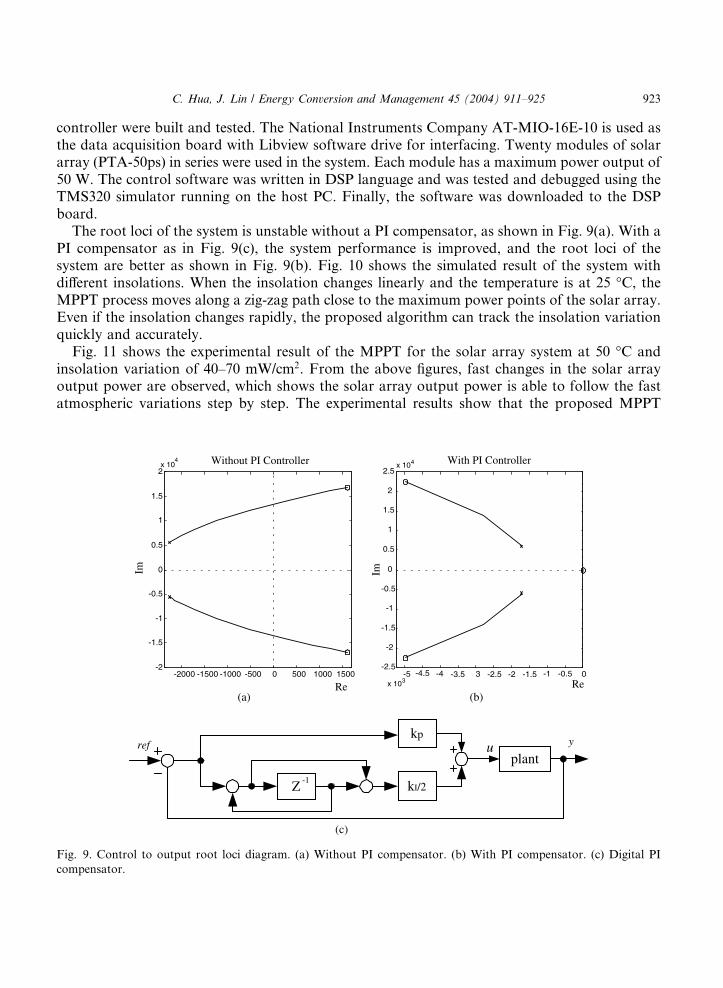
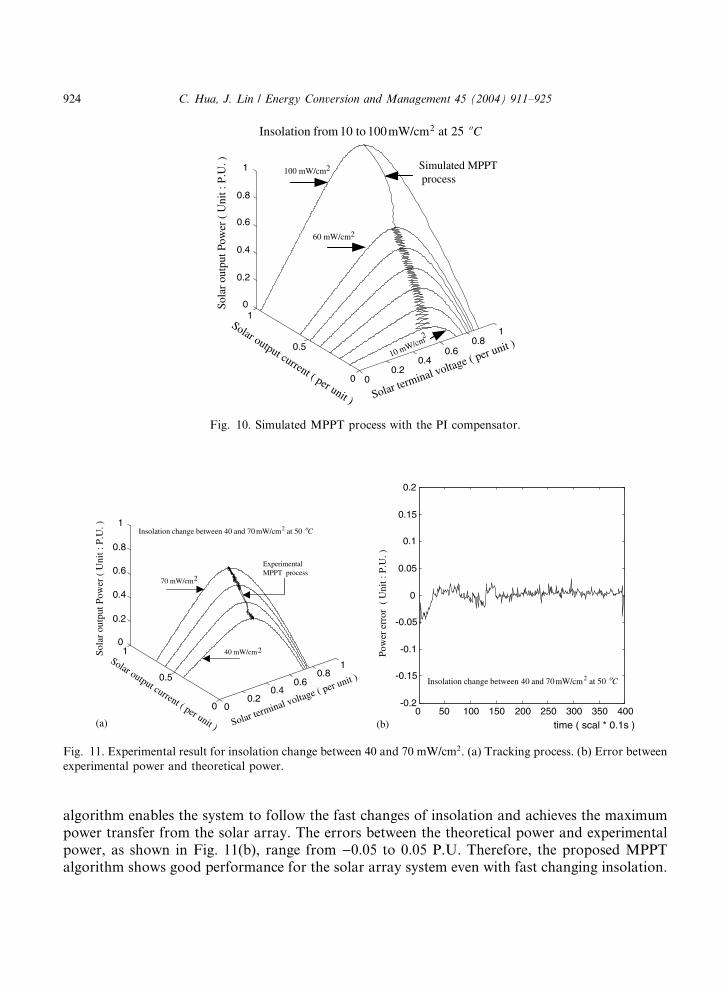
The root loci of the system is unstable without a PI compensator, as shown in Fig. 9(a). With aPI compensator as in Fig. 9(c), the system performance is improved, and the root loci of thesystem are better as shown in Fig. 9(b). Fig. 10 shows the simulated result of the system withdifferent insolations. When the insolation changes linearly and the temperature is at 25 �C, theMPPT process moves along a zig-zag path close to the maximum power points of the solar array.Even if the insolation changes rapidly, the proposed algorithm can track the insolation variationquickly and accurately.
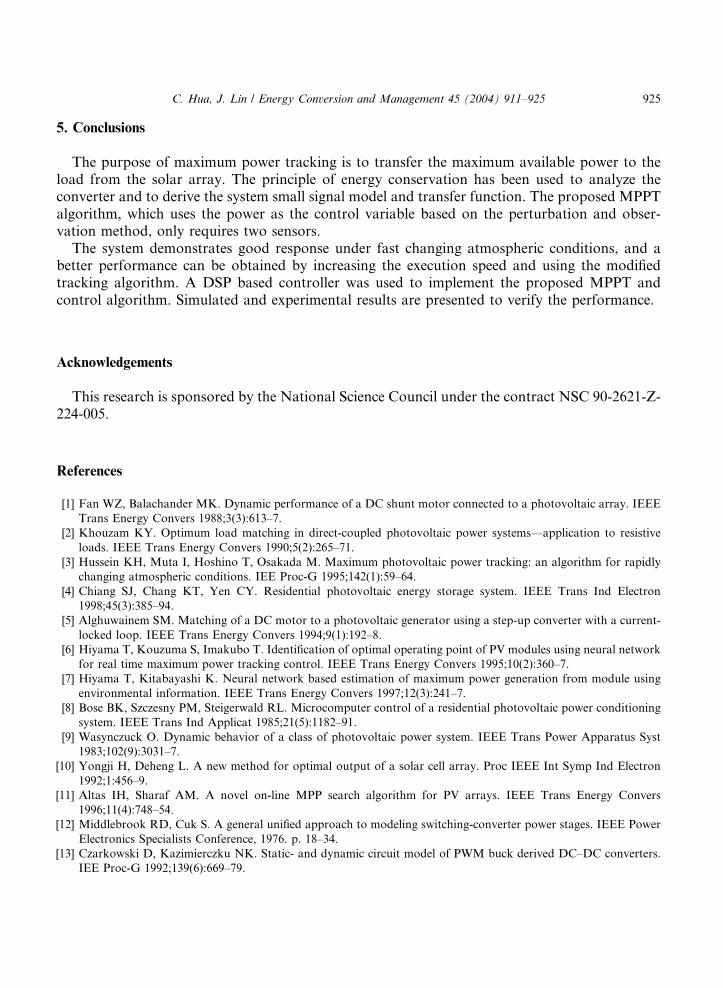
Fig. 11 shows the experimental result of the MPPT for the solar array system at 50 �C andinsolation variation of 40–70 mW/cm2. From the above figures, fast changes in the solar arrayoutput power are observed, which shows the solar array output power is able to follow the fastatmospheric variations step by step. The experimental results show that the proposed MPPT
-2000 -1500 -1000 -500 0 500 1000 1500-2
-1.5
-1
-0.5
0
0.5
1
1.5
2x 10
4
Re
Without PI Controller
Im
(a)
Im
Re
With PI Controller
-5 -4.5 -4 -3.5 3 -2.5 -2 -1.5 -1 -0.5 0-2.5
-2
-1.5
-1
-0.5
0
0.5
1
1.5
2
2.5x 104
x 103
(b)
planty
Z-1
ref ukp
kI/2
(c)
Fig. 9. Control to output root loci diagram. (a) Without PI compensator. (b) With PI compensator. (c) Digital PI
compensator.
Solar terminal voltage ( per unit )
Solar output current ( per unit )
00.2
0.40.6
0.81
0
0.5
1
100 mW/cm2
10 mW/cm2
Simulated MPPT process
0
0.2
0.4
0.6
0.8
1
60 mW/cm2
Sola
r ou
tput
Pow
er (
Uni
t : P
.U. )
Co25atmW/cm100to01fromInsolation 2
Fig. 10. Simulated MPPT process with the PI compensator.
Co50atmW/cm70and40betweenchangeInsolation 2
ExperimentalMPPT process
00.2
0.40.6
0.81
0
0.5
10
0.2
0.4
0.6
0.8
1
Solar terminal voltage ( per unit )
Solar output current ( per unit )
40 mW/cm2
70 mW/cm2
Sola
r ou
tput
Pow
er (
Uni
t : P
.U. )
(a)0 50 100 150 200 250 300 350 400
-0.2
-0.15
-0.1
-0.05
0
0.05
0.1
0.15
0.2
Co50atmW/cm70and40betweenchangeInsolation 2
time ( scal * 0.1s )
Pow
er e
rror
( U
nit :
P.U
. )
(b)
Fig. 11. Experimental result for insolation change between 40 and 70 mW/cm2. (a) Tracking process. (b) Error between
experimental power and theoretical power.
924 C. Hua, J. Lin / Energy Conversion and Management 45 (2004) 911–925
algorithm enables the system to follow the fast changes of insolation and achieves the maximumpower transfer from the solar array. The errors between the theoretical power and experimentalpower, as shown in Fig. 11(b), range from )0.05 to 0.05 P.U. Therefore, the proposed MPPTalgorithm shows good performance for the solar array system even with fast changing insolation.
C. Hua, J. Lin / Energy Conversion and Management 45 (2004) 911–925 925
5. Conclusions
The purpose of maximum power tracking is to transfer the maximum available power to theload from the solar array. The principle of energy conservation has been used to analyze theconverter and to derive the system small signal model and transfer function. The proposed MPPTalgorithm, which uses the power as the control variable based on the perturbation and obser-vation method, only requires two sensors.
The system demonstrates good response under fast changing atmospheric conditions, and abetter performance can be obtained by increasing the execution speed and using the modifiedtracking algorithm. A DSP based controller was used to implement the proposed MPPT andcontrol algorithm. Simulated and experimental results are presented to verify the performance.
Acknowledgements
This research is sponsored by the National Science Council under the contract NSC 90-2621-Z-224-005.
References
[1] Fan WZ, Balachander MK. Dynamic performance of a DC shunt motor connected to a photovoltaic array. IEEE
Trans Energy Convers 1988;3(3):613–7.
[2] Khouzam KY. Optimum load matching in direct-coupled photovoltaic power systems––application to resistive
loads. IEEE Trans Energy Convers 1990;5(2):265–71.
[3] Hussein KH, Muta I, Hoshino T, Osakada M. Maximum photovoltaic power tracking: an algorithm for rapidly
changing atmospheric conditions. IEE Proc-G 1995;142(1):59–64.
[4] Chiang SJ, Chang KT, Yen CY. Residential photovoltaic energy storage system. IEEE Trans Ind Electron
1998;45(3):385–94.
[5] Alghuwainem SM. Matching of a DC motor to a photovoltaic generator using a step-up converter with a current-
locked loop. IEEE Trans Energy Convers 1994;9(1):192–8.
[6] Hiyama T, Kouzuma S, Imakubo T. Identification of optimal operating point of PV modules using neural network
for real time maximum power tracking control. IEEE Trans Energy Convers 1995;10(2):360–7.
[7] Hiyama T, Kitabayashi K. Neural network based estimation of maximum power generation from module using
environmental information. IEEE Trans Energy Convers 1997;12(3):241–7.
[8] Bose BK, Szczesny PM, Steigerwald RL. Microcomputer control of a residential photovoltaic power conditioning
system. IEEE Trans Ind Applicat 1985;21(5):1182–91.
[9] Wasynczuck O. Dynamic behavior of a class of photovoltaic power system. IEEE Trans Power Apparatus Syst
1983;102(9):3031–7.
[10] Yongji H, Deheng L. A new method for optimal output of a solar cell array. Proc IEEE Int Symp Ind Electron
1992;1:456–9.
[11] Altas IH, Sharaf AM. A novel on-line MPP search algorithm for PV arrays. IEEE Trans Energy Convers
1996;11(4):748–54.
[12] Middlebrook RD, Cuk S. A general unified approach to modeling switching-converter power stages. IEEE Power
Electronics Specialists Conference, 1976. p. 18–34.
[13] Czarkowski D, Kazimierczku NK. Static- and dynamic circuit model of PWM buck derived DC–DC converters.
IEE Proc-G 1992;139(6):669–79.