Embed Size (px)
Citation preview
Research Report Agreement T2695, Task 56
SR 7 Peds
A MOTORIST AND PEDESTRIAN BEHAVIORAL ANALYSIS ON SR 7
by
Jaime M. Kopf Mark E. Hallenbeck Research Engineer Director
Washington State Transportation Center (TRAC) University of Washington, Box 354802
University District Building 1107 NE 45th Street, Suite 535
Seattle, Washington 98105-4631
Washington State Department of Transportation Technical Monitor Paula Reeves, Local Planning Liaison Highway and Local Programs Division
Prepared for Washington State Transportation Commission
Department of Transportation and in cooperation with
U.S. Department of Transportation Federal Highway Administration
November 2005
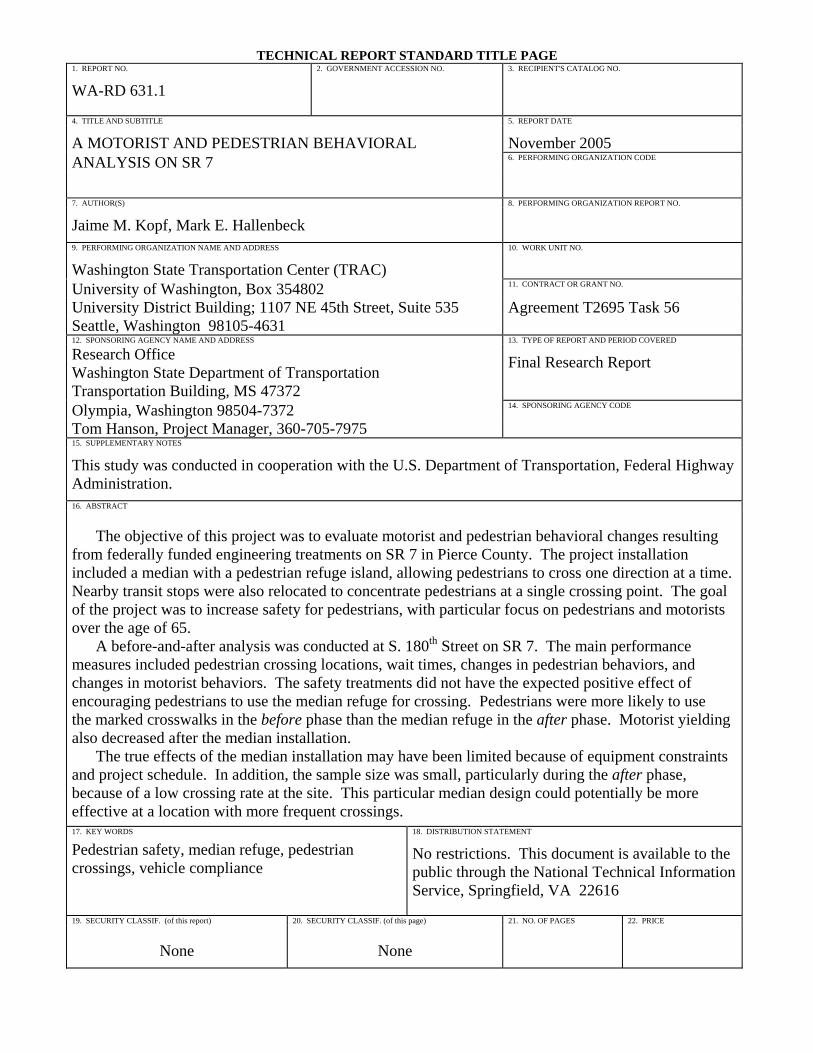
TECHNICAL REPORT STANDARD TITLE PAGE
1. REPORT NO. 2. GOVERNMENT ACCESSION NO. 3. RECIPIENT'S CATALOG NO.
WA-RD 631.1
4. TITLE AND SUBTITLE 5. REPORT DATE
A MOTORIST AND PEDESTRIAN BEHAVIORAL November 2005 ANALYSIS ON SR 7 6. PERFORMING ORGANIZATION CODE 7. AUTHOR(S) 8. PERFORMING ORGANIZATION REPORT NO.
Jaime M. Kopf, Mark E. Hallenbeck 9. PERFORMING ORGANIZATION NAME AND ADDRESS 10. WORK UNIT NO.
Washington State Transportation Center (TRAC) University of Washington, Box 354802 11. CONTRACT OR GRANT NO.
University District Building; 1107 NE 45th Street, Suite 535 Agreement T2695 Task 56 Seattle, Washington 98105-4631 12. SPONSORING AGENCY NAME AND ADDRESS 13. TYPE OF REPORT AND PERIOD COVERED
Research Office Washington State Department of Transportation Transportation Building, MS 47372
Final Research Report
Olympia, Washington 98504-7372 14. SPONSORING AGENCY CODE
Tom Hanson, Project Manager, 360-705-7975 15. SUPPLEMENTARY NOTES
This study was conducted in cooperation with the U.S. Department of Transportation, Federal Highway Administration. 16. ABSTRACT
The objective of this project was to evaluate motorist and pedestrian behavioral changes resulting from federally funded engineering treatments on SR 7 in Pierce County. The project installation included a median with a pedestrian refuge island, allowing pedestrians to cross one direction at a time. Nearby transit stops were also relocated to concentrate pedestrians at a single crossing point. The goal of the project was to increase safety for pedestrians, with particular focus on pedestrians and motorists over the age of 65.
A before-and-after analysis was conducted at S. 180th Street on SR 7. The main performance measures included pedestrian crossing locations, wait times, changes in pedestrian behaviors, and changes in motorist behaviors. The safety treatments did not have the expected positive effect of encouraging pedestrians to use the median refuge for crossing. Pedestrians were more likely to use the marked crosswalks in the before phase than the median refuge in the after phase. Motorist yielding also decreased after the median installation.
The true effects of the median installation may have been limited because of equipment constraints and project schedule. In addition, the sample size was small, particularly during the after phase, because of a low crossing rate at the site. This particular median design could potentially be more effective at a location with more frequent crossings. 17. KEY WORDS 18. DISTRIBUTION STATEMENT
Pedestrian safety, median refuge, pedestrian crossings, vehicle compliance
No restrictions. This document is available to the public through the National Technical Information Service, Springfield, VA 22616
19. SECURITY CLASSIF. (of this report) 20. SECURITY CLASSIF. (of this page) 21. NO. OF PAGES 22. PRICE
None None

DISCLAIMER
The contents of this report reflect the views of the authors, who are responsible
for the facts and the accuracy of the data presented herein. The contents do not
necessarily reflect the official views or policies of the Washington State Transportation
Commission, Washington State Department of Transportation, or Federal Highway
Administration. This report does not constitute a standard, specification, or regulation.
iii

iv
CONTENTS
EXECUTIVE SUMMARY ..................................................................................... vii SECTION ONE: PROJECT OVERVIEW ........................................................... 1 Site Descriptions ........................................................................................................ 2 Report Purpose and Approach ................................................................................... 3 Report Content ........................................................................................................... 3
SECTION TWO: RESEARCH APPROACH ...................................................... 5 Administer Collection................................................................................................ 5 Video Technology............................................................................................. 5 Observation Boundaries.................................................................................... 6 Observation Periods .......................................................................................... 7 Data Elements ................................................................................................... 8 Perform Before-After Analysis.................................................................................. 8 Document Project Findings and Recommendations .................................................. 9
SECTION THREE: SAFETY TREATMENT EVALUATED IN THE STUDY 10
SECTION FOUR: BEFORE-AND-AFTER ANALYSIS .................................... 13 Sample Comparison ................................................................................................... 13 Pedestrian Crossing Paths .......................................................................................... 15 Changes in Pedestrians’ and Motorists’ Behavior ..................................................... 17 Effect of Median on Yielding Behavior............................................................ 17 Shielding Conflicts............................................................................................ 20 Pedestrian Delay ............................................................................................... 20 Pedestrian and Vehicle Evasive Behavior ........................................................ 22
SECTION FIVE: DISCUSSION AND CONCLUSIONS ................................... 24
APPENDIX A: PEDESTRIAN AND MOTORIST OBSERVATION FORM .. A-1
v
FIGURES
Figure Page 1 Camera view north of S. 180th St. .................................................................. 2 2 Camera view south of S. 180th St................................................................... 3 3 Observation boundaries for after data collection........................................... 7 4 Pedestrian refuge islands at S. 180th Street and SR 7 .................................... 10 5 Transit stop locations at S. 180th Street and SR 7.......................................... 11 6 Percentage of transit related crossings........................................................... 14 7 Pedestrian crossing paths to the north of S. 180th Street................................ 15 8 Pedestrian crossing paths to the south of S. 180th Street ............................... 16 9 Pedestrian crossing paths after median treatment.......................................... 17 10 Pedestrian wait time before crossing ............................................................. 20 11 Pedestrian wait time in the center lane/median.............................................. 21 12 Pedestrian and vehicle evasive action............................................................ 23
TABLES
Table Page 1 Observation periods ....................................................................................... 7 2 Performance measures ................................................................................... 8 3 Average crossings per hour............................................................................ 14 4 Use of the crosswalks and median refuge...................................................... 17 5 Percentage of crossings when vehicles yielded for pedestrians..................... 18 6 Average number of vehicles that did not yield per crossing event ................ 18 7 Percentage of southbound vehicles yielding based on crossing paths........... 19 8 Percentage of northbound vehicles yielding based on crossing paths ........... 19 9 Pedestrian and vehicle evasive action............................................................ 23
vi
EXECUTIVE SUMMARY
The objective of this project was to evaluate motorist and pedestrian behavioral
changes resulting from federally funded engineering treatments on SR 7 in Pierce
County. The location was designated for a pilot project because of an at-risk population
of older road users. The project installation included a median with a pedestrian refuge
island, allowing pedestrians to cross one direction at a time. Nearby transit stops were
also relocated to concentrate pedestrians at a single crossing point. The goal of the
project was to increase safety for pedestrians, with particular focus on pedestrians and
motorists over the age of 65.
A before-and-after analysis was conducted at S. 180th Street on SR 7. The main
performance measures included pedestrian crossing locations, wait times, changes in
pedestrian behaviors, and changes in motorist behaviors. The safety treatments did not
have the expected positive effect of encouraging pedestrians to use the median refuge for
crossing. Pedestrians were more likely to use the marked crosswalks in the before phase
than the median refuge in the after phase. Motorist yielding also decreased after the
median installation.
The true effects of the median installation may have been limited because of
equipment constraints and project schedule. In addition, the sample size was small,
particularly during the after phase, because of a low crossing rate at the site. This
particular median design could potentially be more effective at a location with more
frequent crossings.
WSDOT should review the findings of the before-and-after analysis to determine
the most effective roadway treatments for pedestrian safety at the project site, as well as
at other pedestrian crossing locations around the state.
vii

viii
SECTION ONE PROJECT OVERVIEW
Over the past eight years, 262 collisions involving “older” motorists (254) and
pedestrians (eight) occurred on a 1-mile section of State Route 7 through Spanaway in
Pierce County1. Especially important in this area is pedestrian safety, as many trips in
this community begin or end as pedestrian trips. School children and transit riders rely
on safe walking routes to their bus stops. Pierce Transit reports that more than 220 transit
riders board buses within 1 mile of the 1-mile study area per day. In particular, the SR 7
corridor has a high proportion of older road users (age 65 and older) who are dependent
on good pedestrian walkways.
To address the safety issues in this corridor, a federally funded pedestrian safety
project was initiated. This project applied the measures detailed in FHWA’s Highway
Design Handbook for Older Drivers and Pedestrians. The goal of the project was to
increase safety for older pedestrians and decrease the number of pedestrian and motor
vehicle accidents among older drivers. The approach was to increase safety for the
general population, assuming that this would also increase safety for the subset of older
road users. If these proposed solutions proved successful, they could be replicated at
other pedestrian accident locations on state routes.
The highway improvement project focused on safety conditions for pedestrians
and motorists between South 176th Street and South 189th Street along SR 7 in Spanaway.
This report evaluates the pedestrian improvement on SR 7 near S. 180th Street. The
improvement included concentrating pedestrians at a single crossing point and relocating
bus stops closer to where pedestrians will attempt to cross the main street. Also, because
SR 7 is a heavily traveled street, a median was built with a pedestrian refuge island to
allow pedestrians to cross the traffic one direction at a time.
1 FHWA Cooperative Agreement “Highway Improvements on State Route 7 to Aid Older Road Users”
1
SITE DESCRIPTION
South 180th Street intersects with SR 7 from the east. The study area contains no
signalized intersections. Before the pedestrian improvements of this project, there were
marked crosswalks to the north and south of S. 180th Street. The roadway consists of two
general-purpose lanes in each direction, with a center left-turn lane. The posted speed
limit for the corridor is 40 miles per hour. The fence for the Fort Lewis Military
Reservation borders the west side of the roadway. The east side contains numerous
driveways to commercial shops. There are no sidewalks, only shoulders. Transit stops
are located in both directions. The average daily traffic volume for the area is
approximately 40,000, as recorded in the WSDOT 2003 Annual Traffic Report.
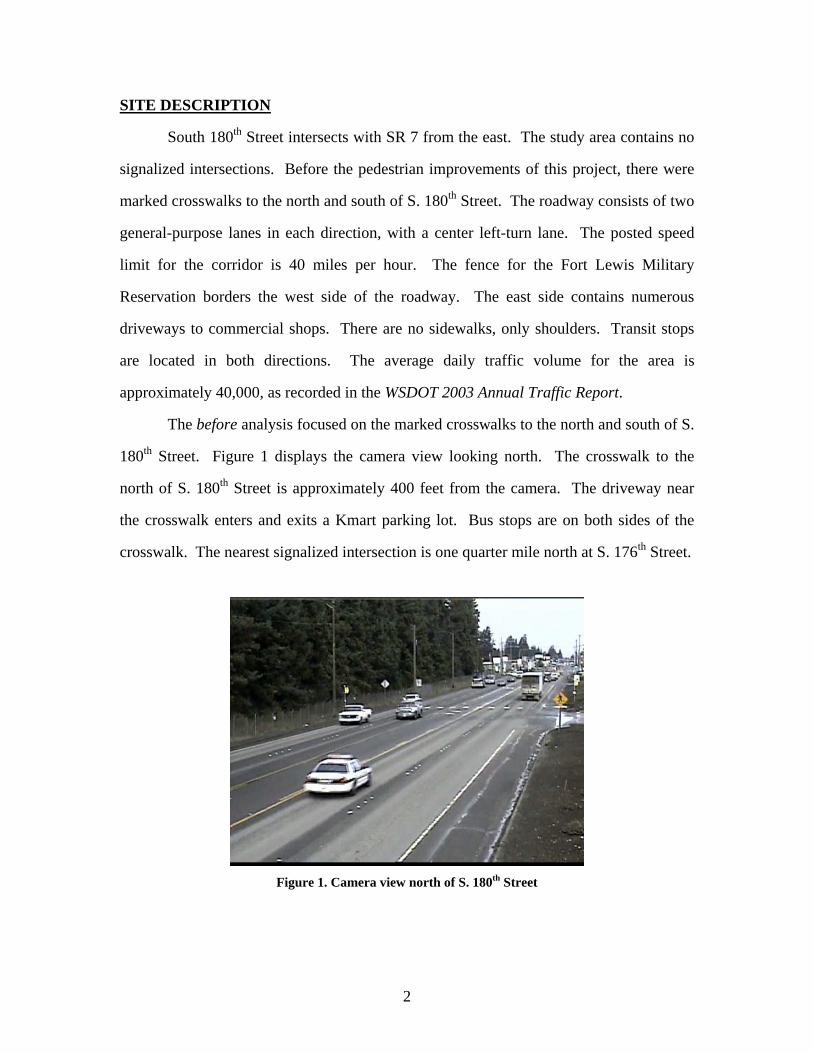
The before analysis focused on the marked crosswalks to the north and south of S.
180th Street. Figure 1 displays the camera view looking north. The crosswalk to the
north of S. 180th Street is approximately 400 feet from the camera. The driveway near
the crosswalk enters and exits a Kmart parking lot. Bus stops are on both sides of the
crosswalk. The nearest signalized intersection is one quarter mile north at S. 176th Street.
Figure 1. Camera view north of S. 180th Street
2
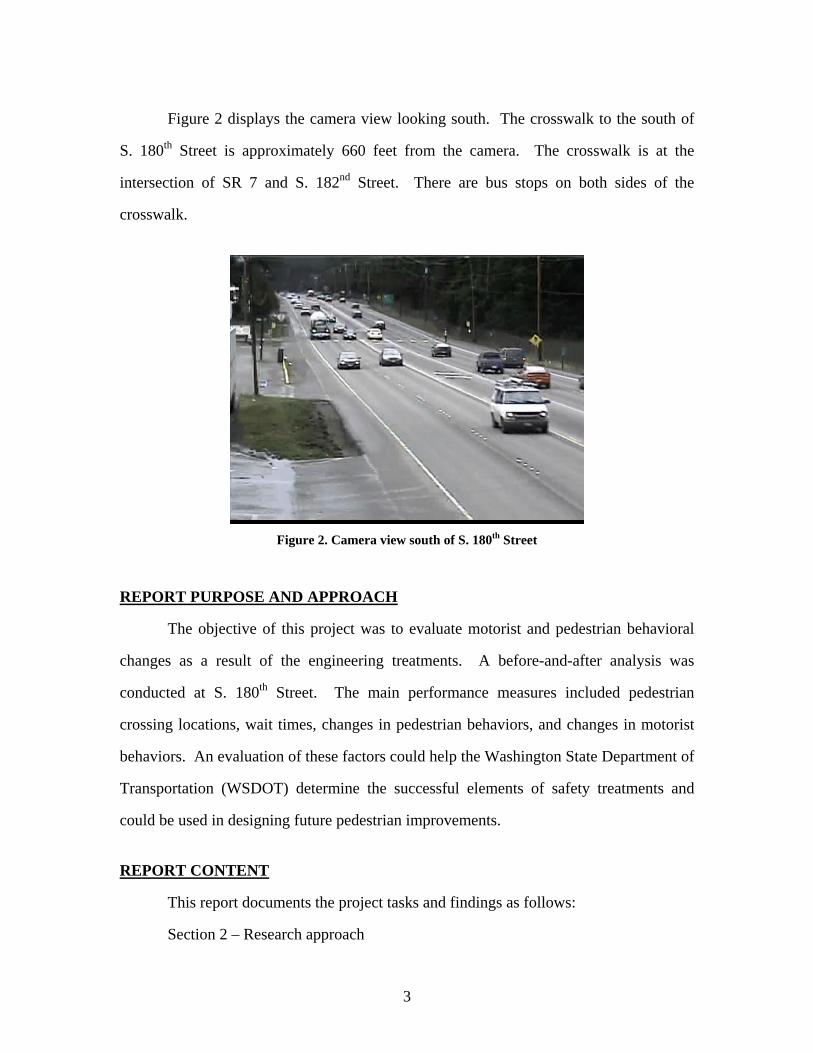
Figure 2 displays the camera view looking south. The crosswalk to the south of
S. 180th Street is approximately 660 feet from the camera. The crosswalk is at the
intersection of SR 7 and S. 182nd Street. There are bus stops on both sides of the
crosswalk.
Figure 2. Camera view south of S. 180th Street
REPORT PURPOSE AND APPROACH
The objective of this project was to evaluate motorist and pedestrian behavioral
changes as a result of the engineering treatments. A before-and-after analysis was
conducted at S. 180th Street. The main performance measures included pedestrian
crossing locations, wait times, changes in pedestrian behaviors, and changes in motorist
behaviors. An evaluation of these factors could help the Washington State Department of
Transportation (WSDOT) determine the successful elements of safety treatments and
could be used in designing future pedestrian improvements.
REPORT CONTENT
This report documents the project tasks and findings as follows:
Section 2 – Research approach
3
Section 3 – Safety treatments evaluated in the study
Section 4 – Before-and-after analysis
Section 5 – Discussion and conclusions
4
SECTION TWO RESEARCH APPROACH
The main tasks of the project were the following:
• administer data collection
• perform the before-after analysis
• document project findings and recommendations.
These tasks are described in more detail in this section.
ADMINISTER DATA COLLECTION
Video Technology
The project planned for data on motorist and pedestrian movements to be
collected with a video image detection system marketed by Digital Traffic Systems, Inc.
(DTS). The DTS system was designed to allow automated monitoring of pedestrian and
vehicular movements in the roadway. This image tracking technology would enable the
researchers to conduct cost effective, long-term data collection that would increase the
statistical reliability of the analysis. The goal of the project was to use the advanced
system to improve the state’s ability to test the effectiveness of a wide variety of safety
treatments, beginning with safety on the SR 7 corridor.
WSDOT staff built a self-contained system at S. 180th Street alongside SR 7 that
included a cabinet assembly with six batteries, a camera controller, and two digital video
recorders (DVR). The cabinet was connected to a pole with two solar panels and two
dome cameras attached. The cameras collected over 200 hours of video data for each of
the nearest crosswalks to the north and south of S. 180th Street.
The video device exhibited many problems during before data collection.
Difficulties arose in maintaining the power level to keep the cameras and DVRs
operating. In addition, problems with obtaining permission to place the cameras on
5
existing power poles resulted in placement of the system on a temporary pole. The height
of that temporary pole caused some problems in the image detection software, which
could not be calibrated to accurately detect pedestrian crossings. In fact, the software
rarely identified pedestrians and was inconsistent for vehicle movements as well.
Consequently, the data were reduced manually to determine pedestrian and vehicle
behaviors at the crosswalks, including crossing location, yielding, wait time, conflicts,
and various other measures. Manual data reduction required a significant amount of
time and eliminated the potential for using performance measures related to vehicle
speeds and speed changes.
Continual problems with the original equipment prompted purchase of a new
video data collection system for the after analysis. In collaboration with WSDOT’s
Northwest Region Signals Shop, a new system was put together to improve the process.
A new battery cabinet was designed, and a new DVR system was purchased. These
products had been tested by the Northwest Region for other projects and were deemed
successful. The new equipment eliminated the power problem encountered in the before
phase of the project. However, the after data still had to be analyzed manually because
the problems with the image detection software had not yet been resolved. Because of
the software’s potential to help researchers more cost effectively conduct these kinds of
studies, its use will continue to be explored in future projects.
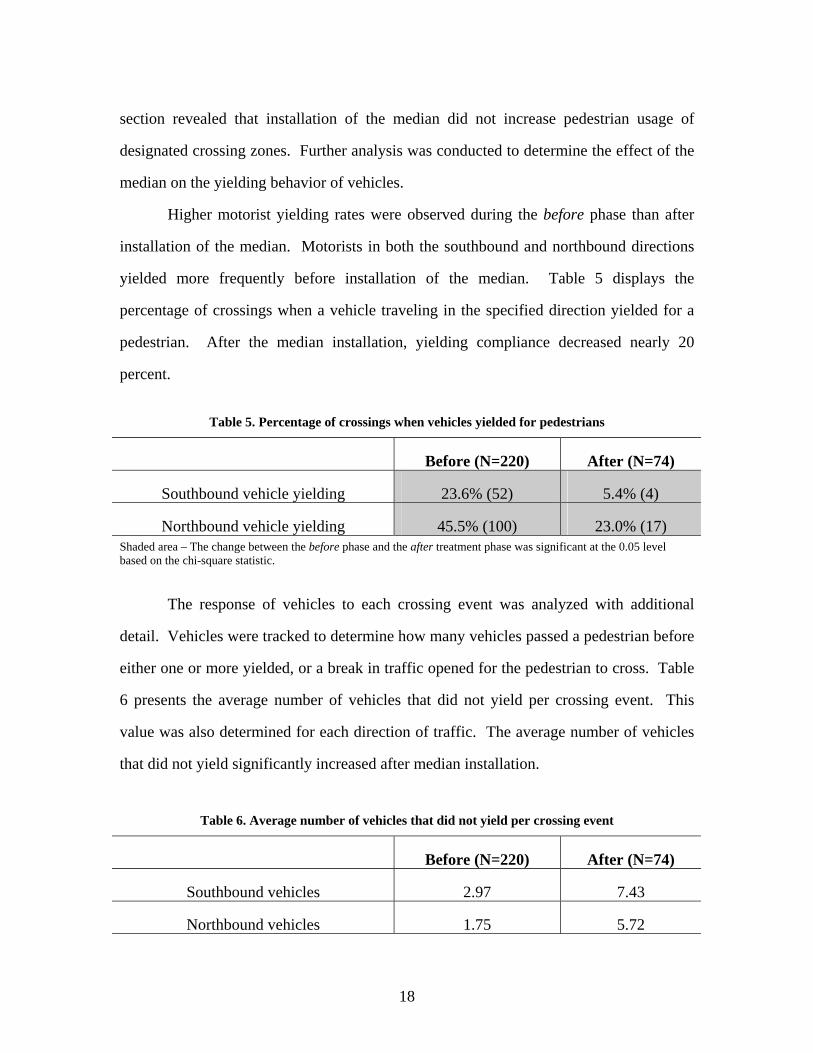
Observation Boundaries
The range of observations for the site is displayed in Figure 1 and Figure 2 in
Section One. The observation boundaries for before data were limited by the available
location for camera placement. During the after analysis, the camera was placed to the
south of S. 180th Street, facing north. Figure 3 displays the observation boundaries for
the after data collection.
6
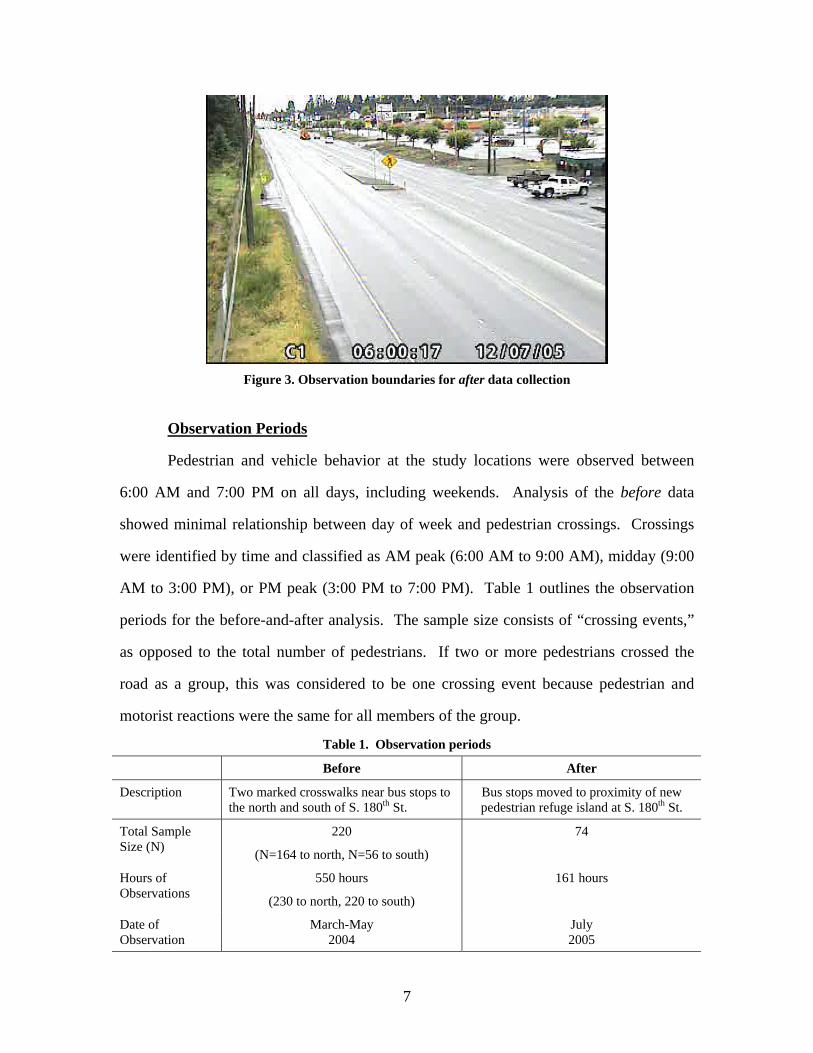
Figure 3. Observation boundaries for after data collection
Observation Periods
Pedestrian and vehicle behavior at the study locations were observed between
6:00 AM and 7:00 PM on all days, including weekends. Analysis of the before data
showed minimal relationship between day of week and pedestrian crossings. Crossings
were identified by time and classified as AM peak (6:00 AM to 9:00 AM), midday (9:00
AM to 3:00 PM), or PM peak (3:00 PM to 7:00 PM). Table 1 outlines the observation
periods for the before-and-after analysis. The sample size consists of “crossing events,”
as opposed to the total number of pedestrians. If two or more pedestrians crossed the
road as a group, this was considered to be one crossing event because pedestrian and
motorist reactions were the same for all members of the group.
Table 1. Observation periods
Before After
Description Two marked crosswalks near bus stops to the north and south of S. 180th St.
Bus stops moved to proximity of new pedestrian refuge island at S. 180th St.
Total Sample Size (N)
220
(N=164 to north, N=56 to south)
74
Hours of Observations
550 hours
(230 to north, 220 to south)
161 hours
Date of Observation
March-May 2004
July 2005
7
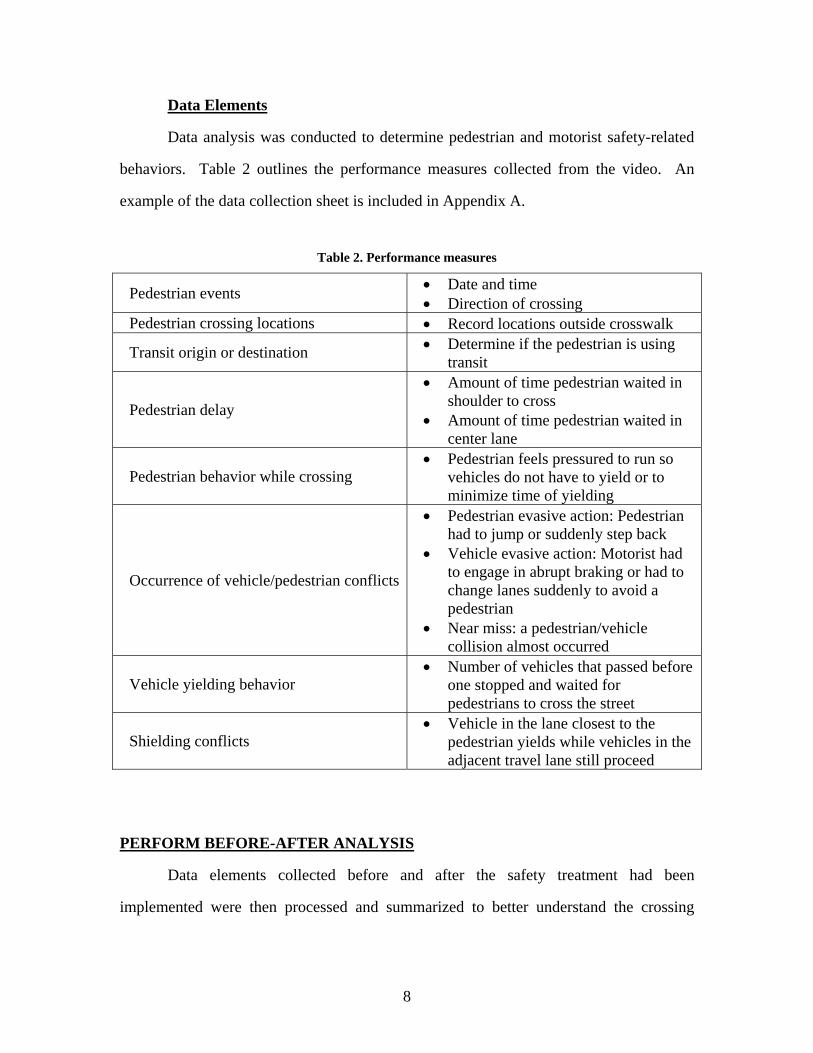
Data Elements
Data analysis was conducted to determine pedestrian and motorist safety-related
behaviors. Table 2 outlines the performance measures collected from the video. An
example of the data collection sheet is included in Appendix A.
Table 2. Performance measures
Pedestrian events • Date and time • Direction of crossing
Pedestrian crossing locations • Record locations outside crosswalk
Transit origin or destination • Determine if the pedestrian is using transit
Pedestrian delay
• Amount of time pedestrian waited in shoulder to cross
• Amount of time pedestrian waited in center lane
Pedestrian behavior while crossing • Pedestrian feels pressured to run so
vehicles do not have to yield or to minimize time of yielding
Occurrence of vehicle/pedestrian conflicts
• Pedestrian evasive action: Pedestrian had to jump or suddenly step back
• Vehicle evasive action: Motorist had to engage in abrupt braking or had to change lanes suddenly to avoid a pedestrian
• Near miss: a pedestrian/vehicle collision almost occurred
Vehicle yielding behavior • Number of vehicles that passed before
one stopped and waited for pedestrians to cross the street
Shielding conflicts • Vehicle in the lane closest to the
pedestrian yields while vehicles in the adjacent travel lane still proceed
PERFORM BEFORE-AFTER ANALYSIS
Data elements collected before and after the safety treatment had been
implemented were then processed and summarized to better understand the crossing
8
behaviors and patterns and to determine the treatment’s effectiveness in improving
pedestrian crossing safety.
DOCUMENT PROJECT FINDINGS AND RECOMMENDATIONS
The following sections of this report outline the results of the evaluation and can
be used as guidelines for future treatments on SR 7, as well as other pedestrian projects in
the state.
9
SECTION THREE SAFETY TREATMENT EVALUATED IN THE STUDY
The corridor being studied has a history of pedestrian crossing concerns. The area
has a growing population of “older” drivers, pedestrians, and transit users that is expected
to continue to increase. Most crossing pedestrians observed at the study locations
showed extreme caution, even when they were crossing in a legal marked crosswalk.
Pedestrians tended to wait a long time for a gap in the traffic to cross the street. Many
had to stop in the center lane and cross one direction at a time.
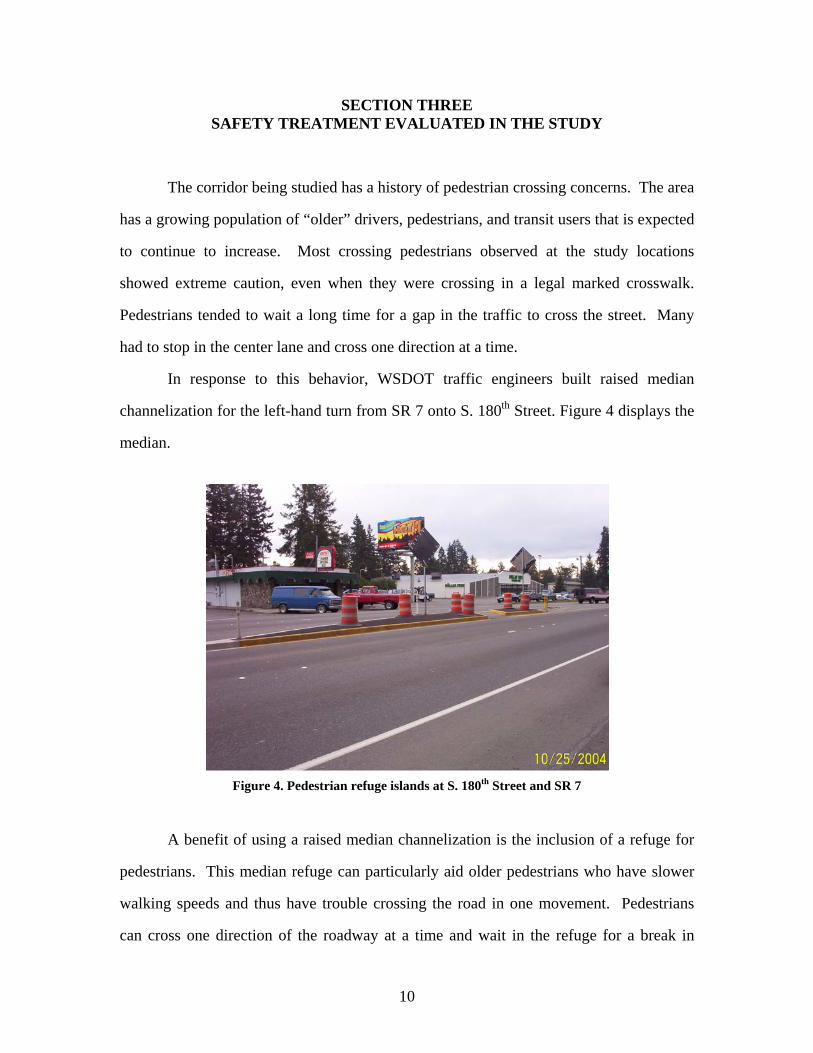
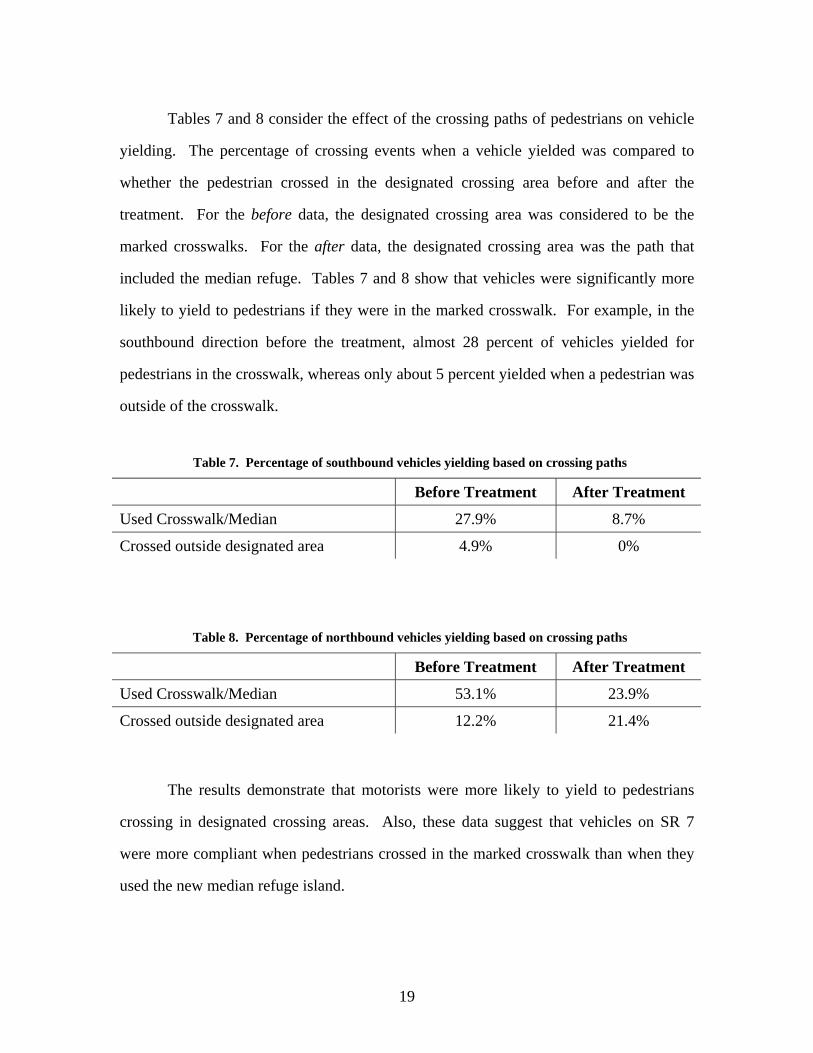
In response to this behavior, WSDOT traffic engineers built raised median
channelization for the left-hand turn from SR 7 onto S. 180th Street. Figure 4 displays the
median.
Figure 4. Pedestrian refuge islands at S. 180th Street and SR 7
A benefit of using a raised median channelization is the inclusion of a refuge for
pedestrians. This median refuge can particularly aid older pedestrians who have slower
walking speeds and thus have trouble crossing the road in one movement. Pedestrians
can cross one direction of the roadway at a time and wait in the refuge for a break in
10
traffic in the other direction. In addition, the channelization for left turns can make
drivers feel safer because they do not have to worry about other traffic in the center lane.
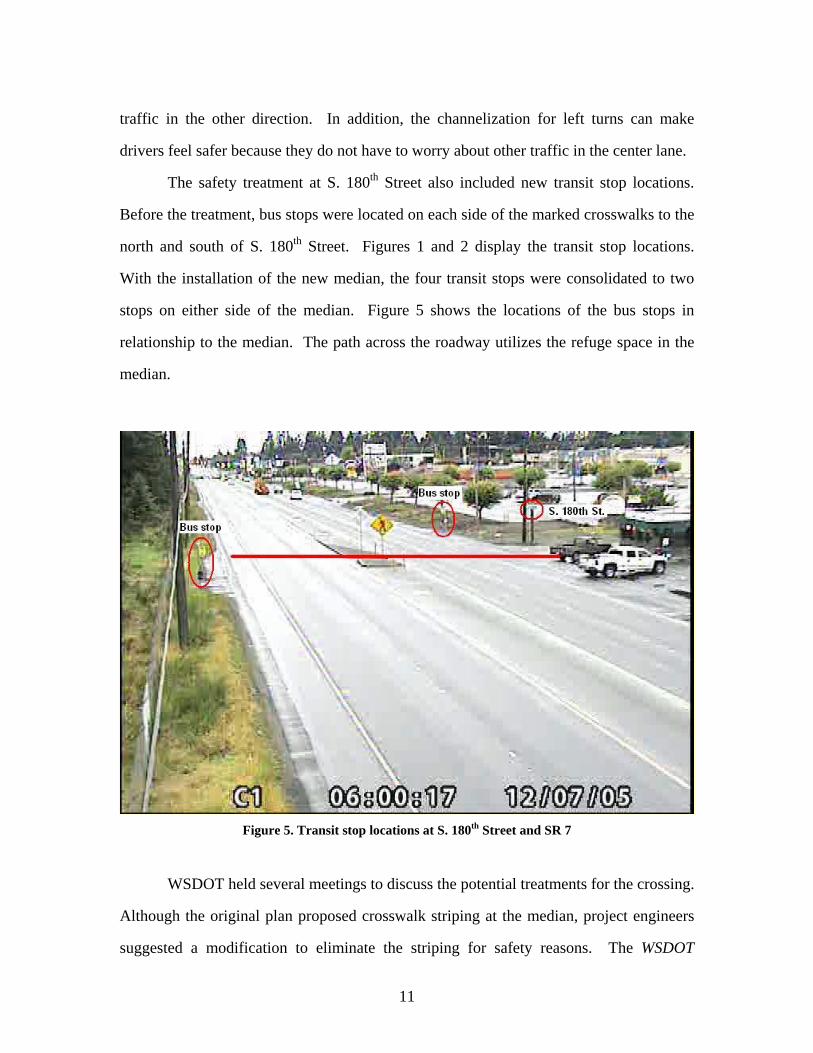
The safety treatment at S. 180th Street also included new transit stop locations.
Before the treatment, bus stops were located on each side of the marked crosswalks to the
north and south of S. 180th Street. Figures 1 and 2 display the transit stop locations.
With the installation of the new median, the four transit stops were consolidated to two
stops on either side of the median. Figure 5 shows the locations of the bus stops in
relationship to the median. The path across the roadway utilizes the refuge space in the
median.
Figure 5. Transit stop locations at S. 180th Street and SR 7
WSDOT held several meetings to discuss the potential treatments for the crossing.
Although the original plan proposed crosswalk striping at the median, project engineers
suggested a modification to eliminate the striping for safety reasons. The WSDOT
11
Design Manual currently does not support striping of mid-block crossings at locations on
State Route 7. However, the WSDOT Design Manual is being updated, and changes to
these standards are being considered. WSDOT has not decided what type of crossing
treatments to apply at the other mid-block crossings along the corridor at S. 184th and S.
188th streets, but it will make safety improvements. It will evaluate the findings of this
report to help make its final decision on crosswalk striping at S. 180th Street, as well as
the type of treatments to apply at the other two locations.
12
SECTION FOUR BEFORE-AND-AFTER ANALYSIS
This section presents the motorist and pedestrian behavioral changes observed as
a result of the roadway design improvements. The studied treatments were intended to
encourage pedestrians to cross at one central location, using the median refuge. The
median and pedestrian crossing signs were meant to increase the probability that
motorists would yield to crossing pedestrians. The findings are grouped as follows:
• a comparison of before and after data characteristics to determine if the samples
are similar
• a description of observed changes in pedestrians’ crossing paths.; this examines
the level of change in pedestrians’ crossing locations (e.g., whether pedestrians
used the crosswalks before the safety treatments and the median pedestrian refuge
area after it was installed)
• a discussion of the level of change in pedestrian and motorists’ behaviors related
to pedestrian safety (e.g., the willingness of drivers to stop for crossing
pedestrians before and after the implementation of the median, pedestrian and
vehicle conflicts, and wait times).
SAMPLE COMPARISON
Descriptive characteristics of the before and after data were compared to
determine whether the samples were statistically related. Table 1 in Section 2 displays
the number of hours of video collected at the site during the before and after testing. The
table also includes the number of crossings recorded in that time frame. These values
were used to compute the average number of crossings per hour at the site before and
after the treatment. Table 3 shows these results. The difference between the before
treatment and the after treatment is not statistically significant.
13
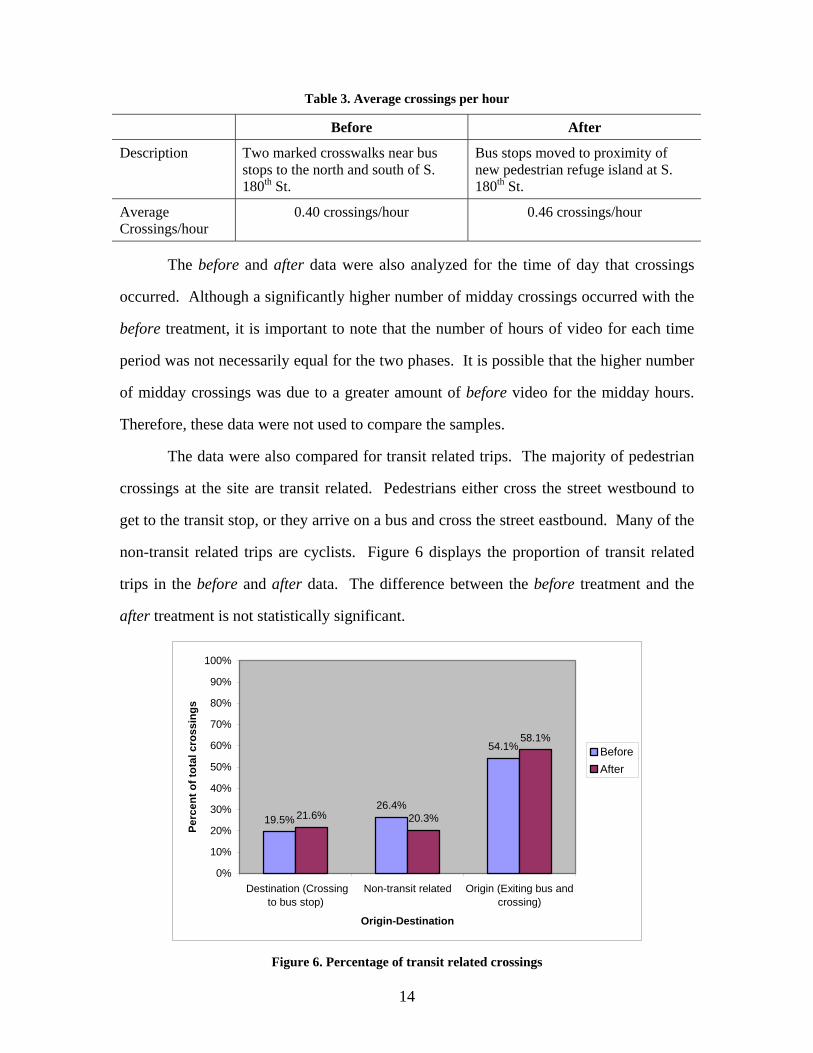
Table 3. Average crossings per hour
Before After
Description Two marked crosswalks near bus stops to the north and south of S. 180th St.
Bus stops moved to proximity of new pedestrian refuge island at S. 180th St.
Average Crossings/hour
0.40 crossings/hour 0.46 crossings/hour
The before and after data were also analyzed for the time of day that crossings
occurred. Although a significantly higher number of midday crossings occurred with the
before treatment, it is important to note that the number of hours of video for each time
period was not necessarily equal for the two phases. It is possible that the higher number
of midday crossings was due to a greater amount of before video for the midday hours.
Therefore, these data were not used to compare the samples.
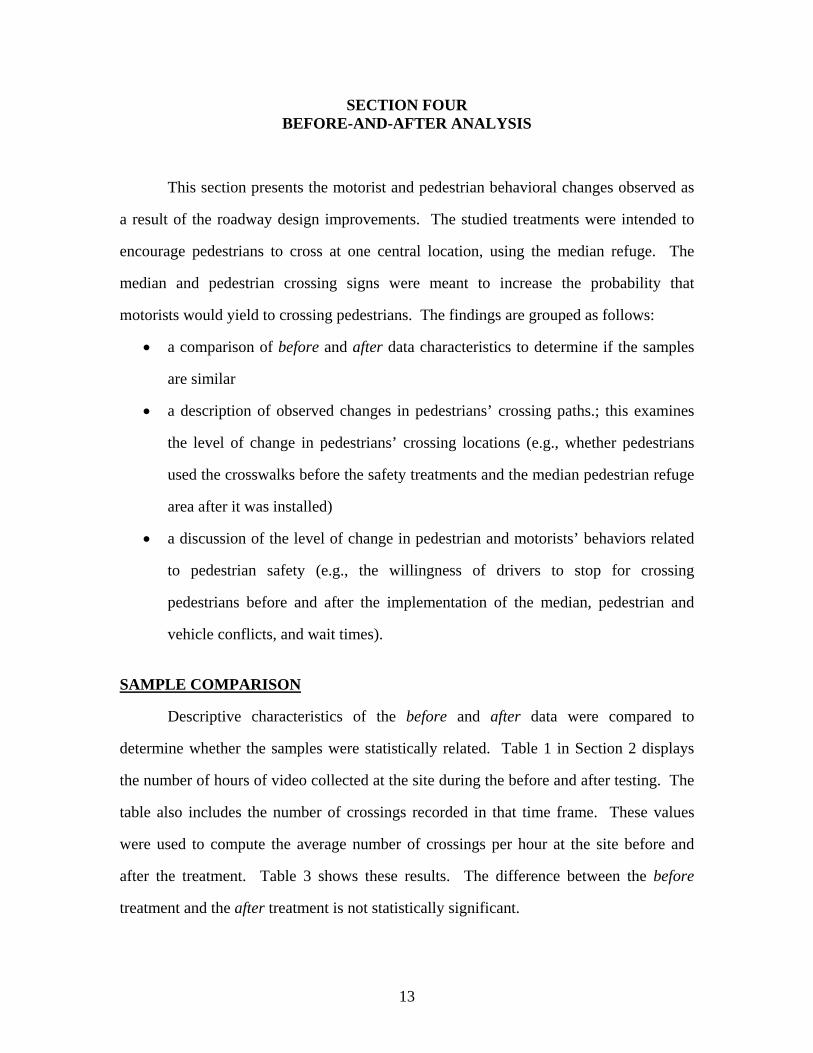
The data were also compared for transit related trips. The majority of pedestrian
crossings at the site are transit related. Pedestrians either cross the street westbound to
get to the transit stop, or they arrive on a bus and cross the street eastbound. Many of the
non-transit related trips are cyclists. Figure 6 displays the proportion of transit related
trips in the before and after data. The difference between the before treatment and the
after treatment is not statistically significant.
19.5%26.4%
54.1%
21.6% 20.3%
58.1%
0%
10%
20%
30%
40%
50%
60%
70%
80%
90%
100%
Destination (Crossingto bus stop)
Non-transit related Origin (Exiting bus andcrossing)
Origin-Destination
Perc
ent o
f tot
al c
ross
ings
BeforeAfter
Figure 6. Percentage of transit related crossings
14
PEDESTRIAN CROSSING PATHS
The study results revealed that pedestrians were less likely to use the median
refuge after implementation than to use the marked crosswalks before the changes. A
majority of pedestrians utilized the median refuge, but a large proportion crossed
randomly north and south of the median.
The before study showed that the majority of pedestrians crossed within the
marked crosswalks. Over 85 percent of the crossings to the north of S. 180th Street were
within the crosswalk. Over 65 percent of the crossings to the south of S. 180th Street
were within that crosswalk. When the crossing data for both directions were combined,
over 80 percent of the crossings were within the two marked crosswalks. Figures 7 and 8
display the crossing paths of the pedestrians in the before study.
Figure 7. Pedestrian crossing paths to the north of S. 180th Street
15
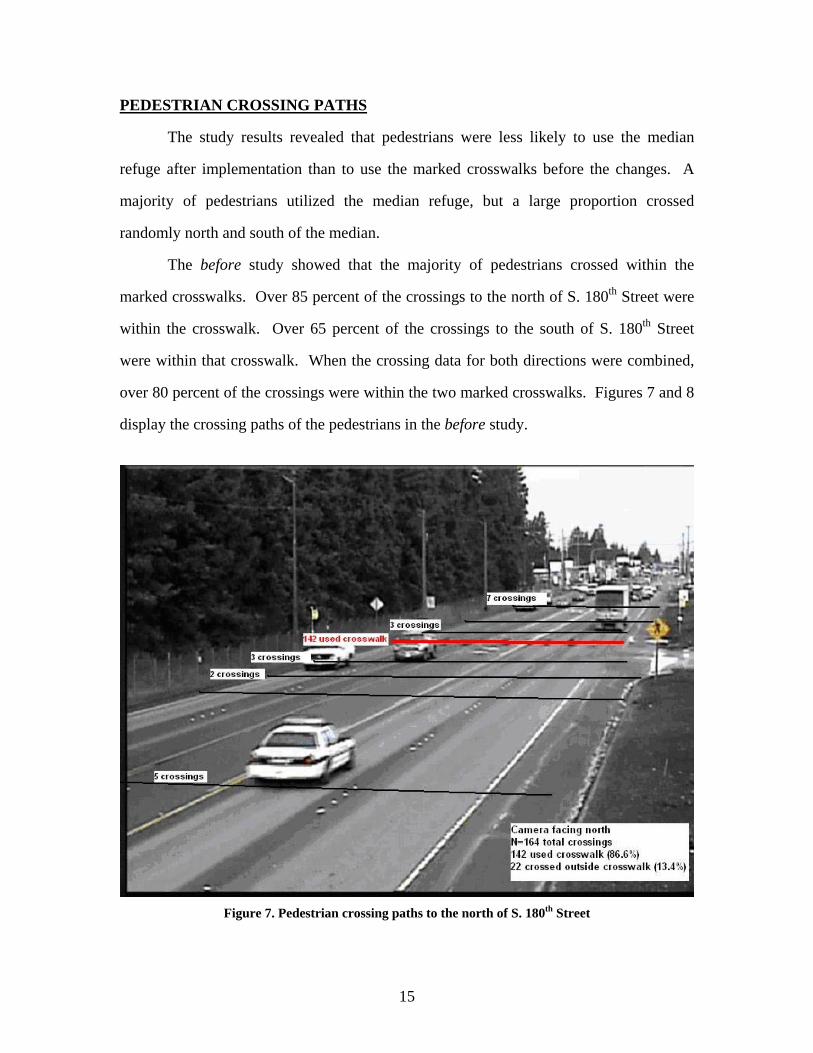
Figure 8. Pedestrian crossing paths to the south of S. 180th Street
The paths are labeled with the number of crossings at that location. If a path is
not labeled, it means that only one crossing occurred there. The factors that affected how
pedestrians crossed included the origins and destinations of the observed pedestrians and
whether there was a gap in traffic for crossing.
The installation of the pedestrian refuge did not funnel pedestrians to that crossing
location. After the treatment had been implemented, about 60 percent of pedestrians used
the median refuge area. Figure 9 displays the crossing paths after installation of the
median. Note that an additional 15 percent of the crossings occurred just to the south of
the median (path labeled “11 crossings” in Figure 9). The transit stop on the west side of
street is not parallel with the refuge area, and these additional 11 crossings occurred at the
point where the pedestrians exited the bus. These pedestrians were protected somewhat
by the median but did not follow the designated refuge path.
16
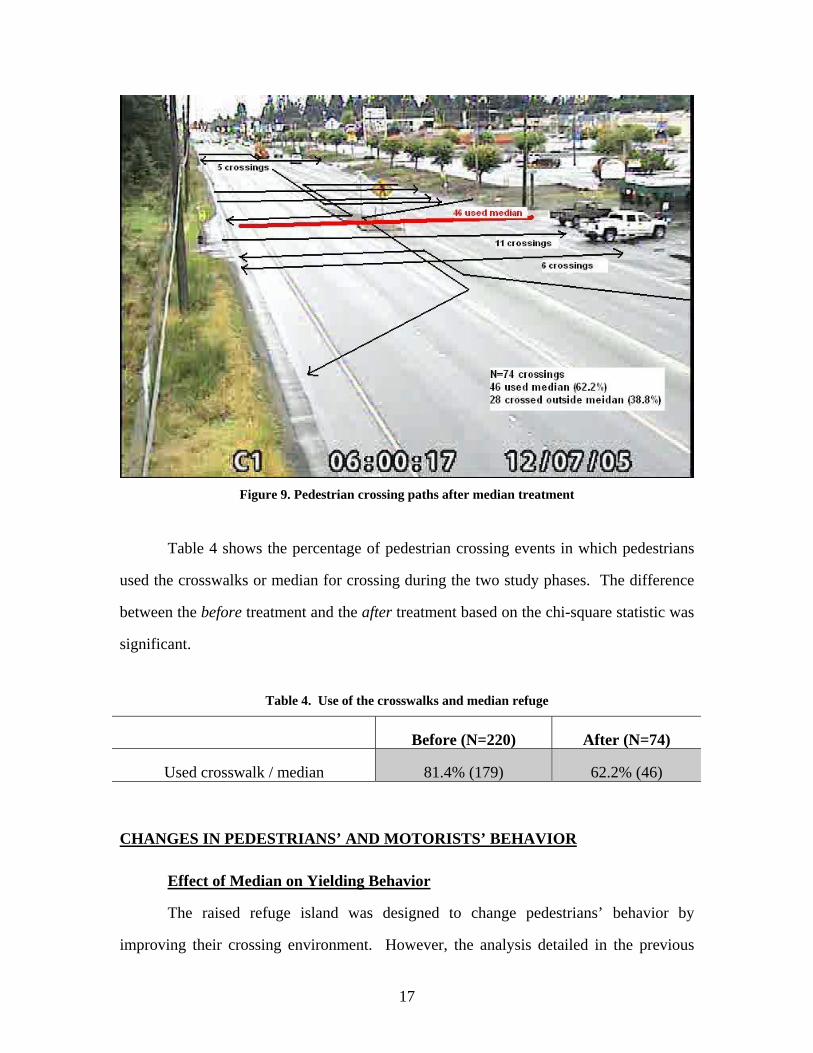
Figure 9. Pedestrian crossing paths after median treatment
Table 4 shows the percentage of pedestrian crossing events in which pedestrians
used the crosswalks or median for crossing during the two study phases. The difference
between the before treatment and the after treatment based on the chi-square statistic was
significant.
Table 4. Use of the crosswalks and median refuge
Before (N=220) After (N=74)
Used crosswalk / median 81.4% (179) 62.2% (46)
CHANGES IN PEDESTRIANS’ AND MOTORISTS’ BEHAVIOR
Effect of Median on Yielding Behavior
The raised refuge island was designed to change pedestrians’ behavior by
improving their crossing environment. However, the analysis detailed in the previous
17
section revealed that installation of the median did not increase pedestrian usage of
designated crossing zones. Further analysis was conducted to determine the effect of the
median on the yielding behavior of vehicles.
Higher motorist yielding rates were observed during the before phase than after
installation of the median. Motorists in both the southbound and northbound directions
yielded more frequently before installation of the median. Table 5 displays the
percentage of crossings when a vehicle traveling in the specified direction yielded for a
pedestrian. After the median installation, yielding compliance decreased nearly 20
percent.
Table 5. Percentage of crossings when vehicles yielded for pedestrians
Before (N=220) After (N=74)
Southbound vehicle yielding 23.6% (52) 5.4% (4)
Northbound vehicle yielding 45.5% (100) 23.0% (17) Shaded area – The change between the before phase and the after treatment phase was significant at the 0.05 level based on the chi-square statistic.
The response of vehicles to each crossing event was analyzed with additional
detail. Vehicles were tracked to determine how many vehicles passed a pedestrian before
either one or more yielded, or a break in traffic opened for the pedestrian to cross. Table
6 presents the average number of vehicles that did not yield per crossing event. This
value was also determined for each direction of traffic. The average number of vehicles
that did not yield significantly increased after median installation.
Table 6. Average number of vehicles that did not yield per crossing event
Before (N=220) After (N=74)
Southbound vehicles 2.97 7.43
Northbound vehicles 1.75 5.72
18
Tables 7 and 8 consider the effect of the crossing paths of pedestrians on vehicle
yielding. The percentage of crossing events when a vehicle yielded was compared to
whether the pedestrian crossed in the designated crossing area before and after the
treatment. For the before data, the designated crossing area was considered to be the
marked crosswalks. For the after data, the designated crossing area was the path that
included the median refuge. Tables 7 and 8 show that vehicles were significantly more
likely to yield to pedestrians if they were in the marked crosswalk. For example, in the
southbound direction before the treatment, almost 28 percent of vehicles yielded for
pedestrians in the crosswalk, whereas only about 5 percent yielded when a pedestrian was
outside of the crosswalk.
Table 7. Percentage of southbound vehicles yielding based on crossing paths
Before Treatment After Treatment
Used Crosswalk/Median 27.9% 8.7%
Crossed outside designated area 4.9% 0%
Table 8. Percentage of northbound vehicles yielding based on crossing paths
Before Treatment After Treatment
Used Crosswalk/Median 53.1% 23.9%
Crossed outside designated area 12.2% 21.4%
The results demonstrate that motorists were more likely to yield to pedestrians
crossing in designated crossing areas. Also, these data suggest that vehicles on SR 7
were more compliant when pedestrians crossed in the marked crosswalk than when they
used the new median refuge island.
19
Shielding Conflicts
A shielding conflict occurs when a vehicle in the lane closest to a pedestrian
yields while vehicles in adjacent travel lane(s) continue to proceed. In general, no
significant changes in the frequency of shielding conflict occurred after the installation of
the median at S. 180th Street.
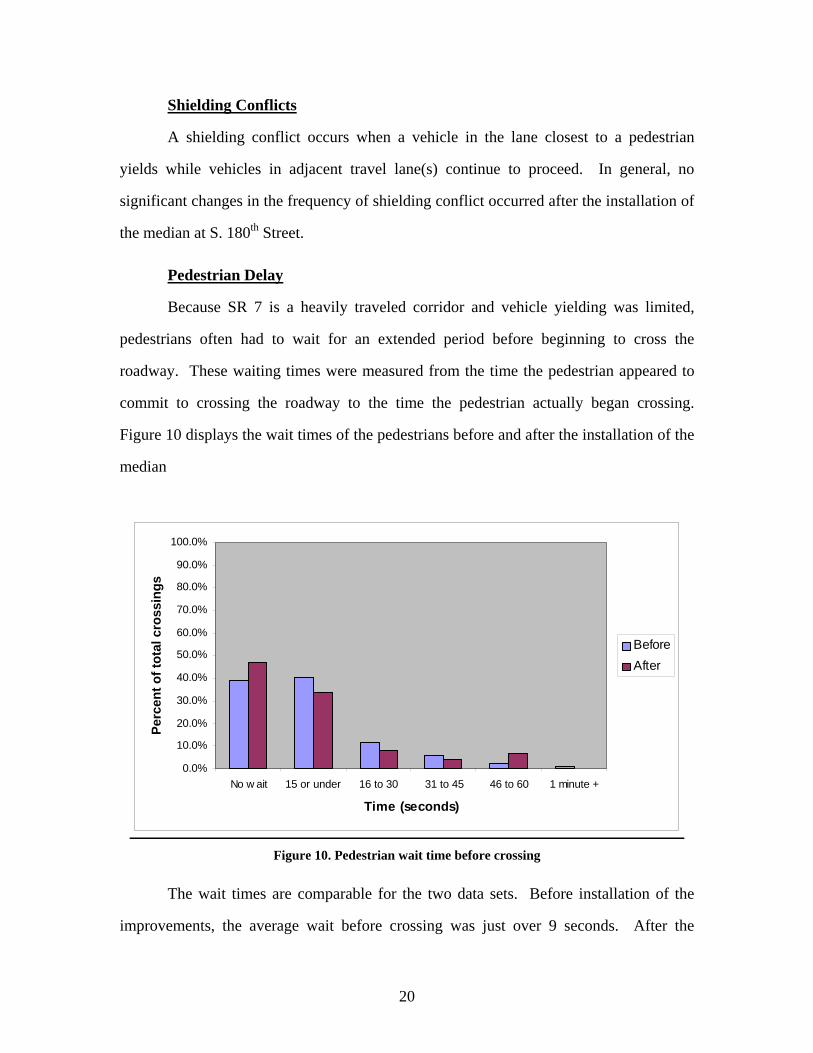
Pedestrian Delay
Because SR 7 is a heavily traveled corridor and vehicle yielding was limited,
pedestrians often had to wait for an extended period before beginning to cross the
roadway. These waiting times were measured from the time the pedestrian appeared to
commit to crossing the roadway to the time the pedestrian actually began crossing.
Figure 10 displays the wait times of the pedestrians before and after the installation of the
median
0.0%
10.0%
20.0%
30.0%
40.0%
50.0%
60.0%
70.0%
80.0%
90.0%
100.0%
No w ait 15 or under 16 to 30 31 to 45 46 to 60 1 minute +
Time (seconds)
Perc
ent o
f tot
al c
ross
ings
BeforeAfter
Figure 10. Pedestrian wait time before crossing
The wait times are comparable for the two data sets. Before installation of the
improvements, the average wait before crossing was just over 9 seconds. After the
20
median had been installed, the average wait time was about 10 seconds. This increase
can be attributed to the higher percentage of outlying wait times between 46 and 60
seconds in the after study. However, the installation of the median does not appear to
have affected the initial waiting time of pedestrians.
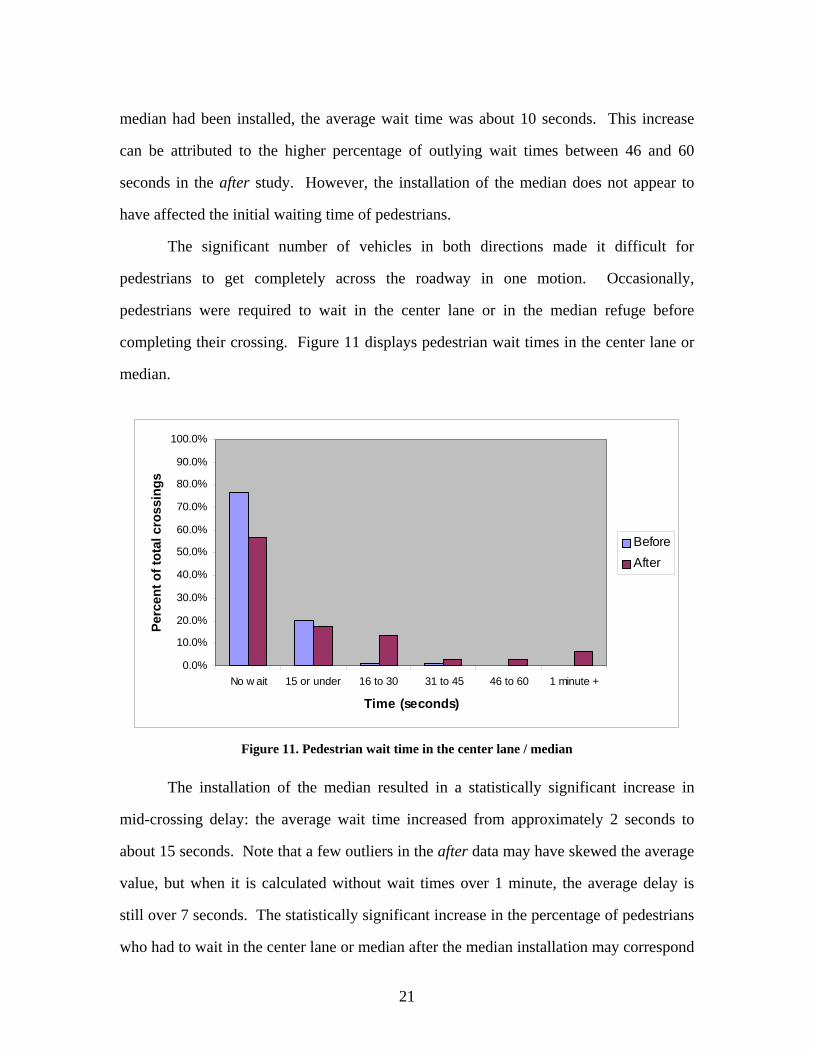
The significant number of vehicles in both directions made it difficult for
pedestrians to get completely across the roadway in one motion. Occasionally,
pedestrians were required to wait in the center lane or in the median refuge before
completing their crossing. Figure 11 displays pedestrian wait times in the center lane or
median.
0.0%
10.0%
20.0%
30.0%
40.0%
50.0%
60.0%
70.0%
80.0%
90.0%
100.0%
No w ait 15 or under 16 to 30 31 to 45 46 to 60 1 minute +
Time (seconds)
Perc
ent o
f tot
al c
ross
ings
BeforeAfter
Figure 11. Pedestrian wait time in the center lane / median
The installation of the median resulted in a statistically significant increase in
mid-crossing delay: the average wait time increased from approximately 2 seconds to
about 15 seconds. Note that a few outliers in the after data may have skewed the average
value, but when it is calculated without wait times over 1 minute, the average delay is
still over 7 seconds. The statistically significant increase in the percentage of pedestrians
who had to wait in the center lane or median after the median installation may correspond
21

to a decrease in motorist yielding in the after phase. It is also possible that some
pedestrians felt more comfortable taking their time while waiting in the median refuge
than while standing in the center lane.
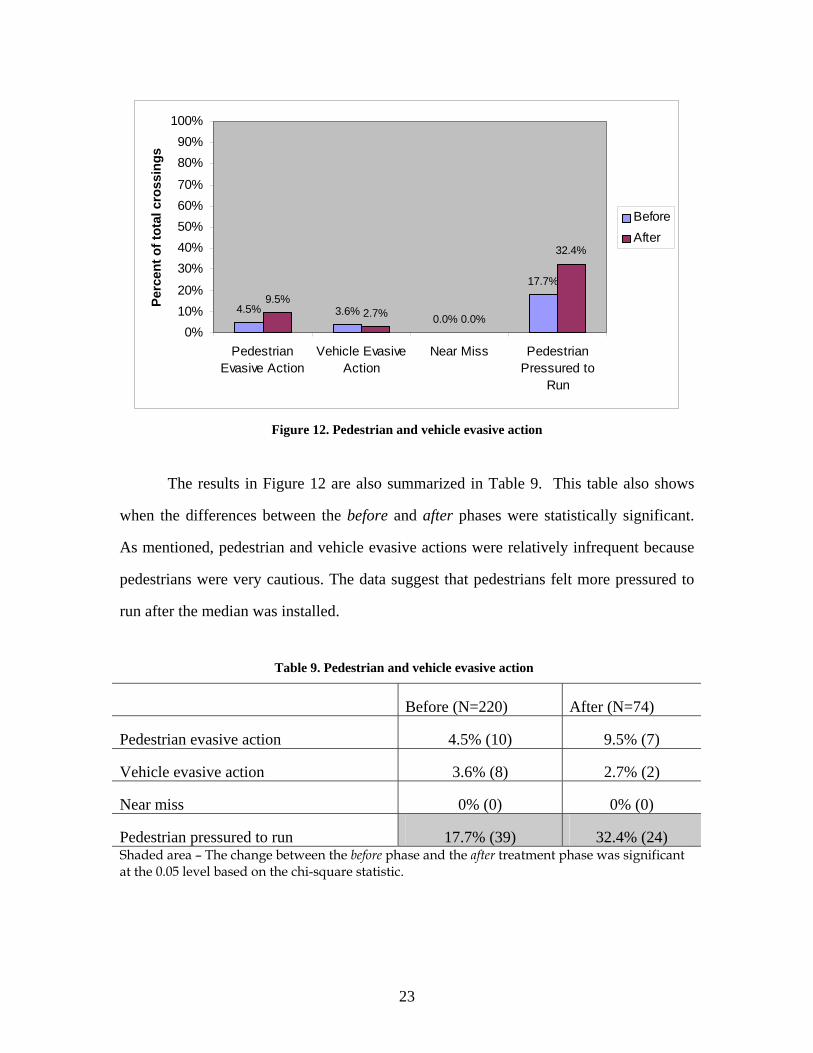
Pedestrian and Vehicle Evasive Behavior
Pedestrian evasive behavior is defined as pedestrians jumping or stepping back to
avoid a vehicle, or running to avoid being struck. Vehicle evasive action is defined as
vehicles abruptly braking or swerving to avoid striking a pedestrian. Pedestrians in this
corridor were generally cautious about crossing the street, and most pedestrians crossing
at the study locations showed extreme caution, even when they were crossing in a legal
unmarked crosswalk. Many waited for a gap in traffic to cross the street without stopping
at the center turn lane; others crossed one lane-direction at a time, waiting in the center
turn lane for another gap to complete the crossing. Therefore, pedestrian and vehicle
evasive behaviors were relatively infrequent during the study.
Another commonly observed behavior is classified as “pedestrians pressured to
run.” This performance measure was recorded when a pedestrian appeared anxious about
a crossing and ran across the street, even if vehicles yielded for the crossing. Another
performance measure is called a “near miss,” i.e., when a pedestrian-vehicle collision
almost occurs. Fortunately, no “near misses” or collisions were observed during the data
period.
Figure 12 displays the percentage of occurrences of these performance measures
per total pedestrian crossings.
22
4.5% 3.6%0.0%
17.7%9.5%
2.7% 0.0%
32.4%
0%10%20%
30%40%50%60%70%
80%90%
100%
PedestrianEvasive Action
Vehicle EvasiveAction
Near Miss PedestrianPressured to
Run
Perc
ent o
f tot
al c
ross
ings
BeforeAfter
Figure 12. Pedestrian and vehicle evasive action
The results in Figure 12 are also summarized in Table 9. This table also shows
when the differences between the before and after phases were statistically significant.
As mentioned, pedestrian and vehicle evasive actions were relatively infrequent because
pedestrians were very cautious. The data suggest that pedestrians felt more pressured to
run after the median was installed.
Table 9. Pedestrian and vehicle evasive action
Before (N=220) After (N=74)
Pedestrian evasive action 4.5% (10) 9.5% (7)
Vehicle evasive action 3.6% (8) 2.7% (2)
Near miss 0% (0) 0% (0)
Pedestrian pressured to run 17.7% (39) 32.4% (24) Shaded area – The change between the before phase and the after treatment phase was significant at the 0.05 level based on the chi-square statistic.
23
SECTION FIVE DISCUSSION AND CONCLUSIONS
The intent of this evaluation was to examine the effects of a pedestrian safety
improvement. The improvement included concentrating pedestrians at a single crossing
point with a pedestrian refuge island and relocating bus stops closer to where pedestrians
would attempt to cross the street. A before-and-after analysis was conducted to evaluate
motorist and pedestrian behavioral changes at the study site at S. 180th Street on SR 7 in
the City of Spanaway. The key findings are listed below.
The safety treatments did not have the expected positive effect of encouraging pedestrians to use the median refuge for crossing.
During the before phase, pedestrians were observed using the marked crosswalks
over 80 percent of the time. In the after phase, pedestrians used the median
refuge only about 60 percent of the time. This suggests that pedestrians may not
feel that the median refuge provides an additional margin of safety. Pedestrian
crossing at the median may improve as familiarity with the treatment increases.
In addition, compliance may increase after all construction on the roadway is
completed.
Higher motorist yielding rates were observed at marked crosswalks before the median installation.
Vehicle yielding was approximately 20 percent higher at the marked crosswalks
in the before phase than at the new median refuge in the after phase. Although
the median refuge included pedestrian crossing signs, there was significant
decrease in motorist yielding. This decrease in yielding caused longer delays for
pedestrians waiting in the median mid-crossing.
Motorists often did not yield to crossing pedestrians.
Although the majority of motorists did not yield for pedestrians, they were more
likely to yield if a pedestrian was crossing in a designated area (i.e., the marked
24
crosswalk or median refuge). Additional effort is recommended to remind
pedestrians to cross in designated areas.
The study results do not suggest that pedestrians gained a false sense of security.
Observations of pedestrians indicate that most pedestrians were very cautious
about watching for coming traffic when crossing the street. There is no strong
evidence that pedestrians acted carelessly because they felt more protected in the
marked crosswalks or within the median refuge. The length of time pedestrians
waited in the median may reflect a better feeling of safety at that location and a
resulting willingness to wait for a safe vehicle break before crossing. The lack of
change in pedestrian and vehicle evasive behavior also confirms this finding.
Even with safety treatments in place, such as marked crosswalks and pedestrian
crossing signs, it is also helpful to remind pedestrians to always be cautious about
crossing the street.
The true effects of the median installation may have been limited at the study site because of equipment constraints, project schedule, and sample size.
The timing of various rounds of data collection for this evaluation depended on
the schedule of the project implementation. Therefore, it was not possible to
separate seasonal and weather effects, as the project timing resulted in before data
collection in the spring of 2004 and after data collection during the summer of
2005. The data collected during this study may or may not portray long-term
behavior for the following reasons: First, they are snapshots of pedestrian and
motorist behavior that were captured during specific periods after implementation.
Second, because of equipment problems and construction timelines, the after data
sample size was limited.
25
Additional research should study the effectiveness of this type of median at other roadway types.
This location was chosen for the pilot project because it had been designated an
at-risk location because of its high proportion of older road users. The special
circumstances at this site influenced the installation of pedestrian treatments.
However, the site characteristics do not meet the standards typically required for
this type of treatment. The low rate of pedestrian crossings (less than 1 crossing
per hour) may have prevented the median from being effective; the presence of
more pedestrians could increase awareness of the median for both pedestrians and
motorists. Thus, a location with more pedestrian crossings could produce better
results for the median.
Additional improvements may be beneficial at this location.
The location is currently undergoing roadway improvements that include the
installation of pedestrian sidewalks. Once the sidewalks have been installed,
additional improvements at the site should be considered, such as crosswalk
striping, better signage, overhead pedestrian crossing signs, or pedestrian-
activated signals. The WSDOT Design Manual is being updated, and the new
standards should be considered for the site. Although the design manual does not
support striping alone at this location, striping as a supplement to the median
could be considered. The draft design manual also specifies that inside
incorporated cities, city standards for pedestrian facilities will be used, meaning
that, ultimately, the decision to mark crosswalks could reside with the city of
Spanaway. Further pedestrian treatment research may help identify effective
improvements to accommodate pedestrians.
26

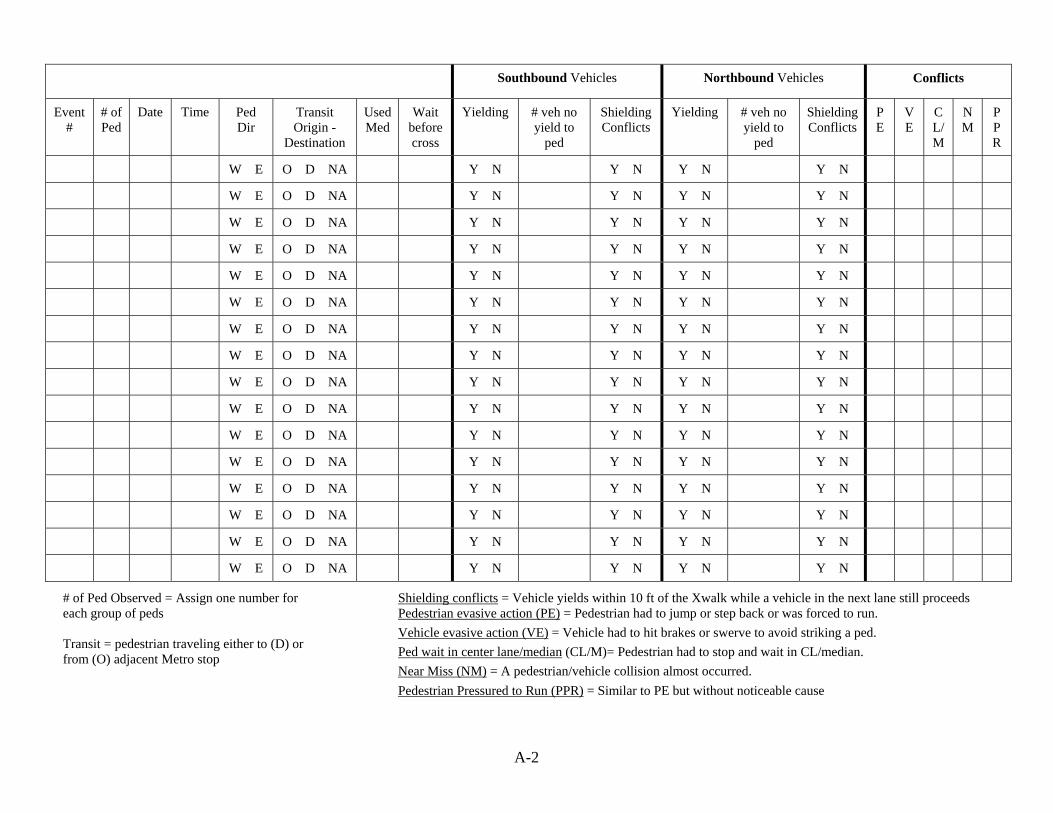
APPENDIX A
PEDESTRIAN AND MOTORIST OBSERVATION FORM
A-1
A-2
Southbound Vehicles Northbound Vehicles Conflicts
Event #
# of Ped
Date Time Ped Dir
Transit Origin -
Destination
Used Med
Wait before cross
Yielding # veh no yield to
ped
Shielding Conflicts
Yielding # veh no yield to
ped
Shielding Conflicts
PE
VE
CL/M
NM
P PR
W E O D NA Y N Y N Y N Y N
W E O D NA Y N Y N Y N Y N
W E O D NA Y N Y N Y N Y N
W E O D NA Y N Y N Y N Y N
W E O D NA Y N Y N Y N Y N
W E O D NA Y N Y N Y N Y N
W E O D NA Y N Y N Y N Y N
W E O D NA Y N Y N Y N Y N
W E O D NA Y N Y N Y N Y N
W E O D NA Y N Y N Y N Y N
W E O D NA Y N Y N Y N Y N
W E O D NA Y N Y N Y N Y N
W E O D NA Y N Y N Y N Y N
W E O D NA Y N Y N Y N Y N
W E O D NA Y N Y N Y N Y N
W E O D NA Y N Y N Y N Y N
# of Ped Observed = Assign one number for each group of peds
Shielding conflicts = Vehicle yields within 10 ft of the Xwalk while a vehicle in the next lane still proceeds Pedestrian evasive action (PE) = Pedestrian had to jump or step back or was forced to run.
Vehicle evasive action (VE)
= Vehicle had to hit brakes or swerve to avoid striking a ped. Transit = pedestrian traveling either to (D) or from (O) adjacent Metro stop Ped wait in center lane/median (CL/M)= Pedestrian had to stop and wait in CL/median.
Near Miss (NM) = A pedestrian/vehicle collision almost occurred. Pedestrian Pressured to Run (PPR) = Similar to PE but without noticeable cause