Embed Size (px)
Citation preview
Atmospheric Environment Vol. 22, No. 5, pp. 869-884, 1988. 0004--6981/88 $3.00+0.00 Printed in Great Britain. Pergamon Press pie
A MULTI-LAYER MODEL FOR ESTIMATING SULFUR DIOXIDE DEPOSITION TO A DECIDUOUS OAK FOREST
CANOPY
DENNIS BALDOCCHI
Atmospheric Turbulence and Diffusion Division, NOAA/ARL, P.O. Box 2456, Oak Ridge, TN 37831, U.S.A.
(First received 29 January 1987 and in final form 9 October 1987)
Abstract--A multi-layer 'K-theory' model for gaseous deposition to a deciduous forest is described and discussed. The model incorporates realistic physiological concepts to improve upon earlier multi-layer models found in the literature. Computations of deposition fluxes and velocities are most sensitive to variations in parameters relating to stomatal resistance. The model computations of deposition velocities are less sensitive to aerodynamic parameters since the canopy resistance of a deciduous forest is generally much greater than the aerodynamic resistance. Model computations of SO2 flux and deposition velocities are tested against deposition measurements made over a deciduous forest; these computations are not significantly different from measured values. Estimates of deposition fluxes, computed with multi-layer model, improve upon those values estimated with a "big-leaf" model.
Key word index: Dry deposition, canopy-atmosphere interactions, K-theory model, micrometeorology.
a(z) brs
Cam C~(z) d df(z) D, F(z) FSO2 h k Ks(z) Ks(z) I L LAI PAR rsm
R~ Rb
Rbsoil Rcu! Rg R~ R meso Rs Rsoil Re stz) Sc Sh To u(z) Urn u,(z) U, v.
N O M E N C L A T U R E z i
leaf area density at height z curvature coefficient of the stomatal resistance-- PAR response curve bulk canopy drag coefficient effective canopy drag coefficient at height z zero plane displacement height leaf area of an incremental layer molecular diffusivity of SOz flux of SO2 at a height z SO 2 flux between the canopy and the atmosphere height of the canopy yon Karman's constant eddy exchange coefficient for momentum transfer eddy exchange coefficient for SO2 transfer characteristic length of leaves Monin-Obuhkov scale length canopy leaf area index photosynthetically active radiation minimum stomatal resistance under optimal con- ditions aerodynamic resistance boundary layer resistance of a leaf to mass exchange boundary layer resistance of the soil cuticle resistance to mass exchange global solar radiation total leaf resistance to mass exchange mesophyll resistance to mass exchange stomatal resistance to mass exchange soil resistance to mass exchange Reynold's number SO2 concentration at height z Schmidt number Sherwood number air temperature wind speed at height z mean wind speed inside the canopy friction velocity at height z inside the canopy friction velocity measured above the canopy. deposition velocity
Z0
p r O. O~
height above the ground where a logarithmic wind profile is assumed. roughness length wind speed attenuation coefficient density of air momentum transfer diabatic stability function for momentum transfer diabatic stability function for SO2 transfer.
I N T R O D U C T I O N
Pollutant gases and particulates are deposited to landscapes via wet and dry pathways. Monitor ing of the wet component of pollutant deposition has been continuing for many years and an extensive network of monitoring stations has been established (see Wisniewski and Kinsman, 1982). More recently, a need to monitor the dry component of pollutant deposition has been identified (e.g. Hicks et al., 1982). Establishment of a dry deposition monitoring network has been delayed, relative to the establishment of the wet deposition network, since it is difficult to make continuous measurements of dry deposition to land- scapes with present technology and limited resources. As an alternative, it has been proposed to estimate pollutant fluxes to terrestrial surfaces with an inferen- tial method (Hicks et al., 1982, 1985, 1987). This method involves monitoring pollutant concentrations, specific meteorological variables and surface con- ditions and using this information to estimate dry deposition fluxes with a numerical model.
Scientists at the Atmospheric Turbulence and Diffusion Division (ATDD) are developing and testing a hierarchy of dry deposition models as part of a dry deposition monitoring program (see Meyers and Baldocchi, 1988). The first model uses the 'big-leaf'
869
870 DFNNIS BALI)O('( 'HI
approach (Hicks et al., 1985, 1987), where deposition velocities are computed as the reciprocal of the sum of the aerodynamic, quasi-laminar and canopy resist- ances. An extension of the first model is a hybrid, "big- leaf'-multilayer model (Baldocchi et al., 1987). This second model treats the stomatal resistance com- ponent of the canopy with a multi-layer submodel and R 0 ( I ) the aerodynamic and quasi-laminar boundary layer resistances with a 'big-leaf' submodel. More recently, C ( I ) we have developed two multi-layer, gaseous deposition models, which improve upon the "big-leaf" approach. R o (2) One model is based on higher-order closure principles and is reported by Meyers (1987). The other model is C (2) based on 'K-theory'. In this paper, the latter multi- layer model is described. The model's sensitivity to variations in input parameters is also examined and discussed. The third objective of this paper is to R 0 (n) examine the utility of a 'K-theory" model in predicting C (n) the deposition of SO2 to a deciduous forest canopy. Such an examination is needed because there are some R b (soil) theoretical limitations associated with "K-theory" models (Corrsin. 1974; Finnigan and Raupach, 1987): R (so, I) these models are only valid if the length scale of the turbulence is less than that associated with the curva- ture of the vertical profile of the entity ot" interest.
THEORY
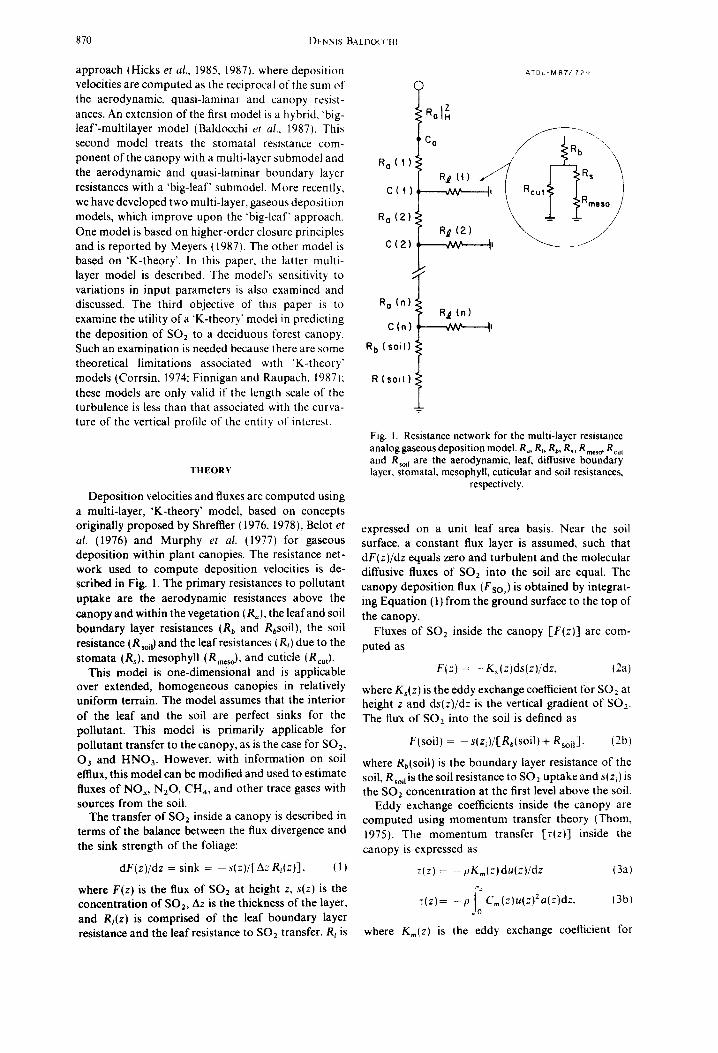
Deposition velocities and fluxes are computed using a multi-layer, 'K-theory' model, based on concepts originally proposed by Shreltter (1976, 1978), Belot et al. (1976) and Murphy et al. (1977) for gaseous deposition within plant canopies. The resistance net- work used to compute deposition velocities is de- scribed in Fig. 1. The primary resistances to pollutant uptake are the aerodynamic resistances above the canopy and within the vegetation I R~), the leaf and soil boundary layer resistances (R b and Rbsoil), the soil resistance (R soi0 and the leaf resistances (Rt) due to the stomata (Rs), mesophyll (Rmeso), and cuticle (Rcut).
This model is one-dimensional and is applicable over extended, homogeneous canopies in relatively uniform terrain. The model assumes that the interior of the leaf and the soil are perfect sinks for the pollutant. This model is primarily applicable for pollutant transfer to the canopy, as is the case for SO2, Oa and HNO3. However, with information on soil efflux, this model can be modified and used to estimate fluxes of NOx, N20, CH4, and other trace gases with sources from the soil.
The transfer of SO2 inside a canopy is described in terms of the balance between the flux divergence and the sink strength of the foliage:
dF(z)/dz = sink = - s(z)/[Az R~(z)], ( 1 )
where F(z) is the flux of SO2 at height z, s(z) is the concentration of SO2, Az is the thickness of the layer, and R~(z) is comprised of the leaf boundary layer resistance and the leaf resistance to SO2 transfer. R~ is
ATDL-M87/ 7'29
R~ (2)
R~ (n) CVV' I'
Fig. 1. Resistance network for the multi-layer resistance analog gaseous deposition model. Ru, R~, Rb, R,, R meso, Rout and Rso a are the aerodynamic, leaf, diffusive boundary layer, stomatal, mesophyll, cuticular and soil resistances,
respectively.
expressed on a unit leaf area basis. Near the soil surface, a constant flux layer is assumed, such that dF(z)/dz equals zero and turbulent and the molecular diffusive fluxes of SO2 into the soil are equal. The canopy deposition flux (Fs02) is obtained by integrat- ing Equation (1) from the ground surface to the top of the canopy.
Fluxes of SO2 inside the canopy [F(z)] are com- puted as
F(z) = - K~ (z)ds(z)/dz, 12a)
where Ks(z) is the eddy exchange coefficient for SO2 at height z and ds(z)/dz is the vertical gradient of SO2. The flux of SO2 into the soil is defined as
F(soil) = - s(zi)/[Rb(soil)+ Rsoil], (2b)
where Rb(soil) is the boundary layer resistance of the soil, RsoaiS the soil resistance to SO2 uptake and s(zi) is the SO2 concentration at the first level above the soil.
Eddy exchange coefficients inside the canopy are computed using momentum transfer theory (Thom, 1975). The momentum transfer It(z)] inside the canopy is expressed as
rlz) = - pK.,(z)du(zj/dz (3a)
r(z)=-pj~Cm(z)u(=)2a(z)d=, (3b)
where K,,(z) is the eddy exchange coefficient for
Model for estimating sulfur dioxide deposition 871
momentum transfer, p is air density, C,,(z) is the effective drag coefficient, u(z) is the horizontal wind speed and a(z) is the leaf area density.
Using Equations (3a) and (3b), K,.(z) is com- puted as
f~ Cmlz)a(z)u(z)2 dz K,.(z) = ' (4)
du(z)/dz
KAz) is assumed to equal 0.8 K=(z) due to differences in the eddy exchange coefficients for momentum and mass (see Halldin and Lindroth, 1986). Below crown closure (about 14 m), the foliage is sparse and the wind speed profile is complex; reversals in the wind speed profile occur (Baldocchi and Meyers, 1988) and yield negative K,, values [-Equation 14)], which are un- realistic. Consequently, K~(z) is assumed to be con- stant below this level and equal to K, at 14 m. The eddy exchange coefficients are related to the interstitial aerodynamic resistances, shown in Fig. 1, as
f f2 R,(z:2, z: I) = dz/Km(z) (5a) :1
z(z) = - p [ u ( z : 2 ) - u(z: 1)]/ Ra(z:2, z: 1), (5b)
where the indices 1 and 2 refer to adjacent levels. Within-canopy wind speeds, used to evaluate
Equation (4), are computed from the relationship of Cionco (1972):
u(z) = uh e x p [ - ~(1 - z/h)], (6)
where ~ is the wind speed attenuation coefficient and uh is the wind speed at the top of the canopy, uh is computed by extrapolating the logarithmic wind pro- file to canopy height:
u h = u(z,) ] ~ L , , ,[-tn(h-d)-ln(z°)-tPm[(h-d)/L]ln(zo) ~b,.[(z,-d)/L] ]'
(7)
where d is the zero plane displacement, q6. is the diabatic stability function, L is the Monin-Obukhov scale length, u(zr) is the wind speed at a reference height, zr, above the canopy, and z0 is the roughness length. The relationship for ~0. is given in Kanemasu et al. (1979).
The effective drag coefficient of leaves in a canopy layer is different from the drag coefficient of an isolated leaf (Landsberg and Thorn, 1971; Landsberg and Powell, 1973; Thorn, 1975). This difference is due to the multiple sheltering by leaves and leaf orientation to the flow, which affects the contribution of bluff-body and skin-friction influences on momentum transfer. The effective drag coefficient [C.(z)] is assumed to be constant with height (Thorn, 1975) and is expressed as
C,.(z) = Ca,./{LAX[u,./u(z,)]2}, (8)
where Cam is the bulk canopy drag coefficient, LAI is the canopy leaf area index, and u., is the mean wind
speed within the canopy. Eddy exchange coefficients, computed with a constant C,,,(z), have the feature of an exponential decrease with depth into the canopy (Monteith, 1973).
The mean within-canopy wind speed (Urn) is com- puted as
f Um = (l/h) u(z)dz. (9) o
Equation (9) is evaluated using u(z) values derived from a fourth-order polynomial fit to the normalized wind speed profile measured in a deciduous forest (Baldocchi and Meyers, 1988). A polynomial relation- ship is used to estimate u,, because a strong secondary wind speed maximum is observed below crown closure. This technique thus leads to a more realistic estimate of u,, and improves upon the estimates of um based on an exponential model for u(z) (e.g. Cionco, 1972).
The leaf boundary layer resistance is the resistance to molecular diffusion through the leaf boundary layer. It is evaluated on a unit leaf area [df(z)] basis as
R b ( Z ) = l/[df(z)D~Sh(z)], (10)
where l is the characteristic length of leaves, D~ is the molecular diffusivity of the entity and Sh is the Sherwood number. Relationships for the Sherwood number, derived for flat plates, are used for leaves. These relationships are
Sh(z) = 0.66 Re °5 Sc 0'33 [ 1 la)
for laminar flow and
Sh(z) = 0.03 Re °s Sc 0"33 (1 lb)
for turbulent flow (Grace and Wilson, 1976). Re is the Reynolds number and Sc is the Schmidt number. The critical Re for the transition from laminar to turbulent flow ranges between 8000 and 25,000.
The air flow over a leaf is a mixed regime of turbulent and laminar flow, due to leaf flutter, leaf hairs and transition distances over leaves. Grace and Wilson (1976) found that measured values of Sh were greater than those computed with Equation (11) by a factor exceeding two. Computations of R~ are thus made by multiplying Sh by a factor of two.
The boundary layer resistance at the soil surface [R~ soil] is computed using the technique of Schuepp ( 1977):
Rb soil = [Sc-ln(do/zi)]/[ku.(zA], (12)
where d o is the height where molecular transfer becomes equal in magnitude to turbulent transfer (do = v/ku.), k is yon Karman's constant (k = 0.4), u.(zi) is friction velocity at zi, v is kinematic viscosity and zi is the height above the ground where a logarithmic wind profile is assumed. Equation (12) is evaluated by assuming that zi is equal to the height of the first layer or grid point above the soil surface. Friction velocity of the lowest layer was evaluated as (kz~ c~u/c~z).
The leaf resistance (R~) is comprised of serial
872 DENNIS BALDOCCHI
resistances exerted by the stomata, boundary layer and leaf mesophyll, which are, in turn, parallel with the cuticular and leaf boundary layer resistances. The leaf resistance (R~) is computed using the following equations:
Rs~lz) = R~(z) + R . . . . (i3a)
and
1/R~(z) = 1/[R, , (z) + Rb(z)] + 2/[R¢u t + Rb(Z)], (13b)
where R~, R ~ o , R~ and Rcu , are the stomatal, meso- phyll, leaf boundary layer and cuticle resistances, respectively. All resistances are expressed on a unit leaf area basis. The coefficients in Equation (13b) arise because leaves of many of the species in a temperate deciduous forest (e.g. Quercus species) are hypo- stomatous (stomata are only on one side of the leaf), whereas the cuticular and boundary layer resistances are effective on both sides of leaves.
Stomatal resistance (R~) is a complex function of environmental and physiological variables, including photosynthetically active radiation (PAR), air tem- perature (T,), humidity, and plant water status (Jarvis, 1976). The stomatal resistance, at discrete layers in the canopy, is computed by coupling a canopy radiative transfer model (Norman, 1979) with the multiplicative leaf stomatal resistance model of Jarvis (1976). This complexity is required because R~ responds non- linearly to light, which varies with height in the canopy and on the sunlit and shaded leaf fractions. Computations of PAR profiles and sunlit and shaded leaf area are based on the assumption that the spatial leaf distribution is random and that the leaf inclination distribution is spherical. Details on the stomatal resistance submodel are provided in Baldocchi et al. (1987) and Baldocchi and Hutchison (1986).
COMPUTATIONAL PROCEDURES
Fluxes and concentration profiles are computed with an iterative numerical technique. First, Equation (1) is evaluated with an assumed initial SO2 profile. The Adams-Bashforth method (Conte and de Boer, 1972), is then used to solve Equation (1) and compute a vertical profile of F(z). Next, vertical profiles of concentration gradients [ds(z) /dz] are computed from Equation (2a). The concentration gradients are then integrated with respect to z to obtain a new concen- tration profile. In order to attain numerical stability, a digital recursive filter is applied to the new estimates of SO2 concentration.
Boundary conditions are reset with each iteration. The SO2 concentration at the top of the canopy is re- defined as
s(h) = s ( z , ) + ( F s o 2 k u , j [ ln (z , /h ) -~b~] , (14)
where Fso ~ is the integrated canopy SO2 flux, u, is the friction velocity measured above the canopy, ~,~ is the diabatic stability function for SO: and s(z,) is the SO2 concentration at a reference level above the canopy. Fsoil is re-evaluated in terms of the new SO2 concentra- tion near the soil [Equation (2b)]. These steps are repeated until desired convergence, which typically takes 40-70 iterations.
Deposition velocities are computed as
Ve = Fso 2 .is(z,). (15)
The parameter coefficients used to compute SO2 fluxes and deposition velocities are presented in Table 1. Sensitivity tests are computed assuming that the ambient SOz concentration is 20 ppb. The time of the simulations is assumed to be day 180 at 1200 h. The cuticle resistance used in the computations is based on the assumption that the foliage is dry. The meteoro-
Table 1. Parameters and values used to compute SO2 deposition velocities to a deciduous oak forest
Parameter Unit Value Reference
Canopy height (h) m 22.5 Leaf area index ILA1) .-- 4.9 Leaf length (I) m 0.1 Zero plane displacement (d) m 19(0.84 h) Roughness length (Zo) m 2.2 (0.I h) Stability (z/L) - 0.001 SO2 diffusivity (D~) mm2s I 12 Bulk canopy drag coefficient (Ca,) - - 0.016 Wind extinction coefficient (a) 6.95 Leaf reflectivity (p, PAR) -- 0.11 Leaf transmissivity (r, PAR) 0.16 Soil reflectivity (p~, PAR) -- 0.033 Minimum stomatal resistance (rs.) sin-~ 150 Stomatal resistance curvature W m 2 40 coefficient (b,,) Cuticle resistance (Rout) s m- 1 3000 Soil resistance (Rsoil) s m - 1 300 Mesophyll resistance (Rm~o) s m- ~ 10
Hutchison et al. (1986) Hutchison et al. (1986) Measured Baldocchi and Meyers (1988) Dolman (1986)
Verma et al. (1986) Baldocchi and Meyers (1988) Baldocchi et al. (1985) Ba=l_docchi et al. (1985) Baldocchi et al. (1985) Baldocchi and Hutchison (1986) Meyers and Baldocchi (1988)
Spedding (1969) McMahon and Dcnison (1979) Hosker and Lindberg (1982)
Model for estimating sulfur dioxide deposition 873
logical input variables needed for the model compu- tations include wind speed (u), friction velocity (u.), Mon in -Obukhov scale length (L), air temperature (T,), and solar radiation (R0). Structural inputs include leaf area index and the vertical distribution o f leaf area. The canopy was assumed to be well watered and recent experiments show that there is no vapor pressure deficit effect on Rs of oak leaves, which agrees with the data of Appleby and Davies (1983). Diffuse and direct PAR are computed from measurements o fR 0 using the model of Weiss and Norman (1985).
Computat ions of SO2 fluxes and component resist- ances are performed by dividing the canopy into 70 layers; numerical tests show that no significant im- provement in the estimate of deposition fluxes and component resistances is obtained by dividing the canopy into more layers.
MATERIALS AND METHODS
The structure of the deciduous forest canopy is described in Hutchison et al. (1986). A continuous function of the vertical profile of leaf area density [a(z)] is determined using the Beta distribution (Massman, 1982) from actual measurements of leaf area index.
The multi-layer SO, deposition model is tested against experimental data obtained over a fully-leafed, well-watered, deciduous forest near Oak Ridge, TN (see Matt et al., 1987). Architectural characteristics of the canopy are described in Hutchison et al. (1986). Measurements of SO2 flux were made in July 1985 with the eddy correlation technique. SOe fluxes were determined as the mean covariance between fluctuations in vertical wind velocity and SOz concentration. Deposition velocities were computed as the ratio of SO2 flux and concentration. The instrumentation used to measure SO2
fluxes was positioned about 9 m above the zero plane displacement. The instruments included a three-dimensional sonic anemometer and a fast-response Meloy sulfur sensor. Many modifications were made on the SO2 flame photo- metric sensor in order to make it applicable for eddy correlation measurements (see Matt et al., 1987). The re- sponse time was decreased to less than 0.7 s by shortening the internal plumbing, precisely regulating the hydrogen fuel with a mass flow controller, regulating the sample flow with a critical orifice and installing a faster burner block assembly. Nonlinearities at low levels of SO2 were minimized by doping the hydrogen fuel with SF6 tO effectively raise the baseline concentration of S being detected by the sensor. Mean ambient SO2 concentrations, as needed for the deposition velocity computations, were measured independently with a Monitor Labs u.v. pulse fluorescence SO2 monitor. Data used for the comparison were chosen from periods when the SO2 concentration exceeded 3 ppb and the time rate of change in SO2 concentration was less than 20 ',~o per 1/2 h. The meteoro- logical conditions encountered during the experiment were moderate; temperatures ranged between 25 and 30 °C, solar radiation ranged between 300 and 800 W m- 2, wind speeds above the canopy range between 1 and 4 ms -1 and SO2 concentrations ranged between 3 and 20 ppb [see Meyers and Baldocchi (1988) for specific conditions].
R ES U LTS
(a) Model computations
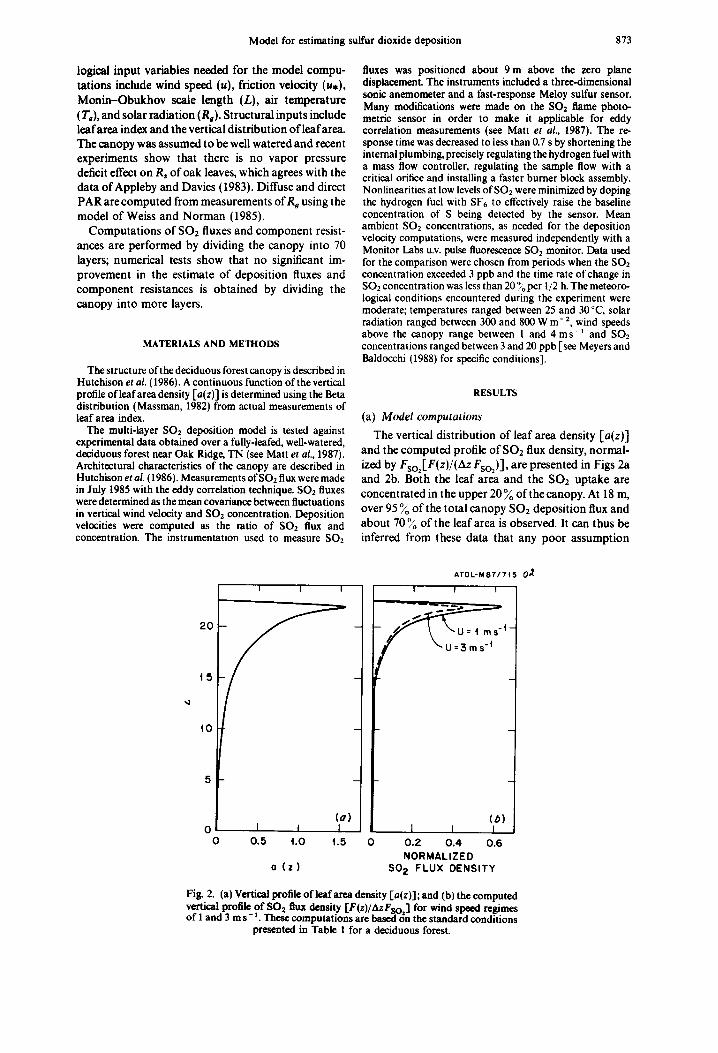
The vertical distribution of leaf area density [a(z)] and the computed profile of SO2 flux density, normal- ized by Fso~[F(z ) / (Az Fso~) ] , are presented in Figs 2a and 2b. Both the leaf area and the SO2 uptake are concentrated in the upper 20~o of the canopy. At 18 m, over 95 ~o of the total canopy SO2 deposition flux and about 70~o of the leaf area is observed. It can thus be inferred from these data that any poor assumption
20
t 5
t0
I I I
f - ATDL-M87/7| 5 0 ~
I I I
"- u--3m ~
(o ) (b ) o I I I I l I
0 0.5 t .0 t .5 0 0.2 0.4 0.6 NORMALIZED
o ( z ) SO 2 FLUX DENSITY
Fig. 2. (a) Vertical profile of leaf area density [a(z)]; and (b) the computed vertical profile of SO~ flux density [F(z)/AzFso=] for wind speed regimes of I and 3 m s- 1. These computations are based on the standard conditions
presented in Table 1 for a deciduous forest.
874 DENNIS BALDOCCHI
regarding turbulence exchange processes in the lower 18 m of the deciduous forest canopy will be relatively inconsequential since little SO2 exchange occurs in the lower region.
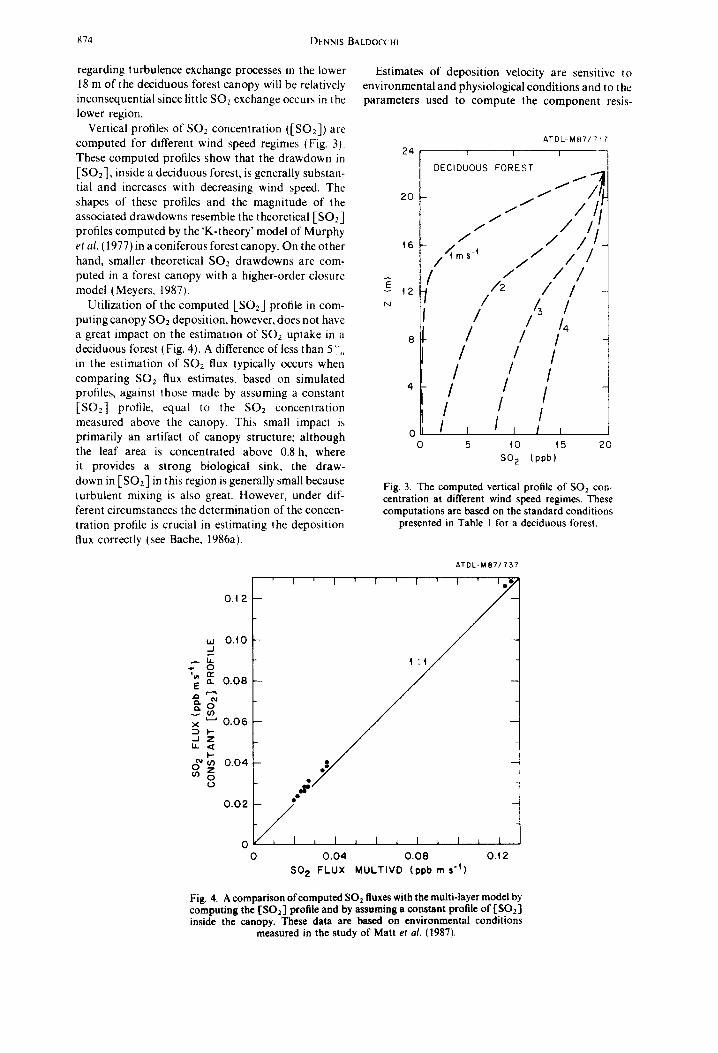
Vertical profiles of SO: concentration ([SO2]) are computed for different wind speed regimes (Fig. 3). These computed profiles show that the drawdown in [SO2], inside a deciduous forest, is generally substan- tial and increases with decreasing wind speed. The shapes of these profiles and the magnitude of the associated drawdowns resemble the theoretical [SO2] profiles computed by the "K-theory' model of Murphy et al. (1977) in a coniferous forest canopy. On the other hand, smaller theoretical SO., drawdowns are com- puted in a forest canopy with a higher-order closure model (Meyers, 1987).
Utilization of the computed [SO:] profile in com- putiog canopy SO2 deposition, however, does not have a great impact on the estimation of SO2 uptake in a deciduous for~est (Fig. 4). A difference of less than 5 ". in the estimation of SO2 flux typically occurs when comparing SO2 flux estimates, based on simulated profiles, against those made by assuming a constant [SO2] profile, equal to the SO2 concentration measured above the canopy. This small impact is primarily an artifact of canopy structure; although the leaf area is concentrated above 0.8 h, where it provides a strong biological sink, the draw- down in [SOz] in this region is generally small because turbulent mixing is also great. However, under dif- ferent circumstances the determination of the concen- tration profile is crucial in estimating the deposition flux correctly (see Bache, 1986a).
Estimates o f deposition velocity are sensitive to environmental and physiological conditions and to the parameters used to compute the component resis-
A T D L - M 8 7 / 7 1 ?
2 4 I - ]
N
I I
D E C I D U O U S F O R E S T
20 -
/ /
/ I /
/ 8 /
/ /
, / /
o I i o 5
/11,~
/ / / ///I / / / / / / / / /
/ 2 / /
/4 / /4 / !
/ / / !
/ / /
! / J i i
t0 t5
S02 (ppb)
t
2O
Fig. 3. The computed vertical profile of SO2 con- centration at different wind speed regimes. These computations are based on the standard conditions
presented in Table 1 for a deciduous forest.
O A 2
,., 0 . t 0 J
O
'~" ~ 0 . 0 8 E
x ~ 0.06 J Z U.. ,~
I-- g ~ 0.04 ~ 0
0 . 0 2
0 0
f
D
A T D L - M 8 7 / 7 5 7
I ' I ' I ' ' I ~ , , ~
/ J 4 4
, IP
/ i i i I a i ~ i i I i I
0 . 0 4 0 . 0 8 O A S 0 2 FLUX MULTIVD ( p p b m s - I )
Fig. 4. A comparison of computed SO2 fluxes with the multi-layer model by computing the [SO2] profile and by assuming a constant profile of {SO2] inside the canopy. These data are based on environmental conditions
measured in the study of Matt et aL (1987).
Model for estimating
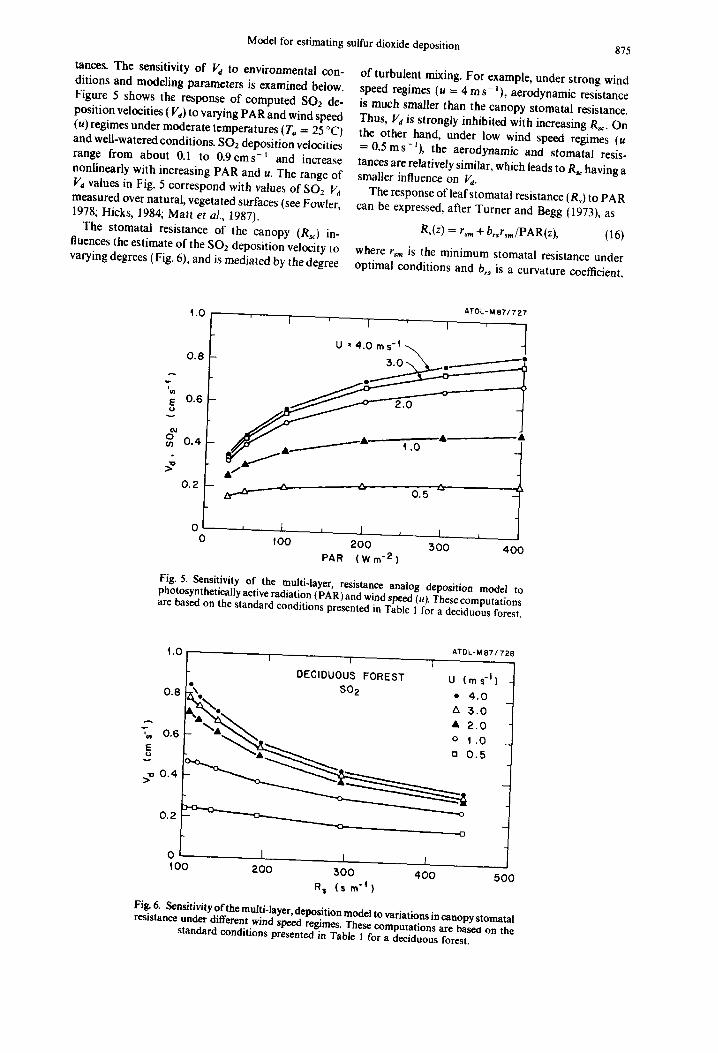
tances. The sensitivity of V# to environmental con- ditions and modeling parameters is examined below. Figure 5 shows the response of computed SO2 de- position velocities (Vd) to varying PAR and wind speed (u) regimes under moderate temperatures (T, = 25 °C) and well-watered conditions. SO2 deposition velocities range from about 0.1 to 0.9cms -1 and increase nonlinearly with increasing PAR and u. The range of Va values in Fig. 5 correspond with values of SO2 Vd measured over natural, vegetated surfaces (see Fowler, 1978; Hicks, 1984; Matt e t al., 1987).
The stomatal resistance of the canopy (R~) in- fluences the estimate of the SO2 deposition velocity to varying degrees (Fig. 6), and is mediated by the degree
sulfur dioxide deposition 875
of turbulent mixing. For example, under strong wind speed regimes (u = 4 m s-~), aerodynamic resistance is much smaller than the canopy stomatal resistance. Thus, Vd is strongly inhibited with increasing R,c. On the other hand, under low wind speed regimes (u = 0.5 m s-~), the aerodynamic and stomatal resis- tances are relatively similar, which leads to R,c having a smaller influence on Vd.
The response ofleafstomatal resistance (Rs) to PAR can be expressed, after Turner and Begg (1973), as
R,(z) = G,. + b , , r~m/PAR(z ) , (16)
where r,,, is the minimum stomatal resistance under optimal conditions and b,s is a curvature coefficient,
0.8
E 0.6
c~ u) 0 . 4
0.2
ATDL-M 87/727 4.O ' ( , I I '
U = 4 . 0 ms - t
-
- ~ - A 0 . 5 "--
0 J I , I , I ,
0 fO0 2 0 0 3 0 0 4 0 0 PAR ( W m - 2 )
Fig. 5. Sensitivity of the multi-layer, resistance analog deposition model to photosynthetically active radiation (PA R) and wind speed (u). These computations are based on the standard conditions presented in Table 1 for a deciduous forest.
4.0 F I I i ATDL-M 87/72,q
F= DECIDUOUS FOREST U ( m s - t )
0 .8 Z ~ S02 • 4 . 0
~k.~.', A 3.0 - _ " \ = ' ~ • 2.0 ',,, 0.6 ~ . o 4 .0
o
- o
0 10(
I I j
2 0 0 5 0 0 4 0 0 5 0 0 R= (s rn "~ )
Fig. 6. Sensitivity of the multi-layer, deposition model to variations in canopy stomatal resistance under different wind speed regimes. These computations are based on the
standard conditions presented in Table 1 for a deciduous forest.
876 DENNIS BALDOC('HI
defined as the PAR level at twice the minimum stomatal resistance. Values of the minimum stomatal resistance range widely in the hterature IKorner et al.. 1979L For example, minimum stomatal resistances tor Quercus species typically range between 100 and 200sm -~ (Hinckley et al.. 1978: Baldocchi and Hutchison, 1986). Elias 11979). however, reports more extreme values, exceeding 600 s m '
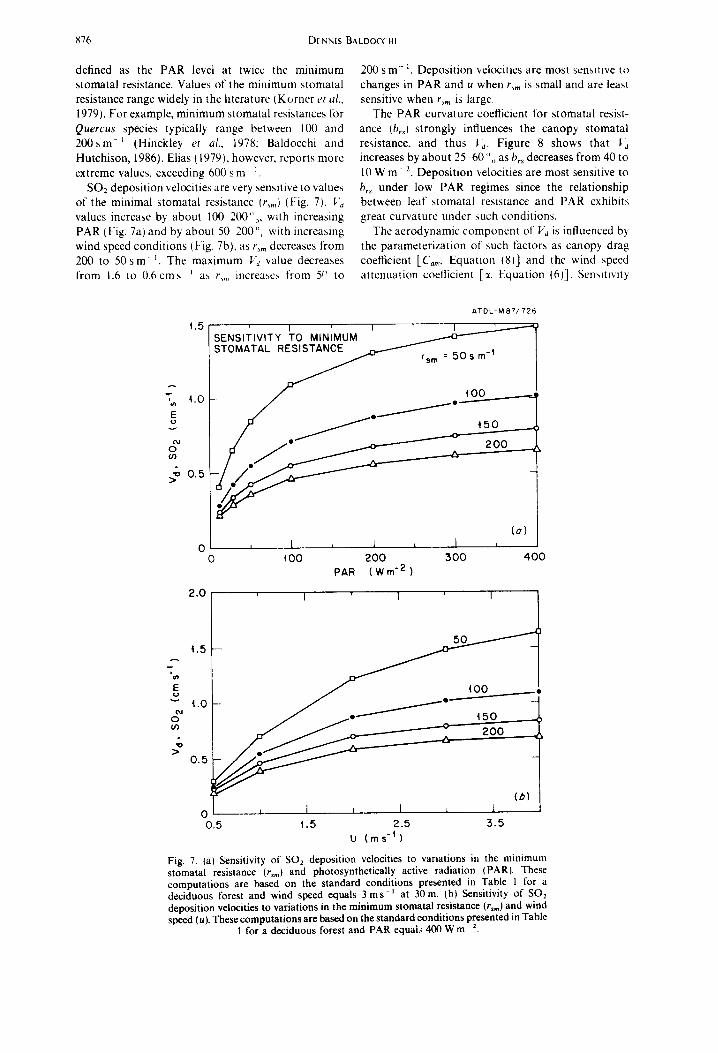
SO2 deposition velocities are very sensitive to values of the minimal stomatal resistance (r~,.) (Fig. 7). I." a values increase by about 10~200" , . with increasing PAR (Fig. 7a) and by about 5(~ 200",, with increasing wind speed conditions 0qg. 7b), as r~,. decreases from 200 to 50 s m " . The maximum 1~ value decreases from 1.6 to 0.6cm~ ' a~ r,m increasc,~ from 5( ~ to
200 s m- ~. Deposition velocities are most sensmve to changes in PAR and u when r,,, is small and are least sensitive when r.,~ is large.
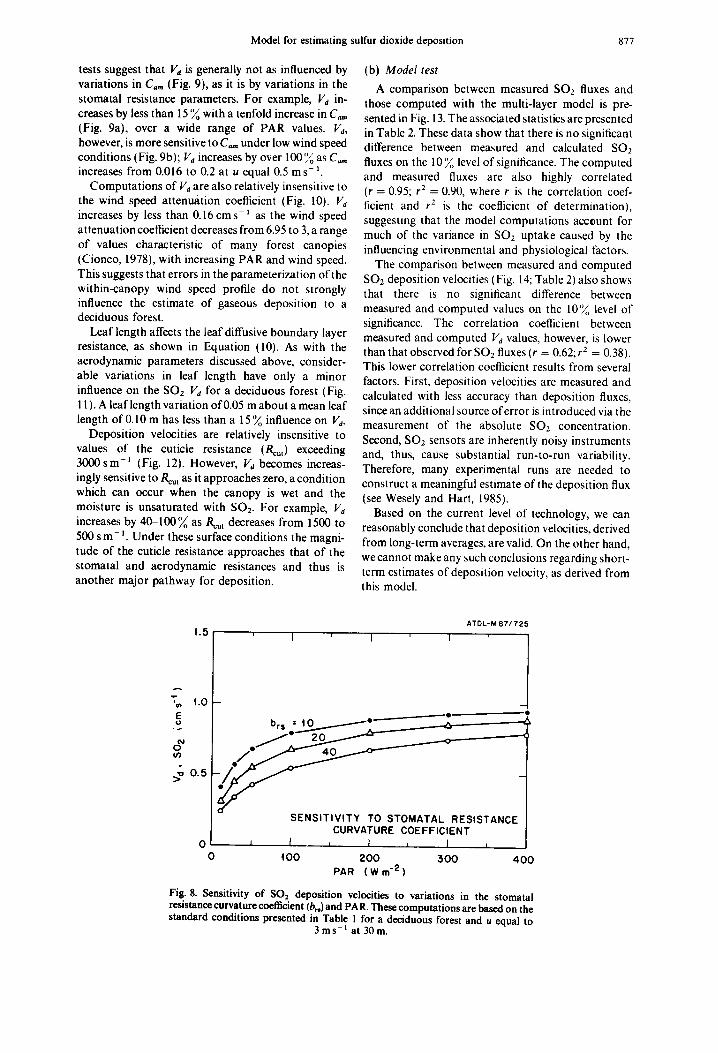
The PAR curvature coefficient for stomatal resist- ance (b,~J strongly influences the canopy stomatal resistance, and thus l) . Figure 8 shows that t ] increases by about 25-60 ",, as b,~ decreases from 40 to 10 W m 2. Deposition velocities are most sensitive to b,~ under low PAR regimes since the relationship between leaf stomatal resistance and PAR exhibits great curvature under such conditions.
The aerodynamic component of l,"a is influenced by the parameterization of such factors as canopy drag coefficient [C~,., Equation (8)] and the wind speed attenuation coefficient [zc Equation (6)]. Sensitivity
A T D L - M 8 7 / 7 2 6
t . 5 ' I ' I ' I
SENSITIVITY TO MINIMUM
(o)
0 , I , I , I ,
0 I00 200 300 400 PAR ( W i n "2 )
2 . 0 ' I ' I ' I ]
E
~ 1 . 0 - N
0 Or)
"0
> 0 . 5
O , I , 0 . 5 1 .5 2 . 5 3 . 5
U ( m s -4 )
Fig. 7. (a) Sensitivity of SO2 deposition velocities to variations in the minimum stomatal resistance (r,,,) and photosynthetically active radiation (PAR). These computations are based on the standard conditions presented in Table 1 for a deciduous forest and wind speed equals 3 m s - ' at 30m. (b) Sensitivity of SO2 deposition velocities to variations in the minimum stomatal resistance 1`r,,,) and wind speed (u). These computations are based on the standard conditions presented in Table
l for a deciduous forest and PAR equaL~ 400 W m- 2.
,"~ 4.0 E
o ~ O3
" o 0 . 5 >
Model for estimating sulfur dioxide deposition 877
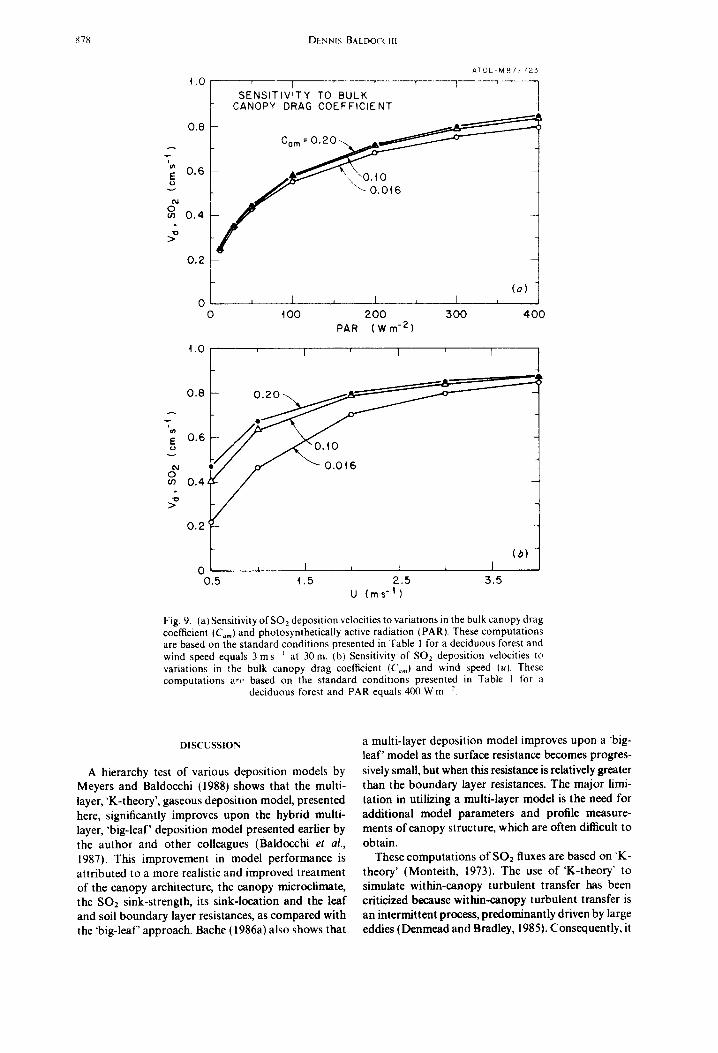
tests suggest that Va is generally not as influenced by variat ions in C~ (Fig. 9), as it is by variations in the stomatal resistance parameters. For example, Va in- creases by less than 15 ~o with a tenfold increase in Cam (Fig. 9a), over a wide range of PAR values. Va, however, is more sensitive to Ca,,, under low wind speed conditions (Fig. 9b); I'd increases by over 100 ','/o as Ca,, increases from 0.016 to 0.2 at u equal 0.5 m s- ].
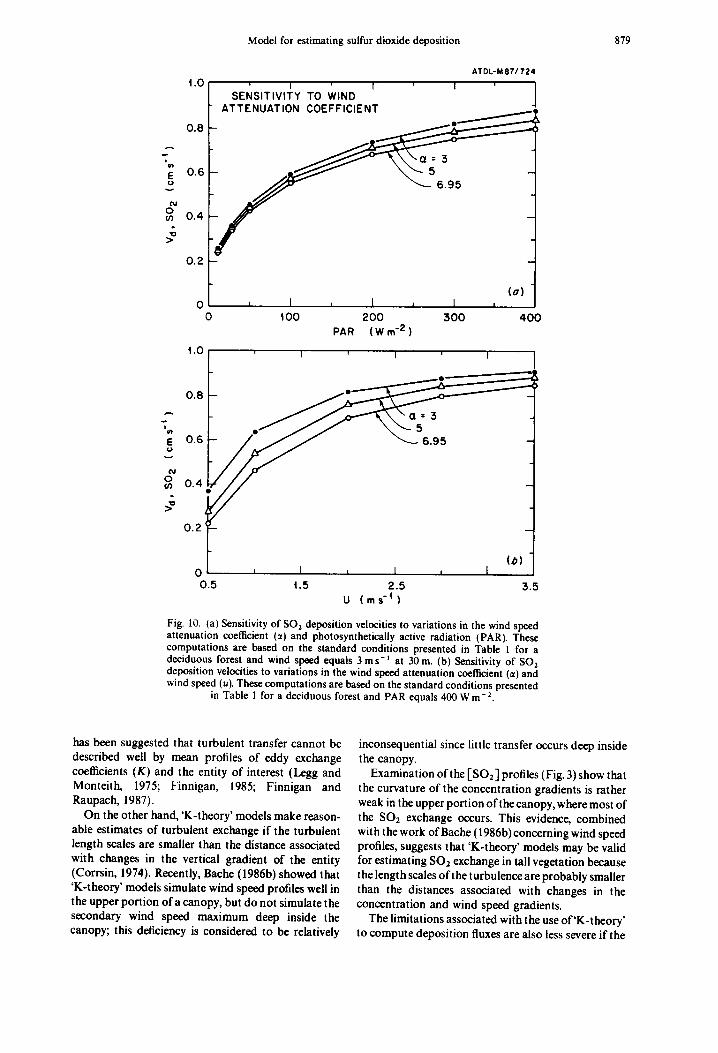
Computations of Va are also relatively insensitive to the wind speed attenufition coefficient (Fig. 10). lid increases by less than 0.16 cms-~ as the wind speed attenuation coefficient decreases from 6.95 to 3, a range of values characteristic of many forest canopies (Cionco, 1978), with increasing PAR and wind speed. This suggests that errors in the parameterization of the within-canopy wind speed profile do not strongly influence the estimate of gaseous deposition to a deciduous forest.
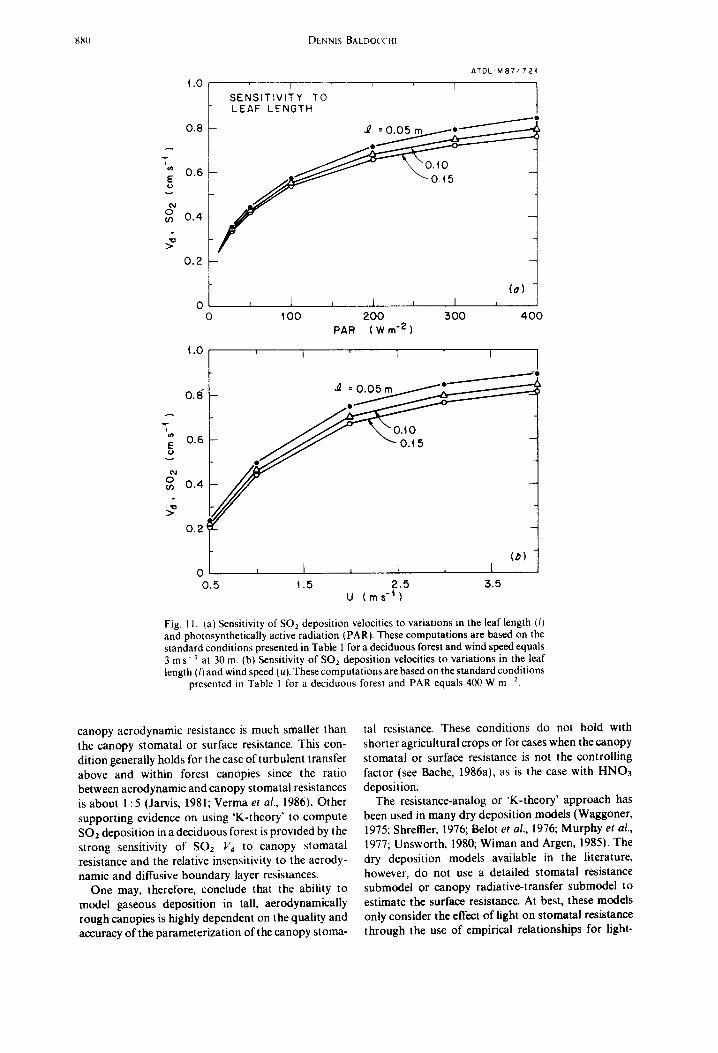
Leaf length affects the leaf diffusive boundary layer resistance, as shown in Equation (10). As with the aerodynamic parameters discussed above, consider- able variations in leaf length have only a minor influence on the SO2 Vd for a deciduous forest (Fig. 11). A leaf length variation of 0.05 m about a mean leaf length of 0.10 m has less than a 15'7o influence on Vd.
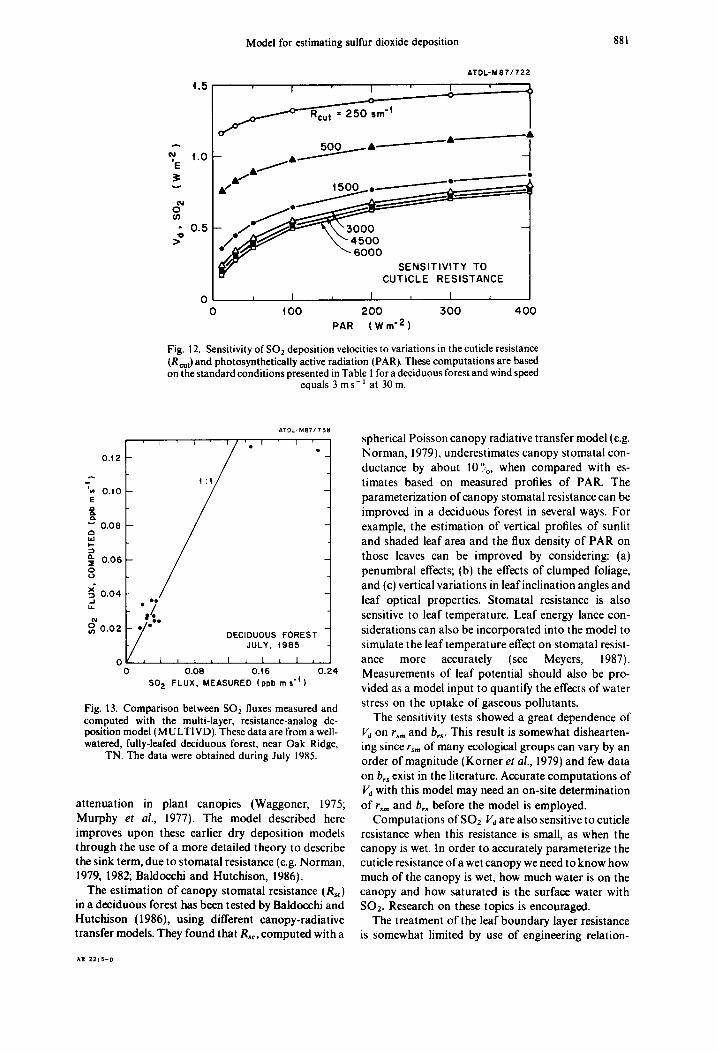
Deposition velocities are relatively insensitive to values of the cuticle resistance (Re.t) exceeding 3000sm -] (Fig. 12). However, Va becomes increas- ingly sensitive to Re, t as it approaches zero, a condition which can occur when the canopy is wet and the moisture is unsaturated with SOz. For example, Va increases by 40-100~ o as Rcut decreases from 1500 to 500 s m- ~. Under these surface conditions the magni- tude of the cuticle resistance approaches that of the stomatal and aerodynamic resistances and thus is another major pathway for deposition.
(b) Model test
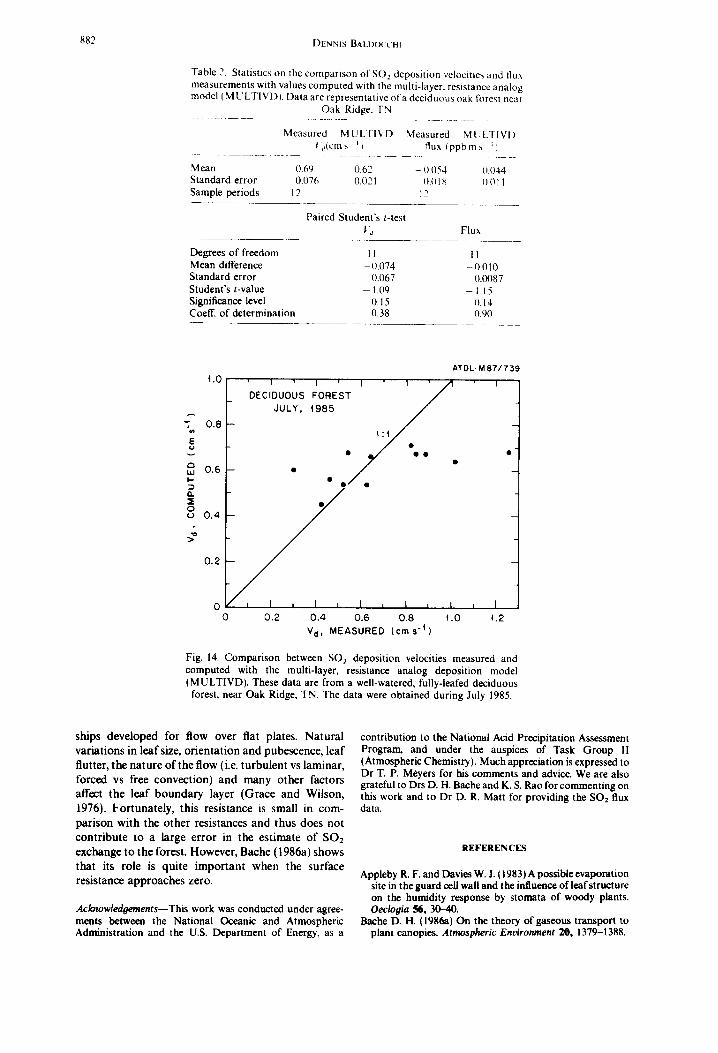
A comparison between measured SO2 fluxes and those computed with the multi-layer model is pre- sented in Fig. 13. The associated statistics are presented in Table 2. These data show that there is no significant difference between measured and calculated SO,, fluxes on t he l 0 ')/o level of significance. The computed and measured fluxes are also highly correlated (r = 0.95; r 2 = 0.90, where r is the correlation coef- ficient and r 2 is the coefficient of determination), suggesting that the model computations account for much of the variance in SO2 uptake caused by the influencing environmental and physiological factors.
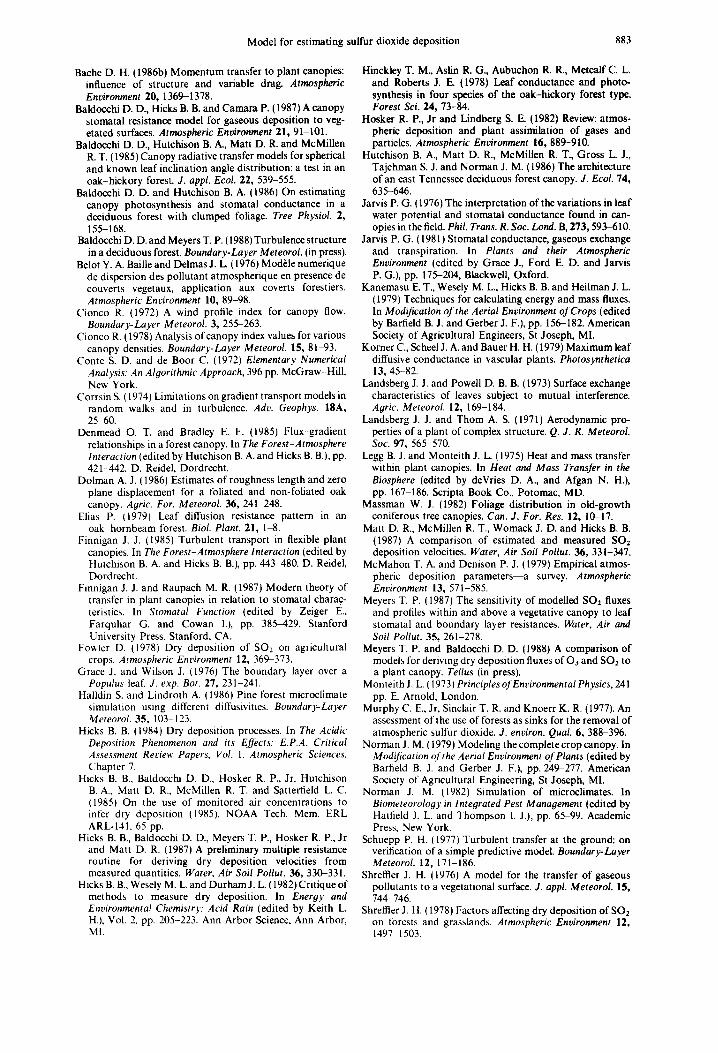
The comparison between measured and computed S O 2 deposition velocities (Fig. 14; Table 2) also shows that there is no significant difference between measured and computed values on the 10'~ level of significance. The correlation coefficient between measured and computed Vd values, however, is lower than that observed for SO2 fluxes (r = 0.62; r 2 = 0.38). This lower correlation coefficient results from several factors. First, deposition velocities are measured and calculated with less accuracy than deposition fluxes, since an additional source of error is introduced via the measurement of the absolute SO: concentration. Second, SO2 sensors are inherently noisy instruments and, thus, cause substantial run-to-run variability. Therefore, many experimental runs are needed to construct a meaningful estimate of the deposition flux (see Wesely and Hart, 1985).
Based on the current level of technology, we can reasonably conclude that deposition velocities, derived from long-term averages, are valid. On the other hand, we cannot make any such conclusions regarding short- term estimates of deposition velocity, as derived from this model.
t .5
"~ |.0 E o
N 0
• o 0.5
' I ' I I
- - $
ATDL-M 87/72.5
J
S E N S I T I V I T Y TO S T O M A T A L R E S I S T A N C E CURVATURE C O E F F I C I E N T
0 I I ~ I , I ,
0 ~ 0 0 2 0 0 :500 4 0 0 PAR ( W i n -2 )
Fig. 8. Sensitivity of SO2 deposition velocities to variations in the stomatal resistance curvature coefficient (b,,) and PAR. These computations are based on the standard conditions presented in Table 1 for a deciduous forest and u equal to
3ms -~ at 30m.
;~7~ DENNIS BALDO('~. HI
t.0
O.B
o£ 0.6
0.4 >~
0 . 2
A T O L - M 8 7 / 723
' t l ' )
SENSITIVITY TO BULK CANOPY DRAG COEFFICIENT
~ 0 . 0 t 6
(e)
0 , I ~ I A I ,
O tOO 200 300 400 PAR (Win -2 )
4 . 0 , , , I I l
E 0.6 u
e _ ~ ~- O.Ot6 0.4
0.2
(0)
0 , I , I i I
0.5 4.5 2.5 3.5 U ( m s " t )
Fig. 9. (aJ Sensitivity of SO2 deposition velocities to variations in the bulk canopy drag coefficient I C,,.) and photosynthetically active radiation (PAR). These computations are based on the standard conditions presented in Table I for a deciduous forest and wind speed equals 3 ms ' at 30 m. (b) Sensitivity of SO2 deposition velocities to variations in the bulk canopy drag coefficient (C,m) and wind speed (u). These computations ~,.rt- based on the standard conditions presented in Table 1 for a
deciduous forest and PAR equals 400 W m 2.
DISCUSSION
A hierarchy test of various deposition models by Meyers and Baldocchi (1988) shows that the multi- layer, 'K-theory', gaseous deposition model, presented here, significantly improves upon the hybrid multi- layer, 'big-lear deposition model presented earlier by the author and other colleagues (Baldocchi et al., 1987). This improvement in model performance is attributed to a more realistic and improved treatment of the canopy architecture, the canopy microclimate, the SO2 sink-strength, its sink-location and the leaf and soil boundary layer resistances, as compared with the "big-lear approach. Bache (1986a) also shows that
a multi-layer deposition model improves upon a 'big- leaf' model as the surface resistance becomes progres- sively small, but when this resistance is relatively greater than the boundary layer resistances. The major limi- tation in utilizing a multi-layer model is the need for additional model parameters and profile measure- ments of canopy structure, which are often difficult to obtain.
These computations of SO2 fluxes are based on "K- theory' (Monteith, 1973). The use of 'K-theory' to simulate within-canopy turbulent transfer has been criticized because within-canopy turbulent transfer is an intermittent process, predominantly driven by large eddies (Denmead and Bradley, 1985). Consequently, it
Model for estimating sulfur dioxide deposition 879
t .0
0.8
A
i
0.6
o~ 0.4
0.2
A T D L - M 8 7 / 7 2 4
' I I ' I '
SENSIT IV ITY TO WIND ATTENUATION COEFFICIENT e ~ , !
~ 6 . 9 5
A
I f f l
E
¢%1 o 09
(o ) 0 i I , I J I i
0 t 0 0 2 0 0 3 0 0 4 0 0 PAR ( W rn "2 )
~.0 , , I I ' I I
0.5 4.5 2 .5 3.5 U ( m s "~ )
Fig. 10. (a) Sensitivity of SO2 deposition velocities to variations in the wind speed attenuation coefficient (~t) and photosynthetically active radiation (PAR). These computations are based on the standard conditions presented in Table 1 for a deciduous forest and wind speed equals 3 m s- 1 at 30 m. (b) Sensitivity of SO2 deposition velocities to variations in the wind speed attenuation coefficient (~t) and wind speed (u). These computations are based on the standard conditions presented
in Table 1 for a deciduous forest and PAR equals 400 Wm -2.
has been suggested that turbulent transfer cannot be described well by mean profiles of eddy exchange coefficients (K) and the entity of interest (Legg and Monteith, 1975; Finnigan, 1985; Finnigan and Raupach, 1987).
On the other hand, 'K-theory' models make reason- able estimates of turbulent exchange if the turbulent length scales are smaller than the distance associated with changes in the vertical gradient of the entity (Corrsin, 1974). Recently, Bache (1986b) showed that 'K-theory' models simulate wind speed profiles well in the upper portion of a canopy, but do not simulate the secondary wind speed maximum deep inside the canopy; this deficiency is considered to be relatively
inconsequential since little transfer occurs deep inside the canopy.
Examination of the [SO2] profiles (Fig. 3) show that the curvature of the concentration gradients is rather weak in the upper portion of the canopy, where most of the SO2 exchange occurs. This evidence, combined with the work of Bache (1986b) concerning wind speed profiles, suggests that 'K-theory' models may be valid for estimating SO2 exchange in tall vegetation because the length scales of the turbulence are probably smaller than the distances associated with changes in the concentration and wind speed gradients.
The limitations associated with the use of 'K-theory' to compute deposition fluxes are also less severe if the
8 8 0 D E N N I S B A L D O ( ' ( ' H I
4.0
0 . 8
0 . 6 E (J
v
¢M o {n 0 . 4
0 . 2
i
E o
0 0
4.0
0.8-
0 . 6
0 . 4
A T D L - M 8 7 / 7 2 4
1 ] ~ - I I ' S E N S I T I V I T Y TO L E A F L E N G T H
f .... /
I L I i ( a ) j 4 O0 3 0 0 4 0 0
t I I 2 0 0
PAR ( W m -2 )
O. 2
' I ' I ' I I
( b ) 0 L I , 1 i l
0 . 5 t . 5 2 . 5 :5.5 U ( m s -4 )
Fig. 11. (a) Sensitivity of SO2 deposition velocities to variations in the leaf length (I) and photosynthetically active radiation (PAR1. These computations are based on the standard conditions presented in Table 1 for a deciduous forest and wind speed equals 3 m s- ~ at 30 m. (b) Sensitivity of SO2 deposition velocities to variations in the leaf length (l) and wind speed (u). These computations are based on the standard conditions
presented in Table I for a deciduous forest and PAR equals 400 W m 2.
canopy aerodynamic resistance is much smaller than the canopy stomatal or surface resistance. This con- dition generally holds for the case of turbulent transfer above and within forest canopies since the ratio between aerodynamic and canopy stomatal resistances is about 1:5 (Jarvis, 1981; Verma et al., 1986). Other supporting evidence on using 'K-theory" to compute SO2 deposition in a deciduous forest is provided by the strong sensitivity of SOz Vd to canopy stomatal resistance and the relative insensitivity to the aerody- namic and diffusive boundary layer resistances.
One may, therefore, conclude that the ability to model gaseous deposition in tall, aerodynamically rough canopies is highly dependent on the quality and accuracy of the parameterization of the canopy stoma-
tal resistance. These conditions do not hold with shorter agricultural crops or for cases when the canopy stomatal or surface resistance is not the controlling factor (see Bache, 1986a), as is the case with HNO3 deposition.
The resistance-analog or 'K-theory' approach has been used in many dry deposition models (Waggoner, 1975; Shreffler, 1976; Belot et al., 1976; Murphy et al., 1977; Unsworth, 1980; Wiman and Argen, 1985). The dry deposition models available in the literature, however, do not use a detailed stomatal resistance submodel or canopy radiative-transfer submodel to estimate the surface resistance. At best, these models only consider the effect of light on stomatal resistance through the use of empirical relationships for light-
Model for estimating sulfur dioxide deposition 881
ATDL-M87/722
4 . 5 ' r ' U ' U ' i ~
1 / 50o_.--- - ' L ~ ~ ' - - - '~
T 1.0 I - & ~
o..~m. 0.5 y ~x~6~o~oOo SE J ~ NSITIVITY TO --
CUTICLE RESISTANCE
O L I , I , I = 0 t O0 200 :500 400
PAR ( W m "2 )
Fig. 12. Sensitivity of SO2 deposition velocities to variations in the cuticle resistance (Re.t) and photosynthetically active radiation (PAR). These computations are based on the standard conditions presented in Table 1 for a deciduous forest and wind speed
equals 3 m s- ; at 30 m.
A T D L - M 8 7 / 7 3 8
I I ' i ' I ' o I
0.12
'~ 0 . t 0 E
w 0 . 0 8 O W p-
0 . 0 6 O t . )
~ O . O 4 . . I e e
N
o 0 . 0 2 DECIDUOUS FOREST
JULY, 498,5
0 , I ~ l , I L I , I , 0 0 .08 0.46 0 . 2 4
SO z FLUX, MEASURED lppb m s " !1
Fig. 13. Comparison between SO, fluxes measured and computed with the multi-layer, resistance-analog de- position model (MULTIVD). These data are from a well- watered, fully-leafed deciduous forest, near Oak Ridge,
TN. The data were obtained during July 1985.
attenuation in plant canopies (Waggoner, 1975; Murphy et al., 1977). The model described here improves upon these earlier dry deposition models through the use of a more detailed theory to describe the sink term, due to stomatal resistance (e.g. Norman, 1979, 1982; Baldocchi and Hutchison, 1986).
The estimation of canopy stomatal resistance (R~c) in a deciduous forest has been tested by Baldocchi and Hutchison (1986), using different canopy-radiative transfer models. They found that R , , computed with a
AE 22:5-D
spherical Poisson canopy radiative transfer model (e.g. Norman, 1979), underestimates canopy stomatal con- ductance by about 10',~,o, when compared with es- timates based on measured profiles of PAR. The parameterization of canopy stomatal resistance can be improved in a deciduous forest in several ways. For example, the estimation of vertical profiles of sunlit and shaded leaf area and the flux density of PAR on those leaves can be improved by considering: (a) penumbral effects; (b) the effects of clumped foliage, and (c) vertical variations in leaf inclination angles and leaf optical properties. Stomatal resistance is also sensitive to leaf temperature. Leaf energy lance con- siderations can also be incorporated into the model to simulate the leaf temperature effect on stomatal resist- ance more accurately (see Meyers, 1987). Measurements of leaf potential should also be pro- vided as a model input to quantify the effects of water stress on the uptake of gaseous pollutants.
The sensitivity tests showed a great dependence of V d on r~m and b,s. This result is somewhat dishearten- ing since r~,, of many ecological groups can vary by an order of magnitude (Korner et al., 1979) and few data on b,s exist in the literature. Accurate computations of Vd with this model may need an on-site determination of r~,, and b,~ before the model is employed.
Computations of SO2 Va are also sensitive to cuticle resistance when this resistance is small, as when the canopy is wet. In order to accurately parameterize the cuticle resistance of a wet canopy we need to know how much of the canopy is wet, how much water is on the canopy and how saturated is the surface water with SO2. Research on these topics is encouraged.
The treatment of the leaf boundary layer resistance is somewhat limited by use of engineering relation-
882 DENNIS BALDO{'t'HI
Table 2. Statistics on the comparison of SO2 deposition velocities and flux measurements with values computed with the multi-layer, resistance analog model ( M U LTIVD I. Data are representative of a deciduous oak forest near
Oak Ridge, TN
Measured MULTIVD Measured M ULlqVI) 1"d(cms ') flux~ppbm.~ ~)
Mean 0.69 0.62 - 0.054 - (J.044 Standard error 0.076 0.021 (~.O 1 ~ t).o I 1 Sample periods 12 12
Paired Student's t-test l '~ Flux
Degrees of freedom 11 Mean difference - {I.074 Standard error 0.067 Student's t-value - 1.09 Significance level 0.15 Coeff. of determination 0.38
11 -0.010 0.0087
--1.15 0.14 0.90
t.0
"7 0.8
E
~ 0.6 I.-
U . IE o t..) 0.4
0.2
O O
AT OL- M 8 7 / 7 ~,9
I ~ I ' [ ' I ' j ' 1 1
t/O
, I , I , I L I , I L I 0.2 0.4 0.6 0.8 t .O 4.2
Vd, MEASURED (cms -~)
Fig. 14. Comparison between SO2 deposition velocities measured and computed with the multi-layer, resistance analog deposition model (MULTIVD). These data are from a well-watered, fully-leafed deciduous
forest, near Oak Ridge, TN. The data were obtained during July t985.
ships developed for flow over flat plates. Natural variations in leaf size, orientation and pubescence, leaf flutter, the nature of the flow (i.e. turbulent vs laminar, forced vs free convection) and many other factors affect the leaf boundary layer (Grace and Wilson, 1976). Fortunately, this resistance is small in com- parison with the other resistances and thus does not contribute to a large error in the estimate of SO2 exchange to the forest. However, Bache (1986a) shows that its role is quite important when the surface resistance approaches zero.
Acknowledgements--This work was conducted under agree- ments between the National Oceanic and Atmospheric Administration and the U.S. Department of Energy, as a
contribution to the National Acid Precipitation Assessment Program, and under the auspices of Task Group II (Atmospheric Chemistry). Much appreciation is expressed to Dr T. P. Meyers for his comments and advice. We are also grateful to Drs D. H. Bache and K. S. Rao for commenting on this work and to Dr D. R. Matt for providing the SO2 flux data.
REFERENCES
Appleby R. F. and Davies W. J. (19831A possible evaporation site in the guard cell wall and the influence of leaf structure on the humidity response by stomata of woody plants. Oeclooia 56, 30-40.
Bache D. H. (1986a) On the theory of gaseous transport to plant canopies. Atmospheric Environment 20, 1379-1388.
Model for estimating sulfur dioxide deposition 883
Bache D. H. (1986b) Momentum transfer to plant canopies: influence of structure and variable drag. Atmospheric Environment 20, 1369-1378.
Baldocchi D. D., Hicks B. B. and Camara P. (1987) A canopy stomatal resistance model for gaseous deposition to veg- etated surfaces. Atmospheric Environment 21, 91-101.
Baldocchi D. D., Hutchison B. A., Matt D. R. and McMillen R. T. (1985) Canopy radiative transfer models for spherical and known leaf inclination angle distribution: a test in an oak-hickory forest. J. appl. Ecol. 22, 539-555.
Baldoochi D. D. and Hutchison B. A. (1986) On estimating canopy photosynthesis and stomatal conductance in a deciduous forest with clumped foliage. Tree Physiol. 2, 155-168.
Baldocchi D. D. and Meyers T. P. (1988) Turbulence structure in a deciduous forest. Boundary-Layer Meteorol. (in press).
Belot Y. A. Baille and Delmas J. L. (1976) ModUle numerique de dispersion des pollutant atmospherique en presence de couverts vegetaux, application aux coverts forestiers. Atmospheric Environment 10, 89-98.
Cionco R. 0972) A wind profile index for canopy flow. Boundary-Layer Meteorol. 3, 255-263.
Cionco R. (1978) Analysis of canopy index values for various canopy densities. Boundary-Layer Meteorol. 15, 81-93.
Conte S. D. and de Boor C. (1972) Elementary Numerical Analysis: An Algorithmic Approach, 396 pp. McGraw-Hill, New York.
Corrsin S. (1974) Limitations on gradient transport models in random walks and in turbulence. Adv. Geophys. 18A, 25-60.
Denmead O. T. and Bradley E. F. 0985) Flux-gradient relationships in a forest canopy. In The Forest-Atmosphere Interaction (edited by Hutchison B. A. and Hicks B. B.), pp. 421-442. D. Reidel, Dordrecht.
Dolman A. J. (1986) Estimates of roughness length and zero plane displacement for a foliated and non-foliated oak canopy. Agric. For. Meteorol. 36, 241 248.
Elias P. 11979) Leaf diffusion resistance pattern in an oak hornbeam forest. Biol. Plant. 21, 1-8.
Finnigan J. J. (1985) Turbulent transport in flexible plant canopies. In The Forest-Atmosphere Interaction (edited by Hutchison B. A. and Hicks B. B.), pp. 443 480. D. Reidel, Dordrecht.
Fmnigan J. J. and Raupach M. R. (1987) Modern theory of transfer in plant canopies in relation to stomatal charac- teristics. In Stomatal Function (edited by Zeiger E., Farquhar G. and Cowan l.), pp. 385J,29. Stanford University Press. Stanford, CA.
Fowler D. (1978) Dry deposition of SO2 on agricultural crops. Atmospheric Environment 12, 369-373.
Grace J. and Wilson J. (1976) The boundary layer over a Populus leaf. J. exp. Bot. 27, 231-241.
Halldin S. and Lindroth A. (1986) Pine forest microcfimate simulation using different diffusivities. Boundary-Layer Meteorol. 35, 103-123.
Hicks B. B. (1984) Dry deposition processes. In The Acidic Deposition Phenomenon and its EfJects: E.P.A. Critical Assessment Ret'iew Papers, Vol. l, Atmospheric Sciences, Chapter 7.
Hicks B. B., Baldocchi D. D., Hosker R. P., Jr, Hutchison B. A., Matt D. R., McMillen R. T. and Satterfield L. C. (1985~ On the use of monitored air concentrations to infer dry deposition (1985). NOAA Tech. Mem. ERL ARL-141, 65 pp.
Hicks B. B., Baldocchi D. D., Meyers T. P., Hosker R. P., Jr and Matt D. R. (1987) A preliminary multiple resistance routine for deriving dry deposition velocities from measured quantities. Water, Air Soil Pollut. 36, 330-331.
Hicks B. B., Wesely M. L. and Durham J. L. (1982) Critique of methods to measure dry deposition. In Energy and Environmental Chemistry: Acid Rain (edited by Keith L. H.), Vol. 2, pp. 205-223. Ann Arbor Science, Ann Arbor, MI.
Hinckley T. M., Aslin R. G., Aubuchon R. R., Metcalf C. L. and Roberts J. E. (1978) Leaf conductance and photo- synthesis in four species of the oak-hickory forest type. Forest Sci. 24, 73-84.
Hosker R. P., Jr and Lindberg S. E. (1982) Review: atmos- pheric deposition and plant assimilation of gases and particles. Atmospheric Environment 16, 889-910.
Hutchison B. A., Matt D. R., McMillen R. T., Gross L J., Tajchman S. J. and Norman J. M. (1986) The architecture of an east Tennessee deciduous forest canopy. J. Ecol. 74, 635-646.
Jarvis P. G. (1976) The interpretation of the variations in leaf water potential and stomatal conductance found in can- opies in the field. Phil. Trans. R. Soc. Lond. B, 273, 593-610.
Jarvis P. G. (1981) St omatal conductance, gaseous exchange and transpiration. In Plants and their Atmospheric Environment (edited by Grace J., Ford E. D. and Jarvis P. G.), pp. 175-204, Blackwell, Oxford.
Kanemasu E. T., Wesely M. L., Hicks B. B. and Heilman J. L. (1979) Techniques for calculating energy and mass fluxes. In Modification of the Aerial Environment of Crops (edited by Barfield B. J. and Gerber J. F.), pp. 156-182. American Society of Agricultural Engineers, St Joseph, M1.
Korner C., Scheel J. A. and Bauer H. H. (1979) Maximum leaf diffusive conductance in vascular plants. Photosynthetica 13, 45-82.
Landsberg J. J. and Powell D. B. B. (1973) Surface exchange characteristics of leaves subject to mutual interference. Agric. Meteorol. 12, 169-184.
Landsberg J. J. and Thom A. S. (1971) Aerodynamic pro- perties of a plant of complex structure. Q. J. R. Meteorol. Soc. 97, 565-570.
Legg B. J. and Monteith J. L. (1975) Heat and mass transfer within plant canopies. In Heat and Mass Transfer in the Biosphere (edited by deVries D. A., and Afgan N. H.), pp. 167-186. Scripta Book Co., Potomac, MD.
Massman W. J. (1982) Foliage distribution in old-growth coniferous tree canopies. Can. J. For. Res. 12, 10-17.
Matt D. R., McMillen R. T., Womack J. D. and Hicks B. B. (1987) A comparison of estimated and measured SOz deposition velocities. Water, Air Soil Pollut. 36, 331-347.
McMahon T. A. and Denison P. J. (1979) Empirical atmos- pheric deposition parameters--a survey. Atmospheric Environment 13, 571-585.
Meyers T. P. (1987) The sensitivity of modelled SO2 fluxes and profiles within and above a vegetative canopy to leaf stomatal and boundary layer resistances. Water, Air and Soil Pollut. 35, 261-278.
Meyers T. P. and Baldocchi D. D. (1988) A comparison of models lor deriwng dry deposition fluxes of 03 and SO2 to a plant canopy. Tellus (in press).
Monteith J. L. ( 1973J Principles of Environmental Physics, 241 pp. E. Arnold, London.
Murphy C. E., Jr, Sinclair T. R. and Knoerr K. R. (1977). An assessment of the use of forests as sinks for the removal of atmospheric sulfur dioxide. J. environ. Qual. 6, 388-396.
Norman J. M (1979) Modeling the complete crop canopy. In Modification of the Aerial Environment of Plants (edited by Barfield B. J. and Gerber J. F.), pp. 249-277. American Society of Agricultural Engineering, St Joseph, MI.
Norman J. M. (1982) Simulation of microclimates. In Biometeorology in Integrated Pest Management (edited by Hatfield J. L. and Thompson I. J.), pp. 65-99. Academic Press, New York.
Schuepp P. H. (1977) Turbulent transfer at the ground: on verification of a simple predictive model. Boundary-Layer Meteorol. 12, 171-186.
Shrelfler J. H. (1976) A model for the transfer of gaseous pollutants to a vegetational surface. J. appl. Meteorol. 15, 744-746.
Shreffler J. H. (1978) Factors affecting dry deposition of SO2 on forests and grasslands. Atmospheric Environment 12, 1497 1503.

884 DENNIS BALDOCCHI
Spedding D. J. (1969) Uptake of sulphur dioxide by barley leaves at low sulphur dioxide concentrations. Nature 224, 1229 1230.
Thom A. S. (1975) Momentum, mass and heat exchange oi plant communities. In Vegetation and the Atmosphere (edited by Montelth J. L). Vol. 1, pp. 57 109. Academic Press, London.
Turner N. C. and Begg J. E. (1973) Stomatal behavior and water status of maize,, sorghum and tobacco under field conditions, I: at high soil water potential. Plant Physiol. 51, 31 36.
Unsworth M. H. (1980)The exchange of carbon dioxide and air pollutants between vegetation and the atmosphere. In Plants and their Atmospheric Environment (edited by Grace J., Ford E. D. and Jarvis P, G.I, pp. 111 138. Blackwell, London.
Verma S. B,, Baldocchl D. D., Anderson D. E., Matt D. R. and Clement R. J. (1986) Eddy fluxes of CO2, water vapor and
sensible heat over a deciduous lbrest. Boundar)-Layer Meteorol. 36, 71 91.
Waggoner P. I::. (1975) Micrometeorological models. In Vegetation and the Atmosphere (edited by M ontelt h J. L. t, Vot. I, pp. 205 228. Academic Press, London.
Weiss A. and Norman J. M. 11985) Partitioning ~olar radiation into direct and dllFuse ~ lslble and near infra-red components. A,qric. For. ,Vl et eorol. 34, 205-214.
We~ely M. L. and Hart R. L. (1985)Variabdity of short term eddy-correlation estimates of mass exchange. 1)1 The Forest Atmosphere Interaction {edited by Hutchlson B. A. and Hicks B. B./, pp. 591 612. I). RcLdel, Dor~rcchl.
Wiman B. L. B. and Agren G. [. 11985) Aerosol depletion and deposmon m lbrests a model analyMs..,ttmo.spheri¢ Environment 19, 335 347.
Wisniewski J. and Kinsman J. D. t 1982) An overview of acid rain momtormg acti,~me~ m North America. Bull 4m. meteorol. Soc. 63, 598 618


![Chapter_07a[Sulfur Dioxide Removal]](https://img.pdfslide.net/doc/110x75/544ab51ab1af9f7c4f8b4aff/chapter07asulfur-dioxide-removal.jpg)