Embed Size (px)
Citation preview
A Multi-Level Finite Element Method forModeling Rubber-Toughened Amorphous
Polymers
Han E.H. Meijer, Leon E. Govaert, Robert J.M. Smit
DPI, Dutch Polymer Institute, MaTe, Materials Technology, TUE,Eindhoven University of Technology, P.O. Box 513, 5600 MB Eindhoven, The
Netherlands, www.mate.tue.nl
Introduction
Provided that their molecular weight is sufficiently high to form a real physicalnetwork, generally 8 to 10 times the molecular weight between entanglements, allpolymers are intrinsically tough. Nevertheless they sometimes appear to be brittle,
Polymers are intrinsically tough although they can suffer fromextreme localization of the deformation. A pronounced softeningafter yield, followed by a low hardening, promotes this extremelocalization. Post-yield behavior is directly related to the polymerentanglement density, thus to the chain stiffness. A number of –rather academic- experiments, using (in order of increasingentanglement density) Polystyrene (PS), Polymethylmetacrylate(PMMA) and Polycarbonate (PC), clearly demonstrate theimportance of the intrinsic post-yield behavior on the macroscopicresponse. Furthermore polymers differ in their capability ofsustaining triaxial stresses, yielding cavitation and –ultimately-crazing. This phenomenon causes notch sensitivity of all polymers,including the so-called tough PC. To overcome this problem, thematerials should be made heterogeneous. This paper addresses theuse of the Multi-Level Finite Element Method to analyze theheterogeneous deformation of two-phase polymer blends. Twoimportant length scales are considered: the heterogeneous RVE(representative volume element) and that of the continuous scale.Analyses like these not only improve our understanding of thephenomena that occur on the different scales, but also givedirections towards improvement of existing materials.
either during simple slow speed tensile testing (e.g. PS) or, alternatively, under lowand high speed, notched, loading conditions (e.g. PC), and worldwide much effort isput in circumventing these obvious problems. Generally heterogeneity is introducedby creating a second dispersed phase. Although for semi-crystalline polymers evenhard inclusions proved to be effective, provided that their mutual distance was belowa critical value such that the anisotropic crystal orientations could be exploited (1, 2,3, 4, 5, 6), in amorphous polymers up to now only rubbers proved to be successful.Introducing a rubbery phase has a drawback - modulus and yield strength decrease.As a consequence, optimization is sought, by changing the final morphology of thesystems investigated and by tuning the properties of the dispersed phase. Recently,modeling capabilities, using relatively advanced constitutive equations and finiteelement methods, have become mature to the point whereas useful trends can bepredicted. The fully 3D constitutive equations used today describe in a proper sensethe elastic response, the rate and temperature dependent yield, the intrinsic softeningand subsequent hardening behavior of the materials investigated, making use of aprincipally visco-elastic description. Following the original contributions of Boyce etal. (7, 8) nowadays multi-mode versions of the compressible Leonov model(describing a fluid), as proposed by Baaijens (9), are used to model polymer solids.The relaxation times, or viscosity’s, of the distinct modes of the constitutive modelare strongly stress dependent and decrease about 18 decades when the stress increasesfrom zero to –only- 40 MPa (10, 11, 12). Yield is thus seen as a stress-inducedpassage of the glass transition temperature, where the secondary bonds looseconnectivity. Softening is added in the model using a more or less empirical approach(13, 14, 15). The network contribution (stretching of the surviving primary bonds) isrepresented by an extra spring, placed in parallel. Different expressions are availableto describe the hardening, 3 and 8 chain models by Boyce (16), full chain models byWu and Van der Giessen (17), whereas, in many cases, a simple Neo-Hookeanapproach proves to be sufficient (15, 18). The final failure of the stretched network iscaused by a stress-induced flow (disentangling) or by chain breakage (19, 20).
Amorphous polymers differ in their resistance to triaxial stress states. Surpassinga maximum value (estimated to be 40 MPa for Polystyrene, PS; 75 MPa forPolymethylmetacrylaat, PMMA; and 90 MPa for Polycarbonate, PC (21, 22, 23)matrix cavitation is induced and ultimately crazing occurs. Moreover polymers differin a subtle manner in the relative importance of the intrinsic softening, that can lead tocatastrophic localizations. It is the purpose of this paper to illustrate this by a numberof dedicated experiments on one hand and advanced calculations of the deformationand failure of homogeneous and heterogeneous polymeric systems on the other hand.The paper is organized as follows: First in an experimental approach homogeneouspolymers are examined under different loading conditions. Subsequently, numericalinvestigations on homogeneous and heterogeneous polymeric systems are performedthat basically confirm the outcomes of the experiments on homogeneous systems.Finally, validation is sought by tuning the microstructure of specially designedheterogeneous polymer systems.
Experimental results on homogeneous polymers
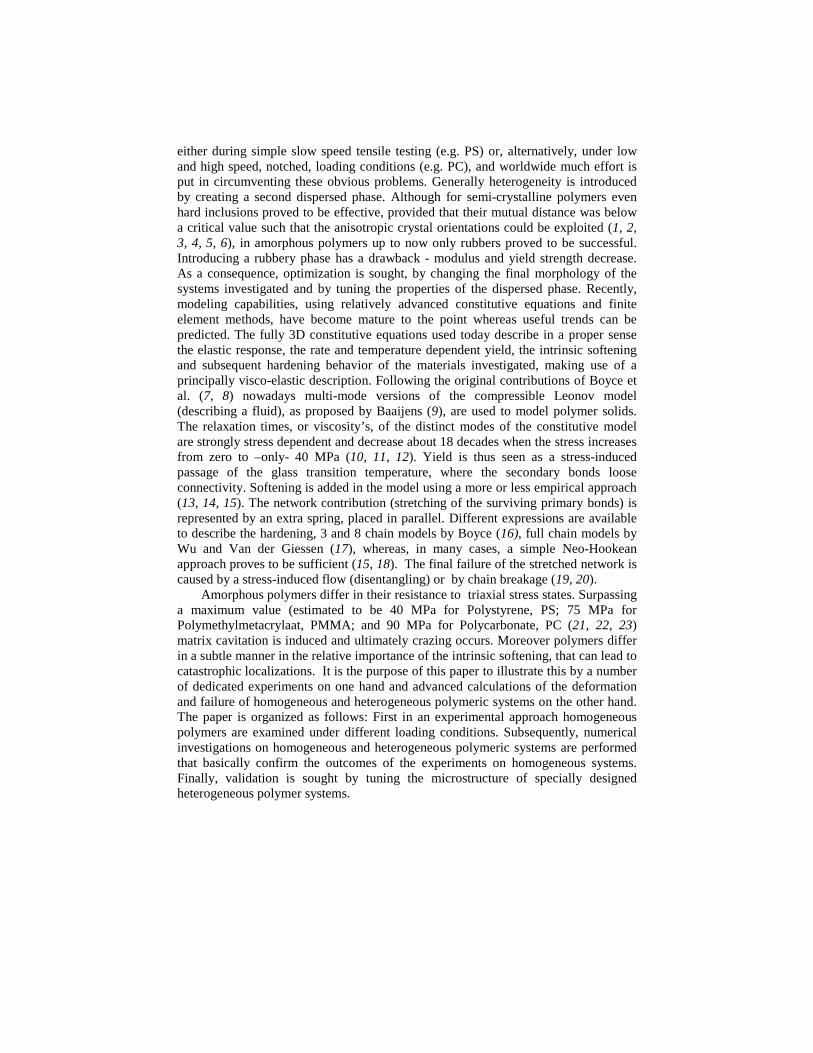
A breakthrough in the investigations of the response of different polymers uponloading was achieved by applying compression, rather than the classical tensile tests(24). Figure 1 contains the well-known tensile response of brittle PS, intermediatePMMA and tough PC (Figure 1a) as compared to their compression behavior (Figure1b). The compression tests tend to promote a homogeneous deformation. These testswere stopped when the samples showed barreling. The maximum draw ratio, asdetermined by the maximum network deformability (25, 26, 27, 28, 29, 30, 31, 32)was, consequently, not yet reached. The differences of the three polymers tested, PS,PMMA and PC respectively, are, in compression, only minor and one would noteasily predict their tensile behavior based on these experiments that reflect theirintrinsic response to loading.
(a) (b)
Figure 1. Tensile (a) and compression (b) behavior of PC, PMMA and PS.
Three, rather academic but notwithstanding relevant, tests on homogeneous PS,PMMA and PC have been performed, see (33) for further details and a more elaboratediscussion. The difference between tensile and compression response wasinvestigated under superposed pressure, under high temperatures and after mechanicalrejuvenation. A superposed hydrostatic pressure exceeding 0.4 kbar was shown to besufficient to suppress crazing (34), since the criterion of maximum triaxial (dilative)stress (40 MPa for PS) is never reached. Not surprisingly, the brittle tensile behaviorof PS has completely disappeared and a deformation behavior like that achieved incompressive loading is obtained. Similar arguments hold for PMMA, which alsocompletely loses its apparent brittleness and defect sensitivity upon applying asuperposed pressure.
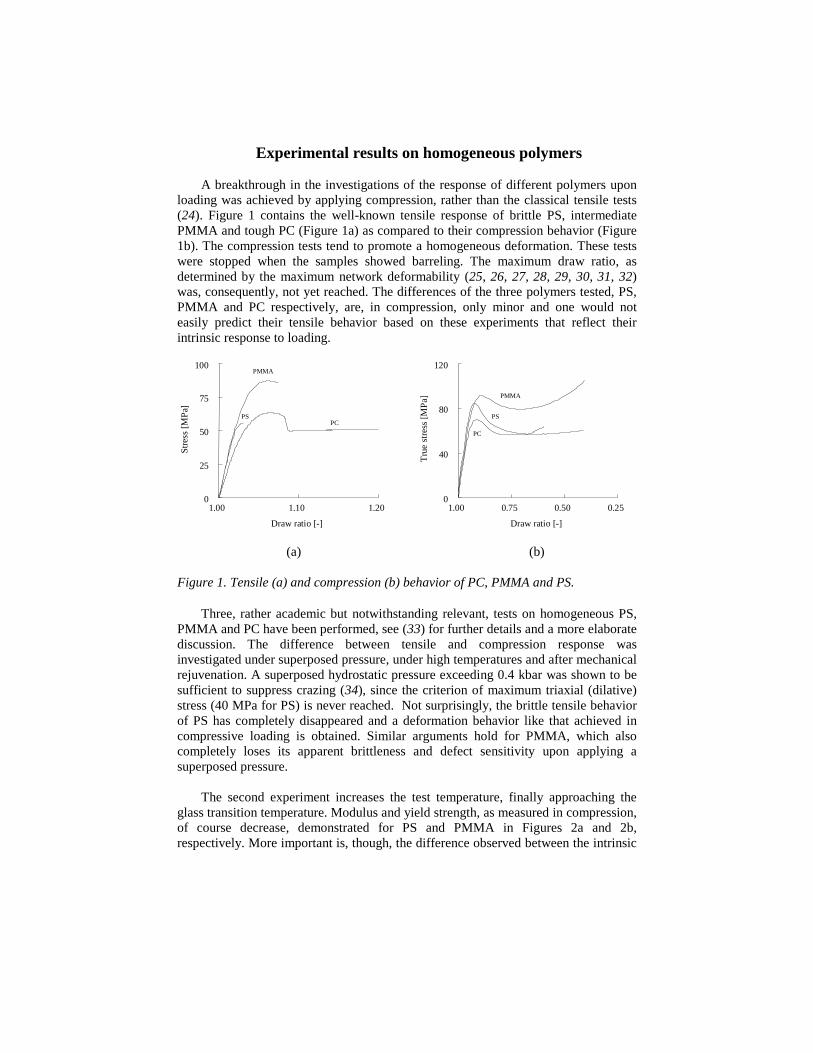
The second experiment increases the test temperature, finally approaching theglass transition temperature. Modulus and yield strength, as measured in compression,of course decrease, demonstrated for PS and PMMA in Figures 2a and 2b,respectively. More important is, though, the difference observed between the intrinsic
1.00 1.10 1.20
Draw ratio [-]
0
25
50
75
100
Str
ess
[M
Pa]
PC
PMMA
PS
0.250.500.751.00
Draw ratio [-]
0
40
80
120
Tru
e s
tre
ss [
MP
a]
PC
PMMA
PS
deformation behavior of the two polymers. For PS, Figure 2a, the post yield behavioris only slightly altered and softening is in absolute terms hardly influenced by the testtemperature, while for PMMA, Figure 2b, a complete different behavior is observed.Softening gradually disappears upon increasing the temperature.
(a) (b)
Figure 2. Compression response of PS (a) and PMMA (b) at elevated temperaturesand a strain rate of 10-2 s-1.
As could have been expected from Figures 1a and 1b, inspecting the compressionbehavior of PC versus PS and PMMA and the consequent differences in tensilebehavior, these differences in the change in intrinsic compression behavior betweenPS and PMMA upon increasing the testing temperature are of course clearly reflectedin their tensile behavior, see Figures 3a and 3b, respectively.
(a) (b)
Figure 3. Tensile response of PS (a) and PMMA (b) at elevated temperatures at astrain rate of 10-2 s-1.
0.200.400.600.801.00
Draw ratio [-]
0
30
60
90
120
Tru
e s
tre
ss [
MP
a]
25°C
45°C
65°C
85°C
0.200.400.600.801.00
Draw ratio [-]
0
30
60
90
120
Tru
e s
tre
ss [
MP
a]
45°C
25°C
65°C
85°C
1.00 1.05 1.10 1.15 1.20
Draw ratio [-]
0
15
30
45
60
Str
ess
[M
Pa]
45 °C
65 °C
85 °C
25 °C
1.00 1.20 1.40 1.60
Draw ratio [-]
0
25
50
75
100
Str
ess
[M
Pa]
65 °C
25 °C
45 °C
85 °C
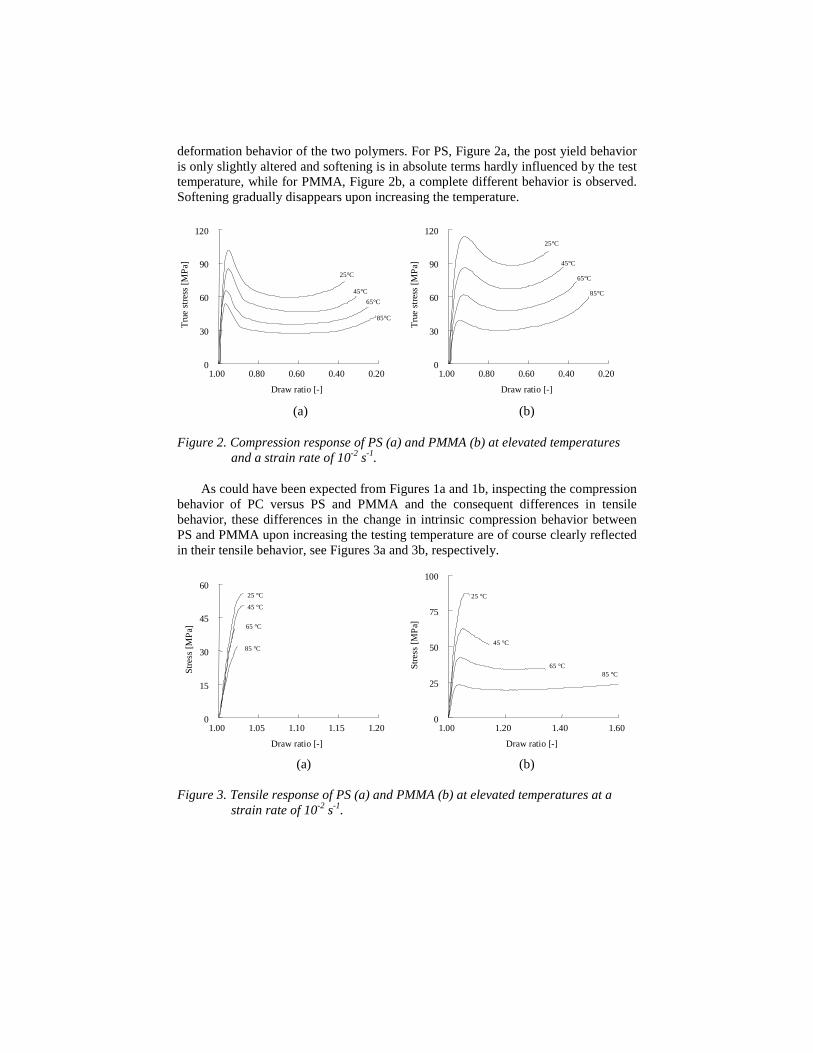
Whereas PS embrittles further upon increasing the temperature, PMMA becomesductile. However, upon decreasing the testing speed, also for PS differences arefound, see Figures 4a and 4b. Testing at 10-3 s-1 shows ductile behavior at 85 0C,while a further decrease of the strain rate to 10-4 s-1, yields ductile behavior already at65 0C.
(a) (b)
Figure 4. Effect of strain rate on the tensile response of PS at elevatedtemperature;(a) 10-3 s-1, (b) 10-4 s-1.
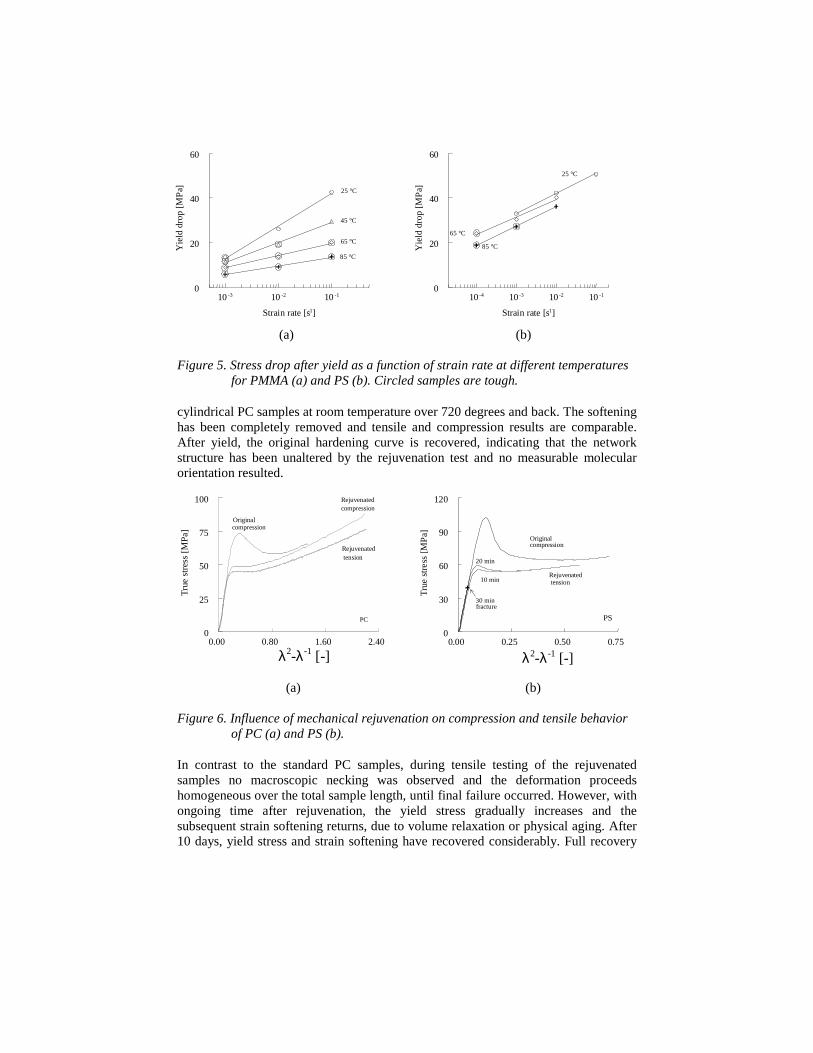
All results of the influence of testing temperature and speed can be summarizedin one figure. Figure 5 plots the yield drop observed in a compression test, defined asthe difference in the maximum value of the stress-strain curve, the yield point, and theminimum value after yield, caused by intrinsic softening, versus the strain rateapplied. Straight lines are found, shifting to lower values at higher temperatures.Above a yield drop of approximately 25 MPa, brittle fracture is observed, below thisvalue ductile behavior is found. This so-called critical value of the yield drop, foundat least for the test geometry used, clearly illustrates the importance of the details inpost yield behavior of polymers, more specific the overruling influence of theintrinsic softening. This is further demonstrated via a number of intriguingmechanical rejuvenation experiments, our third test.
Thermal pre-conditioning or mechanical pre-deformation have a significanteffect on the macroscopic deformation behavior of amorphous polymers. Cross andHaward observed that quenched samples of PVC showed uniform deformation intensile (35), whereas annealed samples showed necking. Bauwens (36) preventednecking in PVC by a preceded alternating bending procedure applied on the sample.This this was also shown to be the case for PC, since G’Sell obtained uniformdeformation in simple shear, after plastic cycling (37, see also: 38 and 39). Ender andAndrews performed cold drawing experiments on pre-deformed PS (40). Weredesigned these procedures, in order to be able to measure the intrinsic materialbehavior. First the results of PC will be discussed. Figure 6a shows the dramaticchange in intrinsic behavior of PC after mechanical rejuvenation by twisting
1.00 1.05 1.10 1.15 1.20
Draw ratio [-]
0
15
30
45
60
Str
ess
[M
Pa]
25 °C
45 °C
65 °C
10-4 s-1
1.00 1.05 1.10 1.15 1.20
Draw ra tio [-]
0
15
30
45
60
Str
es
s [M
Pa
]
2 5 °C
4 5 °C
6 5 °C
8 5 °C
10- 3 s- 1
(a) (b)
Figure 5. Stress drop after yield as a function of strain rate at different temperaturesfor PMMA (a) and PS (b). Circled samples are tough.
cylindrical PC samples at room temperature over 720 degrees and back. The softeninghas been completely removed and tensile and compression results are comparable.After yield, the original hardening curve is recovered, indicating that the networkstructure has been unaltered by the rejuvenation test and no measurable molecularorientation resulted.
(a) (b)
Figure 6. Influence of mechanical rejuvenation on compression and tensile behaviorof PC (a) and PS (b).
In contrast to the standard PC samples, during tensile testing of the rejuvenatedsamples no macroscopic necking was observed and the deformation proceedshomogeneous over the total sample length, until final failure occurred. However, withongoing time after rejuvenation, the yield stress gradually increases and thesubsequent strain softening returns, due to volume relaxation or physical aging. After10 days, yield stress and strain softening have recovered considerably. Full recovery
10 -4 10 -3 10 -2 10 -1
Strain rate [s-1]
0
20
40
60
Yie
ld d
rop
[MP
a]
25 °C
85 °C
65 °C
10 -3 10 -2 10 -1
Strain rate [s-1]
0
20
40
60
Yie
ld d
rop
[MP
a] 25 °C
85 °C
65 °C
45 °C
0.00 0.80 1.60 2.40
λ2-λ-1 [-]
0
25
50
75
100
Tru
e s
tre
ss [
MP
a]
PC
Rejuvenatedtension
Rejuvenatedcompression
Originalcompression
0.00 0.25 0.50 0.750
30
60
90
120
Tru
e s
tre
ss [
MP
a]
Originalcompression
Rejuvenatedtension10 min
20 min
30 minfracture
PS
λ2-λ-1 [-]
takes in the order of three weeks. PS and PMMA crazed, during twisting and were,consequently, mechanically rejuvenated in a different way. Of both materials, tensiletesting bars were cold rolled on a slow speed hand-controlled two roll mill (diameterof the rolls was 45 mm), reducing the thickness to 68%. As a result, the width andlength of the tensile bars increased. The rolled PMMA tensile bars show a similareffect while here the recovery time is in the order of 3 days. No results are shown,since we concentrate on the more extreme example of PS. Figure 6b shows thetremendous influence of the mechanical rejuvenation procedure. Macroscopicsoftening is, comparable to PC and PMMA, completely absent, the material is ductilein tensile, no crazes occur –indirectly confirming that crazing should be preceded bylocalized yield (19)- and the original hardening curve is almost obtained again. Thelast demonstrates that, although more than in the twisting case, during rollingapparently no significant molecular orientation was induced. The time effect ofrecovery of strain softening of PS is spectacular. Tests were performed at 10, 20, and30 minutes after rolling. In the two first tests, some non-critical recovery of the yieldstress and strain softening is observed, while at 30 minutes after pre-deformation, forPS brittle fracture is found again. (Especially this influence of pre-deformation on themechanical behavior in tensile of PS is a nice classroom example. After rolling, knotscan be made in the tensile test bar at the beginning of the lecture. Leaving the knottedbar on the desk, during further explanation, it can be broken in a complete brittle way,at the end of the lecture.)
The post-yield behavior of polymers is decisive for their macroscopic response,brittle or ductile. Intrinsic softening causes localization of the deformation. Toostrong yield drop leads to catastrophic localization and early failure. In Figure 5 thiscritical stress drop after yield was observed of approximately 25 MPa, for the testgeometries used. This value is not confirmed by the mechanical rejuvenationexperiments, where fracture appears to occur at lower values of the yield drop.Obviously more accurate compression and tensile experiments, after rejuvenationfollowed by physical aging, are required. We do not doubt that these could beperformed, but rather point your attention to the following observation. The timeeffects during volume relaxation and physical aging, that bring back, after amechanical rejuvenation treatment, the original yield stress and the intrinsic softeningand, consequently, brittleness, are spectacular (3 weeks for PC, 3 days for PMMA and30 minutes for PS), not understood and unexplored, and deserve much more attention.
Numerical results on homogeneous and heterogeneouspolymers
Numerical predictions of the deformation and failure of (heterogeneous)polymeric systems was long hampered by the combination of three problems: thedifficult intrinsic materials response, the generally complex microstructure and theunsolved problem how to couple the events in the microstructure to the macroleveland vice versa. Applying the above-mentioned constitutive equations, using materialparameters as determined in compression tests, solved the first problem. The second
problem has been overcome by applying a detailed finite element calculation on themicroscale, i.e. on RVE (representative volume element) level, which should be both:randomly stacked and large enough to be representative (41). Finally, introducing arobust, but computationally expensive, MLFEM (multi-level finite element method)analysis (42, 43) recently the third problem has been solved. The numericalsimulations strongly support the statement that it are the subtle differences in post-yield behavior (softening followed by hardening) that finally determine whethercatastrophic localization occurs, and thus brittle behavior. They discriminate betweenthe different polymers used but, moreover, give directions towards possible solutions.We will show (i) the defect versus notch sensitivity of the homogeneous polymers,both yielding craze formation and brittle behavior and thus making heterogeneoussystems necessarily, (ii) the RVE-responses of the heterogeneous systems, and (iii)the implications of this behavior for the macroscopic response.
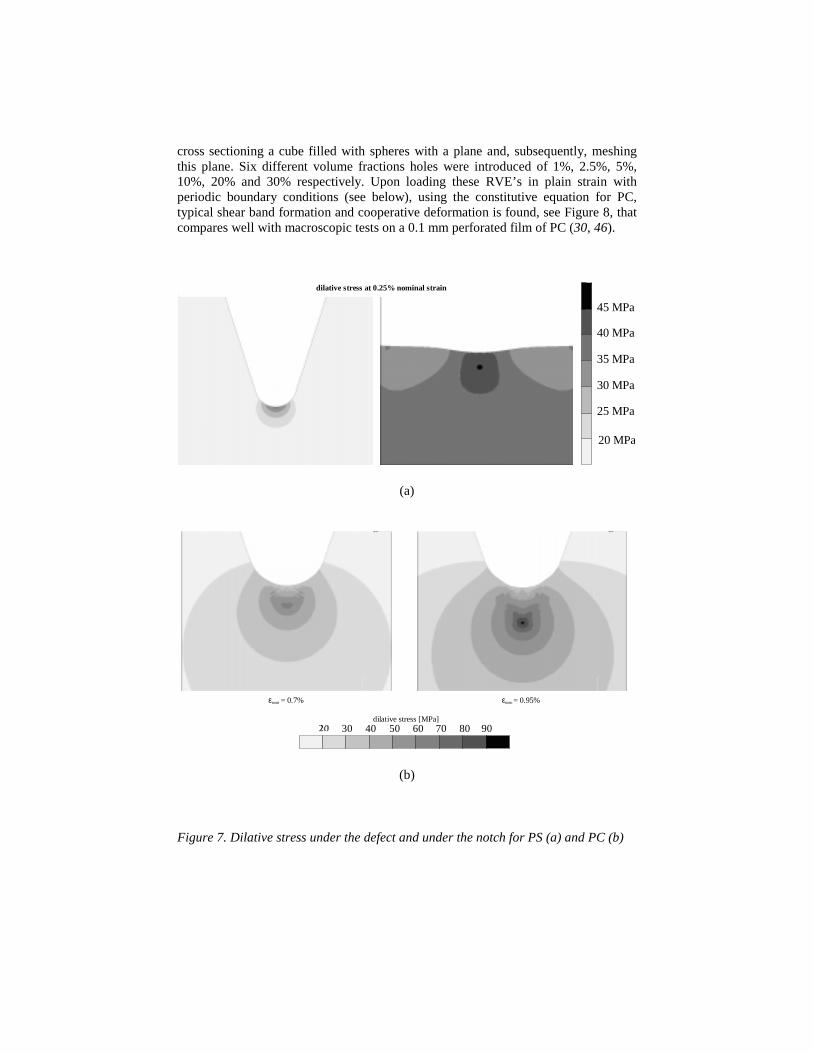
First homogeneous polymers are investigated; using notched tensile testing as theultimate test. Under the notch, a minor defect is introduced, a local flaw, induced e.g.by the freshly razorblade cut, often applied. The two extremes, PC and PS, are takenas an example. Their intrinsic behavior as tested in compression, see Figure 1b, isused, be it modeled with only one mode, to save computational effort (44). In this onemode model, care was taken to accurately describe the post yield behavior, while inthe elastic, pre-yield range some inaccuracy was accepted. Upon straining PS, alreadyat an extremely low macroscopic strain of 0.25%, the maximum triaxial stresscriterion of 40 MPa for PS is reached just below the defect. The material will cavitate.This process repeats and a craze is formed, perpendicular to the loading direction. Thematerial breaks in a brittle manner. PC, on the contrary, shows less pronouncedlocalization, survives the critical stress below the defect, given its higher resistanceagainst triaxial stresses (90 MPa for PC), and the stress concentration shifts to belowthe notch. Nevertheless also there the critical 90 MPa criterion is reached, be it at asomewhat higher macroscopic strain as compared to PS, and again a catastrophiccraze will form, perpendicular to the loading direction, see Figures 7a and 7b.
We can conclude that both materials show catastrophic localization. Thedifference between the two materials is that PS clearly is defect sensitive, while PC isonly notch sensitive. This is in accordance with practical experience that –in slowspeed unnotched tensile testing- PS clearly behaves brittle, the intermediate PMMAreaches the yield point, provided that the samples are carefully polished, while PC istough, see Figure 1a. To solve this apparently general problem, materials must bemade inhomogeneous, e.g. by incorporating a softer dispersed phase, usually a rubber.In order to investigate the influence thereof, heterogeneity is introduced in our FEMmodel and we investigate the response of an RVE, a representative volume element.In order to be representative, the RVE should be large enough. Simulations havetaught us that the total RVE response does not significantly change in differentsimulations using independently constructed RVE’s, when circa 300 randomlystacked holes are introduced, see (41, 45). We used holes as a first representation of adispersed rubbery phase with a modulus of zero MPa. We used a random stack, sincethis proved to be decisive in the RVE’s final response. The RVE’s are constructed by
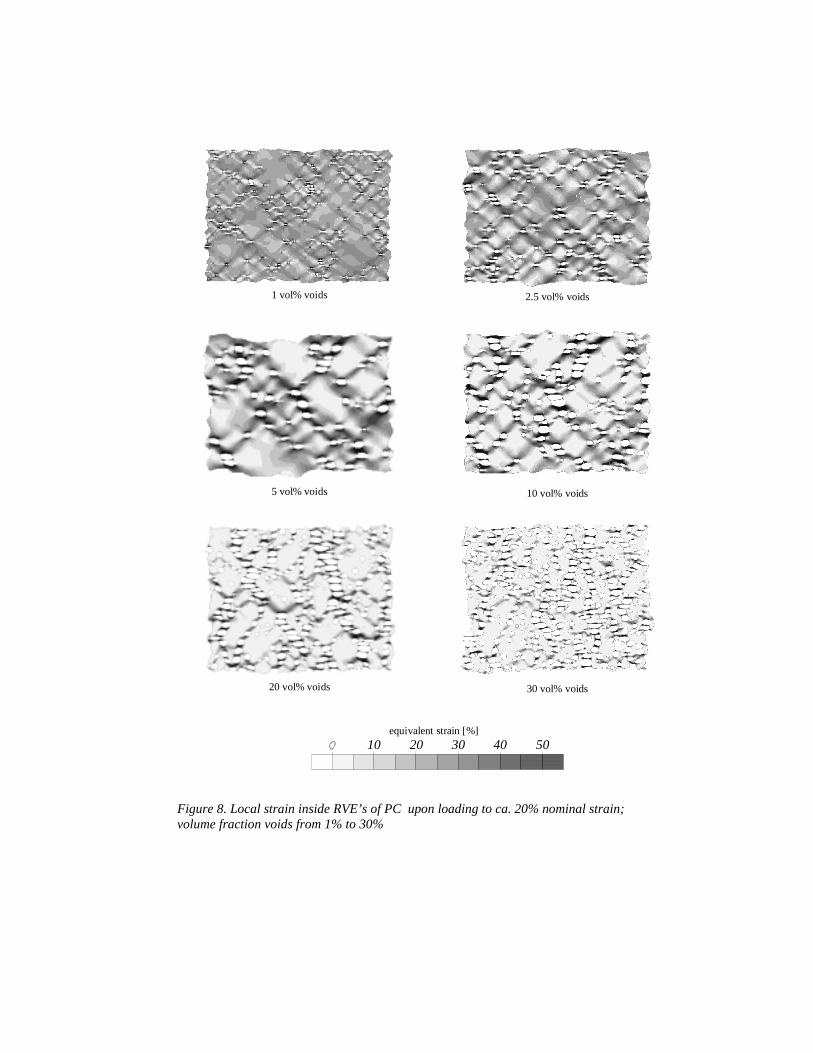
cross sectioning a cube filled with spheres with a plane and, subsequently, meshingthis plane. Six different volume fractions holes were introduced of 1%, 2.5%, 5%,10%, 20% and 30% respectively. Upon loading these RVE’s in plain strain withperiodic boundary conditions (see below), using the constitutive equation for PC,typical shear band formation and cooperative deformation is found, see Figure 8, thatcompares well with macroscopic tests on a 0.1 mm perforated film of PC (30, 46).
25 MPa
30 MPa
35 MPa
40 MPa
45 MPa
dilative stress at 0.25% nominal strain
20 MPa
(a)
30 40 50 60 70 80 90
εnom = 0.95%
dilative stress [MPa]
εnom = 0.7%
(b)
Figure 7. Dilative stress under the defect and under the notch for PS (a) and PC (b)
10 20 30 40 50
1 vol% voids 2.5 vol% voids
5 vol% voids 10 vol% voids
20 vol% voids 30 vol% voids
equivalent strain [%]
Figure 8. Local strain inside RVE’s of PC upon loading to ca. 20% nominal strain;volume fraction voids from 1% to 30%
20 40 60 80 100
PS with voids PS with thin core-shells PS with thick core-shells
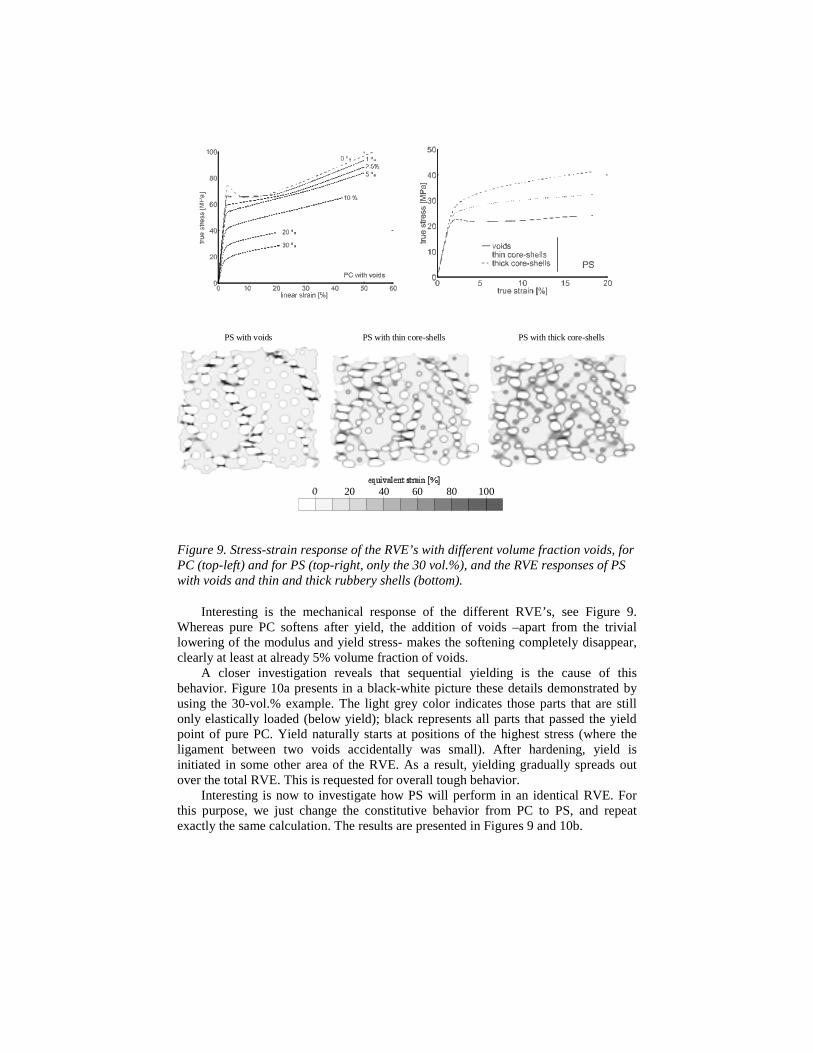
Figure 9. Stress-strain response of the RVE’s with different volume fraction voids, forPC (top-left) and for PS (top-right, only the 30 vol.%), and the RVE responses of PSwith voids and thin and thick rubbery shells (bottom).
Interesting is the mechanical response of the different RVE’s, see Figure 9.Whereas pure PC softens after yield, the addition of voids –apart from the triviallowering of the modulus and yield stress- makes the softening completely disappear,clearly at least at already 5% volume fraction of voids.
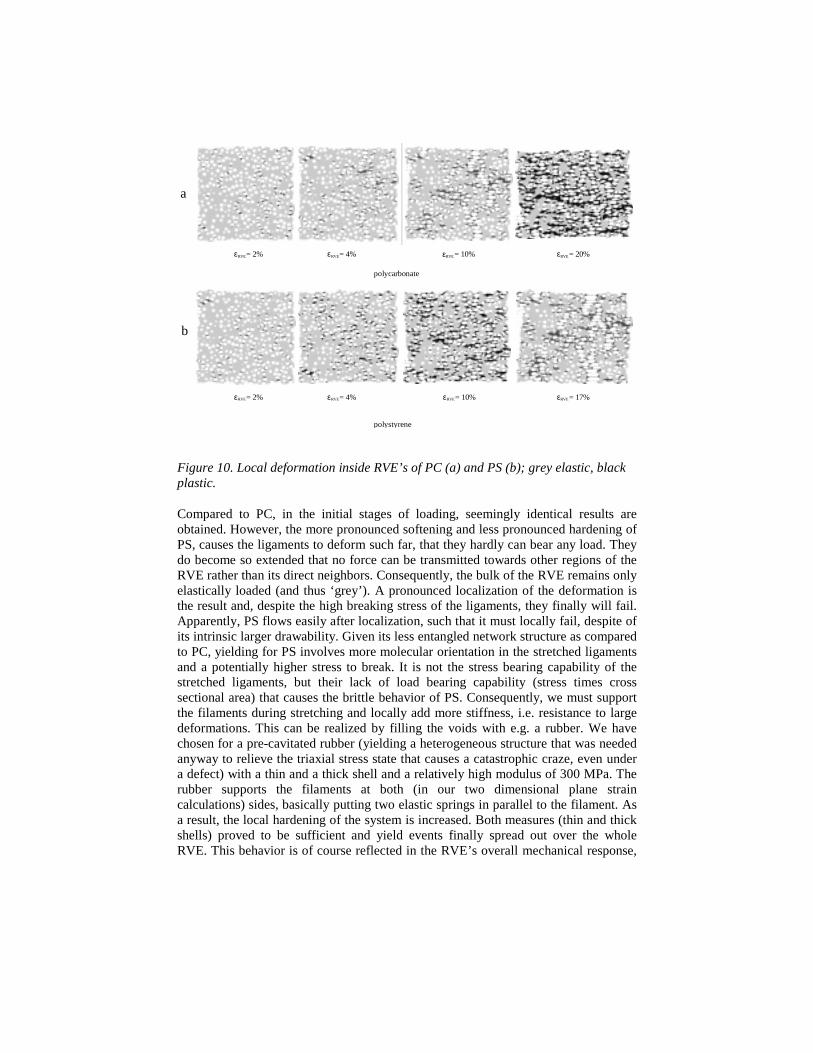
A closer investigation reveals that sequential yielding is the cause of thisbehavior. Figure 10a presents in a black-white picture these details demonstrated byusing the 30-vol.% example. The light grey color indicates those parts that are stillonly elastically loaded (below yield); black represents all parts that passed the yieldpoint of pure PC. Yield naturally starts at positions of the highest stress (where theligament between two voids accidentally was small). After hardening, yield isinitiated in some other area of the RVE. As a result, yielding gradually spreads outover the total RVE. This is requested for overall tough behavior.
Interesting is now to investigate how PS will perform in an identical RVE. Forthis purpose, we just change the constitutive behavior from PC to PS, and repeatexactly the same calculation. The results are presented in Figures 9 and 10b.
εRVE= 20%εRVE= 2% εRVE= 4%
εRVE= 10% εRVE= 17%εRVE= 2% εRVE= 4%
polycarbonate
polystyrene
εRVE= 10%
a
b
Figure 10. Local deformation inside RVE’s of PC (a) and PS (b); grey elastic, blackplastic.
Compared to PC, in the initial stages of loading, seemingly identical results areobtained. However, the more pronounced softening and less pronounced hardening ofPS, causes the ligaments to deform such far, that they hardly can bear any load. Theydo become so extended that no force can be transmitted towards other regions of theRVE rather than its direct neighbors. Consequently, the bulk of the RVE remains onlyelastically loaded (and thus ‘grey’). A pronounced localization of the deformation isthe result and, despite the high breaking stress of the ligaments, they finally will fail.Apparently, PS flows easily after localization, such that it must locally fail, despite ofits intrinsic larger drawability. Given its less entangled network structure as comparedto PC, yielding for PS involves more molecular orientation in the stretched ligamentsand a potentially higher stress to break. It is not the stress bearing capability of thestretched ligaments, but their lack of load bearing capability (stress times crosssectional area) that causes the brittle behavior of PS. Consequently, we must supportthe filaments during stretching and locally add more stiffness, i.e. resistance to largedeformations. This can be realized by filling the voids with e.g. a rubber. We havechosen for a pre-cavitated rubber (yielding a heterogeneous structure that was neededanyway to relieve the triaxial stress state that causes a catastrophic craze, even undera defect) with a thin and a thick shell and a relatively high modulus of 300 MPa. Therubber supports the filaments at both (in our two dimensional plane straincalculations) sides, basically putting two elastic springs in parallel to the filament. Asa result, the local hardening of the system is increased. Both measures (thin and thickshells) proved to be sufficient and yield events finally spread out over the wholeRVE. This behavior is of course reflected in the RVE’s overall mechanical response,
that still show softening after yield for the voided PS, in contrast to the voided PC,while in the pre-cavitated rubber filled PS the softening disappeared completely, seeFigure 9 and (44).
We will now investigate what the influence is of the RVE responses to themacroscopic response. To couple the two length scales involved, that of the RVE andthat of the continuum, macroscopic, scale, is not a trivial issue. Many attempts weretried, including different homogenization concepts. One of the most successful,computationally robust but expensive, methods –proposed in our laboratory by RobertSmit- is the so-called MLFEM, the multilevel finite element method, see (41, 42, 43,44, ,45). Its principle is simple. Macroscopically, the material is meshed using a finiteelement method. In the integration points of every element (4 per element) wedescend one level down to the RVE, that is considered to be locally periodic,implying that its neighbors deform identically. The macroscopic continuum is loadedby putting an incremental strain on its boundaries. The local strain as calculated in theintegration points of every element (using an estimation of the materials constitutivebehavior) is transferred to the boundaries of the RVE. Subsequently, the RVEaveraged stress is calculated, by performing a finite element calculation on RVElevel, as explained in the preceding section. This stress is transferred to the macro-mesh, where stress equilibrium is sought, by solving the momentum equation.Iterations with alternating (imposing local strain, resulting in the averaged localstress, yielding overall macroscopic stress equilibrium) analyses on the macro- andmicro-level continue, until convergence is reached. Accordingly, the sample is loadedwith the next incremental strain step, and the procedure repeats. Basically, thismethod uses the RVE analysis as a, non-closed form of the, constitutive equation ofthe heterogeneous system. Neighboring (each in its own periodic) RVE’s, only areconnected on the macro-level, via the stress balance, thus assuming that between theRVE’s in two neighboring integration points a large number of, in deformationgradually changing, RVE’s are present. The results of the analyses of unnotchedtensile bars are not reproduced here (see 43 for further details) but they show that –inaccordance with experiments- macroscopic homogeneous deformation is found, if theRVE response shows no more softening. The results of the notched tensile bar aresummarized in Figures 11a and 11b.
Explaining the findings of Figure 12, we should recall that we already knew thathomogeneous PS is defect sensitive, while PC is notch sensitive. In both cases thecritical triaxial stress state is reached (either under the defect or under the notch in ourpresent test configuration), and a catastrophic craze, perpendicular to the loadingdirection results for both materials, be it at different macroscopic strains.Consequently, in the macroscopic response almost no strain to break and a negligibleplastic deformation is found. For 30% voided PC, the deformation spreads over alarge part of the notched tensile bar. No failure criterion is met, the material behavestough. This might explain why, already at low volume fractions dispersed rubber (seee.g. Van der Sanden et al. (46), who used 5-vol.% 200 nm sized non-adhering coreshell rubbers) the notch sensitivity of PC in practice completely disappears. For 30%voided PS, no interesting improvement is found and the material starts to fail due to a
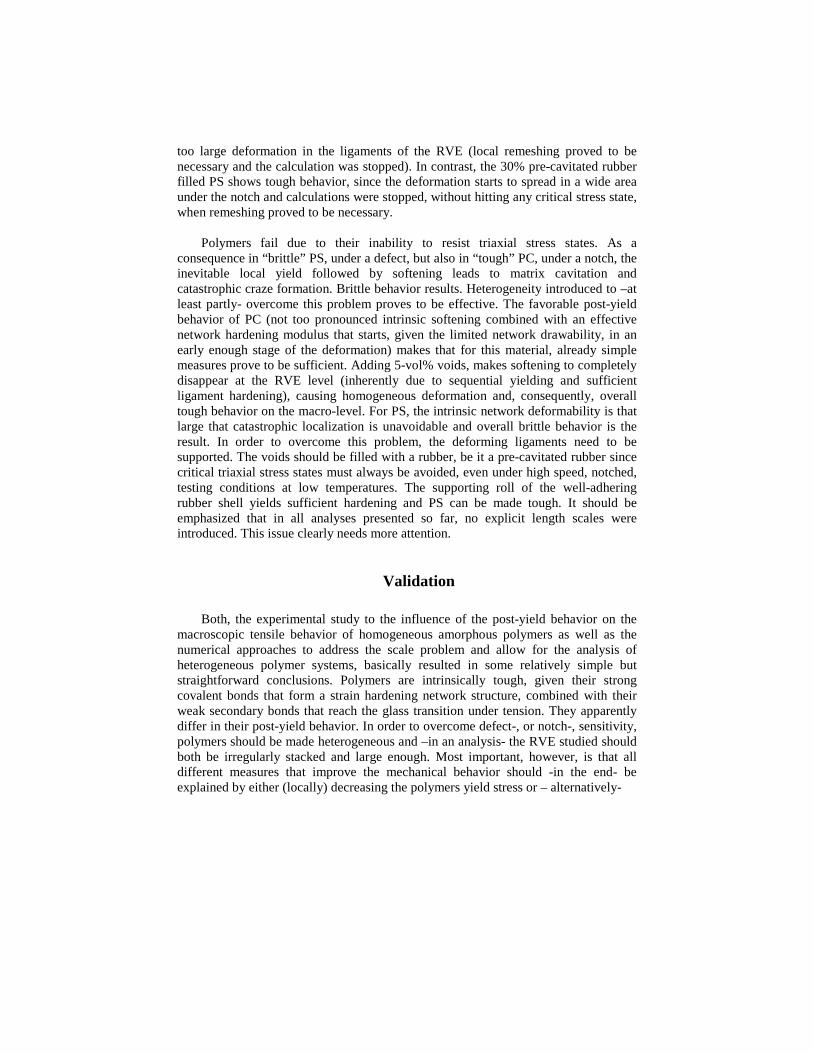
too large deformation in the ligaments of the RVE (local remeshing proved to benecessary and the calculation was stopped). In contrast, the 30% pre-cavitated rubberfilled PS shows tough behavior, since the deformation starts to spread in a wide areaunder the notch and calculations were stopped, without hitting any critical stress state,when remeshing proved to be necessary.
Polymers fail due to their inability to resist triaxial stress states. As aconsequence in “brittle” PS, under a defect, but also in “tough” PC, under a notch, theinevitable local yield followed by softening leads to matrix cavitation andcatastrophic craze formation. Brittle behavior results. Heterogeneity introduced to –atleast partly- overcome this problem proves to be effective. The favorable post-yieldbehavior of PC (not too pronounced intrinsic softening combined with an effectivenetwork hardening modulus that starts, given the limited network drawability, in anearly enough stage of the deformation) makes that for this material, already simplemeasures prove to be sufficient. Adding 5-vol% voids, makes softening to completelydisappear at the RVE level (inherently due to sequential yielding and sufficientligament hardening), causing homogeneous deformation and, consequently, overalltough behavior on the macro-level. For PS, the intrinsic network deformability is thatlarge that catastrophic localization is unavoidable and overall brittle behavior is theresult. In order to overcome this problem, the deforming ligaments need to besupported. The voids should be filled with a rubber, be it a pre-cavitated rubber sincecritical triaxial stress states must always be avoided, even under high speed, notched,testing conditions at low temperatures. The supporting roll of the well-adheringrubber shell yields sufficient hardening and PS can be made tough. It should beemphasized that in all analyses presented so far, no explicit length scales wereintroduced. This issue clearly needs more attention.
Validation
Both, the experimental study to the influence of the post-yield behavior on themacroscopic tensile behavior of homogeneous amorphous polymers as well as thenumerical approaches to address the scale problem and allow for the analysis ofheterogeneous polymer systems, basically resulted in some relatively simple butstraightforward conclusions. Polymers are intrinsically tough, given their strongcovalent bonds that form a strain hardening network structure, combined with theirweak secondary bonds that reach the glass transition under tension. They apparentlydiffer in their post-yield behavior. In order to overcome defect-, or notch-, sensitivity,polymers should be made heterogeneous and –in an analysis- the RVE studied shouldboth be irregularly stacked and large enough. Most important, however, is that alldifferent measures that improve the mechanical behavior should -in the end- beexplained by either (locally) decreasing the polymers yield stress or – alternatively-
17 32 47 62 77 92
εn om= 1.0%
εn om= 1.5%
εno m= 1.0%
εno m= 1.5%
εno m= 2.0%
εno m= 3.0%
PS with 30 vol. % precavitated rubber particles
PC with 30 vol. % voids
max. principle strain [%]
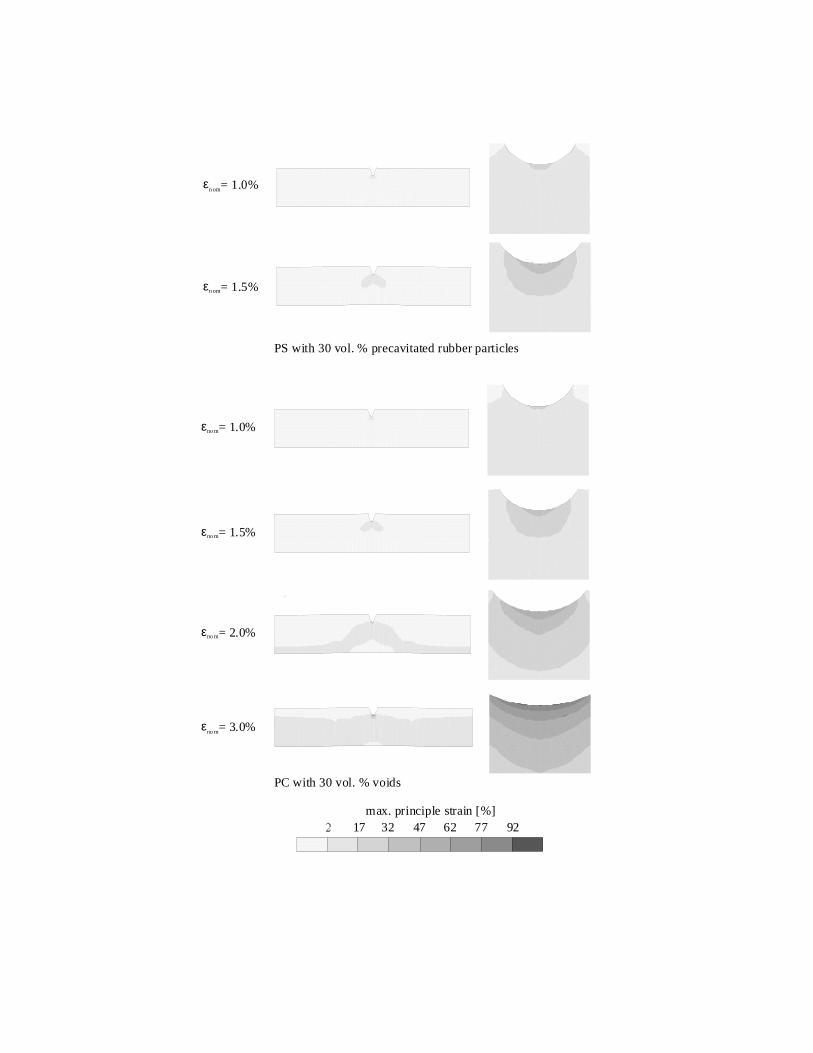
Figure 11. Macroscopic stress-strain behavior (b) and, for the tough materials, thelocal strains (a, previous page) for notched tensile test specimen of PC, PS, voidedPC, voided PS and rubbery shell filled PS.
increasing the polymers hardening modulus. Both measures decrease the yield dropcaused by intrinsic softening, and thus prevent the localization to becomecatastrophic. Well-known measures that have proved to be effective, like cross-linking PS, addition of plasticizers to e.g. PVC or PS, the introduction of heteogeneityand even rubber modification of e.g. PS, are more or less easily explained in theseterms.
The existence of an absolute value of a critical ligament thickness betweeninclusions, below which polymers behave tough, is however not explained yet, sincemechanical analyses, including those employing the MLFEM method, are principallyscale independent. Consequently, they can not deal with the absolute length scaledependence found in experiments, like the critical ligament thickness for semi-crystalline (1, 2, 3, 4, 5, 6) and amorphous (30, 31, 32, 46) polymers. In the first, theinfluence of trans-crystallinity, yielding orientation of the crystallization and,subsequently, anisotropy of the crystal properties (locally decreasing the yield stress)is fully explored. The length scales involved are related the crystal dimensions and themaximum transcrystallinity distance thus yielding a critical distance between either(easy cavitating) soft or (easy debonding) hard fillers that ranges from typically 0.3µm for Polyamide (PA) to 0.6 µm for Polyethylene (PE). For amorphous polymerssimilar effects are not found, although their configuration close to walls will not berandom. What has been found in non-adhering core-shell rubber modified amorphouspolymers is a critical ligament thickness that is network density dependent, andranges from 0.05 µm for PS to 3 µm for PC (30, 31, 32, 46). Originally, we tried toexplain the phenomenon of a critical ligament thickness between non-adheringinclusions in amorphous polymers, via a Griffith type of approach (32). The lengthscale entered the solution by comparing the (cross sectional) breaking energy of astrained filament with the (volumetric) stored elastic energy in its direct surroundings.Drawback of this approach remains that it is unclear how the polymer knows itsbreaking energy (and compare that to the stored elastic energy) before it is actually
broken. In (32), Kramer used a different approach to explain the experimentalfindings, by introducing an absolute length scale via the decisive influence of thesurface tension. Basically he stated that if the absolute value of a ligament is lowerthan the thickness of three fibrils in a craze (order 30-50 nm), no crazing can occur.
In terms of the present analysis, the post-yield behavior of a homogeneous orheterogeneous material is a crucial feature. Stabilization is only possible by asoftening reduction or hardening improvement. Consequently, either the yield stressor the strain hardening modulus should be influenced by the absolute size of thematerials microstructure. Smit (44, 47) tried to explain the experimental findingsalong this line of thinking. An enhanced mobility of polymer segments near a surfaceor interface cause the yield stress and strain softening to be reduced. The criticalligament thickness found for PS (order 50 nm) is in the same order of the radius ofgyration of PS molecules, and a lower yield stress could therefore easily result.Alternatively, if the localized (shear) deformation zone becomes smaller than theentanglement distance of a polymer chain (9.6 nm for PS), than only part of the chainis strained, by the stress-induced passage of the glass transition temperature (yield),while the remainder of the chain stays in the glassy state. This effectively results in aquasi-decrease in the molecular weight between entanglements, and thus in a largerhardening modulus. This situation is, again for PS, reached when the inclusions are inthe order of 30 nm, since the thickness of shearbands formed around inclusions, ascalculated by continuum mechanics (still valid on this scale?) are in the order of 15%of the size of the inclusions. Simulations showed that both explanations could –inprincipal- explain the experimental findings. However, molecular dynamicscalculations are needed to get more confidence in these statements.
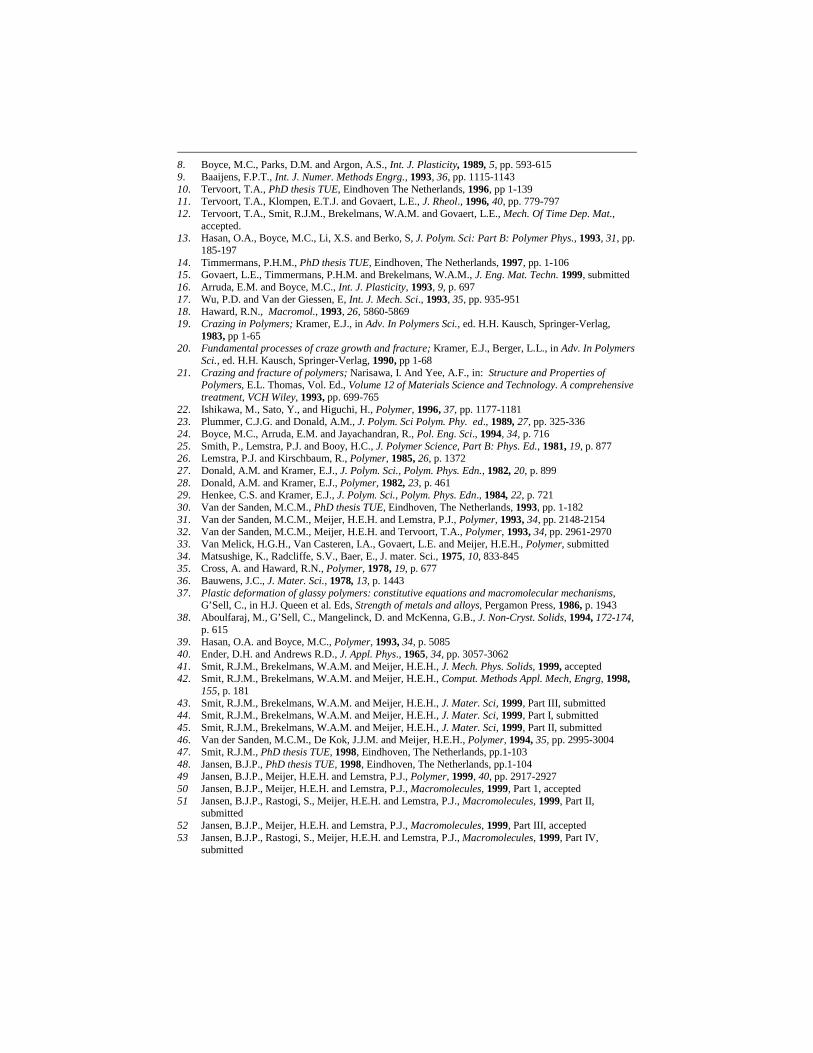
The validation of the predictions following from the modeling analysis ofheterogeneous polymer systems, finally, follows this same line. Using polymerizationinduced phase separation, meanwhile controlling the coalescence process, specialmorphologies on the 0.03 µm scale are realized using PS and PMMA as thecontinuous phase (48, 49, 50, 51, 52, 53). Reasons to try to create these specialmorphologies were inspired by the the experimental findings that the brittle toultimate-tough transition in PS (defined as an increase in its macroscopic strain tobreak to at least >150%) is prescribed by the interparticle distance and, consequently,shifted from the addition of >50 vol.% non-adhering core shell rubbers to only >30vol.%, when the size of the dispersed phase decreased from 200 nm (30, 31) to 80 nm(48). Only one example will be given here, demonstrating the synergistic effectsfound in semi-IPN’s of PMMA-aliphatic epoxy structures (also found, but notreproduced here, in real-IPN’s and co-polymers of the same system), see Figure 12.
The lower volume fractions of these systems (our original target area) still showpoor mechanical properties. This proved to be due to an incomplete phase separationprocess. However, from 30 vol.% and upwards, the tensile toughness of the systemsincreased tremendously, see Figure 12, clearly demonstrating its origin in the largedeformation capability of the continuous PMMA phase (as compared to the relatively
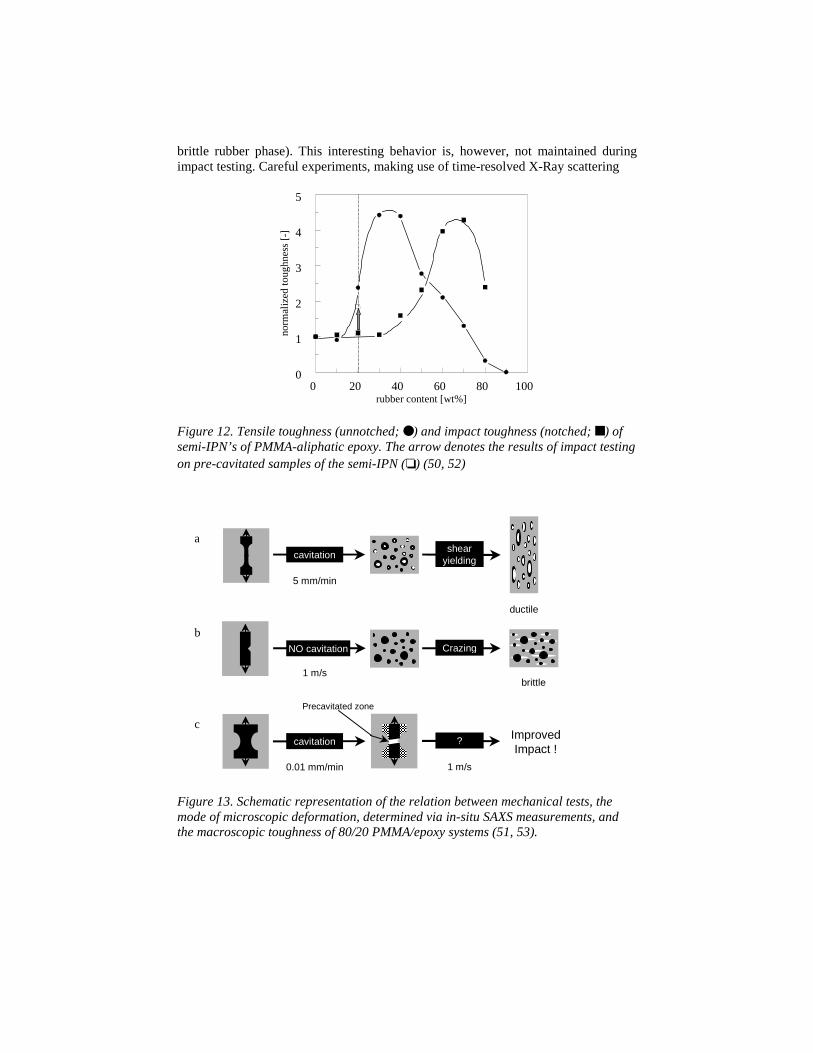
brittle rubber phase). This interesting behavior is, however, not maintained duringimpact testing. Careful experiments, making use of time-resolved X-Ray scattering
0 20 40 60 80 1000
1
2
3
4
5
norm
aliz
ed to
ughn
ess
[-]
rubber content [wt%]
Figure 12. Tensile toughness (unnotched; ●) and impact toughness (notched; ■) ofsemi-IPN’s of PMMA-aliphatic epoxy. The arrow denotes the results of impact testingon pre-cavitated samples of the semi-IPN (❏) (50, 52)
Fmt
igure 13. Schematic representation of the relation between mechanical tests, theode of microscopic deformation, determined via in-situ SAXS measurements, and
he macroscopic toughness of 80/20 PMMA/epoxy systems (51, 53).
cavitation
5 mm/min
shearyielding
ductile
NO cavitation
1 m/sbrittle
Crazing
cavitation
0.01 mm/min
Precavitated zone
1 m/s
ImprovedImpact !
?
a
b
c
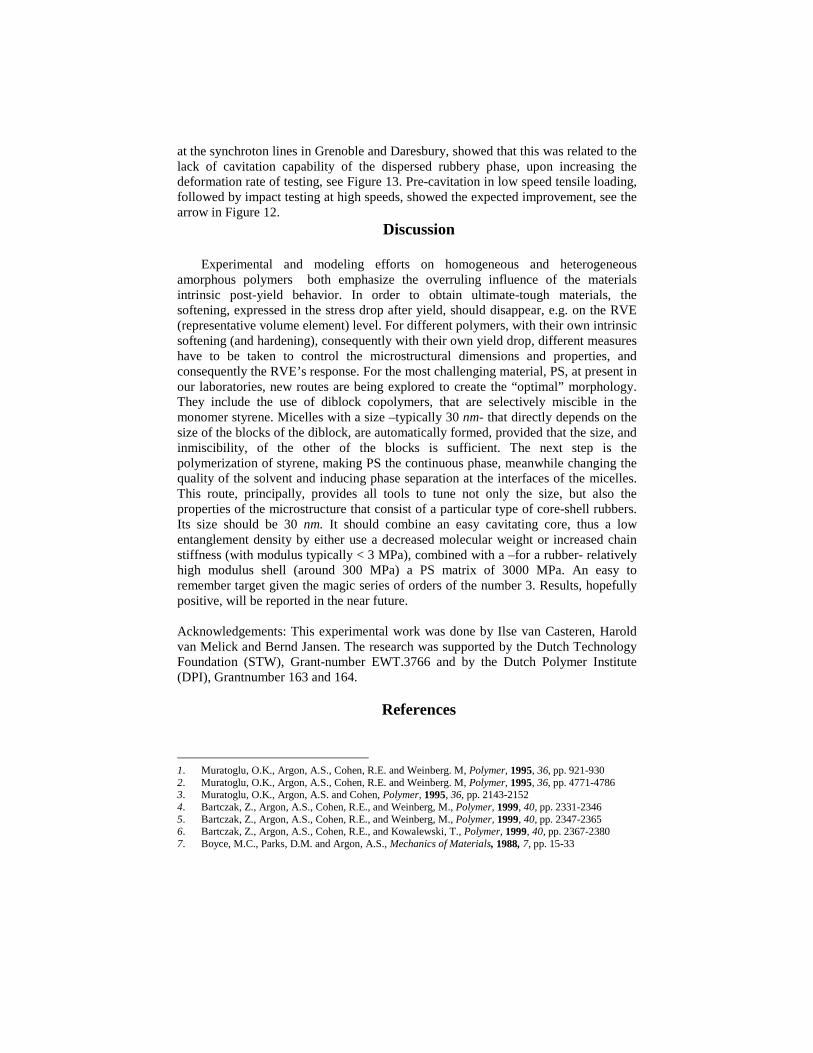
at the synchroton lines in Grenoble and Daresbury, showed that this was related to thelack of cavitation capability of the dispersed rubbery phase, upon increasing thedeformation rate of testing, see Figure 13. Pre-cavitation in low speed tensile loading,followed by impact testing at high speeds, showed the expected improvement, see thearrow in Figure 12.
Discussion
Experimental and modeling efforts on homogeneous and heterogeneousamorphous polymers both emphasize the overruling influence of the materialsintrinsic post-yield behavior. In order to obtain ultimate-tough materials, thesoftening, expressed in the stress drop after yield, should disappear, e.g. on the RVE(representative volume element) level. For different polymers, with their own intrinsicsoftening (and hardening), consequently with their own yield drop, different measureshave to be taken to control the microstructural dimensions and properties, andconsequently the RVE’s response. For the most challenging material, PS, at present inour laboratories, new routes are being explored to create the “optimal” morphology.They include the use of diblock copolymers, that are selectively miscible in themonomer styrene. Micelles with a size –typically 30 nm- that directly depends on thesize of the blocks of the diblock, are automatically formed, provided that the size, andinmiscibility, of the other of the blocks is sufficient. The next step is thepolymerization of styrene, making PS the continuous phase, meanwhile changing thequality of the solvent and inducing phase separation at the interfaces of the micelles.This route, principally, provides all tools to tune not only the size, but also theproperties of the microstructure that consist of a particular type of core-shell rubbers.Its size should be 30 nm. It should combine an easy cavitating core, thus a lowentanglement density by either use a decreased molecular weight or increased chainstiffness (with modulus typically < 3 MPa), combined with a –for a rubber- relativelyhigh modulus shell (around 300 MPa) a PS matrix of 3000 MPa. An easy toremember target given the magic series of orders of the number 3. Results, hopefullypositive, will be reported in the near future.
Acknowledgements: This experimental work was done by Ilse van Casteren, Haroldvan Melick and Bernd Jansen. The research was supported by the Dutch TechnologyFoundation (STW), Grant-number EWT.3766 and by the Dutch Polymer Institute(DPI), Grantnumber 163 and 164.
References
1. Muratoglu, O.K., Argon, A.S., Cohen, R.E. and Weinberg. M, Polymer, 1995, 36, pp. 921-9302. Muratoglu, O.K., Argon, A.S., Cohen, R.E. and Weinberg. M, Polymer, 1995, 36, pp. 4771-47863. Muratoglu, O.K., Argon, A.S. and Cohen, Polymer, 1995, 36, pp. 2143-21524. Bartczak, Z., Argon, A.S., Cohen, R.E., and Weinberg, M., Polymer, 1999, 40, pp. 2331-23465. Bartczak, Z., Argon, A.S., Cohen, R.E., and Weinberg, M., Polymer, 1999, 40, pp. 2347-23656. Bartczak, Z., Argon, A.S., Cohen, R.E., and Kowalewski, T., Polymer, 1999, 40, pp. 2367-23807. Boyce, M.C., Parks, D.M. and Argon, A.S., Mechanics of Materials, 1988, 7, pp. 15-33
8. Boyce, M.C., Parks, D.M. and Argon, A.S., Int. J. Plasticity, 1989, 5, pp. 593-6159. Baaijens, F.P.T., Int. J. Numer. Methods Engrg., 1993, 36, pp. 1115-114310. Tervoort, T.A., PhD thesis TUE, Eindhoven The Netherlands, 1996, pp 1-13911. Tervoort, T.A., Klompen, E.T.J. and Govaert, L.E., J. Rheol., 1996, 40, pp. 779-79712. Tervoort, T.A., Smit, R.J.M., Brekelmans, W.A.M. and Govaert, L.E., Mech. Of Time Dep. Mat.,
accepted.13. Hasan, O.A., Boyce, M.C., Li, X.S. and Berko, S, J. Polym. Sci: Part B: Polymer Phys., 1993, 31, pp.
185-19714. Timmermans, P.H.M., PhD thesis TUE, Eindhoven, The Netherlands, 1997, pp. 1-10615. Govaert, L.E., Timmermans, P.H.M. and Brekelmans, W.A.M., J. Eng. Mat. Techn. 1999, submitted16. Arruda, E.M. and Boyce, M.C., Int. J. Plasticity, 1993, 9, p. 69717. Wu, P.D. and Van der Giessen, E, Int. J. Mech. Sci., 1993, 35, pp. 935-95118. Haward, R.N., Macromol., 1993, 26, 5860-586919. Crazing in Polymers; Kramer, E.J., in Adv. In Polymers Sci., ed. H.H. Kausch, Springer-Verlag,
1983, pp 1-6520. Fundamental processes of craze growth and fracture; Kramer, E.J., Berger, L.L., in Adv. In Polymers
Sci., ed. H.H. Kausch, Springer-Verlag, 1990, pp 1-6821. Crazing and fracture of polymers; Narisawa, I. And Yee, A.F., in: Structure and Properties of
Polymers, E.L. Thomas, Vol. Ed., Volume 12 of Materials Science and Technology. A comprehensivetreatment, VCH Wiley, 1993, pp. 699-765
22. Ishikawa, M., Sato, Y., and Higuchi, H., Polymer, 1996, 37, pp. 1177-118123. Plummer, C.J.G. and Donald, A.M., J. Polym. Sci Polym. Phy. ed., 1989, 27, pp. 325-33624. Boyce, M.C., Arruda, E.M. and Jayachandran, R., Pol. Eng. Sci., 1994, 34, p. 71625. Smith, P., Lemstra, P.J. and Booy, H.C., J. Polymer Science, Part B: Phys. Ed., 1981, 19, p. 87726. Lemstra, P.J. and Kirschbaum, R., Polymer, 1985, 26, p. 137227. Donald, A.M. and Kramer, E.J., J. Polym. Sci., Polym. Phys. Edn., 1982, 20, p. 89928. Donald, A.M. and Kramer, E.J., Polymer, 1982, 23, p. 46129. Henkee, C.S. and Kramer, E.J., J. Polym. Sci., Polym. Phys. Edn., 1984, 22, p. 72130. Van der Sanden, M.C.M., PhD thesis TUE, Eindhoven, The Netherlands, 1993, pp. 1-18231. Van der Sanden, M.C.M., Meijer, H.E.H. and Lemstra, P.J., Polymer, 1993, 34, pp. 2148-215432. Van der Sanden, M.C.M., Meijer, H.E.H. and Tervoort, T.A., Polymer, 1993, 34, pp. 2961-297033. Van Melick, H.G.H., Van Casteren, I.A., Govaert, L.E. and Meijer, H.E.H., Polymer, submitted34. Matsushige, K., Radcliffe, S.V., Baer, E., J. mater. Sci., 1975, 10, 833-84535. Cross, A. and Haward, R.N., Polymer, 1978, 19, p. 67736. Bauwens, J.C., J. Mater. Sci., 1978, 13, p. 144337. Plastic deformation of glassy polymers: constitutive equations and macromolecular mechanisms,
G’Sell, C., in H.J. Queen et al. Eds, Strength of metals and alloys, Pergamon Press, 1986, p. 194338. Aboulfaraj, M., G’Sell, C., Mangelinck, D. and McKenna, G.B., J. Non-Cryst. Solids, 1994, 172-174,
p. 61539. Hasan, O.A. and Boyce, M.C., Polymer, 1993, 34, p. 508540. Ender, D.H. and Andrews R.D., J. Appl. Phys., 1965, 34, pp. 3057-306241. Smit, R.J.M., Brekelmans, W.A.M. and Meijer, H.E.H., J. Mech. Phys. Solids, 1999, accepted42. Smit, R.J.M., Brekelmans, W.A.M. and Meijer, H.E.H., Comput. Methods Appl. Mech, Engrg, 1998,
155, p. 18143. Smit, R.J.M., Brekelmans, W.A.M. and Meijer, H.E.H., J. Mater. Sci, 1999, Part III, submitted44. Smit, R.J.M., Brekelmans, W.A.M. and Meijer, H.E.H., J. Mater. Sci, 1999, Part I, submitted45. Smit, R.J.M., Brekelmans, W.A.M. and Meijer, H.E.H., J. Mater. Sci, 1999, Part II, submitted46. Van der Sanden, M.C.M., De Kok, J.J.M. and Meijer, H.E.H., Polymer, 1994, 35, pp. 2995-300447. Smit, R.J.M., PhD thesis TUE, 1998, Eindhoven, The Netherlands, pp.1-10348. Jansen, B.J.P., PhD thesis TUE, 1998, Eindhoven, The Netherlands, pp.1-10449 Jansen, B.J.P., Meijer, H.E.H. and Lemstra, P.J., Polymer, 1999, 40, pp. 2917-292750 Jansen, B.J.P., Meijer, H.E.H. and Lemstra, P.J., Macromolecules, 1999, Part 1, accepted51 Jansen, B.J.P., Rastogi, S., Meijer, H.E.H. and Lemstra, P.J., Macromolecules, 1999, Part II,
submitted52 Jansen, B.J.P., Meijer, H.E.H. and Lemstra, P.J., Macromolecules, 1999, Part III, accepted53 Jansen, B.J.P., Rastogi, S., Meijer, H.E.H. and Lemstra, P.J., Macromolecules, 1999, Part IV,
submitted