Embed Size (px)
Citation preview
A multilayer network model of Covid-19: implicationsin public health policy in Costa Rica
Fabio Sanchez2, +, Juan G. Calvo2, +, Yury E. Garcıa1,3, +, Luis A.Barboza2, +, Paola Vasquez1, +, Gustavo Mery4, +, and Tania Rivas5, +
1Universidad de Costa Rica, Centro de Investigacion en Matematica Pura y Aplicada, San Jose, Costa Rica2Universidad de Costa Rica, Centro de Investigacion en Matematica Pura y Aplicada - Escuela de Matematica,
San Jose, Costa Rica3Department of Public Health Sciences, University of California Davis, CA, USA
4Pan America Health Organization, World Health Organization, San Jose 10102, Costa Rica.5Ministry of Health, San Jose 10102, Costa Rica
*[email protected]+these authors contributed equally to this work
Abstract
Successful partnerships between researchers, experts and public health authoritieshas been critical to navigate the challenges of the Covid-19 pandemic worldwide. InCosta Rica, we constructed a multilayer network model that incorporates a diversecontact structure for each individual (node). The different layers which constitutethe individual’s contact structure include: family, friends, and sporadic interactions.Different scenarios were constructed to forecast and have a better understanding ofthe possible routes of the pandemic in the country, given the information that wasavailable at the time and the different measures implemented by the health authoritiesof the country. Strong collaboration within our diverse team allowed using the modelto tailor advice on contingency measures to health authorities. The model helpeddevelop informed strategies to prepare the public health system in Costa Rica. Thedevelopment, evolution and applications of a multilayer network model of Covid-19 inthe adoption of sanitary measures in Costa Rica has been an example of the potentialof such partnerships.
Introduction
The global health crisis that began with the emergence of the SARS-CoV-2 virus has trig-gered unprecedented collaborations and research activity among the scientific community inan effort to better understand the transmission mechanisms of this novel pathogen, projectthe burden to health care systems, and evaluate the potential effects of the exceptionalinterventions that had to be implemented to slow down the spread of the SARS-CoV-2virus [11, 16, 17]. In this effort, mathematical and statistical models have proven to bevaluable tools in forecasting possible scenarios. These models can provide health author-ities and decision-makers a scientific based tool to provide insight and guidance in theelaboration of public health measures such as: resource allocation, restrictions on human
1
arX
iv:2
109.
0421
8v1
[ph
ysic
s.so
c-ph
] 2
6 A
ug 2
021
mobility, among other measures and interventions [1, 3, 6, 50].Amidst this pandemic, a va-riety of traditional mathematical models have been developed. However, modeling teamshave struggled in the effort to capture the transmission dynamics of Covid-19 in differentparts of the world given the live learning approach of the disease behavior [15,18,42,46]. Alltoo often, public health authorities find themselves partially supporting their decisions onmodels that provide little information, some of which limit themselves to project the basicreproduction number1 or use other rudimentary techniques to provide sometimes unreliableforecasts.
On the other hand, some highly specialized interdisciplinary research teams have de-veloped sophisticated mathematical, statistical, and computational models using publiclyavailable data [7, 12, 37]. Their experiments have limited applicability in the specific con-text of real world decision making. Moreover, these experiments must be tailored specificto the circumstances of each geographic location using each location’s available informa-tion. Modelling efforts have also faced the challenges of rapidly adapting to the constantchanges in social behaviour based on the diverse restrictive measures taken worldwide. Inthis sense, the use of quantitative methods that incorporate a more realistic populationstructure and their associated contact networks provide a more flexible tool to explicitlymodel heterogeneity in host contact patterns. However, these data is rarely made availableto modelers in a timely manner.
Costa Rica, a Central American country, has provided the necessary conditions formodelling teams to work in collaboration with health authorities and develop evidencebased tools to analyze and project possible epidemic scenarios. The country reported itsfirst Covid-19 patient on March 6, 2020 [30]. In the days to come, and as more cases wereconfirmed, public health officials began to implement interventions to promote and facilitatephysical distancing. During the first weeks, the government announced the cancellation ofall massive events, the closing of all schools and universities, borders and other socialgatherings sites, such as movie theaters, beaches and churches, the implementation ofteleworking for the public and private sector, as well as restriction to vehicular circulation.In these early stages of the pandemic, a group of interdisciplinary researchers, experts inmathematical modeling and other areas, and public health officials started gathering inan attempt to use the best available mathematical and statistical tools to inform healthauthorities in preparation for the inevitable surge in cases to come, with all its medical andsocial implications. Our research group started the development of a network model withdifferent contact layers of Covid-19 in Costa Rica, and gained progressive practice in usingit to inform public health authorities.
In the months following March 2020, a reduction in cases resulted in the governmentlifting several containment measures, in an effort to balance public health safety with theimpact on the country’s economy. At the same time, the Costa Rican Social Security Fund(CCSS), the main public health care provider in the country, and other public and privateinstitutions were working to gradually increment hospital capacity. Early in the pandemic,CCSS had at their disposal less than 100 ICU (Intensive Care Unit) beds and was in urgentneed to increase ICU capacity and several other competing health priorities.
In July 2020, the Ministry of Health announced the inability to trace 65% of the positivecases [10]. During that time, health authorities were working diligently to trace positive
1Defined as the number of secondary infections caused by an infectious individual in a mostly susceptiblepopulation.
2
cases, this became increasingly difficult as the number of cases rapidly increased, in partdue to the lifting of preventive measures. The main objective of the government at the timewas to prevent the collapse of the hospital care system. The country established a four-coloralert status for every canton (green, yellow, orange, and red) to be able to modify restric-tions according to local infections [23,32]. Reduction in mobility and closure of businesseswas implemented in the cantons with orange alert status in July 11-19, 2020 (“epidemio-logical fence2” [29].) and in August 10-21, 2020, (dance-hammer intervention [40]).
In this article, we introduce the implementation of a network model (multilayer, tem-poral and stochastic), tailored to study the transmission dynamics of the SARS-CoV-2 inCosta Rica and analyze its role in providing insights to the Costa Rican health authoritiesof probable transmission scenarios and impact of health care services under a diversity ofpublic health interventions.
Materials and methods
Network Model
A network is a mathematical object composed by nodes that, in this case, represent indi-viduals in the population, and edges (links between vertices). In our model, we consider thetotal population of Costa Rica as the nodes of the graph. Two nodes are connected by anedge at a specific day if they have contact. The degree of a node is defined by its number ofconnections (neighbors) and it changes daily. We then try to mimic how contacts of everyindividual in the population change over time.
To differentiate types of contacts in the population, we consider a temporal multilayernetwork; see [39]. Moreover, we consider three layers as depicted in Fig 1. Each layeris randomly generated and it represents a different type of contact between individuals.These layers are: (1) a household network (individuals that live in the same house), (2)a social network (known contacts such as friends and colleagues), and (3) a sporadic net-work (strangers that you may encounter in short periods of time when you visit randomlocations). Networks are both connected by intra-layer links (links in one layer), as well asinter-layer links (links between layers). Layers 1 and 2 are fixed for each simulation andlayer 3 can change for each time step (days), since an individual has no control on sporadicencounters.
Although our network includes the whole population, constructing the complete graph iscomputationally expensive. Hence, only infected individuals and their contacts are trackedon a daily basis and the network is rendered from therein.
Each node has two type of attributes: (1) fixed parameters, such as canton, householdmembers, age-group (children (0-18 years), adults (19-64 years), and elderly people (+65years)), degree and graph connectivity for layer 2, and (2) variable attributes, such as con-nectivity for layer 3, epidemiological state, number of days at current epidemiological state,number of interactions with social contacts per day, use of personal protective measures,and self-care behaviour. The former are defined at the beginning of each simulation, andthe latter can take random values every time step accordingly.
2Epidemiological fence is the name given by the government to the strategy implemented to control thegrowth of cases in cantons with an orange alert status, located mainly in the Greater metropolitan area
3

Housing
Friends
Sporadic contacts
Figure 1: Representation of contact layers in the network. Three different layersare included in the network: household, social, and sporadic contacts.
SARS-CoV-2 transmission model
The classical SEIR type dynamics is incorporated into the multilayer network model to de-scribe the SARS-CoV-2 transmission process. The population is divided according to theepidemiological status. Thus, the first compartment corresponds to susceptible individuals.When susceptible individuals become infected, they moves to a latency stage where even-tually they become infectious (undiagnosed or diagnosed). Individuals could potentiallyrecover, require a hospital bed, move into an intensive care unit (ICU) or die; see Fig 2.
Figure 2: Transmission model. Individual’s epidemiological states for SARS-CoV-2.
A susceptible individual can become infected by computing its probability of infection,that depends on its daily interactions with its infectious contacts (nodes). If the probabilitythat node j infects a susceptible node i at a given day is βij, then the probability of infectionpi for node i is given by
pi = 1−∏j 6=i
(1− βij),
4

where j includes all the indices of nodes that can infect node i that particular day.The value βij may depend on different attributes (such as layer, epidemiological state,
human mobility, use of personal protective measures, and self-care behaviour, time of expo-sure, environment, and other factors). Depending on the interaction, the value of βij can bereduced according to contact type (layer), personal protective measures, human mobility,and sneezing/coughing protocols, etc. In this way, we mimic health measures such as typeof encounter, human mobility, and the use of personal protective measures by setting
pi = 1−∏j 6=i
(1− cjβij)γ (1)
where cj is a reduction percentage that depends on the layer, use of personal protectivemeasures and human mobility in the interaction between nodes i and j, respectively, andγ ∈ (0, 1] is a calibration parameter estimated for each simulation. We consider a windowof seven days where we calibrate the value of γ by using a standard bisection method suchthat the square error between observed and predicted cases is minimized. The value of γis then fixed for all the simulations.
Data
We describe each set of data that we have used in our analysis as follows:
• Contact tracing. The initial conditions of the model are based on the contact tracingprovided by the Ministry of Health [33]. This data allowed us to create a morerealistic contact network for the early stages of the pandemic. However, starting inJuly 2020, the number of cases increased and contact tracing became a problem forpublic health authorities. From July 2020, as community transmission was declared,we only incorporate the number of daily cases per canton provided by the Ministryof Health [33].
• Household layer. The number of households per canton and the average number ofpeople per household is taken from the “National Household Survey” [22], made bythe National Institute of Statistics and Census (INEC) in 2018. In our model, thenumber of inhabitants of each household is determined by a Poisson distribution witha mean equal to the average number of inhabitants per household per canton. Totalconnectivity is assumed in each household with no reduction in the probability ofinfection (cj = 1).
• Mobility matrix. Possible connections between nodes in different cantons are selectedaccording to a connectivity matrix. The information this matrix provides is the placewhere individuals reside and work, according to the “National Household Survey” [21].Connections (edges) between two different cantons may exist if there is mobilitybetween them. The degree of a node in layers 2 and 3 is calculated using an uniformdistribution on a given interval [35]; see values in Table 1. We assume a fixed set ofsocial contacts in layer 2, but daily interactions are limited by choosing a subset ofits edges.
• Epidemiological parameters. Parameters related to hospitalization and ICUs wereprovided by the Costa Rican Social Security Fund (CCSS), and parameters relatedto the transmission are from the literature (Table S1 Table).
5

• Proportion of undetected individuals. Asymptomatic and pre-symptomatic individu-als play an important role in the spread of the virus [4,26,34]. But, the proportion ofinfected people who remain asymptomatic, as well as the degree of infectiousness werenot clear during the period when the first scenarios were conducted [14,19,24,51,52].The scientific literature reported different percentages of asymptomatic people world-wide [2, 48]. Based on this information and the testing capacity in the country, weestablished the percentage of undetected persons at 25%, which accounts for bothasymptomatic and those individuals, who, even with symptoms, were not capturedby the health system. In mid-2020, Costa Rica was conducting, in average, 3.3 testsper 10,000 inhabitants with a positivity rate of 25% [20, 30]. To date, the WorldHealth Organization (WHO) recommendation was positivity rates to be at 5% forreopening [47].
• Protective measures. Previous studies [5, 8, 27, 36, 45] have shown that incorporat-ing appropriate personal protective measures and restricting human mobility reducethe probability of infection. If a particular interaction between two nodes involvesusing personal protective measures, then we reduce the probability βij accordingly;see Table 1. We assume that the percentage of people who effectively used per-sonal protective measures was 50% (The use of a mask was recommended, but notmandatory). We also include a variable parameter that accounts for the percentageof people circulating and its impact on human interaction. It is affected by publichealth restrictions and the consequential change in social behavior. To simulate thelockdown or lifted measures, we reduce or increase the value of this parameter, respec-tively. Furthermore, we decrease the number of connections (edges) between nodesin different cantons to simulate the mobility restriction between specific locations.
Table 1: (Left) Network parameters. Degree node distribution for layers 2 and 3; GMAstands for Greater Metropolitan Area. (Right) Network infection parameters; see Eq (1).PM and SD stand for protective measures and human mobility, respectively.
IntervalContacts in sporadic network [0, 20]Contacts in social network [5, 30]Social contacts per day, GMA [5, 25]Social contacts per day, off GMA [5, 15]
cjSporadic contacts 0.5000
PM 0.1476SD 0.1238
PM and SD 0.0182
Scenarios performed in July 2020
We proposed three scenarios to evaluate and observe the impact of interventions on thereduction of cases and hospital admissions. In all the scenarios we assumed that (i) 50% ofthe population used protective measures and the virus transmission probability is reducedaccordingly, and (ii) the number of contacts is sampled from an uniform distribution; seeTable 1. From July 11-19, 2020, depending on canton’s alert status, individuals may onlycome in contact with people from the same alert status.
Each scenario was designed and implemented on different dates in response to the re-quests that arose from the health authorities during different time periods. The differences
6

between them are related to the assumptions in the reopening after the interventions fromJuly 11 to 19, 2020, and the percentage of people adhering to these restrictions. Below, wedescribe the assumptions and parameters values.
1. Scenario 1: July 12, 2020.
– Restrictions based on canton alert status are removed from the simulation afterJuly 19, 2020.
– It is assumed that the 70% of the country maintained human mobility duringthat period.
2. Scenario 2: July 16, 2020.
– Restrictions based on canton alert status are maintained until August 2, 2020only in cantons that remain in orange alert status.
– It is assumed that the 70% of the country maintained human mobility duringthat period.
3. Scenario 3: Jul 22, 2020.
– Restrictions based on canton alert status are removed from the simulation afterJuly 19, 2020.
– Percentage of individuals that maintained human mobility changed gradually inplaces with an orange alert status: 70% from July 11 to 19, 2020, 60% fromJuly 20 to 31, 2020, and 50% after July 31, 2020.In cantons with a yellow alertstatus, 50% of the population maintained human mobility.
Scenarios performed in August 2020
In August, 2020, public health authorities set up a policy of closing and opening periodscalled hammer and dance [40]. Details about the interventions are on the official websiteof the Ministry of Health of Costa Rica [31].
We simulate a set of scenarios considering several closing periods of 12 days and openingsperiods of 9 days for two and a half months; see Fig 3. Different percentages of individualswho contributed to new infections (human mobility parameter) were considered in thecantons with orange and yellow alert status and we restricted the interaction of people tocontacts within the cantons with the same alert.
Scenarios are summarized in Table 2.
AUGUST / 08
S M T W T F S
1
2 4 5 6 7 83
9 11 12 13 14 1510
16 18 19 20 21 2217
23 25 26 27 28 2924
30 31
SEPTEMBER / 09
S M T W T F S
1 2 3 4 5
6 8 9 10 11 127
13 15 16 17 18 1914
20 22 23 24 25 2621
27 29 3028
OCTOBER / 10
S M T W T F S
1 2 3
4 6 7 8 9 105
11 13 14 15 16 1712
18 20 21 22 23 2419
25 27 28 29 30 3126
Figure 3: Hammer and Dance Period. Opening (light gray) and closing (dark gray)periods.
7

Table 2: Scenario assumptions performed in August, 2020.
Cantons Scenario 150%-70%
Scenario 250%-60%
Scenario 350%-65%
Scenario 445%-55%
Scenario 330%-40%
YellowDance 50% SD 45% SD 30% SDHammer 50% SD 45% SD 30% SD
OrangeDance 9 days open
50% SD9 days open
45% SD9 days open
30% SDHammer 12 days
closed70% SD and
MR
12 daysclosed
60% SD andMR
12 daysclosed
65% SD andMR
12 daysclosed
55% SD andMR
12 daysclosed
40% SD andMR
In the hammer period, restrictions on vehicular traffic and on the opening of commercewere applied only in the cantons with an orange alert status, and every week the alertstatus could have changed. As an attempt to predict which cantons would change status,we introduced an indicator given by:
Cantonal Hazard Rate [CHR] =
new cases in the last 3 weeks in a canton
canton populationnew cases in the last 3 weeks in the country
country population
If CHR > 1 in a canton with a yellow alert status, it changes to an orange alert. On theother hand, all cantons with an orange alert status do not change status. Finally, in thehammer phase, connections between nodes are only allowed between nodes in places withthe same alert status (yellow or orange).
Results
Scenarios performed in July, 2020
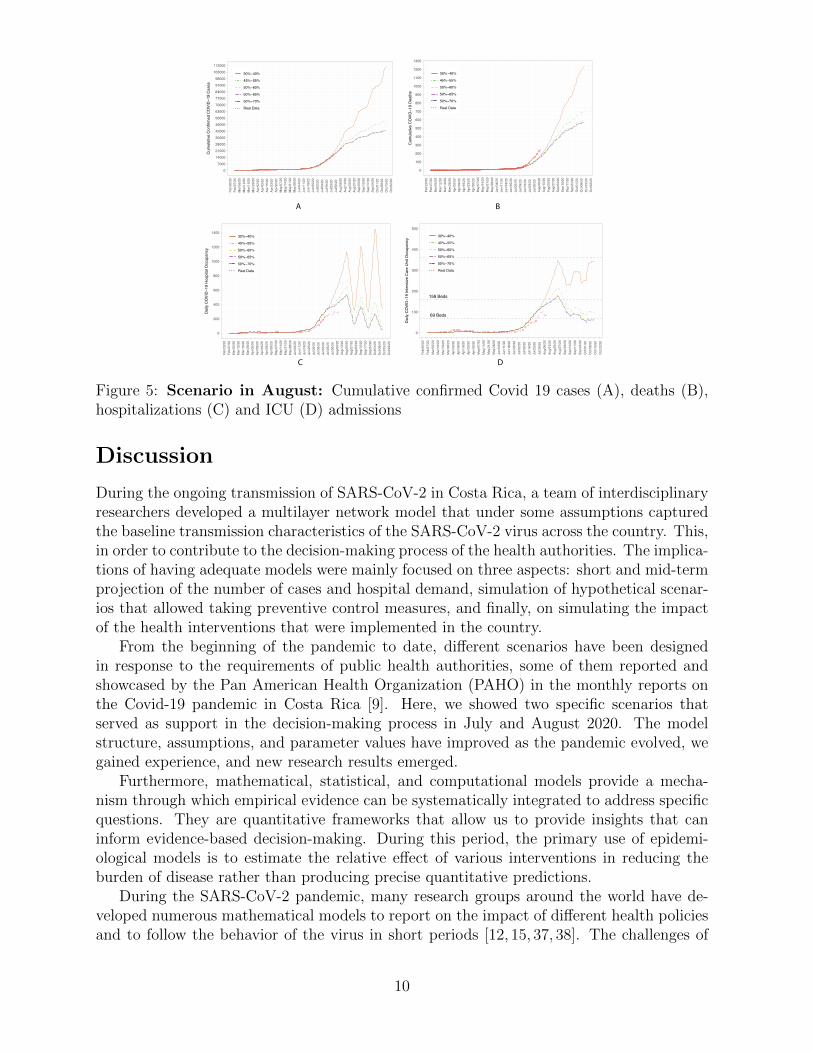
Results showed a deceleration in the number of confirmed cases and hospitalizations wheninterventions are applied for a week (July 12, 2020 scenario). However, infections andhospitalizations can increase at an accelerated rate if human mobility is similar to what itwas before restrictive measures were taken. This rapid growth can potentially be controlledif the reopening occurs gradually, as shown in the July 22, 2020 scenario. On the other hand,if restrictions are maintained for three weeks in cantons with an orange alert status (July16, 2020 scenario), the model showed a significant reduction in infections, hospitalizations,and ICU admissions; see Fig 4. These three scenarios showed that restricting the humanmobility for a week is not enough to have a significant impact on the number of confirmedcases and hospitalizations.
Scenarios performed in August, 2020
Results showed an abrupt decrease in hospitalizations that may not be entirely realistic.This behavior could be due to the assumptions related to the connectivity of people, in themodel we assumed that each node only interacted with contacts in cantons with the same
8

A B
C D
� � � � � � � � � � � � � � � � � � � � � � � � � � � � � � � � � � � � � � � � � � � � � � � � � � �� � � � � � � � � � � � � � � � � � � � � � � � � �
� � � � � � � � � � � � � � � � � � � � � � � � � � � � � � � � � � � � � � � � � � �� � � � � � � �
� �� � �
�� �
�
��
�
�
�
���
0
20
40
60
80
100
120
140
160
180
200
Feb/
27/2
0
Mar
/05/
20
Mar
/12/
20
Mar
/19/
20
Mar
/26/
20
Apr/0
2/20
Apr/0
9/20
Apr/1
6/20
Apr/2
3/20
Apr/3
0/20
May
/07/
20
May
/14/
20
May
/21/
20
May
/28/
20
Jun/
04/2
0
Jun/
11/2
0
Jun/
18/2
0
Jun/
25/2
0
Jul/0
2/20
Jul/0
9/20
Jul/1
6/20
Jul/2
3/20
Jul/3
0/20
Aug/
06/2
0
Aug/
13/2
0
Aug/
20/2
0
Cum
ulat
ive C
OVI
D−1
9 D
eath
s
July−12
July−16
July−22
Real Data
� � � � � � � � � � � � � � � � � � � � � � � � � � � � � � � � � � � � � � � � � � � � � � � � � � � � � � � � � � � � � � � � � � � � � � � � � � � � � � � � � � � � � � � � � � � � � � � � � � � � � � � � � � � � � � � � � � � � � � � � � � � � � � � � � � �� � � � � �
�� �
�� � �
�
0
7000
14000
21000
28000
35000
42000
49000
56000
63000
70000
77000
84000
91000
98000
105000
Feb/
28/2
0
Mar
/07/
20
Mar
/15/
20
Mar
/23/
20
Mar
/31/
20
Apr/0
8/20
Apr/1
6/20
Apr/2
4/20
May
/02/
20
May
/10/
20
May
/18/
20
May
/26/
20
Jun/
03/2
0
Jun/
11/2
0
Jun/
19/2
0
Jun/
27/2
0
Jul/0
5/20
Jul/1
3/20
Jul/2
1/20
Jul/2
9/20
Aug/
06/2
0
Aug/
14/2
0
Aug/
22/2
0
Cum
ulat
ive C
onfir
med
CO
VID
−19
Cas
es
July−12
July−16
July−22
Real Data
� � � � � � � � � � � � � � �� � � � � � � � � � � � � � � � � �
�� � � � � �
� � � � � �� � � � �
��
� � � � � � � � ��
� � � � � � � � � � � �� � � � �
� �� � � � � � � � �
� � � � � � � � � � � � � � � � �� � �
� � � � �� � � �
� � � � �
� � � �� �
��
�
��
�
�
��
��
�� �
69 Beds
159 Beds
359 Beds
0
50
100
150
200
250
300
350
400
450
Feb/
27/2
0M
ar/0
5/20
Mar
/12/
20M
ar/1
9/20
Mar
/26/
20Ap
r/02/
20Ap
r/09/
20Ap
r/16/
20Ap
r/23/
20Ap
r/30/
20M
ay/0
7/20
May
/14/
20M
ay/2
1/20
May
/28/
20Ju
n/04
/20
Jun/
11/2
0Ju
n/18
/20
Jun/
25/2
0Ju
l/02/
20Ju
l/09/
20Ju
l/16/
20Ju
l/23/
20Ju
l/30/
20Au
g/06
/20
Aug/
13/2
0Au
g/20
/20
Dai
ly C
OVI
D−1
9 In
tens
ive C
are
Uni
t Occ
upan
cy
July−12
July−16
July−22
Real Data
� � � � � � � � � � � � � � � � � � � � � � � � � � � �� � � � � �
� � � � � � � � � � � � � � � � � � � � � � � � � � � � � � � � � � � � � � � � � � � � � � � � � � � � � � � � � � � � � � � � � � � � � � � � � � � � � � � � � � � �� � � � �
� �� � �
�
��
�� �
�
��
�
� ��
�
��
�
0
200
400
600
800
1000
1200
1400
1600
1800
2000Fe
b/27
/20
Mar
/05/
20
Mar
/12/
20
Mar
/19/
20
Mar
/26/
20
Apr/0
2/20
Apr/0
9/20
Apr/1
6/20
Apr/2
3/20
Apr/3
0/20
May
/07/
20
May
/14/
20
May
/21/
20
May
/28/
20
Jun/
04/2
0
Jun/
11/2
0
Jun/
18/2
0
Jun/
25/2
0
Jul/0
2/20
Jul/0
9/20
Jul/1
6/20
Jul/2
3/20
Jul/3
0/20
Aug/
06/2
0
Aug/
13/2
0
Aug/
20/2
0
Dai
ly C
OVI
D−1
9 H
ospi
tal O
ccup
ancy
July−12
July−16
July−22
Real Data
Figure 4: Scenario in July: Cumulative confirmed Covid 19 cases (A), deaths (B),hospitalizations (C) and ICU (D) admissions
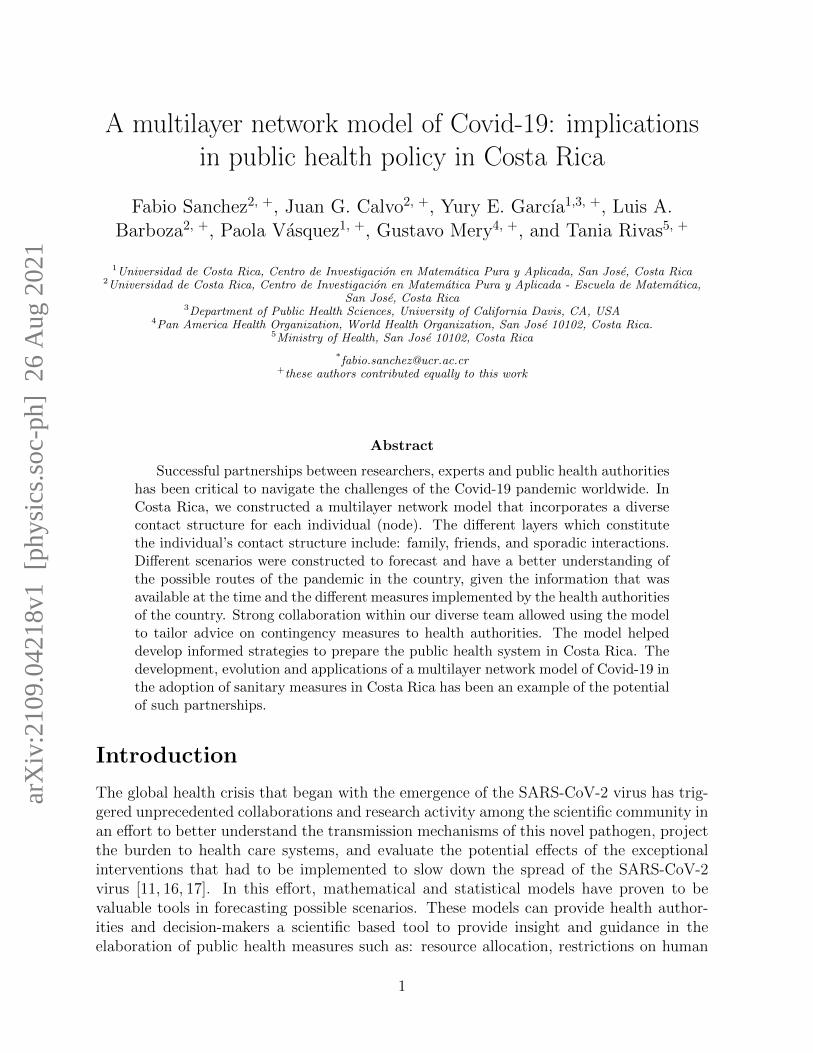
alert. However, the scenarios display that more than 50% of the population need to stayhome or maintain human mobility to flatten the growth of cases, hospitalizations, and ICUadmissions. Furthermore, an intervention with consecutive closure periods of twelve daysand nine openings follow a progressive decrease in hospitalizations and ICUs; see Fig 5.
The different assumptions related to the percentages of human mobility allow decision-makers to anticipate how restrictive or flexible the sanitary measures should be to controlthe spread of the virus and how long they have to advance in the installation of hospitalbeds and equipment.
9
��������������������������������������������������������������������������������������������������������������������������
��������������
�����
������
������
����������
�
0
100
200
300
400
500
600
700
800
900
1000
1100
1200
1300
Feb/
20/2
0Fe
b/27
/20
Mar
/05/
20M
ar/1
2/20
Mar
/19/
20M
ar/2
6/20
Apr/0
2/20
Apr/0
9/20
Apr/1
6/20
Apr/2
3/20
Apr/3
0/20
May
/07/
20M
ay/1
4/20
May
/21/
20M
ay/2
8/20
Jun/
04/2
0Ju
n/11
/20
Jun/
18/2
0Ju
n/25
/20
Jul/0
2/20
Jul/0
9/20
Jul/1
6/20
Jul/2
3/20
Jul/3
0/20
Aug/
06/2
0Au
g/13
/20
Aug/
20/2
0Au
g/27
/20
Sep/
03/2
0Se
p/10
/20
Sep/
17/2
0Se
p/24
/20
Oct
/01/
20O
ct/0
8/20
Oct
/15/
20O
ct/2
2/20
Cum
ulat
ive C
OVI
D−1
9 D
eath
s
30%−40%
45%−55%
50%−60%
50%−65%
50%−70%
Real Data
� � � � � � � � � � � � � � � � � � � � � � � � � � � � � � � � � � � � � � � � � � � � � � � � � � � � � � � � � � � � � � � � � � � � � � � � � � � � � � � � � � � � � � � � � � � � � � � � � � � � � � � � � � � � � � � � � � � � � � � � � � � � � � � � � � �� � � �
��
��
��
�� �
��
��
��
��
�� �
��
��
�
��
��
0
7000
14000
21000
28000
35000
42000
49000
56000
63000
70000
77000
84000
91000
98000
105000
112000
Feb/
20/2
0Fe
b/27
/20
Mar
/05/
20M
ar/1
2/20
Mar
/19/
20M
ar/2
6/20
Apr/0
2/20
Apr/0
9/20
Apr/1
6/20
Apr/2
3/20
Apr/3
0/20
May
/07/
20M
ay/1
4/20
May
/21/
20M
ay/2
8/20
Jun/
04/2
0Ju
n/11
/20
Jun/
18/2
0Ju
n/25
/20
Jul/0
2/20
Jul/0
9/20
Jul/1
6/20
Jul/2
3/20
Jul/3
0/20
Aug/
06/2
0Au
g/13
/20
Aug/
20/2
0Au
g/27
/20
Sep/
03/2
0Se
p/10
/20
Sep/
17/2
0Se
p/24
/20
Oct
/01/
20O
ct/0
8/20
Oct
/15/
20O
ct/2
2/20
Cum
ulat
ive C
onfir
med
CO
VID
−19
Cas
es
30%−40%
45%−55%
50%−60%
50%−65%
50%−70%
Real Data
� � � � � � � � � � � � � � �� � � � � � � � � � � � � � � � � �
�� � � � � �
� � � � � �� � � � �
��
� � � � � � � � ��
� � � � � � � � � � � �� � � � �
� �� � � � � � � � �
� � � � � � � � � � � � � � � � �� � �
� � � � �� � � �
� � � � �
� � � �� �
��
�
��
�
�
��
��
�� � � �
�
� ��
�
�
�
�
� � ��
�
�
�
��69 Beds
159 Beds
359 Beds
0
100
200
300
400
500
Feb/
20/2
0Fe
b/27
/20
Mar
/05/
20M
ar/1
2/20
Mar
/19/
20M
ar/2
6/20
Apr/0
2/20
Apr/0
9/20
Apr/1
6/20
Apr/2
3/20
Apr/3
0/20
May
/07/
20M
ay/1
4/20
May
/21/
20M
ay/2
8/20
Jun/
04/2
0Ju
n/11
/20
Jun/
18/2
0Ju
n/25
/20
Jul/0
2/20
Jul/0
9/20
Jul/1
6/20
Jul/2
3/20
Jul/3
0/20
Aug/
06/2
0Au
g/13
/20
Aug/
20/2
0Au
g/27
/20
Sep/
03/2
0Se
p/10
/20
Sep/
17/2
0Se
p/24
/20
Oct
/01/
20O
ct/0
8/20
Oct
/15/
20O
ct/2
2/20
Dai
ly C
OVI
D−1
9 In
tens
ive C
are
Uni
t Occ
upan
cy
30%−40%
45%−55%
50%−60%
50%−65%
50%−70%
Real Data
� � � � � � � � � � � � � � � � � � � � � � � � � � � �� � � � � � � � � � � � � � � � � � � � � � � � � � � � � � � � � � � � � � � � � � � � � � � � � � � � �
� � � � � � � � � � � � � � � � � � � � � � � � � � � � � � � � � � � � �� � � � �
� �� � �
�
�� �
� � �
�
�
�
� �
�
�
�
�
�
� ��
�
� �
�
� �
�
�
� �� � � �
�
�
0
200
400
600
800
1000
1200
1400
Feb/
20/2
0Fe
b/27
/20
Mar
/05/
20M
ar/1
2/20
Mar
/19/
20M
ar/2
6/20
Apr/0
2/20
Apr/0
9/20
Apr/1
6/20
Apr/2
3/20
Apr/3
0/20
May
/07/
20M
ay/1
4/20
May
/21/
20M
ay/2
8/20
Jun/
04/2
0Ju
n/11
/20
Jun/
18/2
0Ju
n/25
/20
Jul/0
2/20
Jul/0
9/20
Jul/1
6/20
Jul/2
3/20
Jul/3
0/20
Aug/
06/2
0Au
g/13
/20
Aug/
20/2
0Au
g/27
/20
Sep/
03/2
0Se
p/10
/20
Sep/
17/2
0Se
p/24
/20
Oct
/01/
20O
ct/0
8/20
Oct
/15/
20O
ct/2
2/20
Dai
ly C
OVI
D−1
9 H
ospi
tal O
ccup
ancy
30%−40%
45%−55%
50%−60%
50%−65%
50%−70%
Real Data
A B
C D
Figure 5: Scenario in August: Cumulative confirmed Covid 19 cases (A), deaths (B),hospitalizations (C) and ICU (D) admissions
Discussion
During the ongoing transmission of SARS-CoV-2 in Costa Rica, a team of interdisciplinaryresearchers developed a multilayer network model that under some assumptions capturedthe baseline transmission characteristics of the SARS-CoV-2 virus across the country. This,in order to contribute to the decision-making process of the health authorities. The implica-tions of having adequate models were mainly focused on three aspects: short and mid-termprojection of the number of cases and hospital demand, simulation of hypothetical scenar-ios that allowed taking preventive control measures, and finally, on simulating the impactof the health interventions that were implemented in the country.
From the beginning of the pandemic to date, different scenarios have been designedin response to the requirements of public health authorities, some of them reported andshowcased by the Pan American Health Organization (PAHO) in the monthly reports onthe Covid-19 pandemic in Costa Rica [9]. Here, we showed two specific scenarios thatserved as support in the decision-making process in July and August 2020. The modelstructure, assumptions, and parameter values have improved as the pandemic evolved, wegained experience, and new research results emerged.
Furthermore, mathematical, statistical, and computational models provide a mecha-nism through which empirical evidence can be systematically integrated to address specificquestions. They are quantitative frameworks that allow us to provide insights that caninform evidence-based decision-making. During this period, the primary use of epidemi-ological models is to estimate the relative effect of various interventions in reducing theburden of disease rather than producing precise quantitative predictions.
During the SARS-CoV-2 pandemic, many research groups around the world have de-veloped numerous mathematical models to report on the impact of different health policiesand to follow the behavior of the virus in short periods [12, 15, 37, 38]. The challenges of
10

real-time pandemic research and the importance of having a true interdisciplinary researchteam were highlighted by this ongoing pandemic. Effective communication between re-search teams and public health officials is key in the development of mathematical modelsthat can provide helpful insight in the creating of optimal and effective policies. One ofthe many challenges that surfaced from this pandemics is the need to foster exemplary col-laboration between academics, public health entities, and government officials to developsuccessful tools for disease prevention and control.
Modeling and predicting the behavior of a novel virus such as SARS-CoV-2 in real-timeprovides an immense challenge. Besides counting with adequate, robust models, sophisti-cated enough to capture the different dynamics and variety of factors interacting simulta-neously in a pandemic of the scale of Covid-19. Having available data and computationalcapacity are other key elements that need to be present for mathematical models to workand effectively be used in public health decision making. Furthermore, what we know aboutthe virus is still very limited. After more than a year of this pandemic, the dynamics ofvirus transmission is still a subject of research. Although the efforts of researchers aroundthe world have contributed to understanding the transmission dynamics of SARS-CoV-2,many open questions remain and the assumptions have to be constantly updated.
11

Supporting information
S1 Table. Parameters. All these values have been updated throughout the pandemicas new information comes up. The transmission rate was estimated using an ApproximateBayesian Computation [41,43] method at the beginning of the pandemic.
Parameter description Value Ref.Percentage of diagnosed people requiring hospitalization 0-18 years: 2.2%
19-64 years: 4.7%older than 65: 37.1%
CCSS
Percentage of hospitalized people requiring ICU Average: 28%0-18 years: 14%19-64 years: 27%older than 65: 30%
CCSS
Average time a person stays in ICU Average time: 16 days0-18 years: 4.3 days19-64 years: 15.5 daysolder than 65: 15.1days
CCSS
Average time a person stays in ward Average time: 14.4days0-18 years: 9.4 days19-64 years: 14.1 daysolder than 65: 15.4days
CCSS
Mortality in ward Average: 12%0-18 years: 2%19-64 years: 4%older than 65: 28%
CCSS
Mortality in ICU Average: 31%0-18 years: 0%19-64 years: 23%older than 65: 44%
CCSS
Average time from onset of symptoms to hospitalization 7 days [28]Average time from symptoms onset to ICU 11 days [13,49]Recovery time 14 days [44]Percentage of diagnosed people 75% [2,48]Percentage of diagnosed people who do not isolate themselves 10% [51]Incubation period 6 days [25,49]Transmission rate βij 0.21 EstimatedPercentage of undiagnosed people requiring hospitalization 1% EstimatedMortality out of hospitalization 0.008% Estimated
12
Acknowledgments
The authors would like to thank the Research Center in Pure and Applied Mathematicsand the School of Mathematics at Universidad de Costa Rica for their support during thepreparation of this manuscript. They also thank the Ministry of Health and CCSS forproviding data and valuable information for this study.
References
[1] A. Adiga, D. Dubhashi, B. Lewis, M. Marathe, S. Venkatramanan, and A. Vullikanti.Mathematical models for covid-19 pandemic: a comparative analysis. Journal of theIndian Institute of Science, pages 1–15, 2020.
[2] R. Anderson, C. Donnelly, D. Hollingsworth, M. Keeling, C. Vegvari, R. Baggaley, andR. Maddren. Reproduction number (r) and growth rate (r) of the covid-19 epidemicin the uk: methods of estimation, data sources, causes of heterogeneity, and use as aguide in policy formulation. The Royal Society, 2020, 2020.
[3] J. Arino and S. Portet. A simple model for covid-19. Infectious Disease Modelling,5:309–315, 2020.
[4] M. M. Arons, K. M. Hatfield, S. C. Reddy, A. Kimball, A. James, J. R. Jacobs,J. Taylor, K. Spicer, A. C. Bardossy, L. P. Oakley, et al. Presymptomatic sars-cov-2 infections and transmission in a skilled nursing facility. New England journal ofmedicine, 382(22):2081–2090, 2020.
[5] L. A. Barboza, P. Vasquez, G. Mery, F. Sanchez, Y. E. Garcıa, J. G. Calvo, T. Rivas,M. D. Perez, and D. Salas. The role of mobility and sanitary measures on the delay ofcommunity transmission of covid-19 in costa rica. Epidemiologia, 2(3):294–304, 2021.
[6] R. K. Borchering, C. Viboud, E. Howerton, C. P. Smith, S. Truelove, M. C. Runge,N. G. Reich, L. Contamin, J. Levander, J. Salerno, et al. Modeling of future covid-19 cases, hospitalizations, and deaths, by vaccination rates and nonpharmaceuticalintervention scenarios—united states, april–september 2021. Morbidity and MortalityWeekly Report, 70(19):719, 2021.
[7] S. Chang, E. Pierson, P. W. Koh, J. Gerardin, B. Redbird, D. Grusky, and J. Leskovec.Mobility network models of covid-19 explain inequities and inform reopening. Nature,589(7840):82–87, 2021.
[8] D. K. Chu, E. A. Akl, S. Duda, K. Solo, S. Yaacoub, H. J. Schunemann, A. El-harakeh, A. Bognanni, T. Lotfi, M. Loeb, et al. Physical distancing, face masks, andeye protection to prevent person-to-person transmission of sars-cov-2 and covid-19: asystematic review and meta-analysis. The lancet, 395(10242):1973–1987, 2020.
[9] O. P. de la Salud UOPS/OMS). Costa rica - informe covid-19 —ops/oms — organizacion panamericana de la salud. https://www.paho.org/es/
costa-rica-informe-covid-19. (Accessed on 08/26/2021).
13
[10] C. C. de Seguro Social et al. Lineamientos nacionales para la vigilancia de la enfer-medad covid-19, 2020.
[11] G. T. Edwin, D. M. Klug, and M. H. Todd. Open science approaches to covid-19.F1000Research, 9, 2020.
[12] C. for Disease Control and Prevention. Covid-19 forecasts: Deaths —cdc. https://www.cdc.gov/coronavirus/2019-ncov/science/forecasting/
forecasting-us.html. (Accessed on 08/26/2021).
[13] C. for Diseases Control and Prevention. Covid-19 pandemic planning scenarios —cdc. https://www.cdc.gov/coronavirus/2019-ncov/hcp/planning-scenarios.
html#table-2. (Accessed on 08/26/2021).
[14] C. for Diseases Control and Prevention. Management of patients with con-firmed 2019-ncov — cdc. https://www.cdc.gov/coronavirus/2019-ncov/
hcp/clinical-guidance-management-patients.html#Sepsis. (Accessed on08/26/2021).
[15] C. . forecast hub. The covid-19 forecast hub community. https://
covid19forecasthub.org/community/. (Accessed on 08/26/2021).
[16] M. Haghani and M. C. Bliemer. Covid-19 pandemic and the unprecedented mobilisa-tion of scholarly efforts prompted by a health crisis: Scientometric comparisons acrosssars, mers and 2019-ncov literature. Scientometrics, 125(3):2695–2726, 2020.
[17] M. Haghani, M. C. Bliemer, F. Goerlandt, and J. Li. The scientific literature oncoronaviruses, covid-19 and its associated safety-related research dimensions: A scien-tometric analysis and scoping review. Safety science, 129:104806, 2020.
[18] P. Harjule, V. Tiwari, and A. Kumar. Mathematical models to predict covid-19 out-break: An interim review. Journal of Interdisciplinary Mathematics, 24(2):259–284,2021.
[19] X. He, E. H. Lau, P. Wu, X. Deng, J. Wang, X. Hao, Y. C. Lau, J. Y. Wong, Y. Guan,X. Tan, et al. Temporal dynamics in viral shedding and transmissibility of covid-19.Nature medicine, 26(5):672–675, 2020.
[20] O. W. in Data. Coronavirus pandemic (covid-19) - statistics and research. https:
//ourworldindata.org/coronavirus. (Accessed on 08/26/2021).
[21] INEC. Redatam::celade, eclac - united nations. http://sistemas.inec.cr:
8080/bininecmm/RpWebEngine.exe/Portal?BASE=2011&lang=esp. (Accessed on05/20/2020).
[22] INEC. Encuesta nacional de hogares — instituto nacional de estadistica y censos.https://www.inec.cr/encuestas/encuesta-nacional-de-hogares, 2018. (Ac-cessed on 08/26/2021).
14
[23] C. J. ¿como se determinan los niveles de alerta en cantones con casos decoronavirus? — sinart 2020. https://costaricamedios.cr/2020/07/28/
como-se-determinan-los-niveles-de-alerta-en-cantones-con-casos-de-coronavirus/.(Accessed on 08/26/2021).
[24] A. J. Kucharski, P. Klepac, A. J. Conlan, S. M. Kissler, M. L. Tang, H. Fry, J. R.Gog, W. J. Edmunds, J. C. Emery, G. Medley, et al. Effectiveness of isolation, testing,contact tracing, and physical distancing on reducing transmission of sars-cov-2 indifferent settings: a mathematical modelling study. The Lancet Infectious Diseases,20(10):1151–1160, 2020.
[25] S. A. Lauer, K. H. Grantz, Q. Bi, F. K. Jones, Q. Zheng, H. R. Meredith, A. S.Azman, N. G. Reich, and J. Lessler. The incubation period of coronavirus disease2019 (covid-19) from publicly reported confirmed cases: estimation and application.Annals of internal medicine, 172(9):577–582, 2020.
[26] R. Li, S. Pei, B. Chen, Y. Song, T. Zhang, W. Yang, and J. Shaman. Substantialundocumented infection facilitates the rapid dissemination of novel coronavirus (sars-cov-2). Science, 368(6490):489–493, 2020.
[27] T. Li, Y. Liu, M. Li, X. Qian, and S. Y. Dai. Mask or no mask for covid-19: A publichealth and market study. PloS one, 15(8):e0237691, 2020.
[28] Z. Liu, P. Magal, O. Seydi, and G. Webb. Predicting the cumulative number of casesfor the covid-19 epidemic in china from early data. arXiv preprint arXiv:2002.12298,2020.
[29] C. R. Ministerio de Salud. Autoridades instruyen cerco epidemiologico en todala gam. https://www.ministeriodesalud.go.cr/index.php/centro-de-prensa/
noticias/741-noticias-2020/1788-autoridades-instruyen-cerco. (Accessedon 08/26/2021).
[30] C. R. Ministerio de Salud. Casos confirmados por covid-19 en costa rica. https:
//www.ministeriodesalud.go.cr/index.php/centro-de-prensa/noticias/
741-noticias-2020/1555-caso-confirmado-por-covid-19-en-costa-rica%7D.(Accessed on 08/26/2021).
[31] C. R. Ministerio de Salud. Gobierno presenta plan de medidaspara todo el mes de agosto. https://www.ministeriodesalud.
go.cr/index.php/centro-de-prensa/noticias/741-noticias-2020/
1822-gobierno-presenta-plan-de-medidas-para-todo-el-mes-de-agosto#:
~:text=Gobierno%20presenta%20plan%20de%20medidas%20para%20todo%20el%
20mes%20de%20agosto&text=Periodo%20se%20dividir%C3%A1%20en%20dos,los%
20cantones%20en%20alerta%20naranja. (Accessed on 08/26/2021).
[32] C. R. Ministerio de Salud. Grupo interinstitucional real-iza analisis cualitativo y cuantitativo para determinar aler-tas de riesgo por covid-19. https://www.ministeriodesalud.
go.cr/index.php/centro-de-prensa/noticias/741-noticias-2020/
15
1820-grupo-interinstitucional-realiza-analisis-cualitativo-y-cuantitativo-para-determinar-alertas-de-riesgo-por-covid-19.(Accessed on 08/26/2021).
[33] C. R. Ministerio de Salud. Situacion nacional covid-19; 2020. http://geovision.
uned.ac.cr/oges/. (Accessed on 08/26/2021).
[34] S. M. Moghadas, M. C. Fitzpatrick, P. Sah, A. Pandey, A. Shoukat, B. H. Singer,and A. P. Galvani. The implications of silent transmission for the control of covid-19outbreaks. Proceedings of the National Academy of Sciences, 117(30):17513–17515,2020.
[35] J. Mossong, N. Hens, M. Jit, P. Beutels, K. Auranen, R. Mikolajczyk, M. Massari,S. Salmaso, G. S. Tomba, J. Wallinga, et al. Social contacts and mixing patternsrelevant to the spread of infectious diseases. PLoS medicine, 5(3):e74, 2008.
[36] C. N. Ngonghala, E. Iboi, S. Eikenberry, M. Scotch, C. R. MacIntyre, M. H. Bonds, andA. B. Gumel. Mathematical assessment of the impact of non-pharmaceutical interven-tions on curtailing the 2019 novel coronavirus. Mathematical biosciences, 325:108364,2020.
[37] L. S. of Hygiene & Tropical Medicine. Covid-19 — research in action — lshtm.https://www.lshtm.ac.uk/research/research-action/covid-19. (Accessed on08/26/2021).
[38] R. Padmanabhan, H. S. Abed, N. Meskin, T. Khattab, M. Shraim, and M. A. Al-Hitmi. A review of mathematical model-based scenario analysis and interventions forcovid-19. Computer Methods and Programs in Biomedicine, page 106301, 2021.
[39] M. A. Porter. Nonlinearity+ networks: A 2020 vision. In Emerging frontiers innonlinear science, pages 131–159. Springer, 2020.
[40] T. Pueyo. Coronavirus: the hammer and the dance. Medium. com, 2020.
[41] F. Sanchez, L. Barboza, and P. Vasquez. Parameter estimates of the 2016-2017 zikaoutbreak in costa rica: an approximate bayesian computation (abc) approach. Math-ematical Biosciences and Engineering, 16(4), 2019.
[42] S. Shankar, S. S. Mohakuda, A. Kumar, P. Nazneen, A. K. Yadav, K. Chatterjee,and K. Chatterjee. Systematic review of predictive mathematical models of covid-19epidemic. medical journal armed forces india, 77:S385–S392, 2021.
[43] S. A. Sisson, Y. Fan, and M. Beaumont. Handbook of approximate Bayesian compu-tation. CRC Press, 2018.
[44] S. TH. Coronavirus is most contagious before, during first week ofsymptoms — science news. https://www.sciencenews.org/article/
coronavirus-most-contagious-before-during-first-week-symptoms. (Ac-cessed on 08/26/2021).
[45] M. Van der Sande, P. Teunis, and R. Sabel. Professional and home-made face masksreduce exposure to respiratory infections among the general population. PloS one,3(7):e2618, 2008.
16

[46] V. Vytla, S. K. Ramakuri, A. Peddi, K. K. Srinivas, and N. N. Ragav. Mathematicalmodels for predicting covid-19 pandemic: a review. Journal of Physics: ConferenceSeries, 1797(1):012009, 2021.
[47] W. H. O. (WHO). Public health criteria to adjust public health and social measuresin the context of covid-19. https://apps.who.int/iris/bitstream/handle/
10665/332073/WHO-2019-nCoV-Adjusting_PH_measures-Criteria-2020.1-eng.
pdf?sequence=1&isAllowed=y, May. 2020. (Accessed on 08/26/2021).
[48] W. J. Wiersinga, A. Rhodes, A. C. Cheng, S. J. Peacock, and H. C. Prescott. Patho-physiology, transmission, diagnosis, and treatment of coronavirus disease 2019 (covid-19): a review. Jama, 324(8):782–793, 2020.
[49] W. J. Wiersinga, A. Rhodes, A. C. Cheng, S. J. Peacock, and H. C. Prescott. Patho-physiology, transmission, diagnosis, and treatment of coronavirus disease 2019 (covid-19): a review. Jama, 324(8):782–793, 2020.
[50] J. T. Wu, K. Leung, and G. M. Leung. Nowcasting and forecasting the potentialdomestic and international spread of the 2019-ncov outbreak originating in wuhan,china: a modelling study. The Lancet, 395(10225):689–697, 2020.
[51] G. Yin, H. Jin, et al. Comparison of transmissibility of coronavirus between symp-tomatic and asymptomatic patients: reanalysis of the ningbo covid-19 data. JMIRpublic health and surveillance, 6(2):e19464, 2020.
[52] L. Zou, F. Ruan, M. Huang, L. Liang, H. Huang, Z. Hong, J. Yu, M. Kang, Y. Song,J. Xia, et al. Sars-cov-2 viral load in upper respiratory specimens of infected patients.New England Journal of Medicine, 382(12):1177–1179, 2020.
17