Embed Size (px)
Citation preview
The Pennsylvania State University
The Graduate School
College of Health and Human Development
A MULTILEVEL ANALYSIS OF ORGANIZATIONAL AND MARKET PREDICTORS
OF PATIENT ASSESSMENTS OF INPATIENT HOSPITAL CARE
A Dissertation in
Health Policy and Administration
by
Azza AbuDagga
© 2009 Azza AbuDagga
Submitted in Partial Fulfillment of the Requirements
for the Degree of
Doctor of Philosophy
May 2009

ii
The dissertation of Azza AbuDagga was reviewed and approved* by the following:
Rhonda BeLueAssistant Professor of Health Policy and AdministrationChair of Committee
Robert Weech-Maldonado Professor of Health Services AdministrationUniversity of Alabama at BirminghamSpecial Member
Marianne Hillemeier Associate Professor of Health Policy and Administration
Joseph VaseyAssistant Professor of Health Policy and Administration
Nilam RamAssistant Professor of Human Development and Family Studies
Dennis Shea Professor of Health Policy and AdministrationHead of the Department of Health Policy and Administration
*Signatures are on file in the Graduate School.

iii
ABSTRACT
This dissertation was motivated by the limited research on macro-level predictors of
patient assessments of care. A theoretical model for studying multilevel predictors of patient
assessments of care was developed, based on Donabedian’s structure-process-outcomes model
and resource dependency theory, to guide this study. Overall, the sample included 24,887
medical/surgical patients from 173 hospitals, nested in 46 counties in CA; the data were derived
from the 2002 NRC Picker Patients’ Evaluation of Performance in California (PEP-C) survey,
the American Hospital Association (AHA) Annual Survey, and the Area Resource File (ARF).
The study employed three-level hierarchical linear models, where patient, organizational
(hospital), and market predictors were introduced in a sequential model-building approach to
explain variations across data levels in process quality and overall satisfaction with care. Six of
the ten hypotheses were either completely or partially supported by the results, providing support
for the theoretical model. This study found that variations in all domains of patient assessments
of care abound. Strikingly, however, most of the overall variations (95% - 99%) were within-
hospitals, rather than between-hospitals or between-markets. Patient characteristics accounted
for up to 13% of variations at the within-hospital level. Interestingly, despite the relatively small
between-hospital and between-market variations, net of patient characteristics, organizational-
and market- level characteristics predicted a sizable amount of the true variations in process
quality and overall satisfaction with care domains. The findings of this study suggest that most
of the variations in patient assessments exist within the patient-health-care-provider relationship.
Overall, this study supports the robustness of patient assessments of care in elucidating and
explaining sources of variations across data levels. Other implications are discussed.

iv
TABLE OF CONTENTS
LIST OF TABLES ...................................................................................................................... vii
LIST OF FIGURES ................................................................................................................... viii
ACKNOWLEDGEMENTS ........................................................................................................ ix
CHAPTER 1: BACKGROUND .................................................................................................. 1INTRODUCTION .............................................................................................................. 1LITERATURE REVIEW ................................................................................................... 3
Usefulness of Patient Assessments of Care .................................................................... 3Measurement of Patient Assessments of Care ................................................................ 5Predictors of Patient Assessments of Care...................................................................... 7
CHAPTER 2: THEORETICAL FRAMEWORK ................................................................... 13The Structure-Process-Outcome (SPO) Model................................................................. 13Role of Environmental Factors ......................................................................................... 16Role of Patient Characteristics.......................................................................................... 17Adapted Conceptual Model .............................................................................................. 18Relevance of Resource Dependency Theory .................................................................... 19
Research Hypotheses ................................................................................................................ 20Nurse Staffing ............................................................................................................... 21Resources Directed to Patient Care............................................................................... 22Payor mix ...................................................................................................................... 23Teaching Status............................................................................................................. 24Occupancy Rate ............................................................................................................ 25Hospital Ownership ...................................................................................................... 26Hospital Competition .................................................................................................... 27HMO Penetration Rate.................................................................................................. 27Socio-Economic Factors ............................................................................................... 28
CHAPTER 3: DATA AND METHODS ................................................................................... 30Research Questions........................................................................................................... 30Data Sources ..................................................................................................................... 30
Refinement of the PEP-C Sample................................................................................. 31Variables and Measures .................................................................................................... 33
Patient Characteristics................................................................................................... 33Hospital Characteristics ................................................................................................ 34Market Characteristics .................................................................................................. 37
Validating Picker Domains ............................................................................................... 42SEM Models ................................................................................................................. 42Assessing CFA Model Fit............................................................................................. 44Improving CFA Model Fit ............................................................................................ 46Reliability of Picker Domains....................................................................................... 47
HLM Models..................................................................................................................... 48

v
Null Models and Variance Decomposition....................................................................... 48Approach to Conditional-Model Building ........................................................................ 49
Level-One Conditional Model ...................................................................................... 50Level-Two Conditional Model ..................................................................................... 50Level-Three Conditional Model ................................................................................... 51
Model Specifications ........................................................................................................ 51Examining the Explanatory Power of Organizational and Market Characteristics .......... 52
CHAPTER 4: RESULTS ........................................................................................................... 53Data:.................................................................................................................................. 53
Number of Patients, Hospitals, and Markets ................................................................ 53Characteristics of Patients............................................................................................. 54Characteristics of Hospitals .......................................................................................... 55Characteristics of Markets ............................................................................................ 56
Outcome Measures: .......................................................................................................... 58Items and Domains (Composite Scores)....................................................................... 58Factor Analyses and Reliabilities.................................................................................. 59
1. Coordination of Care................................................................................... 602. Continuity and Transition of Care .............................................................. 613. Physical Comfort ........................................................................................ 634. Emotional Support ...................................................................................... 645. Information and Education ......................................................................... 656. Involvement of Family and Friends ............................................................ 667. Respect for Patient Preferences .................................................................. 678. Overall Satisfaction with Care ..................................................................... 69
Decomposing Variations among Data Levels: ................................................................. 701. Decomposing the Variance in Coordination of Care............................................... 702. Decomposing the Variance in Continuity and Transition of Care........................... 723. Decomposing the Variance in Physical Comfort..................................................... 724. Decomposing the Variance in Emotional Support................................................... 735. Decomposing the Variance in Information and Education...................................... 736. Decomposing the Variance in Involvement of Family and Friends ........................ 737. Decomposing the Variance in Respect for Patient Preferences............................... 748. Decomposing the Variance in Overall Satisfaction with Care ................................ 749. Summary .................................................................................................................. 74
Conditional Models........................................................................................................... 75I. Results for Process Measures.................................................................................... 75
1. Results for Coordination of Care ............................................................................ 75a. Patient-Level Predictors ................................................................................ 75b. Hospital-Level Predictors ............................................................................. 76c. Market-Level Predictors................................................................................ 77d. Variance Explained by Models..................................................................... 78
2. Results for Continuity and Transition of Care........................................................ 79a. Patient-Level Predictors ................................................................................ 79b. Hospital-Level Predictors ............................................................................. 79c. Market-Level Predictors................................................................................ 79

vi
d. Variance Explained by Models..................................................................... 803. Results for Physical Comfort .................................................................................. 80
a. Patient-Level Predictors ................................................................................ 80b. Hospital-Level Predictors ............................................................................. 81c. Market-Level Predictors................................................................................ 81d. Variance Explained by Models..................................................................... 82
4. Results for Emotional Support................................................................................ 83a. Patient-Level Predictors ................................................................................ 83b. Hospital-Level Predictors ............................................................................. 83c. Market-Level Predictors................................................................................ 83d. Variance Explained by Models..................................................................... 84
5. Results for Information and Education ................................................................... 85a. Patient-Level Predictors ................................................................................ 85b. Hospital-Level Predictors ............................................................................. 85c. Market-Level Predictors................................................................................ 85d. Variance Explained by Models..................................................................... 86
6. Results for Involvement of Family and Friends ..................................................... 86a. Patient-Level Predictors ................................................................................ 86b. Hospital-Level Predictors ............................................................................. 87c. Market-Level Predictors................................................................................ 87d. Variance Explained by Models..................................................................... 87
7. Results for Respect for Patient Preferences ............................................................ 88a. Patient-Level Predictors ................................................................................ 88b. Hospital-Level Predictors ............................................................................. 88c. Market-Level Predictors................................................................................ 89d. Variance Explained by Models..................................................................... 89
II. Results for Overall Satisfaction with Care................................................................ 90a. Patient-Level Predictors ................................................................................ 90b. Hospital-Level Predictors ............................................................................. 90c. Market-Level Predictors................................................................................ 91d. Variance Explained by Models..................................................................... 91
CHAPTER 5: DISCUSSION .................................................................................................... 93Discussion of Findings on Predictors ............................................................................... 93Implications for Practice and Policy ................................................................................. 98Theoretical Implications ................................................................................................. 102Study Limitations and Ways to Overcome them in Future Research............................. 103Conclusions..................................................................................................................... 107
REFERENCES.......................................................................................................................... 120
Appendix A: NRC Picker Domains of Patient Assessments of Care and Comprising Items..................................................................................................................................................... 128
Appendix B: The Patients’ Evaluations of Patient Assessments of Care (PEP-C) Survey Instrument ................................................................................................................................. 130

vii
LIST OF TABLES
Table 1: Descriptive Statistics for Patient-Level Variables........................................................ 108
Table 2: Correlations of Patient-Level Variables ....................................................................... 109
Table 3: Correlations of Process Quality and Overall Satisfaction with Care Domains ............ 109
Table 4: Descriptive Statistics for Hospital-Level Variables ..................................................... 110
Table 5: Correlations of Hospital-Level Variables..................................................................... 110
Table 6: Descriptive Statistics for Market-Level Variables ....................................................... 111
Table 7: Correlations of Market-Level Variables....................................................................... 111
Table 8: Results of Model Fit Indices and Reliabilities for Picker Domains ............................. 112
Table 9: Variance Components Estimates for the Null Models ................................................. 113
Table 10: Regression Results for Multilevel Models ................................................................. 114
Table 11: Variances and Variances Accounted for at the Three Levels..................................... 118
Table 12: Contrasting Findings to Hypotheses........................................................................... 119
viii
LIST OF FIGURES
Figure 1: An Adapted Model of Studying Multilevel Predictors of Patient Assessments of Care19
Figure 2: SEM Model for the Coordination of Care Domain....................................................... 61
Figure 3: SEM Model for the Continuity and Transition of Care Domain................................... 62
Figure 4: SEM Model for the Physical Comfort Domain............................................................. 64
Figure 5: SEM Model for the Emotional Support Domain........................................................... 65
Figure 6: SEM Model for the Information and Education Domain.............................................. 66
Figure 7: SEM Model for the Involvement of Family and Friends Domain ................................ 67
Figure 8: SEM Model for the Respect for Patient Preferences Domain....................................... 68
Figure 9: SEM Model for the Overall Satisfaction with Care Domain ........................................ 70

ix
ACKNOWLEDGEMENTS
I thank the National Research Corporation (NRC Picker) and the California Health Care
Foundation for giving me access to the PEP-C data, and the National Center for Health
Workforce Analysis, Department of Health and Human Services for free access to the ARF data.
I am very thankful to the former chair of my committee, Dr. Weech-Maldonado, who
conceived of the topic of this dissertation, facilitated access to the PEP-C data, pooled resources
within the HPA department to give me access to the AHA data, and advised me extensively on
this study prior to his departure from Penn State. The year I worked with Dr. Weech-Maldonado
as a graduate assistant was equally rewarding; he performed his role as a mentor and supervisor
with utmost integrity and respect and was extremely generous with his time and attention.
I thank Dr. BeLue for her benevolent offer to chair my committee in late December 2006,
although the scope of my dissertation did not align with her areas of research. Dr. BeLue was
patient with me when I left Penn State to do my Optional Practical Training to fund myself and
as I went through a series of analytic changes to address the numerous challenges that my data
presented. She also sent me several e-mails indicating her belief in my ability to finish. I thank
the rest of my committee: Dr. Hillemeier for her thorough reading/proofreading of an earlier
version of this dissertation and helpful comments; Dr. Vasey for his statistical expertise that he
shared, even before joining my committee; and Dr. Ram for his insightful questions and gracious
acceptance to join my committee on a short notice. I thank two former Penn-State faculty: Drs.
Rebecca Wells and Frank Lawrence, for being on my committee in the past.
I am thankful to the Office of International Students at Penn State, especially Dr. Negar
Davis, Ms. Masume Assaf, and several advisors for their enormous help and advice at the most

x
difficult time I had at Penn State. I thank Beverly Fahr for her kindness that encompasses every
graduate student in HPA, including me. I thank my beginning advisor, Dr. Kathryn Dansky, and
Dr. Pam Short, former PIC of doctoral program, for answering all of my trivial questions, during
the critical first year of my doctoral program, with patience and respect.
I thank Mrs. Sharon Benus, Dr. Jacob Benus, and Dr. Michael Kirsh of IMPAQ
International LLC for entrusting me with the rewarding role of working on the technical
approaches of several task-order proposals with the Centers of Medicare and Medicaid as early
as the first week they hired me. I benefited from working on IMPAQ’s consulting projects; the
decision to leave IMPAQ to finish my dissertation was hard for me and I wish them all the best
with their thriving company. I thank Dr. Susan Loeb for her support and for giving me a co-
authorship opportunity for only a fraction of the effort that I performed on the projects of others.
Several friends and colleagues made a difference in my life during the Penn-State years.
My friends and neighbors of four years at 143 E Marylyn Ave, Mary Jellison and her late
husband, John Jellison, were genuinely kind to me and gave me a sense of family when I needed
it most. I will always remember the following fellow graduate students for their moral support:
the Colaco brothers (Brendon & Clinton), Michelle Holt, Woolton Lee, Louise Meret-Hanke,
Kris Pringle, Patty Keys, and Janelle Perez.
I thank my friend, Dr. Amna El-Tayeb, and her family for their valuable friendship over
the last decade and for driving all the way from OH to visit with me. I thank the several sisters
that Allah (GOD) blessed me with, from the State College, PA, and Dar-Al-Taqwa, MD, masjids
for their powerful duaa (prayers): Amina Ben-Jebria, Muneera Althowaini (and her daughters
Assma and Buthainah), Hessah Almoaiqel, Raghda Ibrahim, Lina Chehab, Calista Bond, and

xi
Paula (Safiyah) Blake.
My deepest thanks and appreciation go to my parents, Fathia and Mahmoud AbuDagga,
and to my sisters, Sahar, Reem, Nisreen and Shereen, for their love and unwavering support; I
love you and miss you, and regret the long years of being away from home (Gaza).
Indeed, the one who is worthy of all praise and thanks is Allah. I thank Allah for giving
me the strength to overcome all the obstacles that came my way during the course of working on
this degree. With all praise to Allah, I have achieved my goal without compromising my values
or dignity and I am stronger today in faith and spirit than I have ever been. I accept the decree of
Allah, the good and the bad, and I testify that there is no God but Allah; I submit to none but
Allah. I conclude with one duaa of the prophet Muhammad: “O Allah, teach us what benefits us
and benefit us from what you taught us… O Allah, we seek your refuge from knowledge that has
no benefit.”

xii
DEDICATION
I dedicate this work to the human being that I love the most – after Muhammad, the
prophet of Islam – my mother Fathia AbuDagga. My mother is the most giving and forgiving
person that I have ever met in my life. Born and raised as a Palestinian refugee in three different
countries, my mother was never able to go to school; however, she sacrificed and endured to
make it possible for me and my siblings to pursue our educational goals, to the extent that each
one of us wanted.

CHAPTER 1: BACKGROUND
INTRODUCTION
The robustness of patient assessments of care as measures of health care quality has been
largely supported (Finkelstein, Hulka, & Rosenthal, 1999). Nonetheless, the literature on patient
assessment of care is viewed to be less developed than the consumer satisfaction research found
in the general marketing literature. O'Connor and Shewchuk (2003) describe the patient
satisfaction literature as generally comprised of “substantively shallow empirical reports that
address circumscribed, idiosyncratic, and context-specific questions (p. 21).” Furthermore, the
literature cites three major weaknesses in the work on patient assessments of care: (1) Lacking
theoretical foundations (Patterson, 1998); (2) Being mostly based on simple descriptive and
correlational analyses (O'Connor & Shewchuk, 2003; Otani, Kurz, Burroughs, & Waterman,
2003); and, (3) Being limited to a single or few health care organizations (Finkelstein, Singh,
Silvers, Neuhauser, & Rosenthal, 1998; Greenley & Schoenherr, 1981; Rogut, Newman, &
Cleary, 1996; Rosenheck, Wilson, & Meterko, 1997; Young, Meterko, & Desai, 2000). The fact
that this literature had rarely used multi-hospital samples of patients (Greenley et al., 1981) is of
particular importance, for this sampling practice has been implicated in the discrepancy of
research findings; the discrepant findings on the sociodemographic predictors of patient
assessments of care (Finkelstein et al., 1998; Young et al., 2000) is one such major example.
Another downside of this sampling practice is that studies that are limited to few hospitals
preclude investigating macro-level predictors – at the organizational (Jimmieson & Griffin,
1998; Rogut et al., 1996; Rosenheck et al., 1997) and market levels.

2
Driven by the need to address these three limitations and capitalizing on data from a large
multi-hospital sample from the Patients’ Evaluations of Performance in California (PEP-C)
survey of the NRC Picker, this study made several contributions to the area of research on
predictors of patient assessments of care. Firstly, it conceptualized and validated patient
assessments of care as multidimensional process quality and overall satisfaction with care
composite scores. Secondly, building on Donabedian’s structure-process-outcome model and
resource dependency theory, this study developed a theoretical model for studying the data
structure of patient assessments of care. This theoretical model suits the multilevel nature of
patient assessments of care, given that variations are likely to exist at the three data levels:
patients, hospitals, and markets. Thirdly, this study employed three-level hierarchical linear
models to decompose and explain multilevel variations using organizational and environmental
characteristics, net of patient characteristics.
This study addressed three major research questions:
1. Do patient assessments of inpatient care (process quality and overall satisfaction composite
scores) vary within hospitals, between hospitals, and between markets?
2. Do hospital organizational characteristics predict the mean patient assessments of hospital
care, controlling for patient-level characteristics? How much of the hospital variations at
this level are explained by organizational characteristics?
3. Do hospital environmental characteristics predict the mean patient assessments of hospital
care, controlling for patient and organizational characteristics? How much of the hospital
variations at this level are explained by environmental characteristics?

3
LITERATURE REVIEW
A vast body of research has been devoted to the concept of patient assessments of care.
This study focused on patient assessments of hospital care. A review of this literature showed
three major strands of research: the usefulness of patient assessments of care, measurement of
patient assessments of care, and predictors of patient assessments of care.
Usefulness of Patient Assessments of Care
As early as the 1960s, researchers have documented that patients have different reactions
to their experiences with medical care (Hulka, Zyzanski, Cassel, & Thompson, 1971). Over the
last three decades, patient perceptions of medical care have increasingly gained attention among
researchers (Sitzia & Wood, 1997; Van Campen, Sixma, Friele, Kerssens, & Peters, 1995; Van
Campen, Sixma, Kerssens, Peters, & Rasker, 1998). The rise of consumer-oriented approaches
as superior models for health care delivery (Finkelstein et al., 1999; O'Connor et al., 2003) and
the emergence of the information on the quality of health care providers movement (Barr &
Banks, 2002) have contributed to the proliferation of work on patient assessments of care.
Traditionally, some physicians and administrators raised doubts that patient perceptions
can accurately measure quality, let alone provide actionable information (Mack, File, Horwitz, &
Prince, 1995). Surprisingly however, these suspicions have “beyond any doubt” largely
contributed to the proliferation of the measurement of patient satisfaction industry (O'Connor &
Shewchuk, 2003). As indicated by Hays, Larson, et al. (1999), patient perceptions of health care
have already been shown to be highly related to patient intentions to recommend, brag about, and
return to the hospital if care is needed in the future. Patients perceptions of care have been
documented to predict whether patients seek medical advice, comply with treatment, maintain a

4
continuing relationship with a practitioner, as well as the willingness of patients to initiate a
malpractice litigation (Finkelstein et al., 1999). It has also been shown that patient ratings of
hospital quality closely match those of hospital employees (Jimmieson et al., 1998; Nelson et al.,
1992). Moreover, recent research suggest that patient assessments of care are related to
organizational financial performance (Press, Ganey, & Malone, 1991). For example, one study
showed that patient satisfaction accounts for almost one third of the variance in hospital
profitability (Nelson et al., 1992).
Implicit in the argument that patient assessments of care are useful means for evaluating
the performance of health care providers and improving health care quality is that patients have a
common idea about how health care providers should operate (Sixma, Spreeuwenberg, & Van
Der Pach, 1998). In reality, it has also been found that patients can discriminate between
different aspects of care (Hays, Larson, Nelson, & Batalden, 1991) and between the care
provided at different hospitals, and that patient ratings of care are reproducible over time
(Finkelstein et al., 1999). An additional strength of patient assessments of care is that previous
studies have established that patient surveys are feasible (Hays et al., 1991). Taken together, all
these findings affirm the usefulness of patient assessments of care for evaluating health care
quality (Finkelstein et al., 1999).
Quality improvement efforts, in both the service and manufacturing industries, have
embraced consumer assessments to evaluate product quality (Rubin, 1990b). In fact, the health
care quality improvement movement had long adopted patient assessments of care in quality
assessment (Kane, Maciejewski, & Finch, 1997) even before their robustness was supported
empirically.

5
Although most of the uses of consumer assessments data in health care have traditionally
been limited to internal organizational purposes, such as quality improvement activities
(Rosenheck et al., 1997; Young et al., 2000), their use has progressively expanded over the last
two decades. For example, in the managed care industry, information from the Consumer
Assessments of Health Plans Survey (CAHPS®) has been used in most of the publicly available
managed care report cards (National Committee for Quality Assurance (NCQA), 2004).
Similarly, the hospital industry is subjected to unprecedented market and policy pressures to
comply with public disclosure of their performance data, in order to inform the purchasing
decisions of consumers (Rosenheck et al., 1997; Young et al., 2000). In fact, several reports that
compare hospitals based on patient assessments of care have been publicly available for several
years (Barr et al., 2002). The importance of patient evaluations of hospital care is most
exemplified by the Centers for Medicare and Medicaid Services (CMS) effort to promote the
collection and reporting of patient experiences with hospital care (Hays, Eastwood, Spritzer, &
Cowan, 2006) in the CHAPS® Hospital Survey effort (Goldstein, Farquhar, Crofton, Darby, &
Garfinkel, 2005).
Measurement of Patient Assessments of Care
Of the vast body of literature on patient assessments of care, patient satisfaction is the
most commonly used/studied term. In fact, one literature review (Sitzia et al., 1997) found that
over a thousand studies addressed the concept of patient satisfaction worldwide. Sitzia and
Wood (1997) noted that patient satisfaction with care has been operationalized in so many
different ways that made them conclude that the literature lacks attention to the meaning of the
concept of patient satisfaction. Ironically, discussions of conceptual and theoretical issues

6
related to patient satisfaction have typically come after measurements and analyses of patient
satisfaction have taken place (Finkelstein et al., 1999).
A major reason for lacking consistent conceptualization of patient satisfaction is the fact
that until recently, standardized and validated instruments of patient satisfaction were lacking. A
review of the patient satisfaction instruments (Van Campen et al., 1995) revealed that of the
existing one hundred and thirteen instruments, only forty one were tested for validity and/or
reliability and just eight instruments were tested twice or more in published studies. The authors
also noted that most of these instruments were developed in-house by hospital staff. The authors
proposed five requirements for an instrument to be suitable for quality assessments from the
consumer’s perspective: the tool has to be theoretically sound; reliable and valid; structured
around sub-scales; easily feasible; and applicable to outpatient settings. According to the
authors, none of the eight tools that had been used more than two times met all these
requirements and only five met at least three of these criteria. Indeed, the lack of validated and
standardized instruments in the patient assessments of care literature limits the generalizability of
the findings of these studies.
Another limitation is the tendency to conceptualize patient assessments of care too
broadly. Early work using factor analyses and other similar methods supported the presence of
several different dimensions underlying the patient assessments of care construct (Ware &
Snyder, 1975). However, researchers have started to consider the multidimensional nature of
patient assessments of care in empirical studies only recently. Furthermore, consensus on the
specific dimensions that comprise patient assessments of care has been lacking (Greenley et al.,

7
1981; Nelson, Hays, Larson, & Batalden, 1989). Ware and Snyder’s review of the patient
satisfaction (assessments) literature indicated the prevalence of eight major dimensions of
satisfaction: art of care, technical quality of care, accessibility of/convenience, finances, physical
environment, availability, continuity, and efficacy/outcome of care (Ware, Davies-Avery, &
Stewart, 1978). Clearly, failure to conceptualize patient assessments of care multidimensionally
has implications for the findings on predictors of this construct. In addition, various dimensions
of patient assessments can have different predictors. More variations in predictors can also exist
among various patient groups and/or organizations (Greenley et al., 1981). Therefore, unless
researchers look at multiple dimensions of patient assessments of care, complete understanding
of the factors that influence patient assessments will not be attained.
Predictors of Patient Assessments of Care
The literature on predictors of patient assessments of care has focused primarily on
patient-level characteristics (Greenley et al., 1981): such as, health status, age, gender,
socioeconomic factors, disease severity, and health care access measures including availability of
health insurance. In fact, combinations of these patient-level predictors have been effectively
used in case-mix adjustments of some health care outcomes, with the purpose of making
equitable comparisons among different providers.
A significant amount of research indicates that age (Jaipaul & Rosenthal, 2003) and
health status (Hargraves et al., 2001) are important predictors of patient assessments of care,
independent of the characteristics of the care provided. However, research remains equivocal
about the role of other patient factors, such as gender and race (Barr et al., 2002). The
availability of health insurance has been found to be positively related to satisfaction with care

8
(Finkelstein, 1998; Rogut et al., 1996). The importance of including health insurance status in
the study of patient assessments of care is supported by the mounting evidence on the link
between the availability of health insurance and health status (Hadley, 2003). Moreover, poor
health status has been found to be negatively related to patient assessments of care (Westaway,
Rheeder, Van Zyl, & Seager, 2003).
Interestingly, patient characteristics appear to account for a rather small amount (3% -
7%) of the overall variance in measures of patient assessments of care in published studies (Barr
et al., 2002). As such, some researchers, such as Finkelstein, et al. (1998) have concluded that
hospital ratings based on patient assessments of care are not substantially affected by case-mix
differences.
In the patient assessments of care literature, there are instances where researchers
indicated that patient assessments of care differed across individual hospitals, yet no attempts
were made to correlate these differences with hospital characteristics. The work of (Nelson et
al., 1989) is such a case in point. The fact is, compared to work on patient characteristics, a
small number of studies have examined the influence of hospital organizational characteristics on
patient assessments of care (Greenley et al., 1981; Jimmieson et al., 1998; Rosenheck et al.,
1997; Young et al., 2000). Additionally, despite the existence of a multitude of potentially
influential and measurable hospital organizational variables, the following variables were
examined, albeit narrowly, by researchers in this area: size, teaching status, ownership status,
Medicaid volume, nurse staffing, total margin, and service type. Studies seldom included
combinations of more than three of these variables. Thus, the findings on these organizational
variables are generally too inconsistent to provide a good understanding of their influence.

9
With respect to organizational size, (Rosenheck et al., 1997; Young et al., 2000) found
that patient assessments of care were worse in hospitals with higher number of beds. However,
Finkelstein, et al. (1998) found that size was not related to patient assessments of care among
obstetric patients. While Fleming 1981 found that teaching status was negatively related to
patient assessments of hospital care, in general, another study found it to be negatively related to
coordination of care, timeliness, and accessibility of care, in particular (Rosenheck et al., 1997).
However, Young et al. (2000) found teaching status was negatively associated with patient
ratings of care only in surgical settings. In terms of hospital ownership status, Baker et al.’s
(2000) review of the literature found that among the six studies that examined the relationship
between patient assessments of care and ownership, the relationship was confirmed in only one
study and suggested in another. Nonetheless, Baker et al. (2000) noted that little attention has
been given to the relationship between hospital ownership status and patient outcomes, in
general, not just regarding patient assessments of care. Therefore, the authors recommended that
future research of patient outcomes should include ownership status. While Rogut et al. (1996)
found that Medicaid volume was negatively related to patient assessments of care, Finkelstein et
al. (1998) found it not at all related to patient assessments of care. Rogut et al. (1996) also found
nurse staffing (measured as the number of nurse full-time equivalents per occupied beds) not
predictive of patient ratings of care, controlling for patient characteristics. With respect to total
margin, Rogut et al. (1996) found it not related to patient assessments of hospital. In contrast to
other organizational characteristics, hospital service type seems to be a more consistent predictor
of patient assessments of care. For example, (Cleary et al., 1991; Young et al., 2000) found that
obstetric patients and surgical patients tend to rate their care higher than medical patients.

10
Similarly, (Hargraves et al., 2001) recommended disaggregating patient assessments data by
service type, as opposed to combining data from all types of hospital care.
While the general organizational and strategic management literature give emphasis to
market (environmental) characteristics, as significant predictors of organizational performance,
very few studies have researched their link to patient outcomes, let alone patient assessments of
care. Incidentally, one study (Young et al., 2000) examined the role of one market factor (rural
location), alongside hospital-level predictors of patient assessments of care; this study found
rural location of hospitals to be a favorable predictor of patient assessments of care. On the other
hand, the few available findings from the health care industry suggest that market characteristics
do influence patient outcomes. For example, some studies have found that higher Health
Maintenance Organizations (HMO) penetration and HMO competition in hospital markets are
related to better clinical outcomes (Mukamel, Zwanziger, & Bamezai, 2002; Mukamel,
Zwanziger, & Tomaszewski, 2001). Similar to the managed care industry, where the market
characteristics were found to be related to plan quality (Scanlon, Swaminathan, Chernew, & Lee,
2006), we can justifiably posit (as illustrated under the theoretical framework) that market
characteristics can also influence the quality of hospital care, as assessed by patients.
Apparently, not enough research studied macro-level predictors of patient assessments of
care. An obvious major reason for this knowledge gap is the fact that most studies have typically
sampled too few hospitals (Finkelstein et al., 1998; Fleming, 1981; Rosenheck et al., 1997;
Young et al., 2000) or failed to gather sufficient data on the structure and processes of sampled
hospitals (Greenley et al., 1981). As explained by (Sixma et al., 1998), the representation of an

11
adequate range of health care organizations in the patient assessments of care research stems
from the fact that structural variables, such as the characteristics of the health care professionals,
can be predictive of the quality of care and how the care can be improved. Therefore, unless
patient assessments of care data are collected from samples that resemble the hierarchical
structure of the health care system, it becomes unclear whether differences in patient assessments
of care are due to differences between patients or the hospitals where health care was provided.
Along those lines, differences in patient assessments could be due to differences in the markets
where hospitals exist.
Another limitation in this research is failing to simultaneously account for patient and
organizational predictors. For example, Fleming’s (1981) study of organizational predictors of
patient assessments of care did not control for patient characteristics. Young et al. (2000)
advocated for the combined analyses of patient and organizational factors, because these
variables may be correlated across data levels as in the case of teaching hospitals and sicker
patients. Additionally, Finkelstein et al. (1998) and others asserted that the discrepant findings
on patient characteristics could be due to the methodological failure to account for organizational
characteristics. Moreover, the absence of data analyses of both patient and organizational
predictors makes it difficult to distinguish the relative contribution of each predictor to the
overall variability in patient assessments of care (Veenstra & Hofoss, 2003).
Aside from sampling issues, further research that takes into account the multidimensional
and multilevel nature of patient assessments of care is urgently needed. With the recent
availability of standardized and validated measures of patient assessment of care, such as the
NRC Picker instruments, and the advancements in multilevel methods, health services

12
researchers have a unique opportunity to provide a better understanding of the predictors of
patient assessments of hospital care across patient, organizational, and environmental levels.
The findings of this research are particularly instrumental in the realm of adjusting quality
information, for more equitable comparisons among health care providers (Young et al., 2000).

13
CHAPTER 2: THEORETICAL FRAMEWORK
This section describes the theoretical foundation for the hypothesized relationships
between patient assessments of care and organizational and market factors. Firstly, the relevance
of Donabedian’s structure-process-outcomes model to the conceptualization of patient
assessments of care is explained. Secondly, the relevance of market characteristics is illustrated.
Thirdly, the conceptual model that guided this study is presented. Finally, the usefulness of the
resource dependency theory to understanding macro-level predictors of patient assessments of
care is illustrated and specific study hypotheses are derived.
The Structure-Process-Outcome (SPO) Model
The SPO model for assessing health care quality (Donabedian, 1966, 1980, 1992)
provided an overall conceptual basis for this study. The health services research and the quality
improvement communities have used the SPO model widely (Romano & Mutter, 2004). A
number of studies of patient assessments of care have also used the SPO model (Chang, 1997;
Crall & Morris, 1988; Oropesa, Landale, & Kenkre, 2002; Patterson, 1998; Westaway et al.,
2003). Thus, a preponderance of support exists for the appropriateness of the SPO model for
understanding organizational phenomena, such as patient assessments of care.
Donabedian defined structure as the professional and organizational resources associated
with the provision of care, such as staffing levels and credentials, and facility operating
capacities. Process refers to the things done to and for the patient, and includes both technical
quality and process quality. Technical quality represents the clinical quality of the medical

14
procedures delivered to the patient. In contrast, process quality concerns with how the care was
created and delivered (Marley, Collier, & Goldstein, 2004). Examples of process quality include
the level of care personalization and patient-care provider interaction, the delivery of medication,
the efficiency of admission and checkout, and the timeliness and accuracy of hospital bills
(Marley et al., 2004). According to Donabedian, Outcomes are the conditions resulting from
care processes, which may include clinical outcomes, functional well being, as well as patient
satisfaction with care. In applications of the SPO model, researchers, such as Romano and
Mutter (2004) had further distinguished between two types of outcomes as: clinical outcomes, as
those outcomes encompassing mortality, morbidity, and functional status; and process outcomes,
as those encompassing patient behaviors, knowledge, and satisfaction with care.
Donabedian indicated that there is a direct relationship among the three components of
the SPO model, whereby a good structure promotes appropriate processes of care and better
patient outcomes, and vice versa. Research findings had repeatedly supported the link between
structural measures and processes and outcomes of care in health care applications of the SPO
model (Mitchell & Shortell, 1997).
The general practice in applications of SPO model in health services research has been to
use either process or outcome measures; seemingly due to data limitations considering that
existing datasets are mostly tailored to either process or outcome measures, and rarely combine
both types of data. Representing tangible end results of care, outcomes appeal to researchers,
more than process measures (Crombie & Davies, 1998), and are currently dominant in health
services research. On the other hand, some researchers assert the usefulness of process quality
measures in the realms of quality improvement and health policy (Crombie et al., 1998).

15
Particularly, processes quality measures are directly actionable by health care providers, as they
offer “opportunities for intervention” by reflecting how providers evaluate and treat patients
(Romano et al., 2004).
This study used both process quality and outcome measures, as opposed to the traditional
practice, for two reasons. The first reason is to offer a more comprehensive application of the
SPO model and the second is to see if there is a pattern for the associations between the
organizational and market characteristics and various aspects of care, at the process level of care
as well as overall satisfaction. For example, overall ratings of care were found to measure
aspects of care that are not captured in process of care measures (Hendriks, Vrielink, Van Es, De
Haes, & Smets, 2004). Thus, one can presume that satisfaction with care may have different
predictors than process of care.
With respect to defining patient assessments of care, this study borrowed from the work
of (Marley et al., 2004). According to (Marley et al., 2004), patient satisfaction refers to “how
patients judge the overall hospital experience and whether they would return to a future visit.”
The authors also stated that process quality “concerns with patient perceptions of how the care
was created and delivered,” however they did not provide a formal definition of process quality.
Although the literature seems to share a general understanding of the concept of process quality,
formal definitions do not seem to exist. In this study, process quality was defined as validated
multidimensional evaluations of the health care experience in terms of coordination of care,
continuity and transition of care, physical comfort, emotional support, information and
education, involvement of family and friends, and respect for patient preferences.

16
In this study, the structure component of the SPO model pertained to the organizational
characteristics of hospitals: teaching status, nurse-staffing mix, ownership status, payor mix,
occupancy rate, and financial resources committed to patient care. The process component
pertained to the Picker composite scores of process quality: coordination of care, continuity and
transition of care, physical comfort, emotional support, information and education, involvement
of family and friends, and respect for patient preferences. The outcome component pertained to
the overall satisfaction with care composite score.
Role of Environmental Factors
The SPO model is apparently limited with respect to explicating the relevance of macro-
level predictors of patient assessments of care. In fact, the SPO model does not capture factors
beyond the hospital level that can also relate to patient assessments of care. This limitation
represents a serious conceptual and methodological challenge, given that variations in patient
assessments of hospital care are likely to exist between hospital markets, not only within
hospitals.
There are two compelling rationales behind considering market-level factors in the study
of patient assessments of care. The first rationale comes from the findings of the small area
variation (SAV) in health care utilization research. Although predictors of SAV were long
believed to be entirely attributable to differences in practice style among individual providers,
this understanding has been changed radically by findings from recent research that incorporated
market-level predictors. Evidently, market-level socio-economic and health care supply and
demand factors have been found to account for a sizable amount of variations in SAV

17
(Alexander et al., 1999; Komaromy et al., 1996).
The second rationale for considering market-level predictors of patient assessments of
care is provided by the fundamental environmental – political and economic – changes that have
taken place in the American health care system since the introduction of the SPO model. Major
examples of these changes include the proliferation of managed care, shortages in professional
health care staff, and changes in reimbursement structures. In addition, patients are increasingly
becoming more educated about their health care needs and are also being more involved in
planning their health care. In effect, hospitals have responded with several strategies to changes
in their environments. Commonly-cited examples of hospital responses include the decrease in
length of stay, increased emphasis on outpatient care, hospital downsizing, and the emergence of
new hospital structures.
Theoretical support for the influence of the environment on the organizational behavior
of hospitals is available from several organizational theories. Most notably, resource
dependency theory is one such theory that has been extensively used by researchers interested in
studying organizational response to external factors (Zinn, Mor, Castle, Intrator, & Brannon,
1999). The relevance of resource dependency theory is discussed later in this chapter.
Role of Patient Characteristics
Existing research on predictors of patient assessments of care has primarily focused on
patient-level predictors. Despite the discrepant findings on the direction and size of association
of patient-level predictors, the literature almost unequivocally supports the influence of these
predictors on various measures of patient assessments of care. Thus, conceptual models of

18
patient assessments of care that fail to include patient-level predictors would evidently be
incomplete.
Adapted Conceptual Model
This study hypothesized that hospital organizational and market characteristics are related
to process quality and overall satisfaction with care. As discussed, the SPO model was
instrumental in the conceptualization of the components of patient assessments of care. The SPO
model also provided a theoretical foundation for the association between organizational
characteristics, as structural factors, and measures of patient assessments of care. Support for the
potential role of market and patient-level1 factors was discussed. Consequently, the conceptual
framework for this study added relevant characteristics of the hospital market as well as relevant
patient characteristics to the three basic components of the SPO model (Figure 1).
Therefore, this adapted model offers a more comprehensive framework to studying
multilevel predictors of various aspects of patient assessments of care and captures the
complexity of the current hospital industry.
This study left testing the relationship between process quality and overall satisfaction
with care to future research. Nonetheless, direct association between patient perceptions of
process quality and overall patient satisfaction with care had been supported in the work of
(Marley et al., 2004).
1 Given that organizational and market characteristics were the predictors of interest in this study, patient characteristics were used as control variables, but no hypothesis were formulated for them.

19
Figure 1: An Adapted Model of Studying Multilevel Predictors of Patient Assessments of Care
Relevance of Resource Dependency Theory
Resource dependency theory is an open systems theory that posits that the environment is
the source of scarce and critical resources (Pfeffer & Salancik, 1978). Organizations depend on
resources in the environment, beside their internal resources, for survival and must interact with
their environments in order to obtain needed resources. The scarcity of resources and the
uncertainty of the environment determine the nature and extent of organizational dependency
(Scott, 1998). In turn, influential environmental factors prompt organizations to respond. In
order to ensure their own survival, organizations take rational operational and/or strategic actions
to respond to environmental factors and demands of key constituencies, while organizational
characteristics determine the ability of organizations to respond to environmental factors and
Structure Process Outcome
Patient characteristics
Market characteristics
Overall Satisfaction with Care
Hospital characteristics
Process Quality

20
demands of constituencies (such as, payors, patients, etc.).
Similar to other health care organizations, hospitals are facing increased complexity in
their external environments. While health care payors have emphasized cost-effective health
care services, exemplified in stringent reimbursement mechanisms by both government and
managed care organizations, health care payors have increasingly been emphasizing quality of
care as well over the last decade or so. One strategy for health care organizations to respond to
these new environmental demands and to improve their market position is differentiation based
on quality of care (Baker Starkey, Weech-Maldonado, & Mor, 2005). This study views
differentiation of hospitals based on quality of care, as measured in patient assessments of care,
as rational adaptive response to changing environmental conditions intended to secure a stable
flow of resources.
Higher patient assessments of care would help hospitals distinguish themselves from their
competitors. If hospitals demonstrate higher levels of patient assessments of care, they can
generate more revenue and secure more resources from their environments. Therefore, hospitals
will respond to the increasing complexity of external environment by increasing patient
assessments of care. The ability to provide higher process quality and patient satisfaction with
care is constrained by organizational and environmental factors.
Research Hypotheses
The conceptual model posited that hospital organizational and environmental
characteristics, net of patient characteristics, influence hospitals’ ability to offer high process
quality and increase overall patient satisfaction of care. Specific hypotheses for each hospital

21
and market predictor are derived below.
Nurse Staffing
Comprising about 30-40% of overall hospital Full Time Equivalent (FTE) personnel and
about 30% of hospital budget (Mark, Harless, & Mcue, 2005), nurse staffing is an important
resource used in the delivery of hospital care. Hospitals with higher nursing staff, particularly
more skilled staff, such as registered nurses are more likely to have better outcomes because they
have access to adequate personnel resources and hence fewer personnel resource constraints.
Studies have demonstrated that the more the staff and the more skilled staff, the better patient
outcomes. Although the influence of nurse staffing levels on patient assessments of care have
not been adequately investigated in large hospital samples, findings from studies using other
quality of care outcomes, such as mortality, length of stay, and adverse outcomes, generally
show favorable effects for higher nursing staffing levels (Needleman, Buerhaus, Stewart,
Zelevinsky, & Mattke, 2006). This study posited that higher nurse staffing levels will enable
hospitals to provide quality care (with the purpose of securing more resources). While few
studies have investigated skill mix and others looked at aggregate nurse staffing levels
(Patterson, 1998), this study tested the influence of both types of nursing staffing: RNs and
LPNs. Therefore,
Hypothesis 1A: At the hospital level, higher RN and LPN staffing levels are favorably associated with perceived process quality and overall satisfaction with care.
Similarly, the more nursing staff that exist in a market, the larger the pool of nurses
available to hospitals and the lesser uncertainty experienced by local hospitals in hiring more
nurses. The availability of nursing staff in local markets is particularly critical to hospitals, given

22
the documented shortages of nurses in the United States. The nursing shortage has generated
concerns among various health care stakeholders. In fact, legislations on minimum staffing
levels in licensed health facilities have been recently passed in California in response to the
concerns over quality of care (Mobley & Magnussen, 2002). Therefore,
Hypothesis 1B: At the market level, higher RN and LPN staffing levels are favorably associated with perceived process quality and overall satisfaction with care.
Resources Directed to Patient Care
In addition to nurse-staffing levels, another important dimension of the internal resources
available in the hospital structure is how much of the total hospital expenses are allocated to
labor. Labor expenses are important because they reflect the amount of resources dedicated to
direct patient care. In fact, labor costs accounts for approximately half of the operational cost of
hospitals (Centers of Medicare and Medicaid, 2003). Similar to nurse staffing levels, greater
ratios of labor expenses (of total expenses) will enable hospitals to increase process quality and
overall patient satisfaction with care, in order to distinguish the hospital from other competitors
in the market. Therefore,
Hypothesis 2A: At the hospital level, higher ratios of resources directed to patient care are favorably associated with perceived process quality and overall satisfaction with care.
Extending the same logic to the market level, having more of the total hospital resources
in a given market directed to patient care, through higher investments in labor, is expected to be
associated, on average, with better patient care. Therefore,
Hypothesis 2B: At the market level, higher levels of resources directed to patient care are favorably associated with perceived process quality and overall satisfaction with care.

23
Payor mix
According to resource dependency theory, hospitals that depend on small pools of
resources for survival are more vulnerable to environmental uncertainties compared to hospitals
that have access to several pools of resources (Pfeffer et al., 1978). Hospitals take revenue
resources into account when making operational and strategic decisions. Clearly, higher
revenues generated from payors create more resources for hospitals and are also likely to affect
patient experiences, such as better process quality and satisfaction. The hierarchy of insurance
reimbursement rates for hospitals suggests that hospitals will pursue patients based on their
source of reimbursement as follows: Medicare, private insurance, and then Medicaid. In acute
care hospitals, Medicare is the single largest payor for hospital care (covering 30% of hospital
care expenditures in 2001) followed by private insurance (34%) and Medicaid (17%) of hospital
care expenditures (Centers of Medicare and Medicaid, 2003). Also, Medicare payments for
hospitalization are more generous than Medicaid payments. Additionally, the impact of payor
mix has been linked to the amount of internal resources generated in hospitals. Higher
proportions of Medicare inpatient days (than Medicaid) in a hospital have been found to be
associated with staffing levels, other factors held constant (Harrington & Swan, 2003). Also,
higher Medicaid inpatient days are associated with negative effect on total staffing levels
(Harrington et al., 2003). As such, this payment structure prescribes hospital ability to provide
better patient care. Therefore,
Hypothesis 3A: At the hospital level, a greater percentage of Medicare days of total days is favorably associated with perceived process quality and overall satisfaction with care, whereas a greater percentage of Medicaid days of total days is unfavorably associated with perceived process quality and overall satisfaction with care.

24
Given that Medicaid is a less favorable payor of hospital care than other insurers, markets
where Medicaid is a dominant payor of hospital care have fewer revenue resources from which
local hospitals can draw resources. Following the premises of resource dependency theory,
markets with constrained pools of resources, where Medicaid is a major payor (Baker Starkey et
al., 2005), means that hospitals operating in these markets will have a hard time generating
resources that are necessary for their survival and thus will have a lesser ability to compete based
on, and provide quality care. Therefore,
Hypothesis 3B: At the market level, a greater ratio of Medicaid days to total days is unfavorably associated with perceived process quality and overall satisfaction with care2.
Teaching Status
Teaching hospitals enjoy a good reputation among various constituencies, including
payors and patients. Moreover, teaching status affords hospitals more resources internally with
combinations of patient care, research, and teaching capabilities. Thus, teaching hospitals will
be able to attract more patient revenue resources. Research shows that patients are willing to
travel farther to receive care in more reputable hospitals than their local hospitals (Bronstein &
Morrisey, 1990). Additionally, hospitals in which intensive teaching is performed may act as
institutional leaders dictating use of care in neighboring facilities (Alexander et al., 1999). For
all these reasons, teaching hospitals will be able to offer better care and attain higher patient
assessments of care as a strategy to generate even more resources from their environments.
Therefore,
Hypothesis 4A: At the hospital level, teaching status is favorably associated with perceived process quality and overall satisfaction with care.
2 Notice that Medicare Days was not included as a predictor at the market level in this study, due to high multicollinearity with the nurse staffing variables – thus, no hypothesis was formulated for it

25
Because teaching hospitals place more emphasis on patient care in their missions more
than non-teaching hospitals, we can deduce that markets with higher concentration of teaching
hospitals will have more cumulative focus on patient care than markets with fewer teaching
hospitals. Additionally, more critical resources will be concentrated in market with higher
teaching intensity, as patients tend to travel to these markets to seek treatment. Thus, according
to resource dependency theory, markets with higher teaching intensity will be expected to have
more resources and will be able to provide, and compete based on better patient care, as a
strategy to ensure their survival.
Hypothesis 4B: At the market level, teaching status is favorably associated with perceived process quality and overall satisfaction with care.
Occupancy Rate
According to resource dependency theory, the higher patient occupancy rate, the more
resources afforded to hospitals and the less environmental constraints imposed on them; thus, the
higher the ability of the hospital to provide higher process quality care and increase overall
patient satisfaction with care. A high occupancy rate means higher capacity utilization and more
resources accessible to the hospital. Higher resources within a hospital will increase hospital
ability to provide better process quality and satisfaction levels. Therefore,
Hypothesis 5A: At the hospital level, higher occupancy rate is favorably associated with perceived process quality and overall satisfaction with care.
At the market level, the higher excess capacity in a given market, the more resources
available in it. In order for local hospitals to fill more of their beds, they will compete based on
the quality of their hospital care. Thus, markets with higher excess capacity will have better
process quality and patient overall satisfaction of care. Therefore,

26
Hypothesis 5B: At market level, excess bed-capacity is favorably associated with perceived process quality and overall satisfaction with care.
Hospital Ownership
Government-owned (state and local) hospitals accounted for 16% of community hospitals
in 20003, non-government non-profit hospitals accounted for 61% and for-profit (investor-
owned) hospitals accounted for the remainder 13% of hospitals (Centers of Medicare and
Medicaid, 2003). Government hospitals have a more complex set of objectives than non-
government hospitals, such as serving the indigent populations, providing community outreach
and education programs, and are less motivated to by financial incentives (Tirole, 1994). In
addition, community needs place constraints on acceptable responses for managing operating
pressures in the organization. Government hospitals are often subject to soft budget constraints;
while the government will likely subsidize the hospitals following poor performance, the hospital
also remit any surpluses to the governing agency (Guggan, 2000). On the other hand, for-profit
and non-government non-profit hospitals are more likely to emphasize profit strategies in
response to environmental pressures as they are self-sustaining organizations that cannot rely on
subsidies for operations. It is noteworthy, however, that non-profit hospitals often articulate a
social objective; so profit is not the sole driver of managerial/operational actions compared to
for-profit hospitals. Nonetheless, revenue from operations must fund costs and thus managers of
non-profit non-government hospitals have similar pressures as for-profit managers, i.e., a
profitability return on services provided. Thus, conceivably, more focus on process quality and
3
Community hospitals are nonfederal short-term general and special hospitals whose facilities and services are available to the public.

27
overall satisfaction with care are more congruent with the mission and objectives of government-
owned hospitals. Therefore,
Hypothesis 6: Government ownership is favorably associated with perceived process quality and overall patient satisfaction with care4.
Hospital Competition
Market share is taken into consideration by hospitals when determining internal resources
and capacity utilization (Magnussen & Mobley, 1999). Moreover, in competitive markets,
organizations share a limited resource pool and survival depends even more, compared to less
competitive markets, on how resources are allocated across competitors (Proenca, Rosko, &
Zinn, 2000). Thus, in more competitive markets, hospitals are more likely to emphasize higher
levels of patient care (better process quality and overall satisfaction with care) as an adaptive
strategy to distinguish themselves from their competitors and secure and stabilize resource flows
(Oliver, 1990). As such, hospitals will seek to improve patient experiences of care, as a
competitive strategy. Not to have high patient assessments of care could result in loss of market
share and revenues to more aggressive competitors. Therefore,
Hypothesis 7: Markets with higher rates of hospital competition have favorable perceived process quality and overall patient satisfaction with care.
HMO Penetration Rate
For hospitals, managed care organizations are a key constituency that expects hospitals to
provide good hospital care to enrolled populations and that enforces its demands through
contractual agreements. Compliance with HMOs’ demands is likely to increase among hospitals
4 Because market-level information on the ownership status of hospitals was not available in ARF, it was not feasible to study the role this variable at the market level. Thus, no market-level hypothesis was feasible in this study.

28
that depend on these HMOs for scarce resources or for resources needed for survival. HMOs
influence which hospitals their members will use, how many services they will utilize, and what
price will be paid for these services. Because of HMOs’ ability to obtain information about
quality of their enrollees’ providers, hospitals have an incentive to increase quality in order to
attract patients and not lose potential revenue sources to competitors. Hospitals that are highly
dependent on managed care revenue (exist in markets of high penetration) are more likely to
respond by emphasizing high process quality and satisfaction with care than hospitals that are
less dependent. Therefore,
Hypothesis 8: Markets with higher HMO penetration rates are favorably associated with perceived process quality and overall satisfaction with care.
Socio-Economic Factors
The socio-economic status of a market area is a crude indicator of the amount of
resources available for hospitals operating in this market area. Research has shown that more
affluent populations use more health care. Moreover, markets with low socio-economic status
present an added challenge for their local hospitals, because the health care needs of the
population will be more complicated than those of markets with higher socio-economic status.
In fact, some researchers found that the socio-economic characteristics of markets are more
important in explaining variations in use of health services than the practice style of health care
providers (Komaromy et al., 1996).
These facts suggest that the socio-economic conditions of hospital markets can influence
hospital performance and planning, which is the perspective of resource dependency theory.
Similar to other studies in health services research that examined market effects (Iwashyna,
Chang, Zhang, & Christakis, 2002), this study hypothesized a relationship between the socio-
29
economic conditions of hospital markets and process quality and overall patient satisfaction with
hospital care. Specifically, this study used two key commonly-used proxy measures of market-
level socio-economic status: percentage of minority population and per-capita income5.
Therefore,
Hypothesis 9: Markets with higher per-capita incomes have higher perceived process quality and overall patient satisfaction with care. Hypothesis 10: Markets with lower percentages of minority population have higher perceived process quality and overall patient satisfaction with care.
5 These two variables were also highly correlated with other market-level socio-economic variables in this study, e.g. population and housing densities, etc.

30
CHAPTER 3: DATA AND METHODS
A theoretical model that relates hospital and market (environment) characteristics to the
processes and outcomes of care guided this study. Therefore, this study addressed the important
research question of how organizational and market characteristics influence multi-dimensional
processes quality and the outcome of overall satisfaction with care, as perceived by patients,
using three-level hierarchical linear models (Raudenbush & Bryk, 2002).
Research Questions
1. Do patient assessments of inpatient care (process quality and overall satisfaction composite
scores) vary within hospitals, between hospitals, and between markets?
2. Do hospital organizational characteristics predict the mean patient assessments of hospital
care, controlling for patient-level characteristics? How much of the hospital variations at
this level are explained by organizational characteristics?
3. Do hospital environmental characteristics predict the mean patient assessments of hospital
care, controlling for patient and organizational characteristics? How much of the hospital
variations at this level are explained by environmental characteristics?
Data Sources
There were three data sources for this study. Firstly, patient-level data were derived from
the 2002 Patients’ Evaluation of Performance in California (PEP-C) adult survey. PEP-C data
were collected through a collaborative project between the California Institute for Health

31
Systems Performance (CIHSP) and the National Research Corporation Picker (NRC Picker) to
gather information about patient experiences with hospital care and to enhance quality
improvement efforts in California hospitals. Secondly, hospital-organizational characteristics
data were derived from the 2002 American Hospitals Association’s (AHA) survey of hospitals.
Thirdly, market (environmental) characteristics were derived from the 2002 Area Resource File
(ARF) data.
Refinement of the PEP-C Sample
The PEP-C survey targeted all general acute care hospitals in California; however,
hospital participation was entirely voluntary. Participating hospitals provided NRC Picker with
complete lists of their adult medical, surgical, and maternity patient discharges. NRC Picker
randomly selected and surveyed a sample of 600 patients from each hospital list (NRC Picker &
CIHSP, 2003). For each hospital, the sample was equally divided among the three: medical,
surgical, and maternity/obstetric service units. For hospitals with less than 300 eligible
discharges during the sample period, a census study of their patient population for the given year
was conducted. The PEP-C survey excluded patients admitted for psychiatric and substance
abuse treatment, those admitted purely for observational purposes, those who died or whose baby
died, and patients who were discharged to a setting other than home.
The PEP-C adult survey data included patients admitted in the participating hospitals
where they stayed for at least one night in any of the three service units of interest and were
discharged between July 1, 2002 and October 31, 2002. According to NRC Picker & CIHSP
(2003), a total of 181 hospitals participated in the PEP-C survey in 2002; thus, accounting for
47% of eligible hospitals, 51% of hospital discharges, and 54% of the licensed beds in

32
California. The average patient response rate (RR) within hospitals was 45%, with a total of 137
hospitals recorded response rates of 40% or better (NRC Picker et al., 2003).
For the purpose of this study, the PEP-C sample was refined in order to enhance the
representation of the data. Some additional refinements of the sample were also necessitated by
the other data sources of this study, in order to better address the research questions of this study.
For instance, this study excluded pediatric hospitals, due to the inherent differences between
adult and pediatric patient populations. Thus, the number of PEP-C hospitals was reduced to
179. Furthermore, given that obstetric services differ in numerous ways from medical and
surgical services (Finkelstein et al., 1999; Finkelstein et al., 1998), this study excluded all
maternity cases. As such, the PEP-C data used in this study were limited to medical and surgical
patients.
Furthermore, due to differences with respect to both patient characteristics and the nature
of services provided between short-term and long-term hospitals and the fact that there was only
one PEP-C participating hospital that was designated in the AHA data as a long-term hospital,
this single hospital was deleted from the PEPC data. Hence, the PEP-C hospital sample size was
reduced to 175. Another justification for limiting the sample in this study to short-term hospitals
was supported by the fact that the majority of all hospitals in CA (about 96%) were short-term
hospitals (as supported by findings based on length of stay variable in the AHA data).

33
Variables and Measures
Patient Characteristics
All patient-level variables, including patient characteristics and measures of patient
assessments of process quality and overall impression of care, were derived from the 2002
PEP-C data. The dependent variables were patient assessments of care (process quality reports
and patient satisfaction with care domains). The PEP-C survey contained 33 items (reports) that
tap 7 distinctive dimensions/domains of care processes: coordination of care, continuity and
transition, emotional support, information and education, involvement of family and friends,
physical comfort, and respect for patient preferences (See Appendix A for a list of these items
grouped by domain; Appendix B for the PEP-C survey instrument). Patients were typically
asked to respond to these questions using a three-likert scale type questions, whereby, a totally
positive or non-problem response= “1”; a semi-positive/negative response= “2”; and, a negative
response= “3.” Therefore, a lower score on these items was indicative of a favorable patient
experience (in other words, we can think of these scales as problem scores).
PEP-C also contained seven ratings of care items (which are the satisfaction items in this
study): courtesy of staff, courtesy of doctors, availability of doctors, courtesy of nurses,
availability of nurses, how well doctors and nurses worked together, rating of the care received at
the hospital, and whether one recommends the hospital to others. These items used a 5-point-
likert scale: poor= “1”, fair= “2”, good= “3”, very good= “4”, and excellent= “5”, except for the
hospital recommendation question, which was rated on a simple “yes” or “no” response options.
As such, a higher score on the overall impression of care domain was indicative of favorable
response.

34
As discussed in the next section, prior to creating summative composite-score scales for
each of the eight outcomes of interest in this study, I first empirically validated the suitability of
Picker grouping methodology for the data of this study.
Patient characteristics (level-one predictors in HLM conditional models) were
constructed using the PEP-C data, as follows. White race was coded as a dummy variable with a
value of “1” for white and “0” for non-white. Age was a continuous variable measured in years.
Education was coded as a dummy variable, taking a value of “1” for less than high school and
“0” for high school or beyond. Gender was a dummy variable taking a value of “1” for female
and “0” for male gender. Self-perceived health status was coded as a dummy variable with a
value of “1” for fair or poor health status, and a value of “0” for excellent, very good, or good
health status. Patient’s primary health insurance consisted of two main dummy variables
(Medicare and Medicaid) and private insurance served as the reference group. Since there were
few observations who reported lack of health insurance (2.27% of the sample) or not being sure
whether they have insurance or not (2.77%), these observations were coded as missing on health
insurance. Type of inpatient service was a dummy variable taking a value of “1” for surgical and
“0” for medical service.
Hospital Characteristics
Hospital characteristics were used as level-two predictors in the HLM conditional
models. The AHA data provided three sets of measures for volume data: hospital-unit; nursing-
home unit; and, overall-facility measures. Due to the fact that the PEP-C data concern inpatient
stay, it was intuitive to use only hospital-unit data. Nevertheless, this approach was not feasible,
due to a serious degree of data missingness with all of the hospital-unit measures. For

35
example, the measure with the least degree of missingness at the hospital unit (inpatient days)
had 13% missingnesses. On the other hand, up to about a third of the PEP-C hospitals were
missing on other hospital-unit measures. For example, 28% of the PEP-C hospitals were missing
on Medicaid inpatient days at the hospital-unit level. Furthermore, some variables, such as
nurse-staffing variables were only available at the total facility unit in the AHA data. Therefore,
I opted to use the total facility measures to derive hospital-level predictors. Nonetheless, in order
to control for the influence of non-hospital unit component (in other words, the nursing-home
component) of hospital measures, I used the indicator variable in the AHA data of whether a
hospital maintained a separate nursing-home unit, as a control variable in the HLM models.
In terms of hospital volume, I used total inpatient days, rather than discharges or admissions,
because inpatient days reflect the heterogeneity in labor usage across patients (Magnussen et al.,
1999). Additionally, although both bed size and nurse staffing were predictors of interest in this
study, these measures were highly collinear6. Therefore combinations of these variables (such
as, the number of staff per inpatient days) were better suited for HLM models.
Overall, I derived/constructed nine measures of hospital-organizational characteristics
using the AHA data, as follows. Teaching status was measured via a summative scale (ranging
from 0-3) constructed using three teaching-status indicators in the AHA data: whether a hospital
is a member of the Council of Teaching Hospitals; whether a hospital’s residency training
program is approved by the Council for Graduate Medical Education (GME); and whether a
hospital’s medical school reported to the American Medical Association (AMA). I also
considered using the ratio of residents per inpatient days as a measure of teaching status, as
suggested by (Navathe, Zhu, Silber, Rosenbaum, & Volpp, 2007). While the ratio of residents
6 Predictors with bivariate correlation coefficients of 0.7 or higher were considered collinear.

36
per inpatient days sounded like a suitable measure of teaching status (given that for nursing
staffing, RN and LPN ratios to inpatient days were used), it was heavily skewed with 95
hospitals (54.60%) reported having zero residents and overall 94.83 % had lower than 1 resident
per 1000 inpatient days. On the other hand, the teaching status composite was related to the ratio
of residents (r= .54). The teaching status composite also showed more variations among
hospitals on this measure. The only caveat was that one hospital was missing on this variable,
thus the number of hospitals in the HLM models was reduced to 173.
In terms of ownership status, AHA data measured this variable through three main
categories: government owned (federal and nonfederal); non-government owned non-profit; and
investor owned. Occupancy rate is a measure of technical efficiency and was calculated as total
inpatient days/ (staffed beds times 365). Two measures of payor mix were constructed based on
the AHA data: (1) the percentage of Medicare inpatient days of total inpatient days; and, (2) the
percentage of Medicaid inpatient days of total inpatient days. Two measures of nurse staffing
were constructed based on the AHA data: (1) ratio of RN FTEs to total inpatient days; and, (2)
ratio of LPN FTEs to total inpatient days. Finally, a measure of financial resources committed to
patient care was constructed as the labor expense per total FTEs: (hospital total payroll expenses
+ employee benefits expense)/ total FTEs. One hospital characteristic I considered was whether
a hospital was a general or non-general (i.e., a specialty) hospital. However, since the majority
of PEP-C hospitals were general hospitals, there were not enough variations in this variable to be
included among the hospital predictors of interest in this study. Another hospital characteristic
that I could not include due to lack of hospital variations was whether a hospital was a
community hospital, as approximately 98% of the PEP-C hospitals were designated as

37
community hospitals in the AHA data.
I have also considered the use of other hospital characteristics from the AHA data that
have been suggested in the literature to be related to organizational outcomes, such health system
membership (Bazzoli, Shortell, Dubbs, Chan, & Kralovec, 1999), degree of community
orientation (Proenca et al., 2000) 7, involvement in quality improvement (self-assessment against
Baldrige-like criteria for sustained continuous improvement). However, due to serious problems
with missing values with these measures in the AHA, to an extent that would minimize hospital
sample size up to about 30% if I included such measures, I opted not to include them in this
study.
Market Characteristics
Marketcharacteristics were the predictors of interest at level three of the HLM
conditional models. I conceived of market characteristics to include characteristics pertinent to
the structure of competing organizations (hospitals), key factors of supply and demand of
hospital care, as well as key socio-economic characteristics of the population served. The
operationalization of these market-level predictors was to some extent dictated by the ARF data.
However, to the extent possible, I tried to refine these market measures to correspond to the way
the organizational characteristics were measured in the AHA data in order to enable closer
comparisons between the organizational and market levels. All of the market-level
characteristics, with exception of hospital index of competition, were derived from the ARF data.
The ARF data generally used the county as the unit of analysis for most measures, although in
some cases, such as HMO penetration rate, it presented measures at the MSA level. As such, for
7 19.5% missing values on this variable.

38
the most part, this study used the county as the approximation of market area for a given
hospital. Another fact worthy of mention here too is that ARF data presented measures related to
hospital characteristics at the county level separately for short-term and long-term care hospitals.
Moreover, in some cases, measures for short-term general hospitals were further disaggregated
for general and non-general hospitals. Given that the PEP-C hospital sample excluded long-term
hospitals, ARF measures for long-term hospitals were also excluded from the market-level data
for this study. In addition, since the vast majority of hospitals in the PEP-C sample were general
hospitals, I subsequently used the measures pertinent to the short-term general hospitals upon
construction of the market variables of interest in this study. However, in the event that short-
term hospital measures were not available at the short-term general hospital level (but rather
aggregated for both general and non-general hospitals), I was constrained to use these measures.
A final note in this regard is that I used the 2001-estimated population data in ARF for the
population measures of interest at the market level.
With respect to market characteristics pertinent to hospital structure, I derived the
following variables: teaching status, excess capacity, resources committed to patient care, and
hospital index of competition. Teaching status was measured in this study as the number of
short-term general hospitals per county that were members of the council of teaching hospitals8.
Excess capacity of short-term general hospital beds was calculated as the county’s occupancy
rate subtracted from 100%. Occupancy rate was constructed as the total number of inpatient days
for short-term-general hospitals in a county divided by the product of the total number of the
county’s short-term-general hospital beds and 365. The resources-committed-to-patient-care
8 Unlike the hospital-level, it was not feasible to use affiliation with the AMA and membership in the Council for GME. The ratio of residents per population was severely skewed with significant number of hospitals with zero observations, thus could not be used in this study.

39
variable was measured as the ratio of total payroll expense in thousands for short-term-general
hospitals in a county divided by total per 1000 short-term-general inpatient days. Unlike the
AHA data, while the ARF data reported total payroll expense, they did not report any
information about employee benefits expense. Therefore, this distinction needs to be taken in
consideration upon drawing comparisons about this construct between the hospital- and market-
levels. It also should be noted that the ARF data included total hospital expense for short-term
general hospitals as one measure and aggregated the corresponding measures for both long-term
and short-term non-general hospitals.
Consistent with the majority of the hospital competition literature, I calculated the
Herfindahl-Hirschman Index (HHI) of competition among hospitals as the measure of the
intensity of hospital competition (Gaynor & Voget, 2000). HHI is a geopolitical measure of
competition and one of its strengths is that it reflects both the number of hospitals and the market
shares across hospitals (Wong, Zhan, & Mutter, 2005). Consistent with most of the literature in
this area as well (Iwashyna et al., 2002), I calculated the HHI for hospital markets at the county
level. I calculated HHI in the AHA data and imported it to the ARF data and linked it back to
the respective hospital level data at level three in the HLM Models using county identifiers. I
chose to calculate the HHI using the AHA, rather than the ARF data for several reasons: I used
both general short-term and non-general short-term hospital inpatient days in the construction of
this variable, unlike the way this variable was constructed in the ARF data (as ARF also includes
long-term hospitals in the calculation of this measure). Worthy of mention here is that I
calculated this variable using market share information from both PEP-C and non-PEP-C
participating hospitals. I also created two additional sets of the HHI using the hospital’s health

40
service area (HSA) and hospital referral region (HRR) codes as defined in the Dartmouth Atlas
of Health Care, as the units of measurement in addition to the county-based HHI. However,
there was a significant degree of missingness on the HSA and HRR code identifiers for hospitals
in the AHA data, as hospitals were asked to self-report their respective identifiers for these two
codes; not surprisingly, therefore, these codes were not reported by all hospitals. The HHI of
hospital competition was calculated as the sum of the squares of the individual hospital market
shares per county. The market share for a given hospital consisted of the proportion of a
hospital’s inpatient days of the total inpatient days in a market area. This means that a highly-
competitive hospital market had an HHI approaching zero (since each hospital had fractional
percentages of market share, which became even smaller when squared), while a perfectly-
monopolistic market (with one hospital) had an HHI of 1.
Key factors of supply and demand of inpatient care used in this study were: HMO
penetration rate, nurse-staffing mix per population count, and, payor mix per population count.
The HMO penetration rate variable was already calculated in ARF as total HMO enrollment
divided by the total population in the hospital’s county and was derived from InterStudy’s 1998
data. Consistent with the way nurse-staffing variables were measured at the organizational-
(hospital) level, I constructed two measures of nurse staffing using the ARF data: (1) RN FTEs
per 1000 population, and, (2) LPN/LVNs FTEs per 1000 population. Similarly, I constructed
two measures of payor mix: (1) Medicare inpatient days in a hospital market area, which was
calculated as the total number of short-term-general-hospital Medicare inpatient days in a county
divided by the per-thousand count of the county’s population and (2) Medicaid inpatient days,
which was calculated as the ratio of Medicaid short-term-general-hospital inpatient days divided

41
by the per-thousand count of the county’s population.
In terms of key socio-economic characteristics of the population in hospital markets, I
examined two key predictors: per capita income and percentage of minority population. Per
capita income was defined in ARF as the per capita income in the hospital’s county. I calculated
the percentage of racial/ethnic minorities as one minus the percentage of the white population
(one race alone) variable given in the ARF data. Thus, minority status of a county represented
the percentage of racial/ethnic minorities (nonwhites) of total population in a hospital’s county.
Although I was interested in including a measure of rural/urban status of hospital
markets, as suggested by previous research that studied market characteristics in relation to
health care outcomes (Mobley et al., 2002), all possible measures of this construct that I
examined were highly collinear with other essential market predictors (namely, hospital HHI and
HMO penetration). Some of the measures of rural/urban status I considered were: whether a
county was located in an MSA area; 2003 and 1995 codes of rural continuum; and percentage of
urban population in 2000. Given that multicollinearity among predictors is a serious violation to
assumptions of the HLM models, I was compelled to exclude these measures of rural/urban
status from the market level models. Multicollinearity among market-level predictors also
hindered the inclusion of several other relevant predictors, such as, population and housing
densities, percentage of population who are 65 and older, and index of competition among
HMOs.

42
Validating Picker Domains
The survey instrument used to collect the PEP-C data was the NRC Picker inpatient
questionnaire, which evolved from the 1987 Picker/Commonwealth Program for Patient-
Centered Care. This instrument has been widely used in assessing patient experiences with
hospital care (Cleary et al., 1991; Cleary, Edgman-Levitan, Walker, Gerteis, & Delbanco, 1993;
Rosenheck et al., 1997; Young et al., 2000) in the U.S and other developed countries, such as the
Canada, Germany and the UK (Coulter, 2001). The Picker instrument was scientifically
validated based on rigorous survey research methods and extensive field testing. Accordingly,
the ability of Picker’s questions and response scales to capture meaningful variations between
patients and hospitals had been established (NRC Picker et al., 2003).
SEM Models
Given that this study used the Picker PEP-C survey data, it follows that the Picker
methodology for grouping various survey items to Picker eight domains was used in this study.
Due to the fact that these domains were used as outcomes in the three-level hierarchical models,
it was imperative to test how well the Picker grouping methodology fits the data of this study.
Factor analyses are typically employed to determine grouping approaches in such cases. There
are two types of factor analyses: exploratory factor analysis (EFA) and confirmatory factor
analysis (CFA). EFA is associated with theory development, whereas CFA is associated with
theory testing. CFA is done to test hypothesized models rather than for exploratory purposes.
Essentially, there was no need to reinvent the wheel and undertake an exploratory investigation
of new domains that can underlie the survey items. Therefore, CFA was the appropriate
technique here since the purpose was to validate whether/how well the correlations [grouping
43
scheme] among individual items were consistent with hypothesized factor [domain] structures
(Tabachnick & Fidell, 2000).
CFA models were estimated in this study using Structural Equation Modeling (SEM)
techniques. SEM serves purposes similar to multiple regression analysis, but in a more powerful
way which takes into account the modeling of measurement error. Moreover, the power and
precision of data analysis for SEM is better than traditional methods of analysis, because many
variables (both observed and latent variables) may easily be brought into the analysis. Within
structural equation modeling, hypotheses are translated into a series of regression equations that
can be solved simultaneously to generate an estimated covariance matrix. By means of various
goodness-of-fit indices, the estimated matrix can be evaluated against the observed sample
covariance matrix to determine whether the hypothesized model is an acceptable representation
of the data.
In order to test the Picker grouping scheme, CFA models were estimated separately for each
of the eight domain structures using the following steps:
1. Each domain structure representing hypothesized relationships between the observed
measures and the underlying “latent” domain (such as, coordination of care, etc.) was
fitted to the data; and,
2. Models were evaluated in terms of their parameter estimates and goodness of fit.
For each latent variable, the loading (regression coefficient) of one indicator variable
(called “anchor” or “reference” variable) was fixed to unity (1.0) in order scale the loadings of
all other items/indicators in the same factor. Sometimes the different scales of the measured
variables make the unstandardized coefficients difficult to interpret and often the scales of the

44
measured variables lack inherent meaning. Therefore, standardized estimates were presented in
the results section for ease of interpretation. The t-value for each regression weight indicated the
degree of statistical significance for the relative contribution of each variable to the
corresponding factor.
Estimating CFA models was performed using full information maximum likelihood
(FIML) estimates. FIML does not use any method of data imputation. Several studies suggest
that FIML estimates tend to be less biased than the other methods (Little and Rubin, 1989;
Schafer, 1997). In contrast, mean imputation, list-wise deletion, and pair-wise deletion methods
can all produce severely biased results independent of sample size. One of the assumptions
underlying maximum likelihood estimation is that the data conform to multivariate normality.
However, results of numerous studies indicate that maximum likelihood estimation is robust
even in cases of serious departure of data from multivariate normality (Wang, Fan, & Wilson,
1996).
Assessing CFA Model Fit
The next step in estimating each CFA model was to evaluate how well each hypothesized
model matched the observed data. One of the robust features of CFA is that in addition to
calculating regression weights for each item hypothesized to predict the latent domain is that is
also calculates model goodness of fit indices. These indices assess whether a given model as a
whole confirmed the theoretical construct (Picker domains, in this case); thus, serving as a check
for the construct validity of CFA models.
In terms of evaluating overall model fit, one key model fit index is the chi-square (χ2) test
statistic. The null hypothesis for the chi-square test is that the implied covariance matrix is

45
equivalent to the observed covariance matrix. Therefore, failure to reject the null hypothesis is a
sign of a good model fit. However, it is well known in the SEM literature that the likelihood of
rejecting a SEM model based on the chi-square statistics increases with sample size. Recalling
that the sample size for the PEP-C data is quite large, with more than 24,000 observations, it was
imperative to use incremental fit indices, as these indices have been largely recommended as
better measures of model fit in cases of large sample size. Indeed, a large class of incremental
model-fit indices exists for determining overall model fit. There is also a wide range of
variations in what incremental indices to use and how many should be reported. Although
several studies typically report at least a couple of such indices, the recent trend is to report a
large number of them. It is also suggested that good-fitting models produce consistent results on
many different indices, in many, if not most cases. Therefore, if different indices lead to similar
conclusions, this is considered a good sign. Accordingly, I evaluated the following model fit
indices, that has been largely used in the SEM literature, in this work: (1) Normed Fit Index
(NFI), also known as the Bentler-Bonett Normed Fit Index, DELTA1; (2) Relative Fit Index
(RFI), also known as RHO1; (3) Incremental Fit Index (IFI), also known as DELTA 2; (4)
Tucker-Lewis Index (TLI), also called the NNFI (non-normed fit index) by Bentler and
colleagues; (5) Comparative Fit Index (CFI); and, (6) the Root Mean Square Error of
Approximation (RMSEA). For all these indices, with exception of RMSEA, values of .90 or
above indicate a good model fit (Arbuckle & Wothke, 1999). On the other hand, RMSEA values
of about .05 or less indicate a close fit of the model to the data, in relation to the degrees of
freedom, and values up to about .08 signify a reasonable model fit, while models with RMSEA
values greater than .1, should not be employed (Browne & Cudeck, 1993). In particular, for

46
comparison of full and reduced models, I also evaluated a measure of absolute fit: Akaike
Information Criterion (AIC). AIC directly assesses how well a priori model reproduces the
sample data. There are no cutoffs, such as .90, for AIC. Rather, upon comparing models, a
model with the lower AIC value is considered to have a better fit.
Improving CFA Model Fit
The SEM literature suggests the use of a number of strategies to improve model fit, in the
event that an original model did not fit the data according to the model fit indices. Obviously,
the tradition is to first drop out predictors that are not significant. However, in the case of the
Picker domains, all of the predictors were significant. Hence, dropping items did not seem the
right strategy one can begin with in attempting to obtain adequately-fitting models. However,
dropping items was reserved as a last strategy, if model improvement was not obtained using
other more conservative strategies, as discussed below. The SEM literature suggests the use of
post- hoc model modifications in such cases. Examples of such modifications include adding
constraints to a model, as implied by the modification indices and critical ratio-differences test
statistics. Unfortunately, the use of modification indices was not feasible in this study, because
the AMOS program does not generate this information in the presence of missing data.9
Alternatively, adding constraints to a model based on results from critical ratio difference
tests was the approach I employed in this study. Basically, I considered adding equality
constraints to some model parameters, if such constraints were supported by results from critical
ratio difference tests. The critical ratio is the difference between two parameters divided by the
9 I opted not to perform any imputations on the missing data for two reasons: a) Ambiguity of basis for missing-value imputation (i.e. which patient characteristics to use in MI models), for example Hays, et al., (2006), did not indicate such info although they used Picker measures with missing data; and b) AMOS automatically uses ML for fitting CFA models.

47
estimated standard error of this difference. Under the distributional assumptions, the critical
ratio statistic can be compared to a table of the standard normal distribution to test whether the
two parameters are equal in the population. If two parameter estimates turned out to be nearly
equal, one might be able to improve model fit by postulating a new model where those two
parameters were hypothesized to be exactly equal. Subsequently, a proposed constrained model
is then evaluated for their fit to the data, above and beyond the fit of the original (more general)
model (Arbuckle et al., 1999). In this regard, the SEM literature warns that adding such
constraints needs to be based on theoretical grounds rather than being purely driven by
exploratory observations. Thus, it is not appropriate to propose unsubstantiated model
constraints just to improve the fit. Therefore, in all cases where I attempted to use this method to
improve the fit of CFA models, I first postulated a theoretical basis for possible equality of
parameters and then proceeded to examining related critical ratio tests accordingly.
Reliability of Picker Domains
In addition to construct validity (established using CFA models), reliability is an equally
important criterion for evaluating the suitability of a grouping methodology. For this reason, I
ascertained adequate internal-consistency reliability for all Picker domains. In keeping with the
literature, cronbach alpha values of .70 or higher were considered acceptable (Cronbach, 1951)in
this study.

48
HLM Models
The preceding sections of this chapter described how Picker domains (outcomes of
interest) were tested and validated and how relevant predictors were constructed across the three
levels of data: patients, hospitals, and markets. The multi-level-nesting structure of the data
implies that variances in Picker domains exist within hospitals, between hospitals, and between
markets. Furthermore, the conceptual foundation of this study suggests that the variability in the
data can be explained or accounted for by predictors at each level. Therefore, the appropriate
predictive methods to employ in this study were three-level hierarchical linear models.
Hierarchical Linear Modeling (HLM), version 6, statistical program (Raudenbush, Bryk,
Congdon, & Congdon Jr, 2004) was used to estimate all multilevel models. The following steps
were followed in order to answer the research questions of this study. First, the amounts of true
variance across the three levels of the data were measured using a null model for each outcome.
Second, a sequential approach to conditional-model building across the three data levels was
established. Third, conditional models were specified and revised, as such for each outcome.
Fourth, the amounts of variance explained by the final conditional models were evaluated across
all data levels for each outcome. A detailed description of these four steps follows.
Null Models and Variance Decomposition
Overall true variance in a given domain (outcome) was estimated via a null model with a
random intercept. A null model is fully unconditional; that is, no predictor variables are
specified at any level. Null models estimated how variations in an outcome measure were
allocated as into within-hospital, between-hospital, and between-market components. An

49
additional statistic of importance computed based on decomposition of variance was the
intraclass correlation (ICC), which represented the proportion of variance attributable to
between-hospital variations. Estimating overall variance and how it was partitioned across the
three levels of the data were crucial prerequisite pieces of information; for these variance
compartments served as baselines against which subsequent conditional models were compared.
To the extent that a conditional model was able to reduce (i.e., explain) these variances, such a
model had high significance.
A sample null model looks like model 3.1:
ijk0jk00k000ijk e+r+u+ =Y
Model 3.1
Where, Yijk represented the assessment of patient i in hospital j in market k; 000 was the
grand mean; u00k was a random “market effect” (the deviation of the market k’s mean from the
grand mean); r0jk was a random “hospital effect” (the deviation of hospital jk’s mean from the
market mean); and, eijk was a random “patient effect” (the deviation of patient ijk score from the
hospital mean).
Approach to Conditional-Model Building
After estimating the null model for each outcome, multilevel regression models were
estimated in three major stages: conditional models at level one; conditional models at level two;
and, conditional models at level three, as follows.

50
Level-One Conditional Model
First, patient characteristics were specified in a within-hospital model at level one.
Specifying the within-hospital model enabled me to estimate the adjusted within-hospital,
between-hospital, and between-market variances. That is, these were the residual variances after
controlling for the characteristics of patients who received care in hospitals. Driven by the
concern about the bias that might arise from failing to specify a predictor, rather than about the
lack of efficiency that arises when the model is slightly overfit, I used the relatively liberal
criterion of t-ratio of 1.5 for a predictor to be retained in the model, as proposed by (Raudenbush,
Rowan, & Cheong, 1993). Although patient-level predictors were not of interest in this study
(rather organizational and market characteristics were), yet patient characteristics were
potentially influential factors that needed to be controlled for, given the nested structure of the
data. Thus, the refined conditional models at level one served as baseline models, in addition to
the null models, against which conditional models at levels two and three were compared for the
amount of variance explained by predictors of interest.
Level-Two Conditional Model
At this stage, between-hospital predictors hypothesized to influence the outcomes were
added at level two, to the refined conditional level-one models per above. Similar to the practice
at level one, level-two predictors with coefficients found to be less than 1.5 times their estimated
standard errors were dropped and the model was re-estimated using retained predictors according
to this criterion.

51
Level-Three Conditional Model
Thirdly, market-level predictors were introduced at level three, to the refined conditioned
organizational-model per above. Again, only market-level predictors with t-ratios of 1.5 or
higher were retained. As such, for each outcome, I sequentially built up a final good-fitting
model that included predictors related to the outcome and excluded predictors unrelated to the
outcome (Raudenbush et al., 1993).
Model Specifications
Model 3.2 presents a sample fully-conditional three-level model for outcomes used in this
study. Notice that I grand-mean centered predictors at the three data levels in order to make the
intercept more meaningful. I also grand-mean centered dummy variables, in order to adjust for
the fact that proportions of these predictors (such as, female gender and Medicaid insurance, etc.)
differed across hospitals and markets.
Yijk = 000 + 00x *(Market-level predictors)k + 0x0 *(Hospital-level predictors)jk+ x00*(Patient-level predictors)ijk + u00k + r0jk + eijk
Model 3.2
Where, 000 was interpreted as the adjusted average of hospital means on the outcome
across the population of hospitals in markets; the terms 00x, 0x0, and x00 were the simple
effects of individual market-, hospital-, and patient-level predictors. In other words, 00x was the
average degree to which a given market-level variable predicted the mean outcome; 0x0 was the
average degree to which a given hospital-level variable predicted the mean outcome; x00 was the
average degree to which a patient-level variable predicted the mean outcome. On the other hand,

52
u00k, r0jk, eijk represented the residual (unexplained) between-market, between-hospital, and
within-hospital variances, respectively. It should be noted that the relationship (effect) of each
predictor was net of the other predictors. For example, the effect of government-hospital
ownership status in market k represented the adjusted mean difference between government and
non-government hospitals in market k, after controlling for the effects of other hospital
predictors.
Examining the Explanatory Power of Organizational and Market Characteristics
In order to determine the extent of variance explained by conditional models, the types of
variances explained by each model were compared against their counterpart variances in the
respective base models. Reductions in residual variances are typically expected in conditional
models with relevant predictors. More specifically, the extent to which residual variances were
reduced was indicative of the strength of a particular model in predicating the outcome of
interest. While variances of the conditional models at level one were compared against variances
of the null models, these conditioned level-one models, in turn, served as the baseline models for
variance comparisons for the conditional level-two and- three models. The proportions of
variances explained were calculated using equation 3.1:
(R2 Base model – R2
Conditional model)/R2
Base model
Equation 3.1
Where, R2 Base model represented the estimated variance in the basic model and
R2 Conditional model represented the estimated variance in the adjusted model.

53
CHAPTER 4: RESULTS
Using PEP-C patient survey data, I examined patient assessments of care in a sample of
24,887 medical and surgical patients from 173 hospitals in 46 markets in CA. The three-level
structure of the data suggests that patient assessments of care vary at each of the three data
levels: within hospitals, as a function of the characteristics of the patients; between hospitals, as a
function of the characteristics of hospitals; and between markets as a function of the
characteristics of hospital markets. Accordingly, I employed a three-level hierarchical linear
model with the purpose of decomposing variations in patient assessments of care across these
three components. I then employed predictor variables at their respective levels in an sequential
model-building approach, in an attempt to account for unit-specific variations in eight
multidimensional domains of patient assessments of care: coordination of care, continuity &
transition of care, continuity & transition of care, physical comfort, emotional support,
information & education, involvement of family & friends, respect for patient preferences, and
overall impression of care.
Data:
Number of Patients, Hospitals, and Markets
The PEP-C data were obtained from medical and surgical patients who received inpatient
care in 179 hospitals in CA in 2002. However, there were four hospitals in the PEP-C data that
were not found in the AHA data. Attempts to retrieve hospital identifiers for those four hospitals
from AHA were not successful; therefore they were dropped from this study. Additionally, one

54
hospital was designated as a long-term hospital, according to the AHA’s length of stay variable;
therefore this hospital was also dropped from the sample along with its patient-level
observations. Finally, one hospital was missing on the teaching-status composite. Thus, when
the Multivariate Data Matrix (MDM) file was constructed in the HLM program, this hospital was
automatically dropped from the data (because HLM does not currently support computation in
presence of missing data at higher levels). Consequently, the final PEP-C data used in this study
pertained to 24,887 patients, nested within 173 hospitals, nested within 46 counties (market
units) in the State of California. As described in the methods section, all of these 173 hospitals
were short-term hospitals.
Characteristics of Patients
Table 1 presents the main characteristics of patients (n=24,887). Slightly over half (53%)
of the respondents received surgical services during their hospitalization compared to the rest of
the sample (47%), who received medical inpatient services. Females comprised 57% of the
respondents. Because the survey was administered to adult patients in this sample, the
participants were relatively old (M= 63 years; SD= 17.04 years), as 37% were less than 55 years
old, 33% were 55 to 17 years old, and 30% were older than 74. Approximately, one third of the
participants (31%) described their health status as poor or fair. While 36% reported being
insured by Medicare, 13% reported having Medicaid insurance, and about 5.5% reported that
they either had no insurance or not sure whether they had insurance or not. As characteristic of
the population in California, racial minorities constituted a sizeable portion of the sample, as
only 68% of participants characterized their race/ethnicity as white. On the other hand, most of
the participants were educated, as only 16% had lower than high school education.
55
As demonstrated in Table 2, most patient characteristics were weakly correlated with each other,
with exception of less than high school education and Medicare insurance, which were
moderately correlated with each other.
Characteristics of Hospitals
Table 4 presents the main characteristics of the 173 hospitals included in this study. As
discussed in the methods section, all of these hospitals were short-term hospitals. Almost all of
these hospitals were general hospitals (97%). Of the sample, 19% were government-owned
(federal/non-federal) hospitals. On the other hand, only 7% of the hospitals were investor-owned
(for-profit) and 74% were non-government-owned non-profit hospitals10. Therefore, the HLM
models used a government-owned dummy variable as a predictor, and the other two categories
(non-government) were aggregated as the reference group. There were three indicator variables
in the AHA data that measured the teaching status of hospitals: whether a hospital was a member
of the Council of Teaching Hospitals; whether a hospital’s residency training program was
approved by the Council for Graduate Medical Education (GME); and whether a hospital’s
medical school reported to the American Medical Association (AMA). Respectively, 8%, 25%,
and 29% of the hospital sample indicated a positive answer (question response “yes”) on these
three items. On a summative scale (ranging from 0-3), constructed using these three teaching-
status indicators, 70% of the hospitals were not members/affiliates with any of these three
programs (teaching score=0), 6% reported membership/affiliation with only one program
(score=1), 17% were members of two programs (score=2), and only 8% reported being members
of all three programs (score=3). The mean occupancy rate for the hospital sample was 66%
10 Results are not shown in the table.

56
(SD= 19) with only 5 hospitals reported an occupancy rate of 100% or higher. Medicare and
Medicaid were major payors for the participating hospitals: the mean percentage of Medicare
inpatient days was 44% (SD= 16%) and the mean percentage of Medicaid inpatient days was
20% (SD= 18%). The mean ratio of full-time-equivalent (FTE) RNs to per-thousand inpatient
days was 5.52 (SD= 2.91) and the ratio of full-time-equivalent LPNs to per-thousand inpatient-
days was 0.73 (SD= 0.76). The mean ratio of financial resources committed to patient care was
$60,980 (SD= $17,886). Nurse-staffing and labor-expense variables in the AHA data were
available only for the total facility (rather than separately for the hospital-unit) and there was also
a significant degree of missingness with other variables (such as, payor mix and inpatient days)
at the hospital-unit level. Therefore, I have decided to include the total facility variables rather
than those of the hospital-unit for hospital-level predictors. In order to account for the fact that
facility variables in AHA include measures of long-term care (mainly nursing-home-unit
operated by the hospital) beside hospital-unit inpatient care, I included an indicator variable
(whether a hospital maintained a nursing-home unit) as a control variable in HLM regression
models to account for possible non-short term inpatient care effect. Overall, 40% of the
hospitals reported maintaining a separate nursing-home unit. As demonstrated in table 5, most
hospital characteristics were weakly correlated with each other, although the two nurse staffing
measures were moderately associated with each other.
Characteristics of Markets
Table 6 presents characteristics of the market units (counties). The hospitals that
participated in the PEP-C survey in 2002 (included in this study) belonged to 46 counties
(representing 81% of counties in CA). Market characteristics were classified into the structure

57
of the market area of hospitals (teaching status, excess capacity11, resources committed to patient
care, and, hospital Herfindahl-Hirschman Index (HHI) of competition); key factors of supply and
demand (payor mix, nurse staffing, and, HMO penetration rate); and, population characteristics
(percentage of minority population and per capita income).
The hospital HHI of competition was calculated as the sum of squared market shares of
short-term inpatient hospital days. As described in the method’s chapter, HHI was constructed
using the AHA hospital data including the entire short-term hospital population in CA (not only
the hospitals that participated in the PEP-C survey) and was then imported to the ARF county-
level data. The mean hospital HHI was 0.52 (SD= 0.27). The mean of the Medicare inpatient
days variable was 188.43 (SD= 74.05). On the other hand, the mean of the Medicaid inpatient
days variable was 132.94 (SD= 141.84). The mean RN FTEs per 1000 population was 2.34
(SD= 0.87) and the mean LPN/LVNs per 1000 population was 0.42 (SD= 0.30). Teaching status
had a mean of 0.52 (SD= 1.52). The mean excess capacity was 37.60% (SD= 5.78%). The
mean of the resources committed to patient care variable was $1,096 (SD= $734.35). The mean
HMO penetration rate in a county was 0.33 (SD= 0.22). In terms of population characteristics,
the mean of per-capita income was $29,207 (SD= $10,710) and the mean of county’s percentage
of minority (non-white) population was 29.07% (SD= 14.13%). As demonstrated in Table 7,
several market-level characteristics were moderately correlated with each other, although not to
an extent that can pose a multicollinearity threat upon using these predictors in the HLM models.
11Although Medicare days/population is an important variable of payor mix, it was not included in the HLM models because it was highly collinear with the ratio of RN staffing levels per population.

58
Outcome Measures:
Items and Domains (Composite Scores)
There were 41 specific patient-assessments of care items in the PEP-C survey. Most of
these questions (k=33) asked patients to indicate whether they had a problem with a specific
aspect of their care using three-option response scales: no problem at all= “1”, a problem
sometimes= “2”, and a problem all the time= “3”. According to the Picker methodology, these
33 items map 7 domains, conceptualized as the “process quality of care composite scores” in this
study. Items belonging to each domain were summed up and the resulting composite scores
(scales) were used as outcomes in HLM predictive models. Therefore, items that listed the
report of a problem in a reverse direction (where 3 indicated the occurrence of a problem all the
time and 3 indicated lack of a problem) were recoded to conform to the intended coding scheme
described above. For example, a score of 18 on the coordination of care domain infers having a
problem all the time on all encompassing items.
On the other hand, there were 8 items that asked patients to rate their experiences with
aspects of their care on a 5-point likert scale: poor= “1”; fair= “2”; good= “3”; very good= “4”;
excellent= “5”. The exception of these rating items was “whether you recommend the hospital
for inpatient stay,” which used a simple “yes” or “no” options. Therefore, a higher score with
“overall impression of care” domain is similar to a satisfaction scale where the higher score, the
higher-level of satisfaction.
The means and standard deviations for the eight composite scores were as follows:
coordination of care (M= 6.94; SD= 2.32); continuity and transition of care (M= 4.54; SD=
1.96); physical comfort (M= 4.23; SD= 2.09); emotional support (M= 6.32; SD= 2.64);

59
information and education (M= 5.62; SD= 2.40); involvement of family and friends (M= 4.55;
SD= 1.49); respect for patient preferences (M= 3.55; SD= 1.14); and, overall impression of care
(M= 21.49; SD= 5.12).
I also calculated bivariate correlations for these composite scores (see Table 3). As can
be observed from these correlations, although these domains were weakly to moderately
correlated with each other, none of them were highly correlated. This finding implied that while
interrelated, each measure of patient assessments of care captures a somewhat different and
unique aspect of care; thus, lending support to the multi-dimensional notion for the
conceptualization of patient experiences of care - the position adopted in this study.
Factor Analyses and Reliabilities
Confirmatory Factor Analysis (CFA) models were tested using AMOS (Version 7)
computer program. No missing-data imputations were done on the data because AMOS has the
advantage of estimating SEM models in the presence of missing data using Maximum-
Likelihood estimation (the same estimation method used in the HLM program for fitting the
predictive hierarchical models).
Because of the likelihood of rejecting a model based on the chi-square test increases with
sample size, incremental measures of fit were more appropriate indicators of goodness of fit
(Arbuckle et al., 1999) and I used them as the model-fitting criteria in this work. As discussed in
the methods section, I used NFI; RFI; IFI; TLI; CFA; and, RMSEA indices. Values of .90 or
higher for NFI; RFI; IFI; TLI; and, CFA and values of .08 or less for RMSEA were considered
indicative of a good-fitting model. I also used an additional measure of absolute-model fitting
criteria (AIC), in cases where a reduced model was sought, if an original full model (i.e., a

60
model with all hypothesized items) failed to achieve adequate fit. Therefore, I compared the
AIC value across different models (full and reduced), in conjunction with other indices
mentioned above, in order to arrive at the best CFA solution. Cronbach’s-alpha values of .70 or
higher have been accepted universally to be indicative of internal-consistency reliability; this
practice was adopted in this study.
As discussed in detail in the methods section, CFA model were estimated for each of the
eight domains to test whether each group of items taped its underlying domain, per the Picker
Methodology. CFA models were tested separately for each domain and the model-fit criteria
were evaluated. Where applicable, modifications to the models using critical ratio difference
statistics were used to improve model fit, if a model did not generate the appropriate model fit
criteria. Alternatively, and as a last resort, I considered removing items from a CFA model
(generally one/or two items at most) if adequate model fit was not obtained via the critical ratio
differences improvements. Model fit indices and internal consistency reliabilities for the original
and final CFA models are presented in Table 8.
1. Coordination of Care
According to the Picker methodology, six items tap this domain. A chi-square test of the
CFA model that tested the hypothesis that these items did not adequately fit this domain was
rejectable statistically because of large sample size, χ2= 654, p-value= .00. However, the model
fitted the data well in terms of the incremental model-fit indices: NFI= .96; RFI= .91; IFI= .96;
TLI= .91; CFA= .96; RMSEA= .05. Moreover, the cronbach’s alpha for this model was 0.69,
which just meets the minimum value for adequate internal-consistency reliability. Therefore, the
CFA results for this model supported the hypothesis that all of these items belong to the
coordination of care domain. Thus, creating a composite score using these items (summative

61
score in this case) was supported in terms of both validity and reliability. A graphical depiction
of this measurement (CFA) model, along with the estimated standardized coefficients for each
path, is presented in Figure 2.
Coordinationof care
.23
Scheduled tests/proceduresw ere on time
e_cd6
.45
Organization of ED care
e_cd1
.50
Organizationof admission
process
e_cd2
.39
Length of timew aited to
get to room
e_cd3
.05
One drin chargeof care
e_cd4
.14
Dr/nursesexplained things
differently
e_cd5
.38 .48.67
.70.23 .63
Figure 2: SEM Model for the Coordination of Care Domain
2. Continuity and Transition of Care
Per the Picker methodology, four items belong to this domain. However, the CFA model
that encompassed these four items failed to meet the desired levels for three of the six
incremental model-fit indices (RFI= .75; TLI= .75; and RMSEA= .16). However, the values for
the other indices (NF; IFI; and CFI) were acceptable with corresponding values over .90. Efforts
to improve model fit using results from critical-ratio differences statistics were not successful in
producing a better-fitting model. Therefore, I had to resort to deleting one of the four items and
then tested whether a reduced model could fit the data better. Upon reviewing the standardized

62
regression coefficients from the full CFA model, I decided to remove the item with the lowest
SMC and standardized regression values. Applying these criteria, I dropped “staff explained
purpose of home medicines” item from the model, which had a SMC value of = .40 and a
standardized regression coefficient in the path predicting the latent domain of .63. Although the
beta for this regression path seemed high, it was the lowest coefficient of all items predicting this
domain.
On the other hand, the reduced CFA model (with three items)12 met the entire
incremental-model fit and the internal-consistency reliability criteria: NFI= .99; RFI= .98; IFI=
.99; TLI= .98; CFA= .99; RMSEA= .04; cronbach’s alpha= .76. A graphical depiction of this
measurement (CFA) model, along with the estimated standardized coefficients for each path, is
presented in Figure 3.
Continuityof care
.44
Discussion onresume normal
activities
e_ct4
.42
Discussion onmedication
side effects
e_ct2
.74
Discussion ondanger signalsto w atch for
e_ct3
.66
.86
.65
Figure 3: SEM Model for the Continuity and Transition of Care Domain
12 In order to achieve identification for this model, I imposed one constraint (supported by the CR differences test statistics), whereby I assumed equal variance for the “discussion of medication side effects” and “discussion of when you can resume normal activities,” since it is theoretically conceivable to assume that these two aspects of discharge instructions will have equal variances. This hypothesis was also supported empirically, since the value of the critical-ratio difference statistics for these two parameters was below 1.96.

63
3. Physical Comfort
The Picker methodology conceptualizes that five items uniquely tap this domain.
Unfortunately, a CFA model with these five items did not yield acceptable values for RFI or TLI
(with value of .78 for both indices), although the values for the remaining indices (NFI; IFI, and
CFI) ranged acceptably from .92 to .93, the RMSEA value was also acceptable (.08), and, the
cronbach’s alpha was .72. Therefore, I first considered improving model fit by imposing several
constraints using the CR differences tests. The model improved a little bit with the added
constraints, yet it did not reach the required model-fit values (and the AIC value was actually
higher than that in the baseline model). Subsequently, I resorted to dropping the least predictive
item from the original model (“minutes for help after call button”).
The resulting reduced model improved upon the previous two models substantially (with
an AIC value of 181) and NFI= .98; RFI= .92; IFI= .98; TLI= .92; CFA= .98; RMSEA= .05;
cronbach’s alpha= .73. A graphical depiction of this measurement model, along with the
estimated standardized coefficients for each path, is presented in Figure 4.

64
Physicalcomfort
.27
Help getting to the bathroome_ph1
.31
Minutes it took to get
pain medicinee_ph3
.82
Everything w as done to
control paine_ph4
.25
Amount of pain medicinereceived
e_ph5
.55
.52
.90
.50
Figure 4: SEM Model for the Physical Comfort Domain
4. Emotional Support
The original CFA model for this domain, conceptualized following the Picker
methodology consisted of six items. While this original model was reliable according to the
cronbach’s alpha criterion (.78), it failed to attain adequate RFI and TLI levels (with values of
.71) and had a yet poorer fit with respect to RMSEA (value was .13). None of the model
improvement constraints using the CR differences tests yielded a better-fitting model. A reduced
CFA model that excluded the “help pay bill” item from its structure was considered first, since
the beta for the path of this item predicating the latent variable was the smallest of all other items
(b= .26) and the SMC was only 0.04. Although this alternative model seemed plausible, the RFI,
TLI, and RMSEA values were even worse than the full model (corresponding values were .62,
.62, and .18, respectively). As result, I estimated other reduced models by dropping other items,

65
one at a time (the results of all these models were not presented here, but available upon request).
As a result, the best-fitting reduced model was the one without the “doctor discussed
anxieties/fears.” In the full CFA model, the “doctor discussed anxieties/fears” item had a
regression weight of (b= .64) for the path predicting the emotional support domain and a SMC
value of (.40). The model fit indices for this final model were all acceptable, as follows: NFI=
.97; RFI= .90; IFI= .97; TLI= .90; CFA= .97; RMSEA= .07; cronbach’s alpha= .74. A graphical
depiction of this revised measurement model along with the estimated standardized coefficients
for each path is presented in Figure 5.
Emotionalsupport
.26
Confidence/trust in dr
e_em2
.55
Nursediscussed
anxieties/fears
e_em3
.53
Confidence/rust in nurses
e_em4
.48
Ease of f inding someone to talk to
e_em5
.06
Help to paybill
e_em6
.73.24 .51
.74.70
Figure 5: SEM Model for the Emotional Support Domain
5. Information and Education
The original CFA model with the five items that tap this construct (according to the
Picker methodology) fitted the PEP-C data very well and better than any of all other Picker
domains and therefore no changes to this original model were necessary. The model fit indices
were as follows: NFI= .98; RFI= .95; IFI= .98; TLI= .95; CFA= .98; RMSEA= .04;

66
cronbach’s alpha= .76. A graphical depiction of this measurement (CFA) model, along with the
estimated standardized coefficients for each path, is presented in Figure 6.
Information& education
.52
Explanationof testresults
e_inf5
.38
Enoughinformation
about treatmente_inf1.14
Reason forw ait in going
to room
e_inf2
.51
Dr answ eredquestions
understandably
e_inf3
.34
Nurse answ eredquestions
understandably
e_inf4
.71
.72
.62
.59
.37
Figure 6: SEM Model for the Information and Education Domain
6. Involvement of Family and Friends
This domain is comprised of just three items according to the Picker methodology.
Therefore, the model was just identified in AMOS with regression paths estimable but not
enough degrees of freedom existed in the model for the fit indices to be estimated. Therefore, I
had to impose one constraint on this model to render it overidentified. Conceptually, one can
hypothesize that “whether family was given information” and “amount of information given to
family” have equal variances given that these two items are related to each other conceptually.
In addition, the CR difference test for the variances of these items was below 1.96, lending
support for the hypothesis that these two variances are equal. Therefore, I estimated a second
CFA model for this 3-item domain structure after imposing an equality constraint on those two

67
variances. Not surprisingly, this model fitted the PEP-C data very well: NFI= .99; RFI= .97;
IFI= .99; TLI= .97; CFA= .99; RMSEA= .05; cronbach’s alpha= .69. A graphical depiction of
this measurement (CFA) model, along with the estimated standardized coefficients for each path,
is presented in Figure 7.
Involvementof family &
friends.67
Family hadenough say
about treatmente_iff1
.31
Amount ofinf given to family
e_iff2
.36
Family givenenough info tohelp recovery
e_iff3
.82
.56 .60
Figure 7: SEM Model for the Involvement of Family and Friends Domain
7. Respect for Patient Preferences
The original Picker methodology hypothesizes that this domain is comprised of four
items. This hypothesized model did not fit the data according to any of the model fit indices
(value of about 0.80 on all of the 5 indices) and a cronbach’s alpha of .60. Attempts to improve
the model via imposing equality constraints were not substantiated empirically. Therefore, I had
to consider dropping an item. Since “enough say about treatment” had the lowest standardized
path weight with the latent domain (b=0.2) and the lowest SMC of all items (0.04), it was
logically the first item to consider for dropping from the model. Accordingly, a reduced CFA
model without “enough say about care” was estimated. All of the model fit indices for this

68
model were all very satisfactory: NFI= .99; RFI= .98; IFI= .99; TLI= .98; CFA= .99; RMSEA=
.0413. The only exception to the acceptability of this reduced model was the low cronbach’s
alpha of .60. However, recalling that the corresponding value for the original model was not any
better (in fact it was the same as that of this reduced model), it did not seem that reliability could
get any better for this domain. Thus, although this reduced model was used as the composite
score for this domain, its low reliability was noted as a limitation when inferences related to
domain were made. A graphical depiction of this measurement (CFA) model, along with the
estimated standardized coefficients for each path, is presented in Figure 8.
Respectfor patient
preferences
.96
Nursestalked
in front of you
.34
Drs talkedin front of you
.08
Treated w ithrespect/dignity
e_r4 e_r2e_r1
.28.98
.58
Figure 8: SEM Model for the Respect for Patient Preferences Domain
13 Since this CFA model had only three indicators, it was just identified and an additional constraint had to be imposed to render it overidentified for model fit indices to be computed. Incidentally, this model had a negative value for the variance of the “nurses talked in front of you” item (-0.04), which is considered a type of model anomaly. The recommended course of action in this case is to fix this parameter to its nearest non-negative value (i.e., zero). Hence, fixing this variance parameter to zero eliminated this model anomaly and also attained the required model over-identification status.

69
8. Overall Satisfaction with Care
This domain is comprised of eight items according to the Picker methodology. A CFA
model with these eight items was reliable (with cronbach’s alpha of .92), however four of the
incremental fit indices did not meet acceptable levels: RFI= .75; TLI= .75; RMSEA= .20.
Therefore, I attempted several model improvement strategies using the results of the critical ratio
differences tests (such as, assuming equal variances for the “availability of nurses” and “courtesy
of nurses”; “availability of doctors” and “courtesy of doctors,” beside other modifications as
well). While such model improvements had theoretical grounding and were also supported by
the CR differences tests (values below 1.96), none of them were successful in achieving better
model fit on all incremental indices compared to the original model. As a result, I had to resort
to dropping one item at a time. As this approach was not successful, I was left with the only
option of having to drop two items at a time in search for a better fitting model. A reduced
model without “courtesy of doctor” and “courtesy of nurses” was the best fitting model among
all rested reduced models. While this reduced model makes some but no huge elimination of the
component aspects of this domain (since there are other indicators of nurses and doctors in the
model), it met the entire model fit criteria: NFI= .98; RFI= .95; IFI= .98; TLI= .95; CFA= .98;
RMSEA= .09; cronbach’s alpha= .90. Therefore, this reduced model was used for the
construction of the composite score for this domain. A graphical depiction of this measurement
model, along with the estimated standardized coefficients for each path, is presented in Figure 9.
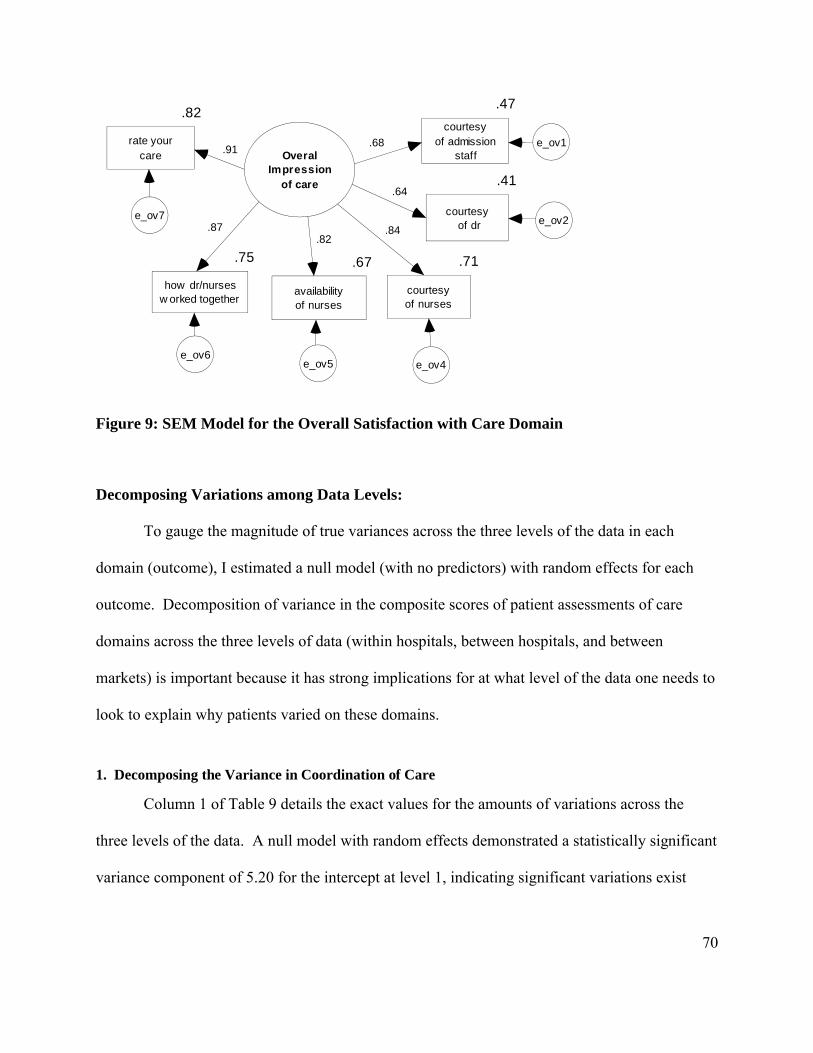
70
OveralImpression
of care
.47
courtesyof admission
staff
.41
courtesy of dr
.71
courtesyof nurses
.75
how dr/nursesw orked together
.82
rate yourcare
.67
availabilityof nurses
e_ov7
e_ov6e_ov5 e_ov4
e_ov1
e_ov2
.68
.84
.64
.91
.87.82
Figure 9: SEM Model for the Overall Satisfaction with Care Domain
Decomposing Variations among Data Levels:
To gauge the magnitude of true variances across the three levels of the data in each
domain (outcome), I estimated a null model (with no predictors) with random effects for each
outcome. Decomposition of variance in the composite scores of patient assessments of care
domains across the three levels of data (within hospitals, between hospitals, and between
markets) is important because it has strong implications for at what level of the data one needs to
look to explain why patients varied on these domains.
1. Decomposing the Variance in Coordination of Care
Column 1 of Table 9 details the exact values for the amounts of variations across the
three levels of the data. A null model with random effects demonstrated a statistically significant
variance component of 5.20 for the intercept at level 1, indicating significant variations exist
71
within hospitals on this domain, when no predictors are included in the model. The between-
hospital variance was estimated at .18, and the between-market variance was estimated at .04.
Therefore, 95.9% of the variance was within-hospitals, 3.35% was between-hospitals, with a
small proportion of the variance (.75%) was between markets. Two other statistics were helpful
in interpreting these variance components. First, Table 9 presents chi-square tests of the
hypothesis that the true variance between hospitals was null, in which case the estimated
variance of .18 would be an artifact of chance. This hypothesis was easily rejected because of
the observed size of the chi-square of 732.3 far surpassed the critical value at the .01 level based
on 127 degrees of freedom. Similarly, the hypothesis that the true between-market variance was
null was rejected, as the chi-square of 80.2 exceeded the critical ratio at the .01 level, based on a
45 degrees of freedom.
Table 9 also provides information about the reliability of estimates at the hospital and
market levels. The reliability of discriminating between hospitals within markets was estimated
to be .80, whereas the reliability of discriminating between markets was estimated to be .33. The
three-level program does not calculate estimated of the reliability of the within-hospital level
differences. However, we know that the internal consistency of the coordination of care
composite-score was .69, implying that the majority of the variance was not due to measurement
error.
In sum, the majority of the variance on the coordination of care composite score was
within hospitals, 3.35% was between hospitals, and only .75% of the true variance was attributed
to differences between hospital markets. These results support the need for controlling patient-
level differences (within hospitals) prior to including organizational and market-level predictors.

72
While the variations between hospitals and between markets were small in magnitude, compared
to the within-hospital variations, investigation of specific predictors at the organizational and
market level was of enough measurable size to warrant investigation.
2. Decomposing the Variance in Continuity and Transition of Care
The results for continuity and transition of care are listed in column 2 of Table 9. The
estimated true within-hospital variance was 3.79; the estimated true between-hospitals variance
was .02; and the estimated true between-market variance was about .01. As such, 99.12% of the
variance in this domain was within hospitals, and the less than 1% remaining segment of the true
total variance was partitioned between hospitals (.65%) and between markets (.23%).
Regardless of the minute amounts of variation that were attributed to between-hospital and
between-market differences, the hypotheses that hospitals did not vary at these levels were
strongly rejected (chi-square value at level 2 was 237.6 on a 127 degrees of freedom was
significant at the .01 level; chi-square value at level 3 was .82.9 on 45 degrees of freedom was
significant at the .01 level). Likewise, the reliability estimates of these between-hospital and
between-market variances were .45 and .31, respectively.
3. Decomposing the Variance in Physical Comfort
The results for the physical comfort domain are listed in column 3 of Table 9. Similar to
the results from the continuity and transition of care, the unconditional model of the physical
comfort composite score revealed that almost all of the true variance was within hospitals. The
variance attributed to between-hospital differences was estimated to constitute .77% of the true
overall variance. The variance attributed to between-market differences constituted .23% of the
overall variance, while 99.10% of the overall variance was confined within hospitals. The

73
between-hospital variance had a reliability estimate of .46 that was statistically significant at the
.01 level. On the other hand, the between-market variance had a relatively lower reliability (.20)
and was marginally significant at the .05 level.
4. Decomposing the Variance in Emotional Support
The results for the emotional support domain are presented in column 4 of Table 9.
About 1.25% of the true overall variance in this domain was between hospitals and 1% was
between markets, while the vast 97.76% of the variance was within hospitals. Both between-
hospital and between-market variances were highly significant at the .01 level and the reliability
estimates for these variances were .61 and .54, respectively.
5. Decomposing the Variance in Information and Education
The results for the information and education domain are shown in column 5 of Table 9.
Of the true overall variance in this domain, 2.44% existed between hospitals, .53% was between
markets, whereas most of the variance (97.03%) was within hospitals. Hypotheses that between-
hospitals and between-market variances are not statistically significant were rejected at the .01
level. The reliability estimates for between-hospital and between-market variances were .64 and
.32, respectively.
6. Decomposing the Variance in Involvement of Family and Friends
The results for this domain are listed in column 6 of Table 9. Less than 1% of the overall
true variance in this domain existed between hospitals and between markets (.49% and .34%,
respectively) while a massive 99.17% of the variance was due to differences within hospitals.
Estimates of between-hospital and between-market variances had reliability estimates of .38 and

74
.40, respectively, and both estimates were statistically significant at the .01 level.
7. Decomposing the Variance in Respect for Patient Preferences
The results for this domain are listed in column 7 of Table 9. While .58% of the total true
variance in this outcome existed between-markets, 2.34% was between hospitals, and 97.08%
was within hospitals. Both between-hospital and between-market variances were statistically
significant at the .01 level and had reliability estimates of .74 and .34, respectively.
8. Decomposing the Variance in Overall Satisfaction with Care
The results for this domain are listed in column 8 of Table 9. The variability between
markets accounted for only .59% of the overall true variance, whereas 3.24% of the true variance
was between hospitals, and a considerable 96.17% of the variance was attributed to patient
differences (within hospitals). Between-hospital variance had an estimated reliability of .80 and
between-market variance had an estimated reliability of .29 and both estimates were statistically
significant and the .01.
9. Summary
Decomposition of variance at these scales is important because it has strong implications
for where one might look to explain why hospitals varied in terms of the experiences of patients
about their care. Having identified the components of variance in each outcome, the next step of
the analysis was to employ three level regression models to predict these variations.

75
Conditional Models
The approach I took to estimate the three-level conditional models was detailed in the
methods chapter. In brief, baseline models (conditional only at level-one) were fitted first, then
conditional models at level two were fitted, and finally conditional models at level three were
fitted. The results for the three final conditional models for each outcome are shown in Table 10.
Predictors of interest are listed in the first column. If a predictor was not related to an outcome,
the Table leaves its estimate blank. The results are also described separately for each outcome as
follows.
I. Results for Process Measures
1. Results for Coordination of Care
a. Patient-Level Predictors
Although organizational and market characteristics were the predictors of prime interest
in this study, their estimates would not have been accurate unless relevant patient-level
predictors were also controlled for in the same conditional models. Therefore, patient-level
predictors (k=9) were added to models at level one. Furthermore, models with patient
characteristics also served as baseline models (beside null models) against which subsequent
models were compared, to measure the effect of organizational and market characteristics on the
outcome, net of the effects of patient characteristics.
The coordination of care composite score ranged from 1-18, whereby the lower the score,
the fewer the problems reported by patients; conversely, the higher the score, the more problems
reported by patients on this domain. The grand mean for coordination of care, adjusted for mean
differences in patient characteristics, was 6.88, which was statistically significant at the .01 level.

76
This grand mean represented the mean for male, medical, with more than high school education,
private health insurance, good to excellent health status, and non-white patients.
As presented in Table 10, on average, the gap between surgical and medical patients (b= -
1.22) was the largest in magnitude of all level-one predictors. This means that surgical patients
reported 1.22 fewer problems with this domain compared to medical patients, controlling for
other predictors. Recalling that the standard deviation for the coordination of care composite
score was 2.32, thus the effect of surgical service can be interpreted as .52 decrease in standard
deviation units of the outcome. With an effect size of (b= .62), lower health status corresponded
to a .26 increase in standard deviation units of the coordination of care composite score, all else
equal. Medicaid insurance was associated with .31 unit increase in the coordination of scare
scale, compared to non-Medicaid insurance (b= .31), controlling for other predictors. The gap
between nonwhite and white patients was .26 and the gap between female and male patients was
-.20, all else equal. Age had a small effect size on this domain (b= -.01). Neither high school
education nor Medicare insurance was uniquely associated with the coordination of care domain.
b. Hospital-Level Predictors
Per the model-building approach of this study, predictors at level 1 with t-ratios of 1.5 or
higher were retained in the model, as level-two predictors were added. Net of each other, only
four level-two predictors were significant according to the same t-ratio criterion used at level 1.
Teaching Status was unfavorably associated with coordination of care (b= .14), although the
effect was rather small in magnitude (.06 increase in standard deviation units); this translates to
an effect of 3 *.06= .18 increase in standard deviation units of the coordination of care score for
hospitals with the highest level of teaching-status level. RN/inpatient days had a favorable effect
of just .01 decrease in standard deviation units (b= -.03). Occupancy rate had a small effect

77
(b= 0.004), indicating that a 10% increase in occupancy rate was unfavorably associated with a
.02 increase in standard deviation units of the outcome. The last significant predictor at the
organizational level was resources directed to patient care (b= -.00001). Recalling that the
average ratio was 60,980; thus, an increase of 10,000 in this ratio was associated with a favorable
.1 decrease in the coordination of care score (an effect equal to .04 decrease in standard deviation
units).
c. Market-Level Predictors
Market-level predictors were added at level three. Significant predictors from models 1
and 2 were retained in this model, with the exception of RN/inpatient days as it was rendered
insignificant by the addition of the level-three predictors. I performed a likelihood ratio test to
compare conditional market-level models with and without RN/inpatient days. The results
showed that the model with RN/inpatient days did not improve model fit in the fully-conditional
model; therefore, this predictor was removed from the final model.
Although the proportion of variance at level three was the smallest of variances at the
three data levels, six market-level predictors, net of each other and other predictors, were
significant in predicting this variance. The market-level predictor with the highest effect size
was LPN/population (b= -.68), indicating that as the LPN/population ratio increased by one unit,
there was a corresponding favorable decrease of .68 in the coordination of care problem score
domain (equivalent to a .29 decrease in standard deviation units). HHI was unfavorably
associated with this domain (b= -.57), indicating that as the HHI increased by one unit (and
hospitals were less competitive), the coordination of care problem score decreased by .24
standard deviation units. HMO penetration rate had an equal effect size as HHI (b= -.55),
although it was in the opposite direction, since a one unit increase in HMO penetration rate

78
was associated with a .55 lesser problems on the coordination of care scale. Contrary to the
organizational-level model, teaching status at the market level was associated with lower
problem scores. However, this effect was small (b= -.03), corresponding to a .01 decrease in
standard deviation units. Percentage of minority population had a tiny favorable effect (b= .001),
indicating that the higher the minority population, the fewer problems reported with coordination
of care, contrary to the effect of white race at the patient level. Medicaid days/population has a
minute unfavorable effect (b= .0007), which means as that as this ratio increased, there was a
minute increase in the composite score. Excess capacity had a borderline unfavorable effect (b=
0.004), thus it was not included in the final model because of its low t-ratio of 1.4.
d. Variance Explained by Models
Most of the true overall variance in the coordination of care problem score existed within
hospitals (95.9%) and the remaining variance existed between hospitals (3.35%) and between
markets (.75%). As shown in Table 11, patient-level predictors accounted for 12.79% of the
within-hospital variance at level 1, 23% of the true variance at the organizational level, and
38.29% of the true variance at the market level of the coordination of care composite score.
At model two, the addition of organizational-level predictors further explained 11.63% of
the between-hospital variance in the baseline model. Recalling that the baseline model was
conditional at level 1 (with patient-level predictors), it was expected that this model also
accounted for some of the between-hospital and between-market variances (since predictors at
level one were grand-mean centered, as described earlier). Remarkably, model 2 explained a
sizable 80.56% of the true between-market variance in the baseline model.
At model three (with market predictors added), an impressive 98.96% of the between-
market variance in the baseline model was explained. Furthermore, model 3 improved the

79
baseline model’s explained between-hospital variance to 27.12%.
2. Results for Continuity and Transition of Care
a. Patient-Level Predictors
On average, the adjusted mean score for continuity and transition of care across patients,
hospitals, and markets was 4.53 and was statistically significant at the .01 level. Results for
tested predictors, net of each other, are presented below. The gaps between surgical and medical
service (b= -.28), Medicaid and non-Medicaid insurance (b= -.08), Medicare and non-Medicare
insurance (b= -.06), and less than high school and high school or more education (b= -.31) were
all favorably associated with this domain. Nonetheless, predictors with unfavorable relationships
with this domain were: low health status (b= .49), female gender (b= .19), non-white race
(b= .07), and, age (b= .002).
b. Hospital-Level Predictors
Only two organizational predictors were associated with the continuity and transition of
care composite score: RN/inpatient days and resources directed to patient care, net of other
predictors. RN/inpatient days was favorably associated with this domain (b= -.02),
corresponding to a .01 decrease in standard deviation units of the outcome for every unit increase
in this predictor. On the other hand, the size of the relationship with resources directed to patient
care (b= -.000001) was very small, yet favorable.
c. Market-Level Predictors
The results of the conditional level-three model for the continuity and transition of care
need to be taken with caution, because the reliability for the level-2 intercept (which was
modeled at level-three as a function of level-3 predictors) was reduced from .002 (when all level-

80
3 predictors are added) to .000 when predictors with less than 1.5 t-ratios were dropped.
However, of all potential market-level predictors, only percentage of minority population was
associated with the continuity and transition composite score (b= .007); this effect was not
favorable and translate to about .004 increase in standard deviation units of the outcome per one
unit increase in this predictor.
d. Variance Explained by Models
As presented in Table 11, the conditional level-one model (with patient characteristics as
the only predictors in the model) explained 4.15% of the true within-hospital variance in the null
model. The conditional level-two model (with organizational predictors added at level-two)
explained 6.54% of the residual between-hospital variance in the baseline model (conditional
level-one model). This model also explained 25% of the residual between-market variance in the
null model. Nonetheless, the conditional level-three model explained almost all of the between-
market variance (99.91%) in the baseline model. However, the findings from this market-level
model should be taken with caution due to the lack of reliability at this level.
3. Results for Physical Comfort
a. Patient-Level Predictors
On average, the mean score for the physical comfort domain across patients, hospitals,
and markets was 4.2 and was statistically significant at the .01 level. Net of each other, all
patient-level variables included in this study were associated with the physical comfort
composite score. By far, lower health status had the highest association with this outcome
(b= .49), indicating that patients with lower health status had .49 higher problem score compared
with patients with good or better health status. The effect of lower health status was equivalent

81
to a .23 increase in standard deviation units of the physical comfort composite score. The gaps
between surgical and medical service, female and male gender, Medicaid insurance and non-
Medicaid insurance were .31, .27, and, .23, respectively, which correspond to .15, .13, and, .11
increase in standard deviation units. The gaps between lower than high school education and
high school education and over, and Medicare and non-Medicare insurance were favorable and
of comparable magnitude (b= -.16) and (b= -.14), corresponding to about .07 decrease in
standard deviation units. The gap in white and non-white race was small (b= .07). Age had the
smallest association with the physical comfort domain of all level-one predictors (b= -.02),
indicating that a 10-year increase in age corresponds to a tiny .1 decrease in standard deviation
units of the physical comfort domain, which is a favorable, albeit weak effect.
b. Hospital-Level Predictors
Both nursing staffing variables were associated with the physical comfort composite
score. However, the effect of LPN staffing was unfavorable (b= .06), while the effect of RN
staffing was favorable (b= -.03). Nonetheless, the effect of both staffing variables was rather
small, with only .03 and .02 standard deviation change in the physical comfort score for every
unit change in these predictors. Teaching status had an unfavorable effect with this domain (b=
.04), which equals about .02 increase in standard deviation units of the physical comfort
composite score for every unit increase in teaching status. Finally, the only other hospital-level
predictor associated with physical comfort was resources directed to patient care (b= -.000002), a
favorable, yet very small, association.
c. Market-Level Predictors
At the market level, 5 predictors were associated with the physical comfort composite
score, net of each other and other predictors. LPN/population and HMO penetration were both

82
unfavorably correlated with this domain (b= .34) and (b= .28), with respective effects of .16 and
.14 increase in standard deviation units for every unit change in these predictors. Likewise, the
effect of hospital HHI was unfavorable (b= -.20), which is equivalent to a .09 increase in
standard deviation units of the outcome for every decrease in hospital HHI. Medicaid
days/population had a favorable, though small, association with physical comfort (b= -.0009).
Finally, there was a favorable minuscule association between resources directed to patient care
and this domain (b= -.0001).
d. Variance Explained by Models
As presented in Table 11, only .77 % of the true overall variance in the physical comfort
composite score was between hospitals, with even a tinier amount of .13% existed between
markets, and the almost the exclusive majority (99.10%) of the true variance was within
hospitals.
Patient-level predictors at level one explained only 5.9% of the massive within-hospital
variance. Incidentally, patient-level predictors also accounted for 27.45% of the true between-
hospital variance and another sizable 54.93% of the true between-market variance.
Organizational-level predictors explained 14.24% of the between-hospital variance in the
baseline model. In total, the conditional-level-two model explained 37.78% of the null-model’s
between-hospital variance. The conditional market-level model explained 99.62% of the true
between-market variance in the baseline model. It also explained 50.64% of the true between-
hospital variance in the null model (and also explained 31.97% of the baseline model’s between-
hospital variance).

83
4. Results for Emotional Support
a. Patient-Level Predictors
On average, the mean of the emotional support composite score across patients, hospitals,
and markets was 6.25 and was statistically significant at the .01 level. Net of each other, patient-
level predictors, with exception of education and Medicaid insurance, were associated with this
domain. The largest association at this level was that with lower health status (b= .70), which
constitutes about a .26 increase in the emotional support problem score, an unfavorable effect.
The surgical and medical service gap was favorable (b= -.34) and translates to about a .13
decrease in standard deviation units. The female and male gap in emotional support was (b= -
.11); which was favorable and equivalent to a .04 decrease in standard deviation units. Both the
gaps of Medicare and non-Medicaid, and white and non-white race were favorable with
estimated effects of (b= -.30) and (b= -.26), respectively, translating to about a .11 decrease in
standard deviation units.
b. Hospital-Level Predictors
Net of other predictors, there was a favorable association with RN staffing (b= -.04)
translating to a .02 decrease in standard deviation units of the emotional support composite score.
There was an unfavorable effect of more than twice the size of RN staffing for teaching status
(b= .11). Once more, resources directed to patient care had a slight, yet favorable, association
with patient assessments of care (the emotional support domain, in this case) (b=. –000002).
c. Market-Level Predictors
Results for these predictors are presented below net of other predictors and net of each
other. While HMO penetration rate had a favorable association with the emotional support
composite score (b= -.42) (.16 decrease in standard deviation units per one unit increase in this

84
predictor), hospital HHI was unfavorably associated with it (b= -.34) (a .13 decrease in standard
deviation units per one unit increase in this predicator). Both nurse-staffing variables at this
level were associated with the emotional support composite score. However, the association was
favorable and over 3 times higher for LPN/population with an effect size of (b= -.23), which was
about .09 decrease in standard deviation units, for every unit increase in LPN ratio. On the other
hand, the effect of RN/population was unfavorable (b= .06). The following predictors were
associated with this composite, although these associations were minute in magnitude: teaching
status (b= -.01), percentage of minority population (b= .01), excess capacity (b= .004), and per
capita income (b= .000003). Notably, of these three predictors, teaching status was the only one
with favorable effect. It was also notable that this favorable effect of teaching status at the
market level contradicts its unfavorable effect at the hospital level for this domain.
d. Variance Explained by Models
As presented in Table 11, the between-market variance constituted 1% of the overall true
variance in the emotional support composite score and the between-hospital variance constituted
1.24% of overall variance. However, the rest of overall variance (97.76%) was within hospitals.
The conditional level-one model accounted for 5.28% of the true within hospital variance,
31.31% of the between-hospital variance, and 41.4% of the between-market variance.
Conditional level-two model (with organizational characteristics) explained 11% of the true
between-hospital variance of the baseline model, and a total of 38.87% of the between-hospital
variance of the null model. Conditional level-three model (with market characteristics)
explained an impressive 99.9% of the between-market variance in the baseline model.

85
5. Results for Information and Education
a. Patient-Level Predictors
The intercept for the information and education domain was 5.59, indicating that, on
average, the mean score for the average patient in an average hospital in an average market was
5.59 and was statistically significant at the .01 level. Net of other predictors, the gap between
surgical and medical service was favorably associated with this domain. Also, predictors with
favorable association were female (b= -.19), white (b= -.22), Medicare insurance (b= -.08), and
age (b= -.09). However, predictors with unfavorable relationship with this domain were: lower
health status (b= .63), Medicaid insurance (b= .27), and less than high school education (b= .08).
b. Hospital-Level Predictors
Net of each other and other predictors, only three organizational- (hospital) level
predictors were associated with the information and education composite score: teaching status;
RN staffing; and resources directed to patient care. The effect of teaching status was unfavorable
(b= .09); corresponding to about .04 increase in standard deviation units for every unit increase
in teaching status) and was more than twice as large in magnitude as the effect of RN staffing.
Conversely, the effect of RN staffing was favorable (b= -.04). Thirdly, the effect of resources
directed to patients care was negligible in magnitude, yet favorable (b= -.000003).
c. Market-Level Predictors
Of the ten market-level variables tested at level 3, seven were associated with the
information and education composite score, all else equal. The largest of these associations
pertained to hospital competition (HHI index), HMO penetration rate, and LPN/population:
respective slopes were (b= -.64), (b= -.55), and (b= -.52). In standard deviation units of the
information and education composite score, these effects translate to .27, .23, and .22 decreases
86
for every unit increase in these predictors, respectively. These associations were favorable
except for hospital HHI. Another predictor that had a favorable association here was teaching
status, despite its tiny size, (b= -.02), which corresponds to a .01 decrease in standard-deviation
units. The other three significant predictors (percentage of minority population, Medicaid days,
and, resources directed to patient care) had minimal unfavorable effects of (b= .008), (b= .0008),
and (b= .0001), respectively.
d. Variance Explained by Models
As shown in Table 11, the majority of the variance in the information and education
composite score was within hospitals (97.03%), while 2.44% was between hospitals, and only
.53% was between markets. The conditional patient-level model explained 11.41% of the
variance at level one (the within-hospital variance). This model also accounted for 30.81% of
the variance at level 2 (between hospitals) and 40.89% of the variance at level 3 (between
markets). The conditional organizational-level model explained 6.81% of the residual between-
hospital variance in the baseline model, thus the explained between-hospital variance at the null
model increased to 35.52%. The conditional market-level model explained 99.67% of the of the
between-market variance in the null model and also explained 23.92% of residual between-
hospital variance in the baseline model.
6. Results for Involvement of Family and Friends
a. Patient-Level Predictors
On average, the mean score of involvement of family and friends was 4.57 and was
statistically significant at the .01 level. Net of other predictors, whilst female gender (b= .07)
and lower health status (b= .27) were unfavorably associated with this domain, surgical service

87
(b= -.18), Medicaid insurance (b= -.14), Medicare insurance (b= -.11), age (b= -.09), and less
than high school education (b= -.05), were favorably associated with this domain. White race
was not associated with this domain.
b. Hospital-Level Predictors
All else equal, three hospital-level variables were predictive of the involvement of family
and friends composite score. Teaching status was associated unfavorably with this domain, with
a small association of (b= .03), which is equivalent to about .02 increase in standard deviation
units per one unit increase in the teaching status. On the other hand, LPN staffing, and resources
directed to patient care were favorably associated with this domain, (b= -.06) and (b= -.000003),
respectively. Notably, the size of the association of LPN staffing corresponded to a .04 decrease
in standard deviation units for every unit increase in this predictor.
c. Market-Level Predictors
All else equal, the largest associations at the market level with the involvement of family
and friends composite pertained to LPN staffing and HMO penetration rate as both relationships
were also favorable (b= -.26) and (b= -.13) translating to a decrease of .18 and .09 in standard
deviation units for every unit increase in these predictors, respectively. There were also smaller,
yet favorable, relationships with this domain and teaching status, excess capacity, and per capita
income with respective associations of (b= -.01), (b= -.0010), and (b= -.000003). The only
predictor that had an unfavorable association at this level was percentage of minority population
(b= .004).
d. Variance Explained by Models
As shown in Table 11, very small amounts of the true overall variance in this domain
existed between markets (.34%) and between hospitals (.49%), whereas the vast majority of the
88
variance (99.17%) existed within hospitals. Despite the large amount of within-hospital
variance, patient characteristics at level 1, explained only 3.4% of this variance. However, the
conditional level-1 model also explained 18.12% of the between-hospital variance and 64.48% of
the between-market variance. The conditional level-two model (with organizational
characteristics) explained 16.74% of the baseline model’s residual between-hospital variance.
Therefore, a total of 31.12% of the null model’s between-hospital variance was explained by the
addition of organizational characteristics at level two. The conditional level-three model (with
market-level characteristics) explained a tremendous 99.48% of the true between-market
variance in the null model.
7. Results for Respect for Patient Preferences
a. Patient-Level Predictors
On average, the mean of the respect for patient preferences composite score across patients,
hospitals, and markets was 3.55 and it was statistically significant at the .01 level. There was no
association between surgical service and this domain, all else constant, unlike results from the
process quality domains. White race (b= -.27), female gender (b= -.03), and age (b= -.004) were
the only predictors with favorable relationships with this domain at level one of the model, all
else constant. On the other hand, Medicaid insurance (b= .23), lower health status (b= .19), less
than high school education (b= .05), and Medicare insurance (b= .03) were all unfavorably
related to this domain, controlling for other predictors.
b. Hospital-Level Predictors
Controlling for other predictors, teaching status and the percentage of Medicare share of
inpatient days were unfavorably associated with the respect for patient preferences composite
89
score: (b= .05) and (b= .001), respectively. The effect of Medicare payor mix corresponded to
about .04 increase in standard-deviation units of the outcome per one-unit increase in this
predictor (b= .001). RN/inpatient days and resources committed to patient care had favorable
relationships with this domain, (b= -.02) and (b= -.000001), respectively, all else constant.
c. Market-Level Predictors
The largest association at the market-level predictors pertained to HHI (b= -.15). However,
this relationship was unfavorable and corresponded to about .13 increase in standard-deviation
units of this domain for every unit increase in hospital HHI, all else constant. Similarly,
unfavorable association was found for HMO penetration (b= .10), corresponding to a .09
increase in standard deviation units, per one-unit increase in this predictor. The remaining
significant predictors at this level (teaching status, percentage of minority population, excess
capacity, and Medicaid days) were also unfavorably associated with this domain, except for
teaching status, (b= -.01), (b= .003), (b= .001), and (b= .0002), respectively, all else constant.
d. Variance Explained by Models
As shown in Table 11, although a miniscule amount of .58% of the true overall variance
in the respect for patient preferences composite score existed between markets, a slightly larger
amount of variance (2.34%) existed between hospitals. However, the majority of the true
variance (97.08%) was within hospitals. Patient characteristics in the conditional level-one
model explained only 6.77% of the true variance at the within-hospital level. Nonetheless, this
model explained as much as 49.38% of the between-hospital and 93.98% of the between-market
variances. Organizational predictors explained 23.52% of the baseline model’s between-market
variance (which is the residual variance from the null model). Overall, organizational predictors
explained 61.28% of the null model’s between-hospital variance. Market characteristics in the

90
conditional level-three model explained 99.60% of the null model’s between-market variance.
This model also explained 70.26% of the null model’s true between-hospital variance.
II. Results for Overall Satisfaction with Care
a. Patient-Level Predictors
On average, the mean overall satisfaction composite score across patients, hospitals, and
markets was statistically significant at the .01 level, and was estimated at 21.9. It is notable that
this mean score was rather high compared to the mean scores for the process-quality domains,
which were problem-score scales. This finding is not surprising because previous research had
noted that satisfaction scores tend to be commonly high (Hays et al., 2006). Recalling that items
of overall satisfaction with care were measured in the Picker questionnaire using a satisfaction-
type likert scales (not problem scores), higher values on this outcome are considered favorable,
as opposed to the seven process-quality composite scores. All other predictors held constant,
lower health status (b= -1.60) and female gender (b= -.45) were both unfavorably associated with
this domain. Conversely, three other predictors were favorably associated this domain: surgical
service (b= .54), less than high school education (b= .38), and age (b= .01). There were no
relationships between this domain and Medicare insurance, Medicaid insurance, and white race.
b. Hospital-Level Predictors
As discussed in the methods section, total facility-level predictors where used at the
hospitals level (which means that measures of hospital characteristics used in this study were not
net of non-short term inpatient components). Therefore, at the organizational level, I decided to
include the dummy variable of whether a hospital maintained a nursing home unit or not (as a
control variable at this level). Overall satisfaction with care was the only domain among the

91
eight patient assessments of care domains where this control variable was significant and thus
should have been indeed controlled for when the relationship between predictors and the
outcomes was examined at the organizational level (b= .20). Therefore, controlling for
maintenance of a separate nursing home unit, three hospital-level predictors were associated with
the overall satisfaction with care, all else constant. RN staffing and resources directed to patient
care had favorable relationships with overall impression of care, estimated at (b= .14) and
(b= .000008), respectively. Conversely, teaching status had an unfavorable relationship (b= -
.22), which corresponds to a .04 decrease in standard deviation units per one unit increase in this
predictor.
c. Market-Level Predictors
All other predictors held constant, only four predictors were associated with overall
satisfaction with care, at the market level; the largest of which was hospital HHI (b= 0.90),
which corresponds to .18 increase in standard deviation units of overall satisfaction with care per
one unit increase in HHI; an unfavorable relationship, since the higher the HHI index (means the
lesser degree of competition among hospital), the higher the satisfaction score. Likewise, the
percentage of minority population had an unfavorable relationship (b= -0.03). Conversely,
teaching status and per capita income had favorable relationships with overall satisfaction with
care, estimated as (b= .04) and (b= .000007), respectively.
d. Variance Explained by Models
As shown in Table 11, most of the true variance in the overall satisfaction with care
composite score was within hospitals (96.17%), as opposed to proportions of between-hospital
(3.24%) and between-market (.59%) variances. Of the within-hospital variance, 10.97% was
accounted for by patient characteristics. Level-1 predictors also accounted for 12.66% of the
92
hospital-level variance and 2.28% of the market-level variance in the null model.
The conditional model at level two (with organizational-level predictors) explained 20.68% of
the between-hospital variance in the null model and it also explained 9.18% of between-hospital
variance in the baseline model. The conditional model at level three (with market-level
predictors) explained 99.55% of the true between-market variance. It also improved the
explained between-hospital variance of the baseline model to 25.53%.

93
CHAPTER 5: DISCUSSION
A major finding of this study was that true variations in patient assessments of care – in
terms of multidimensional domains of process quality, as well as overall satisfaction with care –
are abundant. Strikingly, most of the overall true variations in various measures of patient
assessments of care (95.9% - 99.17%) were predominately within hospitals (i.e., due to
differences among patients at the hospital level). On the other hand, a maximum of 3.35% of the
true overall variations existed between hospitals and up to 1% of the variations were attributed to
differences between hospital markets.
Having established the existence of true variations in process quality and overall patient
satisfaction with care, this study proceeded by testing several hypotheses of organizational and
market predictors in order to explain these variations. Despite the relatively small amount of
between-hospital and between-market variations, net of patient characteristics, organizational-
and market-level characteristics predicted a sizable amount of them: 9.76% - 61.28% of
between-hospital variations, and up to 99% of the between-market variations. Table 12 contrasts
the findings on each predictor to its respective directional hypothesis. Furthermore, the
interpretation and significance of the findings of these predictors are discussed below.
Discussion of Findings on Predictors
Taken together, nurse-staffing variables were favorably associated with almost all
domains of patient assessments of care, as predicted by resource dependency theory. At the
organizational (hospital) level, RN staffing had a much more pronounced effect than LPN

94
staffing; as RN staffing was predictive of most process quality domains as well as overall
satisfaction with care. LPN staffing was predictive of involvement of family and friends (while
RN staffing was not) and physical comfort. At the market level, the role of nurse staffing
variables was also favorable. However, the role of LPN staffing was much more pronounced at
the market level (than RN staffing). While RN staffing was only associated with emotional
support at the market level, LPN staffing was further associated with four additional process
quality domains: coordination of care, physical comfort, information and education, and,
involvement of family and friends.
As hypothesized, resources directed to patient care was a favorable predictor of all
domains of process quality and overall satisfaction with care, at the organizational level.
However, this relationship was rather small in size. At the market-level, this variable was
favorably predictive of physical comfort. Conversely, the relationship was unfavorable for
information and education.
At the organizational level, Medicare days was associated with only one domain of
patient assessments of care (respect for patient preferences), albeit this association was not
favorable, contrary to the hypothesis. On the other hand, there was no association between
Medicaid days and any of the patient assessments of care domains of this study. At the market
level, Medicaid days was unfavorably associated with four process quality domains, as
hypothesized: coordination of care, physical comfort, information and education, and, respect for
patient preferences.
At the organizational level, teaching status was unfavorably associated with overall
satisfaction with care and all process quality domains (except continuity and transition of care).

95
This unfavorable association was highest for coordination of care. This finding contradicted the
hypothesis of this study, but it agreed with the findings of (Fleming, 1981) and others.
Conversely, at the market level, teaching status was favorably associated, as hypothesized, with
overall satisfaction with care and several domains of process quality. Teaching status at the
market level was not related to continuity and transition of care (similar to results from the
organizational level) and also was not related to physical comfort. The conflicting direction of
association of teaching status between the organizational and market levels is puzzling. One
may be able to envision the relationship manifesting differently using different outcomes or
samples (given the mixed findings in the literature on this predictor), but it is hard to reconcile
such conflicting results across data levels of the same outcomes. However, given the lack of
examples in the literature, where teaching status is modeled at both the organizational level and
the market level, it is hard to exclusively argue against the tenability of this finding.
Furthermore, the results could partly be an artifact of not using identical measures of teaching
status at both levels. At the market level, membership in the council of teaching hospitals was
the only teaching-status measure used. However, at the organizational level, I also included
other measures of teaching membership in this predictor (such as AMA membership).
Therefore, future research that examines alternative measures of teaching status is called upon to
better understand the influence of this important predictor.
At the organizational level, coordination of care was the only measure of patient
assessment of care predicted by occupancy rate. Additionally, this relationship was rather small
and unfavorable, contrary to the hypothesis. At the market level, excess capacity was associated
with only three process quality domains and this association was favorable for involvement of

96
family and friends. However, it was unfavorable for emotional support and respect for patient
preferences; indicating that the higher excess capacity in a market, the higher the problem scores
reported on these two domains.
A trade-off clearly exists between quality of care and technical efficiency, as measured in
occupancy rate. For example, high occupancy rate while representing higher efficiency,
typically means some sacrificing of quality of care because higher occupancy rate means less
time spent with patients (Bates, Mukherjee, & Santerre, 2006). This logic could present another
explanation to this finding.
No relationship with ownership status was found in this study, controlling for other
predictors. Perhaps the fact that the sample of hospitals were primarily non-profits (government
and non-government hospitals); with only 7% investor-owned hospitals, there were not enough
variations in this variable to detect an effect for for-profit hospitals. So the comparison here
becomes mostly between government and non-government non-profit hospitals. However, the
findings of this study are also justifiable in the sense that they agree with some studies that
suggested that non-profit (government and non-government) hospitals react in similar ways to
market pressures; thus, perhaps they also behave similarly with respect to processes of care.
Hospital HHI of competition was highly correlated with overall satisfaction and process
quality domains (except continuity of care and involvement of family and friends). This
relationship was consistently unfavorable across various domains, indicating that patients
reported more problems with process quality domains and lower satisfaction of care in more
competitive (than less competitive) markets. Obviously, this finding contradicts the hypothesis
of this study and the predictions of resource dependency theory; resource dependency theory

97
predicts that hospitals in competitive markets will respond to competition from local hospitals by
offering better health care, as measured by patient assessments of care domains. Nonetheless,
this finding agrees with the finding of (Shortell & Hughes, 1988), who also found an unfavorable
relationship between hospital competition and hospital mortality. As Shortell and Hughes (1988)
concluded, when hospitals are faced with intense competition, they attempt to cut costs through
reduction in staff, elimination of selected services, and consolidation of services and
postponement of capital improvements. Hospitals may also forgo the development of new
programs and services that could improve the quality of care. Some of these initiatives,
undertaken in the name of efficiency could have a negative effect on the quality of patient care,
which in turn could lead to poorer processes of care and lower patient satisfaction.
Although HMO penetration rate was not associated with satisfaction with care, it was
highly associated with all process quality domains, with exception of continuity of care.
However, findings on the direction of association were mixed; as the relationship was favorable
for the most part (as hypothesized), physical comfort and respect for patient preferences were
unfavorably associated with it.
The fact that California has typically been one of the highest states in the country with
respect to HMO penetration rates could have some bearing on the unfavorable relationship of
HMO penetration and patient assessments of care. As argued by (Rivers & Fottler, 2004), high
rates of HMO growth may reduce quality because HMOs encourage hospitals to cut costs (by
forcing price competition), which reduces profit margins. Through selective contracting and
volume discounts, these lower margins might subsequently reduce resources (such as nursing)
used in patient care, thus reducing hospital quality of care. Indeed this line of reasoning can

98
justify the unfavorable assessments of care in market with high HMO penetration. Moreover,
such justification also does not contradict with resource dependency theory. Nonetheless, it
contradicts with the strategic action taken by hospitals. Specifically, this study posited that
higher process quality and overall patient assessments of care are the strategic action taken by
hospitals in response to the environmental factor of growth in HMO penetration. However, the
logic of Rivers and Fottler (2004) implies that cost reduction, rather than quality, is the strategic
action that hospitals pursue. Nonetheless, existing research has not yet established claims of
superior quality overall for managed care versus traditional plans (Mark et al., 2005). Therefore,
future research that also takes into account more information on the financial performance of
hospitals and the nature of the contractual agreements between HMOs and hospitals also need to
be incorporated when studying quality outcomes.
With regards to socio-economic market factors, percentage of minority population was
consistently unfavorably associated with overall satisfaction with care and almost all process
quality domains, as hypothesized. On the other hand, the higher the per-capita income of a
county, the more problems reported on two process quality domains: emotional support and
involvement of family and friends. However, county-level per capita income was favorably
associated with overall satisfaction with care.
Implications for Practice and Policy
There are substantial variations in health outcomes and the roots of these variations are
complex (Iwashyna et al., 2002). This study supported the robustness of patient assessments of
care in elucidating sources of variations within hospitals, between hospitals, and between

99
markets. A direct implication of this finding is that more attention should be given to patient-
centered, as opposed to the traditional mortality and morbidity, measures for elucidating sources
of variations in patient outcomes across patients, organizations, and markets. Patient-centered
measures can now be derived from several reporting systems of patient experiences, such as the
NRC Picker/California Hospitals Assessment and Reporting Taskforce (CHART) surveys and
the more recent and larger CAHPS® Hospital Survey effort. The CHART project began in
2004, as an extension of the PEP-C project to broaden the voluntary public reporting initiative in
California to include a variety of clinical measures, in addition to the a patient experience survey
(California Health Care Foundation, 2005). On the other hand, the CAHPS® Hospital Survey
effort is a result of the partnership between the Centers of Medicare and Medicaid (CMS) and the
Agency for Healthcare Research and Quality (AHRQ) to help consumers make more informed
choices when selecting a hospital and to create incentives for hospitals to improve the quality of
care they provide (Goldstein et al., 2005). The CAHPS® Hospital Survey has been piloted in
three states (Goldstein et al., 2005) and is soon to be in use across the country. Comprised of 16
questions assessing specific aspects of care and two hospital rating questions (plus demographic
and screener questions), the CAHPS® Hospital Survey taps seven domains of care: nurse
communication, doctor communication, nursing services, physical environment, pain control,
communication about medicines, and discharge information. Although there is much overlap
between the NRC Picker items (questions) and the CAHPS® Hospital Survey items, the NRC
Picker survey (i.e., CHART) added more questions items to improve reliability and create a
coordination of care domain, because this domain was emphasized by the Institute of Medicine,
as a key aspect of patient care (Anderson Rothman, Park, Hays, Edwards, & Dudley, 2008). In

100
fact, Anderson Rothman et al. (2008) found that the CHART survey improved reliabilities
(beyond CAHPS® Hospital Survey) and that the coordination of care domain was more closely
associated with overall rating of care and the willingness to recommend the hospital than several
other CAHPS® domains. While the PEP-C/CHART surveys offer the advantage of having more
items/domains of patient assessments of care from hospitals across California, the CAHPS®
Hospital Survey offers a standardized core of items/domains from hospitals across the country.
Therefore, where researchers are more interested in predicting core measures of patient
assessments of care, then the CAHPS® Hospital Survey would be ideal, because it will also
allow for studying variations across a variety of market areas and possibly more market-level
predictors. Nonetheless, the CHART survey and similar localized surveys would allow for in-
depth study of predictors of more specialized (non-core) measures of patient assessments of care,
such as coordination of care or interpreter services.
In addition to elucidating sources of variations across patients, hospitals, and markets,
this study was motivated by the limited research on macro-level (hospital-level and market-level)
predictors that can explain variations in patient assessments of care. Remarkably, macro-level
predictors accounted for a small portion of the true variations at the between-hospital and
between-market levels. Unexpectedly, however, the majority of the overall true variations in
patient assessments of care existed within hospitals. Furthermore, while patient demographic
and health insurance characteristics accounted for some of these variations, the majority of the
true variances at this level remained unexplained. This finding highly suggests that factors
within the health care provider experience (such as physician-patient relationship and nurse-
patient relationship) are the more likely determinants of the patient perceptions of care. The
101
implications of this conclusion are immense for hospital administrators, who want to improve
patient experiences at their hospitals, and for policy makers. Indeed, one would be tempted to
think that the characteristics of the hospital or the market, which are fairly hard to change,
account for most of the variations in patient experiences with care. Rather, variations in the
health-care-provider relationship seem to be more influential, than macro-level characteristics,
and are also very amenable to change by emphasizing a patient-centered-care culture among
hospital staff. Ironically, the move toward patient-centered quality measurement and reporting
systems of hospital care should have been preceded by a comparable move towards patient-
centered care, whereby patients are more involved in all aspects of their care.
On the other hand, as more evidence accumulates from similar studies regarding
significant predictors of patient assessments of care, there are policy implications for such
findings. For example, evidence on significant predictors need to be taken into account (or
adjusted for) upon making comparisons across hospitals (as in quality report cards or the hospital
compare website launched by CMS) in order to achieve more equitable comparisons of hospitals.
In light of the finding of this study that patient-level case-mix predictors predict more of the true
overall variance in patient assessments of care than all macro-level predictors combined, this
study takes the position that future work needs to control/adjust for these characteristics; contrary
to suggestion of Finkelstein, et al., (1998) on this issue.
Moreover, if future studies support the findings of this study regarding what/how macro-
level predictors are associated with better process quality and higher overall satisfaction with
care, then policy makers can target these predictors in order to induce change. For example, if
intense competition among hospitals is indeed bad for patients experiences with care, as this

102
study found, then regulations to reduce competition among hospitals (such as eliminating
Certificate of Need (CON) laws) can be pursued to increase quality of care (Baker Starkey et al.,
2005) and improve assessments of care. Similarly, if nurse-staffing levels prove to be critical for
improving patient experiences of care, then policies that dictate acceptable (or minimum staffing
levels) need to be put in place and enforced by policy makers. Other macro-level characteristics,
such as occupancy rate and how much excess capacity hospitals are allowed to have or can exist
in a given market could be subject to change by policy makers, ore even hospital administrators
who want to improve patient experiences.
Theoretical Implications
On the theoretical side, a particular strength of this study and an extremely helpful tool in
conceptualizing it was the theoretical model for examining multilevel predictors of patient
assessments of care. This model was developed based on Donabedian’s SPO model and
resource dependency theory, and sought to advance the SPO model in order to reflect the
complexity of the hospital industry. Of the ten hypotheses derived in this study, three were fully
supported and another three were partially supported. In turn, support for these hypotheses
yields support for the theoretical model of the study as well as the usefulness of resource
dependency theory in understanding the link between organizational and market predictors of
care and patient assessments of care as both an outcome (overall satisfaction) and process of
care. On the other hand, the fact that three hypotheses were not supported in this study indicates
that more work is needed in order to understand the processes of organizational response to the
environmental factors with respect to patient-centered outcomes. As discussed in regards to the

103
relationship of HMO penetration rate, while the principles of resource dependency theory still
apply, alternative (to the response studied) reactionary or adaptive organizational actions could
be driving organizational responses.
Furthermore, this study is one of few studies that adopted the long-recognized notion of
multidimensionality of patient assessments of care. Apparently, there appears to be a good
consequence to this decision, because various dimensions (domains) of process quality showed
some differences, to an acceptable extent, in terms of significant predictors. This variety in the
patterns of relationships between different predictors and dimensions of patient assessments of
care supports the view to adopt multidimensional measures in future research. Nonetheless,
more research is needed to understand the reasons and/or underlying mechanisms by which these
predictors relate to certain dimensions of care, but not to others, as seen in this study.
Study Limitations and Ways to Overcome them in Future Research
Because this study used observational cross-sectional data and methods, the findings
cannot infer causality (Babbie, 2001) and can be biased, if there are unobserved, time-invariant
factors that affect hospital quality, and these factors are correlated with exploratory variables of
the model (Mark et al., 2005). Therefore, the relationships of interest in this study would be best
examined using longitudinal designs and larger sample sizes. Unfortunately, longitudinal data
with reasonable sample sizes did not exist at the time when this work was conceived
of/commenced. Nonetheless, as more waves of data from the CHART and CAHPS® Hospital
Survey projects become available, it will become more feasible to test the hypotheses of this
study using longitudinal designs.

104
Considering the voluntary nature of hospital participation in this study, possible selection
biases at the hospital level present a validity threat. However, the participation rate of CA
hospitals in the PEP-C effort is sizable, if not among the highest in state-level quality
measurement efforts. Also, there is indeed a large representation of hospitals from most (80%)
of CA markets. Statistical comparisons of PEP-C participant and non-participant hospitals show
no significant differences (at the 0.05 level) in terms ownership status, teaching status,
occupancy rate, nurse-staffing levels, and maintenance of a separate nursing home unit.
However, PEP-C-participating hospitals had slightly more resources than non-participants.
Specifically, PEP-C participants had 6% higher mean of percentage of Medicare days, 8% lower
mean of percentage of Medicaid days, and 11% higher mean of resources directed to patient
care; all of these differences were statistically significant at the 0.05 level.
Likewise, low response rates at the hospital level could be another validity concern, since
it has been suggested that non-respondents are more likely to have negative experiences of care
than respondents (Rubin, 1990a). However, a study that examined the impact of non-response
bias among patients in a multi-hospital sample (Lasek, Barkley, Harper, & Rosenthal, 1997)
found that this impact was relatively small and not systematically greater in hospitals with lower
response rates. Moreover, obtaining high response rates from surveys of hospital patients is a
well-known challenge and will continue to be a challenge to researchers in the future.
The AHA data are self-reported and not independently verified. However, there is no a
priori reason to suspect that the data reliability is correlated with the predictors of this study or
the outcomes. Furthermore, the response rate has typically increased to at least 80% by
hospitals. Notably, missing data in AHA survey precluded testing hospital memberships in

105
health systems or networks (Bazzoli et al., 1999); these two variables were of interest in this
study given the opinion of Bazzoli, Shortell et al. (1999) that describing hospitals in terms of
their individual characteristics alone is no longer adequate given the consolidation in the hospital
industry. However, in univariate models ran on valid (non-missing) system membership data, I
found no relationship with patient assessments of care domains.
A common theme of discussion (and controversy) with respect to the market-level
analyses in health services research is deciding what constitutes a hospital market (Wong et al.,
2005). Consistent with numerous prior studies (Zinn et al., 1999) and because the data were
derived from only one state (thus had a small number of market units), this study used counties
to approximate hospital markets. Moreover, as indicated by Iwashyna et al. (2002), providers
tend to view their markets in terms of counties. However, others argue that the use of MSAs, as
a geopolitical measure of competition, is more defensible, because MSAs are designed to enclose
an area with a high degree of economic cohesion (Wong et al., 2005). Therefore, future research
of market-level predictors of patient assessments of care that includes large samples of MSAs
could fare better, from the perspective of measuring hospital competition, by using MSAs or
HRRs, instead of counties, to approximate hospital markets.
Finally, here are few more areas of research for future studies. It would be interesting to
examine whether specialty hospitals differ from general hospitals with respect to patient
assessments of care. Given that specialty hospitals comprise just a small fraction of hospitals,
large and multi-state samples will be needed to examine this research question.
Although this study controlled for race as a potential predictor of patient assessments of
care, it failed to control for language differences, considering that the PEP-C survey was

106
administered in three languages: English, Spanish, and Chinese. Given that previous studies of
patient assessments of care found that language groups differ on measures of patient assessments
of care (Carrasquillo, Orav, Brennan, & Burstin, 1999; Weech-Maldonado et al., 2003), future
research that includes ethnic/racial subgroups need to take language differences into
consideration.
Although this study examined the validity of the Picker domains using the PEP-C data, it
did not assess equivalence of the Picker domains across various racial/ethnic groups or contexts,
such as rural and urban areas. Although previous studies established equivalence of similar
patient assessments of care domains, such as the Health Plan CAHPS 1.0 survey (Marshall,
Morales, Elliott, Spritzer, & Hays, 2001) among racial/ethnic groups, evidence of group
equivalence using the Picker domains is not available in the published literature. Therefore,
future studies using hospital-based patient assessments of care need to examine the equivalence
of these measures across groups and contexts.
Despite being one the few studies that included measures of resources directed to patient
care, due to data limitations, this study failed to control for potential variations in the costs of
medical care across markets. Additionally, because of the small amounts of true variations in
patient assessments of care that existed at the market level, this study did not consider more
sophisticated analyses, such as deviance from market norms/averages or cross-level interactions.
However, such analyses are recommended for future research.
Another area of importance for future research is to test the hypotheses of this study on
the uninsured. There were few cases of uninsured patients in the sample, of which the results
presented here make no inferences, whatsoever; as I dropped them from the analysis, due to strict

107
sample size reasons. Indeed, the uninsured are likely to have the most to say in terms of
experiences of care and, because of their greater need, they are even the most worthy of study; I
hope future studies in this area will address this shortcoming, before all others.
Conclusions
Notwithstanding its limitations, this study adds to the current literature on patient
assessments of hospital care, by addressing the three major limitations identified by O'Connor &
Shewchuk (2003) and others; in order to bridge the gap between the patient assessments of care
research and the consumer assessments research found in the general marketing literature. It
demonstrated the robustness and richness of patient assessments of care and presented numerous
issues for future research.

Table 1: Descriptive Statistics for Patient-Level Variables (n=24,887)
Variables Coding and Range Mean SDFemale 0=no
1=yes.57 .49
Surgical service 0=no1=yes
.53 .50
Age (18, 102) 63 17.04
< High school 0=no1=yes
.16 .36
Medicare insured 0=no1=yes
.36 .48
Medicaid insured 0=no1=yes
.13 .33
Lower health status 0=no1=yes
.31 .46
White 0=no1=yes
.68 .46
Coordination of care 6 items
(1, 18) 6.94 2.32
Continuity and transition of care 3 items
(1, 9) 4.54 1.96
Physical comfort 4 items
(1, 11) 4.23 2.09
Emotional support 5 items
(1, 15) 6.32 2.64
Information and education 5 items
(1, 15) 5.62 2.40
Involvement of family and friends 3 items
(1, 9) 4.55 1.49
Respect for patient preferences 3 items
(1, 9) 3.55 1.14
Overall satisfaction with care 6 items
(1, 28) 21.49 5.12

109
Table 2: Correlations of Patient-Level Variables +
Female Surgical service
Age < High school
Medicare insured
Medicaid insured
LowHealth status
White
Female .03 -.06 -.07 .04 -.02Surgical service -.17 -.07 -.10 -.08 -.23Age .10 .58 -.07 .18 .21< High school .03 .25 .15 -.26Medicare insured -.29 .11 .17Medicaid insured .14 -.24Lower health status -.06White
Table 3: Correlations of Process Quality and Overall Satisfaction with Care Domains
Coord. Cont. & transit.
Physical comfort
Emot.support
Info. & educ.
Involv. family
Respect pref.
Overall pt Satisf.
Coordination of care .30 .23 .47 .71 .35 .36 -.43Continuity & transition of care .23 .43 .39 .44 .24 -.46Physical comfort .36 .27 .26 .28 -.33Emotional support .61 .48 .42 -.53Information and education .44 .37 -.49
Involv. of family & friends .26 -.40Respect for patient preferences -.36Overall satisfaction with care
+ Where there is no statistically significant correlation, the table leaves the entry blank.

110
Table 4: Descriptive Statistics for Hospital-Level Variables (n= 173)
Variables Coding and Range Mean SDMaintain a NH unit 0= no
1= yes.40 .49
RN/inpatient days (.58, 24.38) 5.52 2.91LPN/inpatient days (0, 7.73) .73 .76Government hospital 0= no
1= yes.19 .39
Occupancy Rate (23.81%, 178.26%) 66% 18.73%Pct Medicare (0%, 88.40%) 44% 15.50%Pct Medicaid (0%, 93.31%) 20% 17.88%Teaching Status (0, 3) .62 1.02Resources pt care (4776, 121099) 60980 17886
Table 5: Correlations of Hospital-Level Variables +
Maint. a NH unit
RN/inpat. days
LPN/inpat. days
Gov. hospital
Occup. rate
Pct Medi-care
Pct Medi-caid
Teach. status
Resour. pt care
Maintain a NH unit -0.33 0.18 0.38RN/inpatient days 0.52 -0.31 -0.28 -0.16LPN/inpatient days -0.27 -0.18 -0.20Gov. hospital -0.38 0.42Occupancy rate 0.19Pct Medicare -0.51 -0.20Pct MedicaidTeaching statusResources pt care
+ Where there is no statistically significant correlation, the table leaves the entry blank.

111
Table 6: Descriptive Statistics for Market-Level Variables (n=46)
Variable Coding and Range Mean SDHHI hospital competition (.06, 1) .52 .27Pct minority pop (6.6%, 51.3%) 29% 14.13%No. RN FTEs/pop. (.99, 4.93) 2.34 .87No. LPN FTEs/pop. (.074, 1.73) .42 .30Resources pt care (482.24, 5376) 1096 734.35Excess capacity (-15.23, 76.95) 37.60 15.78Teaching status (0, 9) .52 1.53HMO penetration (.0009, .74) .33 .22Per-capita income (16,112, 60,618) 29,207 10,710Medicaid days/pop (15.87, 680.52) 132.94 141.84
Table 7: Correlations of Market-Level Variables +
HHI hosp.
compet.
Pct min. pop.
No. LPN FTEs/
pop
Resour.pt care
Excess capacity
Teach. status
HMO Penet.
Per-capita income
Medicaid days/pop
HHI hosp. compet. -.49 .34 -.41 -.64 -.47Pct minority pop -.33 .41 .38No. RN FTEs/pop. .41 .29 .37No. LPN FTEs/pop. -.46 .67Resources pt care .53 -.31Excess capacity -.29Teaching statusHMO Penetration .55Per-capita incomeMedicaid days/pop
+ Where there is no statistically significant correlation, the table leaves the entry blank.

112
Table 8: Results of Model Fit Indices and Reliabilities for Picker Domains
Dimension Domain Solution
Chi-Square NFI RFI IFI TLI CFI RMSEA AIC Cronb.Alpha
Coordination of care
Original factor(6 items)
χ2=654 df=9p-value=.000
.962 .910 .962 911. .962 .054 691 .692
Continuity and transition of care
Original factor(4 items)
χ2=1258 df=2p-value=.000
.950 .752 .950 .752 .950 .159 1282 .789
Reduced factor1
(3 items)χ2= 43.1 df=1p-value=.000
.997 .985 .998 .985 .998 .041 59 .760
Physical comfort
Original factor(5 items)
χ2=851 df=5p-value=.000
.925 .776 .926 .777 .926 .082 881 .725
Reduced factor(4 items)2
χ2= 157 df=2p-value=.000
.984 .919 .984 .919 .984 .056 181 .731
Emotional support
Original factor(6 items)
χ2=3932 df=9p-value=.000
.875 .709 .876 .710 .876 .132 3969 .776
Reduced factor3
(5 items)χ2=688 df=5p-value=.000
.968 .905 .969 .905 .968 .074 718 .738
Information and education
Original factor(5 items)
χ2=290 df=5p-value=.000
.984 .952 .984 .952 .984 .048 320 .758
Invol. family & friends
Original factor(3 items)4
χ2=57.5 df=1p-value=.000
.994 .967 .995 .967 .995 .048 73 .688
Respect for pt preferences
Original factor(4 items)
χ2=2885 df=2p-value=.000
.800 .800 .800 .800 .800 .240 2909 .598
Reduced factor5
(3 items)χ2=33 df=1
p-value=.000.997 .982 .997 .982 .997 .036 49 .593
Overall satisfaction with care
Original factor(8 items)
χ2=19433 df=20p-value=.000
.860 .747 .860 .748 .860 .197 19481 .921
Reduced factor(6 items)6
χ2=1835 df=9p-value=.000
.978 .949 .978 .950 .978 .090 1871 .896
1 Dropped Staff explained purpose of home medicine - q008206. A constraint based on CR differences was imposed to achieve model identification.2 Dropped minutes for help after call button - q008648. 3 Dropped Doctor discussed anxieties/fears - q008177. 4 In order to estimate model fit indices for this model, assumed equal variance for 2 items (family given info & amount of info given to family). 5 Dropped Enough say about treatment – q008185 (standardized B=0.20, squared multiple correlations =4%).6 Dropped courtesy of Dr q008098 and courtesy of nurses q008104 - tried dropping only one item; none worked.

113
Table 9: Variance Components Estimates for the Null Models
Variance Coord.of care
Contin. & trans. of
care
Phys.comfort
Emo. support
Info. & education
Invol. of family & friends
Respect for
pt pref.
Overall satis. with
careWithin-hospitals
5.19681 3.794 4.33837 6.82111 5.61320 2.20325 1.25951 25.30655
Between-hospitals
.18144 .025 .03359 .08654 .14091 .01087 .03040 .85389
Between-markets
.04059 .009 .00588 .06969 .03084 .00763 .00747 .15445
Reliability EstimatesBetween-hospitals
.800 .447 .463 .608 .746 .379 .738 .795
Between-markets
.334 .305 .196 .540 .315 .401 .335 .293
Components of Variance Tests
Between-hospitals
Chi-square statistic
732.3 237.6 253.1 349.9 560.3 214.4 542.7 692.6
df 127 127 127 127 127 127 127 127 p-value .000 .000 .000 .000 .000 .000 .000 .000
Between-markets
Chi-square statistic
80.2 82.9 64.5 142.1 76.4 86.7 83.781
df 45 45 45 45 45 45 45 45 p-value .001 .001 .030 .000 .003 .000 .001 .001

114
Table 10: Regression Results for Multilevel Models
Level 1 Level 2 Level 3 Level 1 Level 2 Level 3Intercept 6.8842(0.0440) 6.9168(0.0343) 6.8038(0.0314) 4.5295(0.0284) 4.5333(0.0271) 4.4997(0.0253)
Level 1 predictors
Female -0.1981(0.0238) -0.1958(0.0236) -0.1953(0.0236) 0.1948(0.0266) 0.1936(0.0267) 0.19417(0.0265)
Surgical service -1.2244(0.0492) -1.2264(0.0491) -1.2317(0.0495) -0.2846(0.0374) -0.2845(0.0373) -0.2875(0.0371)
Age -0.0096(0.0009) -0.0097(0.0009) -0.0096(0.0009) 0.0020(0.0013) 0.0019(0.0013) 0.00184(0.0013)
< High school -0.3125(0.0545) -0.3142(0.0547) -0.3182(0.0545)
Medicare insured -0.0642(0.0246) -0.0639(0.0246) -0.0603(0.0251)
Medicaid insured 0.3087(0.0655) 0.3077(0.0659) 0.3131(0.0653) -0.0818(0.049) -0.0829(0.0495) -0.0806(0.0498)
Lower health status 0.6164(0.0422) 0.6139(0.0414) 0.6137(0.0418) 0.4900(0.0379) 0.4882(0.0375) 0.4854(0.0372)
White -0.2643(0.0318) -0.2645(0.0321) -0.2522(0.0305) 0.0731(0.0260) 0.0753(0.0258) 0.0941(0.0242)
Level 2 predictorsMaintain a NH unit
RN/inpatient days -0.0267(0.0152) -0.0223(0.00977) -0.0207(0.0095)
LPN/inpatient days
Gov hospital
Occupancy rate 0.0036(0.0016) 0.0049(0.0015)
Pct Medicare
Pct Medicaid
Teaching status 0.1395(0.0178) 0.0950(0.0152)
Resources pt care -0.00001(0.0000) -0.000003(0.000001) -0.000001(0.00000) -0.000002(0.000001)
Level 3 predictors
HHI hosp. competition -0.5660(0.2047)
Per-capita income
Pct minority pop. 0.0095(0.0026) 0.0073(0.0013)
Medicaid days/pop. 0.0007( 0.0003)
No. RN FTEs/pop.
No. LPN FTEs/pop. -0.6758(0.1755)
Resources pt care
Excess capacity
Teaching status -0.0254(0.0086)
HMO penetration -0.5532(0.1942)
Regression Coefficient Estimates (with Standard Error Estimates in Parentheses)Coordination of care Continuity & transition of care

115
Table 10: Regression Results for Multilevel Models, Cont’d.
Level 1 Level 2 Level 3 Level 1 Level 2 Level 3Intercept 4.2010(0.0224) 4.2087(0.0222) 4.1345(0.0248) 6.2503(0.0451) 6.2836(0.0360) 6.3418(0.0564)
Level 1 predictors
Female 0.2657(0.0279) 0.2659(0.0271) 0.2664(0.0270) 0.1115(0.0266) 0.1141(0.0258) 0.1153(0.0257)
Surgical service 0.3146(0.0280) 0.31527(0.0281) 0.3133(0.0280) -0.3401(0.0474) -0.3422(0.0467) -0.3463(0.0471)
Age -0.0220(0.001) -0.0220(0.001) -0.0222(0.0010) -0.0145(0.0017) -0.0146(0.0017) -0.0147(0.0017)
< High school -0.1431(0.0415) -0.1486(0.0408) -0.1471(0.0410)Medicare insured -0.1561(0.0348) -0.1553(0.0352) -0.1510(0.0350) -0.2951(0.0334) -0.2920(0.0328) -0.2900(0.0330)
Medicaid insured 0.2261(0.0406) 0.2217(0.0409) 0.2290(0.0420)Lower health status 0.4897(0.0410) 0.4862(0.0401) 0.4863(0.0402) 0.6987(0.0439) 0.6935(0.0429) 0.6918(0.0426)
White 0.0686(0.04129) 0.0749(0.0416) 0.0852(0.0429) -0.2631(0.0376) -0.2618(0.0382) -0.2371(0.0377)
Level 2 predictors
Maintain a NH unit
RN/inpatient days -0.0317(0.0067) -0.0297(0.0082) -0.0426(0.0108) -0.0400(0.0116)
LPN/inpatient days 0.0604(0.0253) 0.0986(0.0338)
Gov hospitalOccupancy rate
Pct Medicare
Pct Medicaid
Teaching status 0.0360(0.0134) 0.0151(0.0138) 0.1065(0.0167) 0.0711(0.0178)
Resources pt care -0.000002(0.00000) -0.000002(0.000001) -0.000002(0.000001) -0.000003(0.000002)
Level 3 predictors
HHI hosp. competition -0.1974(0.0854) -0.3350(0.2091)
Per-capita income 0.000003(0.000002)
Pct minority pop 0.0109(0.0023)
Medicaid days/pop. -0.0009(0.0002)
No. RN FTEs/pop. 0.0589(0.0215)
No. LPN FTEs/pop. 0.3396(0.1598) -0.2340(0.1056)
Resources pt care -0.0001(0.0001)Excess capacity 0.0038(0.0026)
Teaching status -0.0099(0.0068)
HMO penetration 0.2835(0.1291) -0.4194(0.1515)
Regression Coefficient Estimates (with Standard Error Estimates in Parentheses)Physical comfort Emotional support

116
Table 10: Regression Results for Multilevel Models, Cont’d
Level 1 Level 2 Level 3 Level 1 Level 2 Level 3Intercept 5.5901(0.0402) 5.6134(0.0335) 5.5188(0.0312) 4.5735(0.0169) 4.5756(0.0119) 4.5611(0.0151)
Level 1 predictors
Female -0.1851(0.0255) -0.1843(0.0251) -0.1840(0.0251) 0.0722(0.0199) 0.0744(0.0195) 0.0735(0.0193)
Surgical service -1.1971(0.0469) -1.1988(0.0467) -1.2022(0.0468) -0.1821(0.0227) -0.1857(0.0226) -0.1889(0.0230)
Age -0.0084(0.0015) -0.0084(0.0015) -0.0085(0.0015) -0.0086(0.0010) -0.0087(0.0010) -0.0086(0.0010)
< High school 0.0824(0.0554) 0.0815(0.0558) 0.0821(0.0553) -0.0503(0.0266) -0.0470(0.0270) -0.0543(0.0269)
Medicare insured -0.0823(0.0372) -0.0813(0.0373) 0.0770(0.0371) -0.1099(0.0255) -0.1091(0.0257) -0.1066(0.0256)
Medicaid insured 0.2735(0.0518) 0.2704(0.0519) 0.2765(0.0507) -0.1357(0.0300) -0.1329(0.0295) -0.1353(0.0295)
Lower health status 0.6340(0.0399) 0.6302(0.0389) 0.6292(0.0390) 0.2655(0.0274) 0.2623(0.0271) 0.2600(0.0267)
White -0.2249(0.0424) -0.2226(0.0429) -0.2063(0.0424)
Level 2 predictors
Maintain a NH unit
RN/inpatient days -0.0397(0.0105) -0.0361(0.0144)
LPN/inpatient days -0.0617(0.0197) -0.0453(0.0206)Gov hospital
Occupancy rate
Pct Medicare
Pct Medicaid
Teaching status 0.0872(0.0196) 0.0549(0.0204) 0.0256(0.0101) 0.0318(0.0118)
Resources pt care -0.000003(0.0000) -0.000004(0.000001) -0.000003(0.000001) -0.000002(0.000001)Level 3 predictors
HHI hosp. competition -0.6370(0.1838)
Per-capita income -0.000003(0.000001)
Pct minority pop 0.0077(0.0025) 0.0042(0.0009)
Medicaid days/pop. 0.0008(0.0003)
No. RN FTEs/pop.
No. LPN FTEs/pop. -0.5229(0.1697) -0.2632(0.0668)
Resources pt care 0.00012(0.00001)
Excess capacity -0.0010(0.0007)
Teaching status -0.0215(0.0073) -0.0099(0.0023)
HMO penetration -0.5527(0.1569) -0.1391(0.0620)
Regression Coefficient Estimates (with Standard Error Estimates in Parentheses)Information & education Involvement of family & friends

117
Table 10: Regression Results for Multilevel Models, Cont’d
Level 1 Level 2 Level 3 Level 1 Level 2 Level 3
Intercept 3.5519(0.0136) 3.5536(0.0110) 3.5094(0.0092) 21.8975(0.1045) 21.7978(0.0798) 22.0564(0.0935)
Level 1 predictors
Female -0.0319(0.0180) -0.0311(0.0180) -0.0313(0.0179) -0.4475(0.0686) -0.4489(0.0679) -0.4487(0.0676)
Surgical service 0.5389(0.0617) 0.5404(0.0611) 0.5463(0.0614)
Age -0.00403(0.0005) -0.00405(0.0005) -0.0041(0.0006) 0.0074(0.0025) 0.0076(0.0025) 0.0073(0.0025)
< High school 0.0538(0.0301) 0.0534(0.0302) 0.0536(0.0299) 0.3760(0.0979) 0.3769(0.0981) 0.3871(0.0962)
Medicare insured 0.0347(0.0197) 0.0363(0.0197) 0.0397(0.0198)
Medicaid insured 0.2327(0.0310) 0.2302(0.0309) 0.2341(0.0309)
Lower health status 0.1882(0.0189) 0.1856(0.0187) 0.1850(0.0188) -1.5996(0.0712) -1.5940(0.0713) -1.5918(0.0704)
White -0.2736(0.0237) -0.2693(0.0234) -0.2594(0.0238)
Level 2 predictors
Maintain a NH unit 0.2013(0.1341) 0.1034(0.1289)
RN/inpatient days -0.0164(0.0048) -0.0129(0.0047) 0.1398(0.0318) 0.1120(0.0309)
LPN/inpatient days
Gov hospital
Occupancy rate
Pct Medicare 0.0008(0.0005) 0.0014(0.0006)
Pct Medicaid
Teaching status 0.0488(0.0079) 0.0333(0.0093) -0.2240(0.0544) -0.1140(0.0595)
Resources pt care -0.000001(0.0000) -0.000001(0.0000) 0.000008(0.0000) 0.000007(0.000004)
Level 3 predictors
HHI hosp. competition -0.153093(0.0640) 0.8961 (0.5308)
Per-capita income 0.00001(0.000005)
Pct minority pop 0.0033(0.0008) -0.0272(0.0059)
Medicaid days/pop. 0.00020(0.0001)
No. RN FTEs/pop.
No. LPN FTEs/pop.
Resources pt care
Excess capacity 0.0013(0.0007)
Teaching status -0.0105(0.0030) 0.0385(0.0161)HMO penetration 0.0991(0.0613)
Respect for patient preferences Overall satisfaction with careRegression Coefficient Estimates (with Standard Error Estimates in Parentheses)

118
Table 11: Variances and Variances Accounted for at the Three Levels
Null model Null model% of total variance
Patient predict. only
Model 1
Pat./hosp. pred.
Model 2
Pat/hosp/mkt pred.
Model 3
% var. explain. by
Model 1
% var. explain. by
Model 2
% var. explain. by
Model 3
Coordination of care
Within-hospitals 5.19681 95.90% 4.532 4.53188 4.53095 12.79%Between-hospitals 0.18144 3.35% 0.13971 0.12346 0.10182 11.63% 27.12%Between-markets 0.04059 0.75% 0.02505 0.00487 0.00026 80.56% 98.96%
Continuity and transition of care
Within-hospitals 3.79394 99.12% 3.63663 3.63678 3.636 4.15%
Between-hospitals 0.02479 0.65% 0.02953 0.0276 0.02796 6.54% 5.32%Between-markets 0.00889 0.23% 0.01104 0.00828 0.00001 25.00% 99.91%
Physical comfort
Within-hospitals 4.33837 99.10% 4.08235 4.08221 4.08118 5.90%Between-hospitals 0.03359 0.77% 0.02437 0.0209 0.01658 14.24% 31.97%
Between-markets 0.00588 0.13% 0.00265 0.00051 0.00001 80.75% 99.62%
Emotional support
Within-hospitals 6.82111 97.76% 6.46128 6.46077 6.45956 5.28%Between-hospitals 0.08654 1.24% 0.05944 0.0529 0.04154 11.00% 30.11%
Between-markets 0.06969 1.00% 0.04084 0.01812 0.00004 55.63% 99.90%Information and education
Within-hospitals 5.6132 97.03% 4.97272 4.97263 4.97145 11.41%Between-hospitals 0.14091 2.44% 0.0975 0.09086 0.07418 6.81% 23.92%
Between-markets 0.03084 0.53% 0.01823 0.0053 0.00006 70.93% 99.67%
Involvement of family and friends
Within-hospitals 2.20325 99.17% 2.12839 2.12828 2.12745 3.40%
Between-hospitals 0.01087 0.49% 0.0089 0.00741 0.00475 16.74% 46.63%Between-markets 0.00763 0.34% 0.00271 0.00001 0.00004 99.63% 98.52%Respect for patient preferences
Within-hospitals 1.25951 97.08% 1.17428 1.17427 1.17403 6.77%
Between-hospitals 0.0304 2.34% 0.01539 0.01177 0.00904 23.52% 41.26%
Between-markets 0.00747 0.58% 0.00045 0.00001 0.00003 97.78% 93.33%
Overall satisfaction with care
Within-hospitals 25.30655 96.17% 22.53139 22.53063 22.52838 10.97%Between-hospitals 0.85389 3.24% 0.74581 0.67731 0.55538 9.18% 25.53%
Between-markets 0.15445 0.59% 0.15093 0.03581 0.0007 76.27% 99.54%
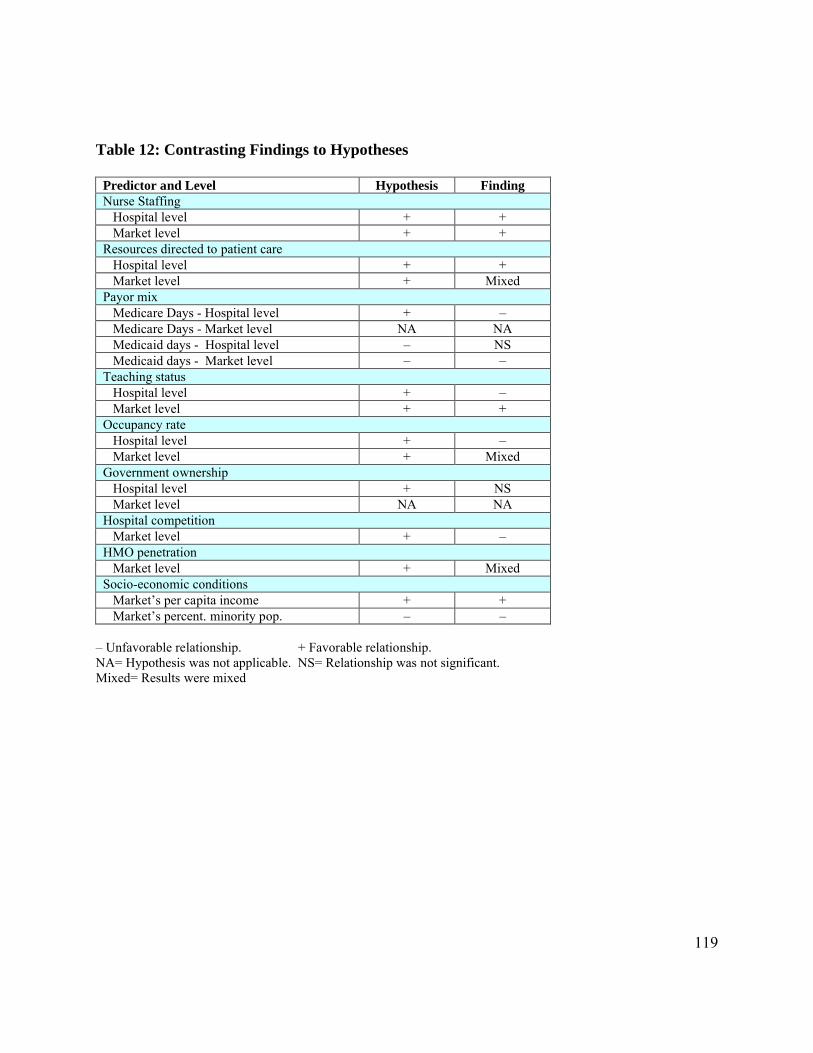
119
Table 12: Contrasting Findings to Hypotheses
Predictor and Level Hypothesis FindingNurse Staffing Hospital level + + Market level + +Resources directed to patient care Hospital level + + Market level + MixedPayor mix Medicare Days - Hospital level + – Medicare Days - Market level NA NA Medicaid days - Hospital level – NS Medicaid days - Market level – –Teaching status Hospital level + – Market level + +Occupancy rate Hospital level + – Market level + MixedGovernment ownership Hospital level + NS Market level NA NAHospital competition Market level + –HMO penetration Market level + MixedSocio-economic conditions Market’s per capita income + + Market’s percent. minority pop. – –
– Unfavorable relationship. + Favorable relationship. NA= Hypothesis was not applicable. NS= Relationship was not significant. Mixed= Results were mixed

120
REFERENCES
Alexander, J., Lee, S., Griffith, J., Mick, S., Lin, X., & Banaszak-Holl, J. 1999. Do Market-Level Hospital and Physician Resources Affect Small Area Variation on Hospital Use? Medical Care Research and Review, 56(1): 94-117.
Anderson Rothman, A., Park, H., Hays, R., Edwards, C., & Dudley, R. 2008. Can Additional Patient Experience Items Improve the Reliability of and Add New Domains to the CAHPS(R)Hospital Survey? Health Services Research, 43(6): 2201-2222.
Arbuckle, J., & Wothke, W. 1999. Amos 4.0 User’s Guide. Chicago: SPSS/SmallWaters.
Babbie, E. 2001. The Practice of Social Research (ninth edition ed.). Belmont, CA: Wadsworth.
Baker Starkey, K., Weech-Maldonado, R., & Mor, V. 2005. Market Competition and Quality of Care in the Nursing Home Industry. Journal of Health Care Finance, 32 (1): 67-81.
Barr, J. K., & Banks, S. 2002. Public Reporting of Hospital Patient Satisfaction: A Review of Survey Methods and Statistical Approaches: 24. Middle town, Connecticut: Qualidigm: Prepared for the Rhode Island Department of Health, Health Quality Performance Measurement and Reporting Program.
Bates, L., Mukherjee, K., & Santerre, R. 2006. Market Structure and Technical Efficiency in the Hospital Services Industry: A DEA Approach. Medical Care Research and Review, 63(4): 499-524.
Bazzoli, G. J., Shortell, S. M., Dubbs, N., Chan, C., & Kralovec, P. 1999. A Taxonomy of Health Networks and Systems: Bringing Order Out of Chaos. Health Services Research, 33(6): 1683-1717.
Bronstein, J., & Morrisey, M. 1990. Determinants of Rural Travel Distance for Obstetric Care. Medical Care Research and Review, 28(9): 853-864.
Browne, M., & Cudeck, R. 1993. Alternative Ways of Assessing Model Fit. In K. Bollen, & J. Long (Eds.), Testing Structural Equation Models: 136-162.
California Health Care Foundation. 2005. Hospitals, Public Reporting: California Hospital Assessment and Reporting Taskforce.
Carrasquillo, O., Orav, J., Brennan, T. A., & Burstin, H. R. 1999. Impact of Language Barriers on Patient Satisfaction in an Emergency Department. Journal of General Internal Medicine, 14: 82-87.

121
Centers of Medicare and Medicaid. 2003. Health Care Industry Market Update: Acute Care Hospitals.
Chang, K. 1997. Dimensions and Indicators of Patients' Perceived Nursing Care Quality in the Hospital Setting. Journal of Nursing Care Quality, 11(6): 26-37.
Cleary, P. D., Edgman-Levitan, S., Roberts, M., Moloney, T. W., McMullen, W., Walker, J. D., & Delbanco, T. L. 1991. Patients Evaluate their Hospital Care: A National Study. Health Affairs, Winter: 254-267.
Cleary, P. D., Edgman-Levitan, S., Walker, J. D., Gerteis, M., & Delbanco, T. L. 1993. Using Patient Reports to Improve Medical Care: A Preliminary Report from 10 Hospitals. Quality Management in Health Care, 2: 31-38.
Coulter, A. 2001. Which Patients Get the Worst Deal? Organisation for Economic Cooperation and Development: The OECD Observer, 229: 29-31.
Crall, J. J., & Morris, A. L. 1988. Relationships among Structure, Process, and Outcome Scores Derived from Evaluations of 300 General Dental Practices. Journal of Dental Education, 52(11): 643-646.
Crombie, I., & Davies, H. 1998. Beyond Health Outcomes: The Advantage of Measuring Process. Journal of Evaluation in Clinical Practice, 4(1): 31-38.
Cronbach, L. J. 1951. Coefficient Alpha and the Internal Structure of Tests. Psychometrika, 16: 297-334.
Donabedian, A. 1966. Evaluating the Quality of Medical Care. Milbank Memorial Fund Quarterly, 44(suppl): 166-206.
Donabedian, A. 1980. Explorations in Quality Assessment and Monitoring. Volume 1: The Definition of Quality and Approaches to its Assessment. Ann Arbor, MI: Health Administration Press.
Donabedian, A. 1992. The Role of Outcomes in Quality Assessment and Assurance. Quality Review Bulletin, 18: 356-360.
Finkelstein, B. 1998. An Examination of Patient Satisfaction as a Measure of Hospital Quality in a Regional Sample of Obstetrical Patients. Unpublished PhD Dissertation, Case Western Reserve University.
Finkelstein, B., Hulka, B., & Rosenthal, G. 1999. Patient assessments of hospital maternity care" A useful tool for consumers? Health Services Research, 34(2): 623-640.

122
Finkelstein, B., Singh, J., Silvers, J., Neuhauser, D., & Rosenthal, G. 1998. Patient and Hospital Characteristics Associated with Patient Assessments of Hospital Obstetrical Care. Medical Care, 36(8): AS68-AS78 Supplement.
Fleming, G. V. 1981. Hospital Structure and Consumer Satisfaction. Health Services Research, 16(1): 43-63.
Gaynor, M., & Voget, W. 2000. Antitrust and Competition in Health Care Markets. In J. Newhouse, & A. Culyer (Eds.), Handbook of Health Economics, Vol. 1B: 1405-1487. Amsterdam, The Netherlands: Elsevier.
Goldstein, E., Farquhar, M., Crofton, C., Darby, C., & Garfinkel, S. 2005. Measuring Hospital Care from the Patients’ Perspective: An Overview of the CAHPS® Hospital Survey Development Process. Health Services Research, 40(6 (Part II)): 1977-1995.
Greenley, J. R., & Schoenherr, R. A. 1981. Organization Effects on Client Satisfaction with Humaneness of Service. Journal of Health and Social Behavior, 22(March): 2-18.
Guggan, M. 2000. Hospital Ownership and Public Medical Spending. Quarterly Journal of Economics, 115(4): 1343-1373.
Hadley, J. 2003. Sicker and Poorer- The Consequences of Being Uninsured: A Review of the Research on the Relationship Between Health Insurance, Medical Care Use, Health, Work, and Income. Medical Care Research and Review, 60(1 Supplement): 3S-75S.
Hargraves, J. L., Wilson, I. B., Zaslavsky, A., James, C., Walker, J., Rogers, G., & Cleary, P. D. 2001. Adjusting for patients characteristics when analyzing reports from patients about hospital care. Medical Care, 39(6): 635-641.
Harrington, C., & Swan, J. 2003. Nursing Home Staffing, Turnover, and Case Mix. Medical Care Research and Review, 60(3): 366-392.
Hays, R., Eastwood, J., Spritzer, K., & Cowan, M. 2006. Health-Related Quality of Life and Patient Reports About Care outcomes in a Multidisciplinary Hospital Intervention. Annuals of Behavioral Medicine, 3(2): 173-178.
Hays, R., Larson, C., Nelson, E., & Batalden, P. 1991. Hospital Quality Trends: A Short-Form Patient-Based Measure. Medical Care, 29(7): 661-668.
Hendriks, A. A. J., Vrielink, M. R., Van Es, S. Q., De Haes, H. J. C. J. M., & Smets, E. M. A. 2004. Assessing Inpatients' Satisfaction with Hospital Care: Should We Prefer Evaluation or Satisfaction Ratings? Patient Education and Counseling, In Press.
Hulka, B. S., Zyzanski, S. J., Cassel, J. C., & Thompson, S. J. 1971. Satisfaction with Medical

123
Care in a Low Income Population. Journal of Chronic Disease, 24: 661-673.
Iwashyna, T., Chang, V., Zhang, J., & Christakis, N. 2002. The Lack of Effect of Market Structure on Hospice Use. Health Services Research., 37(6): 1531-1551.
Jaipaul, C. K., & Rosenthal, G. E. 2003. Are Older Patients More Satisfied with Hospital Care than Younger Patients? Journal of General Internal Medicine, 18: 23-30.
Jimmieson, N. L., & Griffin, M. A. 1998. Linking Client and Employee Perceptions of the Organization: A Study of Client Satisfaction with Health Care Services. Journal of Occupational and Organizational Psychology, 71: 81-96.
Kane, R. L., Maciejewski, M., & Finch, M. 1997. The relationship of patient satisfaction with care and clinical outcomes. Medical Care, 35(7): 714-730.
Komaromy, M., Lurie, N., Osmond, D., Vranizan, K., Keane, D., & Bindman, A. 1996. Physician Practice Style and Rates of Hospitalization for Chronic Medical Conditions. Medical Care Research and Review, 34(June): 594-609.
Lasek, R. J., Barkley, W., Harper, D., & Rosenthal, G. E. 1997. An Evaluation of the Impact of Nonresponse Bias on Patient Satisfaction Surveys. Medical Care, 35(6): 646-652.
Mack, J. L., File, K. M., Horwitz, J. E., & Prince, R. A. 1995. The Effect of Urgency on Patient Satisfaction and Future Emergency Department Choice. Health Care Management Review, 20(2): 7-15.
Magnussen, J., & Mobley, L. 1999. The Impact of Market Environment on Excess Capacity and the Cost of an Empty Hospital Bed. International Journal of the Economics of Business, 6(3): 383-398.
Mark, B., Harless, D., & Mcue, M. 2005. The Impact of HMO Penetration on the Relationship Between Nurse Staffing and Quality. Health Economics, 14: 737-753.
Marley, K., Collier, D., & Goldstein, S. 2004. The Role of Clinical and Process Quality in Achieving Patient Satisfaction in Hospitals. Decision Sciences, 35(3): 349-369.
Marshall, G., Morales, L., Elliott, M., Spritzer, K., & Hays, R. 2001. Confirmatory Factor Analysis of the Consumer Assessment of Health Plan Study (CAHPS) 1.0 Survey. Psychological Assessment, 13(2): 216-229.
Mitchell, P., & Shortell, S. 1997. Adverse Outcomes and Variations in Organizations of Care Delivery. Medical Care, 35: NS19-NS32.
Mobley, L., & Magnussen, J. 2002. The Impact of Managed Care Penetration and Hospital

124
Quality on Efficiency in Hospital Staffing. Journal of Health Care Finance(28): 24-42.
Mukamel, D. B., Zwanziger, J., & Bamezai, A. 2002. Hospital competition, resource allocation and quality of care. BMC Health Services Research, 2(1): 10.
Mukamel, D. B., Zwanziger, J., & Tomaszewski, K. J. 2001. HMO penetration, competition, and risk-adjusted hospital quality. Health Services Research, 36(6): 1019-1035.
National Committee for Quality Assurance (NCQA). 2004. Consumer Report Cards, Vol. April, 2004.
Navathe, A., Zhu, J., Silber, J., Rosenbaum, P., & Volpp, K. 2007. Are Teaching Hospitals Even Better Than We think? Paper presented at the AcademyHealth Annual Meeting, Orlando, FL.
Needleman, J., Buerhaus, P., Stewart, M., Zelevinsky, K., & Mattke, S. 2006. Nurse Staffing in Hospitals: Is There A Business Case for Quality? Health Affairs, 25(1): 204-211.
Nelson, E. C., Hays, R. D., Larson, C., & Batalden, P. B. 1989. The Patient Judgment system: Reliability and Validity. Quality Review Bulletin, 15: 185.
Nelson, E. C., Rust, R. T., Zahorik, A., Rose, R. L., Batalden, P., & Siemanski, B. A. 1992. Do Patient Perceptions of Quality Relate to Hospital Financial Performance? Journal of Health Care Marketing, 12(December): 6-13.
NRC Picker, & CIHSP. 2003. Results from the Patients' Evaluation of Performance (PEP-C) Survey: 2003 Edition Technical Report: National Research Corporation Picker & California Institute for Health Systems Performance.
O'Connor, S. J., & Shewchuk, R. 2003. Commentary- Patient Satisfaction: What is the Point? Health Care Management Review, 28(1): 21-24.
Oliver, C. 1990. Determinants of Interorganizational Relationships: Integration and Future Directions. Academy of Management Review, 15(2): 241-265.
Oropesa, R. S., Landale, N. S., & Kenkre, T. S. 2002. Structure, process, and satisfaction with obstetricians: An analysis of mainland Puerto Ricans. Medical Care Research Review, 59(4): 412-439.
Otani, K., Kurz, R. S., Burroughs, T. E., & Waterman, B. 2003. Reply to the Commentary of O'Connor and Shewchuck. Health Care Management Review, 28(1): 25-26.
Patterson, C. A. 1998. A Multi-hospital examination of the relationship between hospital nursing resources and hospital quality outcomes. PhD dissertation, Case Western

125
Reserve University.
Pfeffer, J., & Salancik, G. 1978. The External Control of Organizations: A Resource Dependence Perspective. New York: Harper & Row.
Press, I., Ganey, R. F., & Malone, M. P. 1991. Satisfied Patients Can Spell Financial Well-Being. Healthcare Financial Management, 45(2): 34-42.
Proenca, E., Rosko, M., & Zinn, J. 2000. Community Orientation in Hospitals: An Institutional and Resource Dependence Perspective. Health Services Research, 35(5 (Part 1)): 1011-1035.
Raudenbush, S., & Bryk, A. 2002. Hierarchical Linear Models Applications and Data Analysis Methods (Second ed.). Thousand Oaks: Sage.
Raudenbush, S., Bryk, A., Congdon, Y., & Congdon Jr, R. 2004. Hierarchical Linear and Nonlinear Modeling HLM 6. Lincolnwood, IL: Scientific Software International, Inc.
Raudenbush, S., Rowan, B., & Cheong, Y. 1993. Higher Order Instructional Goals in Secondary Schools: Class, Teacher, and School Influences. American Educational Research Journal, 30(3): 523-553.
Rivers, P., & Fottler, M. 2004. Do HMO Penetration and Hospital Competition Impact Quality of Hospital Care? Health Services Management Research, 17: 237-248.
Rogut, L., Newman, L. S., & Cleary, P. D. 1996. Variability in Patient Experiences at 15 New York City Hospitals. Bulletin of The New York Academy of Medicine, 73(2): 314-334.
Romano, P., & Mutter, R. 2004. The Evolving Science of Quality Measurement for Hospitals: Implications for Studies of Competition and Consolidation. International Journal of Health Care Finance and Economics, 4: 131-157.
Rosenheck, R., Wilson, N. J., & Meterko, M. 1997. Influence of Patient and Hospital Factors on Consumer Satisfaction with Inpatient Mental Health Treatment. Psychiatric Services, 48(12): 1553-1561.
Rubin, H. R. 1990a. Can Patients Evaluate the Quality of Hospital Care? Medical care Review, 47(267).
Rubin, H. R. 1990b. Patient Evaluations of Hospital Care: A Review of the Literature. Medical Care, Supplement, 28: S3-S9.
Scanlon, D., Swaminathan, S., Chernew, M., & Lee, W. 2006. Market and Plan Characteristics Related to HMO Quality and Improvement. Medical Care Research and Review, 63(6):

126
suppl, 56S-89S.
Scott, W. 1998. Organizations: Rational, Natural, and Open Systems (4th edition ed.). Upper Saddle River, NJ: Prentice Hall.
Shortell, S., & Hughes, E. 1988. The Effects of Regulation, Competition and Ownership on Mortality Rates among Hospitals Inpatients. New England Journal of Medicine, 318(7): 1098-1107.
Sitzia, J., & Wood, N. 1997. Patient Satisfaction: A Review of Issues and Concepts. Social Science and Medicine, 45(1): 1829-1843.
Sixma, H. J., Spreeuwenberg, P. M. M., & Van Der Pach, M. A. A. 1998. Patient satisfaction with the general practitioner A two-level Analysis. Medical Care, 36(2): 212-229.
Tabachnick, B., & Fidell, L. 2000. Using Multivariate Statistics (4th Edition ed.): Allyn & Bacon.
Tirole, J. 1994. The Internal Organization of Government. Oxford Economic Papers, 46(1): 1-29.
Van Campen, C., Sixma, H., Friele, R. D., Kerssens, J. J., & Peters, L. 1995. Quality of Care and Patient Satisfaction: A Review of Measuring Instruments. Medical Care Research and Review, 52: 109-133.
Van Campen, C., Sixma, H. J., Kerssens, J. J., Peters, L., & Rasker, J. J. 1998. Assessing Patients' Priorities and Perceptions of the Quality of Health Care: The Development of the Quote-Rheumatic-Patients Instrument. British Journal of Rheumatology, 37: 362-368.
Veenstra, M., & Hofoss, D. 2003. Patient Experiences with Information in a Hospital Setting A Multilevel Approach. Medical Care, 41(4): 490-499.
Wang, L., Fan, X., & Wilson, V. 1996. Effects of Nonnormal Data on Parameter Estimates and Fit Indices for a Model with Latent and Manifest Variables: An Empirical Study. Structural Equation Modeling, 3: 228-247.
Ware, J. E., Davies-Avery, A., & Stewart, A. L. 1978. The Measurement and Meaning of Patient Satisfaction. Health and Medical Care Services Review, 1(1): 3-15.
Ware, J. E., & Snyder, M. K. 1975. Dimensions of Patient Attitudes Regarding Doctors and Medical Care Services, Rand Paper Series no. 5415. Santa Monica, CA: Rand.
Weech-Maldonado, R., Morales, L., Elliott, M., Spritzer, K., Marshall, G., & Hays, R. 2003.

127
Race/Ethnicity, Language, and Patients' Assessments of Care in Medicaid Managed Care. Health Services Research, 38(3): 789-808.
Westaway, M. S., Rheeder, P., Van Zyl, D. G., & Seager, J. R. 2003. Interpersonal and Organizational Dimensions of Patient Satisfaction: The Moderating Effects of Health Status. International Journal for Quality in Health Care, 15(4): 337-344.
Wong, H., Zhan, C., & Mutter, R. 2005. Do Different Measures of Hospital Competition Matter in Empirical Investigations of Hospital Behavior? Review of Industrial Organization, 26: 61-87.
Young, G. J., Meterko, M., & Desai, K. R. 2000. Patient Satisfaction with Hospital Care: Effects of Demographic and Institutional Characteristics. Medical Care, 38(3): 325-334.
Zinn, J., Mor, V., Castle, N., Intrator, O., & Brannon, D. 1999. Organizational and Environmental Factors Associated with Nursing Home Participation in Managed Care. Health Services Research, 33 (6): 1753-1767.

128
Appendix A: NRC Picker Domains of Patient Assessments of Care and Comprising Items
Domain ItemCoordination of care
1. How organized was the care you received in the emergency room?2. How organized was the admission process?3. Do you feel you had to wait an unnecessarily long time to go to your
room?4. Was there one particular doctor in charge of your care in the hospital?5. Sometimes in the hospital, one doctor or nurse will say one thing and
another will say something quite different. Did this happen to you?6. Were your scheduled tests and procedures performed on time?
Continuity and transition of care
1. Did someone from the hospital staff explain the purpose of the medicines you were to take home in a way you could understand?
2. Did someone tell you about medication side effects to watch for when you went home?
3. Did they tell you what danger singles about your illness or operation to watch for after you went home?
4. Did they tell you when you could resume your usual activities, such as when to go back to work or drive a car?
Physical comfort
1. When you needed help getting to the bathroom, did you get it in time?2. How many minutes after you used the call button did it usually take
before you got the help you needed?3. How many minutes after you requested pain medicine did it usually
take before you got it?4. Do you think the hospital staff did everything they could to help you
control you pain?
Emotional support
1. If you had any anxieties or fears about your condition or treatment, did a doctor discuss them with you?
2. Did you have confidence and trust in the doctors treating you?3. If you had any anxieties or fears about your condition or treatment, did
a nurse discuss them with you?4. Did you have confidence and trust in the nurses treating you?5. Was it easy for you to find someone on the hospital staff to talk to
about your concerns?6. Did you get as much help as you wanted from someone on the hospital
staff in figuring out how to pay your hospital bill?

129
Domain ItemInformation and education
1. While you were in the emergency room, did you get enough information about your medical condition and treatment?
2. If you had to wait to go to your room, did someone from the hospital explain the reason for the delay?
3. When you had important questions to ask a doctor, did you get answers you could understand?
4. When you had important questions to ask a nurse, did you get answers you could understand?
5. Did a doctor or nurse explain the results of tests in away you could understand?
Involvement of family and friends
1. Did your family or someone close to you have enough opportunity to talk to your doctor?
2. How much information about your condition or treatment was given to your family or someone close to you?
3. Did the doctors and nurses give your family or someone close to you all the information they needed to help you recover?
Respect for patient preferences
1. Did doctors talk in front of you as if you were not there?2. Did nurses talk in front of you as if you were not there?3. Did you have enough say about your treatment?4. Did you feel like you were treated with respect and dignity while you
were in the hospital?
Overall satisfaction with care
1. How would you rate the courtesy of the staff who admitted you?2. How would you rate the courtesy of your doctors?3. How would you rate the courtesy of your nurses?4. How would you rate the availability of your doctors?5. How would you rate the availability of your nurses?6. How would you rate how well the doctors and nurses worked together?7. Overall, how would you rate the care that you received at the hospital?8. Would you recommend this hospital to your friends and family?
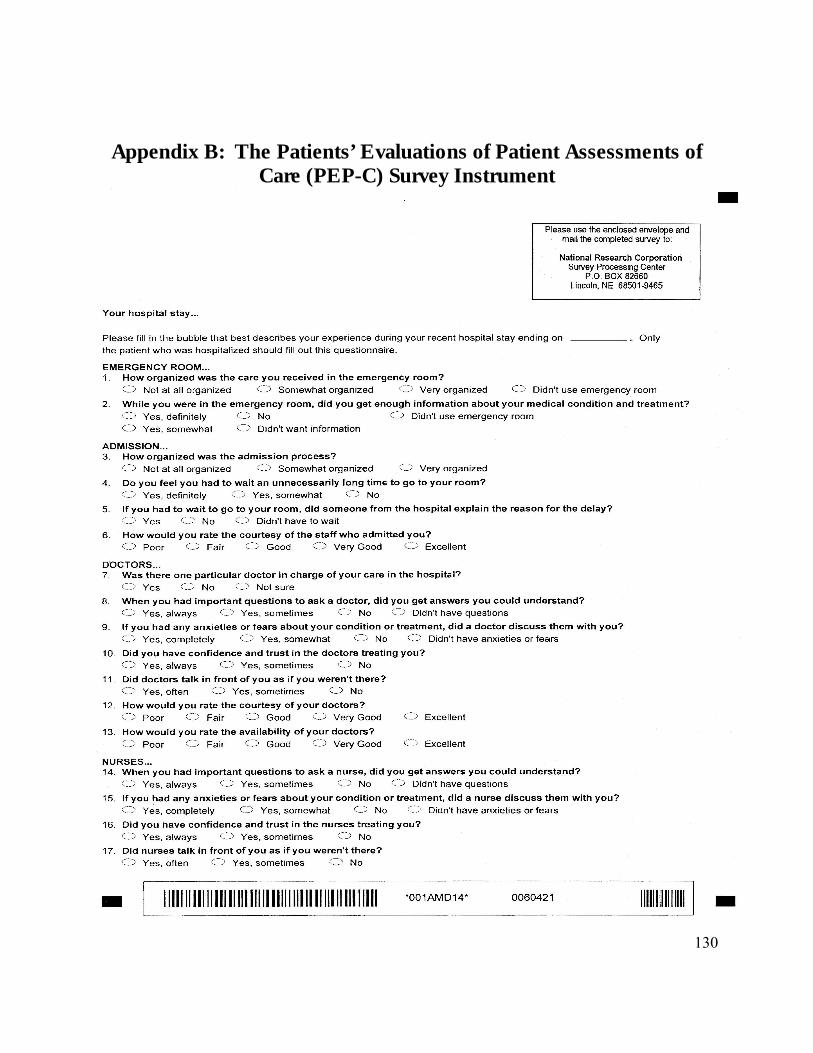
130
Appendix B: The Patients’ Evaluations of Patient Assessments of Care (PEP-C) Survey Instrument

131

132

133

VITAE
Azza AbuDagga
Ph.D. The Pennsylvania State University (PSU), University Park, PA, U.S.AHealth Policy and Administration (HPA), 2009
M.H.A. The Ohio State University, Columbus, OH, U.S.AHealth Services Management and Policy, 2000
B.S.N. The Islamic University of Gaza, Palestine(with honors) Nursing, 1997
SELECT WORK EXPERIENCE
6/2007 – 2/2008 Research Associate, IMPAQ International LLC, Columbia, MD, U.S.A
1/2005 – 8/2005 Research Assistant, Office of Nursing Research, PSU, U.S.A
8/2001 – 5/2005 Teaching and Research Assistant, HPA Department, PSU, U.S.A
8/2000 – 7/2001 Instructor, The Palestine College of Nursing, Gaza, Palestine
SELECT PRESENTATIONS/ PUBLICATIONS
AbuDagga, A; Weech-Maldonado, R; & BeLue, R. (June, 2009). “Organizational and Market Predictors of Multidimensional Process Measures of Hospital Quality.” Poster Presentation, AcademyHealth Annual Research Meeting. Chicago, IL. (Forthcoming).
Urdapilleta, O & AbuDagga, A. (Feb, 2008). “Stakeholder Collaboration Strategy: National Balancing Indicator Contractor (NBIC) to Conduct Research, Development and Technical Assistance on Long-term Support System Balancing Indicators.” Prepared for Susan Hill, Centers for Medicare & Medicaid.
Ying, W; Higgins, A; Young, T; Ettinger, A; Sohn, E; AbuDagga, A; Mohamoud, S; Austin, L; & Urdapilleta, O. (Dec, 2007). “Draft Methodology Report For Alternative Approaches to Establishing Thresholds And Star Ratings For Individual Measures of Medicare Part D Organizations’ Reprot Card.” Prepared for: Division of Clinical & Economics Performance, Centers for Medicare & Medicaid.
Loeb, S. & AbuDagga, A. (2006). “Health-Related Research on Older Inmates: An Integrative Review.” Research in Nursing and Health, 29. 556-565.
Weech-Maldonado, R; AbuDagga, A; & Hays, RD. (Nov, 2004). “Cultural Competency & Patient Experiences with Hospital Care.” Symposium, GSA Annual Meeting, D.C.
Weech-Maldonado, R; AbuDagga, A; and Hays, RD. (June, 2004). “Racial/Ethnic and Language Differences in Patient Assessments of Hospital In-patient Care: A State-wide Survey.” Poster Presentation, AcademyHealth Annual Research Meeting. San Diego, CA.