Embed Size (px)
Citation preview

Seton Hall UniversityeRepository @ Seton HallSeton Hall University Dissertations and Theses(ETDs) Seton Hall University Dissertations and Theses
2011
A Multiple Regression Analysis of FactorsConcerning Superintendent Longevity andContinuity Relative to Student AchievementTimothy PlottsSeton Hall University, [email protected]
Follow this and additional works at: https://scholarship.shu.edu/dissertations
Part of the Educational Administration and Supervision Commons
Recommended CitationPlotts, Timothy, "A Multiple Regression Analysis of Factors Concerning Superintendent Longevity and Continuity Relative to StudentAchievement" (2011). Seton Hall University Dissertations and Theses (ETDs). 484.https://scholarship.shu.edu/dissertations/484

A MULTIPLE REGRESSION ANALYSIS OF FACTORS CONCERNING SUPERINTENDENT LONGEVITY AND CONTINUITY RELATIVE TO STUDENT
ACHIEVMENT
BY
TIMOTHY PLOTTS
Dissertation Committee
Dr. Daniel Gutmore, Mentor Dr. Chris Tienken, Committee Member Dr. Kelly Cooke, Committee Member
Dr. Michael Valenti, Committee Member
Submitted in Partial Fulfillment of the Requirements for the Degree
Doctor of Education Seton Hall University

SETON HALL UNIVERSITY COLLEGE OF EDUCATION AND HUMAN SERVICES
OFFICE OF GRADUATE STUDIES
APPROVAL FOR SUCCESSFUL DEFENSE
Doctoral Candidate, Tim Plotts, has successfully defended and made the required
modifications to the text of the doctoral dissertation for the Ed.D. during this Summer
Semester 201 1.
DISSERTATION COMMITTEE (please sign and date beside your name)
Committee Member: Dr. Christopher Tienken cd.tfl- x,,.,~~-. g ~ -
Committee Member: Dr. Kelly Cooke
Committee Member: Dr. Michael Valenti
External Reader:
The mentor and any other committee members who wish to review revisions will sign and date this document only when revisions have been completed. Please return this form to the Office of Graduate Studies, where it will be placed in the candidate's file and submit a copy with your final dissertation to be bound as page number two.

O Copyright by Timothy Sean Plotts, 201 1 All Rights Reserved

ABSTRACT
The purpose of this quantitative study was to examine the relationship between
the length of superintendent tenure, longevity, and continuity relative to student
achievement as evidenced by the 2008-2009 3rd Grade New Jersey Assessment of Skills
and Knowledge (NJASK) in language arts. Achievement in the study was defined as
those students who scored "proficient'' or better on the 2008-2009 New Jersey
Assessment of Skills and Knowledge in grade 3 language arts. This study used existing
empirical data from the New Jersey School Report Card and Data Universe. To put this
relationship into better context, the researcher used eight predictive variables in this
study: Total Student Population, Eligible for Free Lunch, Eligible for Reduced Lunch,
Limited English Proficient (LEP), Attendance, Experience as a Superintendent,
Educational Experience in New Jersey, and Total Educational Experience. The
researcher focused on New Jersey School Districts in the lower socio-economic
categories of A-CD. In the District Factor Grouping (DFG) of A-CD the researched
examined all 161 A-CD school districts in New Jersey. 19 Districts were removed based
on the removal criterion and not having data on the New Jersey School Report Card and
Data Universe. The study then examined the remaining 142 A-CD school districts in
New Jersey.
As part of the conceptual framework the researched looked to build upon the
research of the Mid-Continent Research for Education and Learning's (McREL)) School
District Leadership That Works; The Effects of Superintendent Leadership on Student
Achievement; A Working Paper (Waters and Marzano, 2006). As the researcher
examined and analyzed The School District Leadership That Works, A Working Paper,

Waters and Marzano published District Leadership That Works, Striking The Right
Balance (Marzano and Waters, 2009). The researcher examined four main findings:
Finding 1 : Does district leadership matter? Finding 2: Effective superintendents focus
their efforts on creating goal oriented districts which include the following: collaborative
goal setting, non-negotiable goals for achievement and instruction, board alignment and
support of district goals, monitoring goals for achievement and instruction, and the use of
resources to support achievement and instruction goals. Finding 3: Superintendent tenure
is positively correlated with student achievement. Finding 4: Defined autonomy.
The backward method of multiple regression was utilized to analyze these data.
Before performing the analysis, the researcher first checked to ensure that the assumption
of no multicollinearity (heavily related variables) had been met. From this analysis all
eight predictive variables were retained as no relationships between them were found to
be too strong. As this check was completed, the backward method of multiple regression
analysis was performed. The method of multiple regression sought to create the most
closely related model.
Results from this study revealed that 3 of the eight predictive variables were
statistically significant at the .05 level. The most statistically significant variable was
students in district who qualified for Free and Reduced Lunch (.000). In terms of looking
at the superintendent's tenure, continuity and longevity which was the focus o the study,
only experience in New Jersey (.018) was found to be statistically significant. The other
factors of longevity in district Experience in Education (.609) as well as Experience as
Superintendent in District (.702) did not have a statistically significant impact on the
dependent variable student achievement.

Insights gained by this investigation will provide opportunities for those interested
in the superintendency to determine if they will have a direct impact on student academic
achievement. Looking at the predictive variables that most impact student academic
achievement at the superintendent level will greatly guide future and practicing
superintendents as they develop strategic plans to improve student academic achievement
on the New Jersey Assessment of Skills and Knowledge in grade 3 language arts.

ACKNOWLEDGEMENTS
The path to complete my doctoral program and this current research would not
have been possible without the help of the many people who worked diligently in
assisting me to achieve my goal. The road to becoming a doctor in education has been
filled with bumps and hurdles that had to be overcome. The knowledge, experience, and
wisdom of my dissertation committee made writing my dissertation insightful and the
overall experience extremely fulfilling as an educator.
First and foremost, I would like to thank Dr. Daniel Gutmore. Dr. Gutmore met
with me before I had really delved into the process. He encouraged me and made me
believe that this was possible to achieve. Dr. Gutmore has always brought out the best in
me as a student in class, and now as a doctoral dissertation candidate. As the dissertation
committee mentor, Dr. Gutmore gave me unlimited time to meet and question him
regarding my dissertation. He pushed and assisted me to continually improve my work.
He was even willing to meet with me when the university was closed for spring break.
This is and was greatly appreciated. Dr. Gutmore was always willing to answer my
questions, take my calls, and respond to my emails no matter what time of the day or
night. Dr. Gutmore's expertise, direction, and knowledge enabled me to complete this
goal. I am forever grateful to Dr. Gutmore for this.
I would also like to extend my sincere gratitude to Dr. Christopher Tienken. Dr.
Tienken served as my Dissertation I and I1 advisor. He was the second reader on my
dissertation committee and he offered outstanding advice from the inception of my
dissertation to its completion. Dr. Tienken was integral in teaching me about research
and how to conduct it correctly. For that I am extremely grateful. Dr. Tienken is the
vii

future of the Seton Hall Staff and I can only hope to continue our relationship in the
future. I thank him for all his time spent and look forward to assisting him with future
initiatives at Seton Hall.
A special acknowledgement and thank you of my sincerest gratitude goes out to
Dr. Michael Valenti, Dr. Kelly Cooke, and Dr. Daniel Johnson. Their friendship,
guidance, support, and encouragement enabled me to believe that this was possible no
matter how long the road traveled. I am blessed to be able to have worked with these
three innovative educators on my dissertation, but feel that I am more blessed to be able
to call them my friends. Thank you for your unwavering support and encouragement.
I would like to extend my gratitude and a special thank you to Dr. Michael
Osnato. As the guiding force in the department Dr. Osnato never allowed me to get down
when times were tough. His support, instruction on school administration, and guidance
over the years have been invaluable. As the department chair, his devotion to my success
at Seton Hall went above and beyond the call of duty and even my own expectations. I
am truly grateful for all you did for me during my time at Seton Hall.
. . . V l l l

DEDICATION
This dissertation is dedicated to my family. I am truly the most blessed man in
the world to have such a supporting family with me for the ride as I try to achieve my
goals.
First and foremost, I would like to thank my wife and best friend Jennifer. Jen,
since we have been together you have shown an incredible ability to believe in me, and in
turn shown me how to believe in myself. Your honesty, and consistent encouragement
are the only reasons why I am able to achieve this goal. You are the hardest worker I
know and I hope that your work ethic rubbed off on me in writing a great dissertation.
Thank you for blessing me with three beautiful children, Bailey, Colby, and Ty, By
practicing what you preach, our children have learned the value of a good education and
hopefully will strive for the stars. Lastly, Jen, you taught me to dream and then take
action to achieve our dreams. This dream is coming true because of you! I love you and
feel I am the luckiest man in the world to be able to share our lives together!
To my children, Bailey (age 9), Colby (age 7), and Ty (age 2) as our favorite
movie actor Rocky said: "I DID IT!" You three are the reason I wake up so early in the
morning (4 a.m.) to work on my dissertation. 1 hope that in my completing the
dissertation it will enrich your lives. As Pop once told me "Value education, It will be
the key for achieving any thing you want in life!" Bailey, Colby, and Ty I thank you for
your patience with Dad as I went through this process. You three have taught me so
much more than I can ever teach you. I love you, and yah "I know you know!"
To my family thank you for your continued support. I hope this inspires you to
realize with hard work anything is possible!

TABLE OF CONTENTS
Page
. . ................................................................................... Approval ii
... ................................................................................. Copyright 111
.................................................................................... Abstract iv
. . ....................................................................... Acknowledgments vii
................................................................................. Dedication ix
... ............................................................................ List of Tables xi11
. . . . . . . . . . . . . . . . . . . . . . . . . . . . . . . . . . . . . . . Chapter I INTRODUCTION 1
. . . . . . . . . . . . . . . . . . . . . . . . . . . . . . . . . . . . . . . . . Background of the Study - 2
. . . . . . . . . . . . . . . . . . . . . . . . . . . . . . . . . . . . . . . . . . Statement of the Problem 3 Purposeofthestudy . . . . . . . . . . . . . . . . . . . . . . . . . . . . . . . . . . . . . . . . . . . . . . 5
. . . . . . . . . . . . . . . . . . . . . . . . . . . . . . . . . . . . . . . . . . . Significance of the Study 6 . . . . . . . . . . . . . . . . . . . . . . . . . . . . . . . . . . . . . . . . . . . . . . Research Questions - 7
. . . . . . . . . . . . . . . . . . . . . . . . . . . . . . . . . . . . . . . . . . . . Conceptual Framework 7 . . . . . . . . . . . . . . . . . . . . . . . . . . . . . . . . . . . . . . . . . . . Design and Procedures -10
Assumptions . . . . . . . . . . . . . . . . . . . . . . . . . . . . . . . . . . . . . . . . . . . . . . . . . . . . 13 . . . . . . . . . . . . . . . . . . . . . . . . . . . . . . . . . . . . . . . . . . . . Limitations of the Study 13
. . . . . . . . . . . . . . . . . . . . . . . . . . . . . . . . . . . . . . . . Delimitations of the Study 13 . . . . . . . . . . . . . . . . . . . . . . . . . . . . . . . . . . . . . . . . . . . . Definition of Terms ; 13
. . . . . . . . . . . . . . . . . . . . . . . . . . . . . . . . . . . . . . . . . . . . . . . . . . . . . Summary 17
. . . . . . . . . . . . . . . . . . . Chapter I1 . REVIEW OF RELATEDLITERATURE 18
. . . . . . . . . . . . . . . . . . . . . . The Historical Perspective of the Superintendency 18 . . . . . . . . . . . . . . . . . . . . . . . . . . . . . . . . . . . . . . . . . . . PurposeoftheReview 19
. . . . . . . . . . . . . . . . . . . . . . . . . . . . . . . . . . . . . . . . . . . . . . Research Questions 19 . . . . . . . . . . . . . . . . . . . . . . . . . . . . . . . . . . . . . . . Literature Search Procedures 20
. . . . . . . . . . . . . . . . . . Inclusion and Exclusion Criteria for Literature Review 20 . . . . . . . . . . . . . . . . . . . . . . . . . . . . . . . The Evolution of the Superintendency 21
................................................................................. Synthesis -22 . . . . . . . . . . . . . . . The Evolutionary Stages in the Role of the Superintendent 25
.................................................................................. Synthesis 29 The Ever Changing Roles of the Superintendency in American Education . . . 30
................................................................................. Synthesis -33

The Superintendent in Contemporary Times of Change . . . . . . . . . . . . . . . . . . 33 Synthesis .................................................................................. 36 Era of Accountability under Adequate Yearly Progress . . . . . . . . . . . . . . . . . . . 37
. . . . . . . . . . . . . . . . . . . . . . . . . . . . . . . . . . . . Federal Requirements of NCLB 37 . . . . . . . . . . . . . . . . . . . . . . . . . . . . . . . . . . . . . . . . . . . Calculating Safe Harbor 38
................................. Instructional Leadership and Student Achievement 39 Synthesis .................................................................................. 42 Board-Superintendent Relationships . . . . . . . . . . . . . . . . . . . . . . . . . . . . . . . . . 42
................................................................................. Synthesis -44 Board Hidden Agendas and Superintendent Relationships . . . . . . . . . . . . . . . . 44
................................................................................. Synthesis -45 ................ Board-Superintendent Expectations in Longevity and Continuity 45
Synthesis .................................................................................. 46 Summary ................................................................................. -47
. Chapter I11 METHODOLOGY . . . . . . . . . . . . . . . . . . . . . . . . . . . . . . . . . . . 50
Research Questions . . . . . . . . . . . . . . . . . . . . . . . . . . . . . . . . . . . . . . . . . . . . . . 52 Statement of Problem . . . . . . . . . . . . . . . . . . . . . . . . . . . . . . . . . . . . . . . . . . . . 52 Research Design . . . . . . . . . . . . . . . . . . . . . . . . . . . . . . . . . . . . . . . . . . . . . . . . 54 Sample . . . . . . . . . . . . . . . . . . . . . . . . . . . . . . . . . . . . . . . . . . . . . . . . . . . . . . . 57 Conceptual Framework . . . . . . . . . . . . . . . . . . . . . . . . . . . . . . . . . . . . . . . . . . . . 58 Synthesis ................................................................................... 60 Data Collection . . . . . . . . . . . . . . . . . . . . . . . . . . . . . . . . . . . . . . . . . . . . . . . . -61 Data Analysis . . . . . . . . . . . . . . . . . . . . . . . . . . . . . . . . . . . . . . . . . . . . . . . . . . . . - 6 3 Summary . . . . . . . . . . . . . . . . . . . . . . . . . . . . . . . . . . . . . . . . . . . . . . . . . . . . . . . 64
Chapter IV . ANALYSIS AND PRESENTATION OF DATA . . . . . . . . . . . . . 65
Data Analysis Procedures . . . . . . . . . . . . . . . . . . . . . . . . . . . . . . . . . . . . . . . . . . . . 67 Research Question 1 . . . . . . . . . . . . . . . . . . . . . . . . . . . . . . . . . . . . . . . . . . . . . . . 74 Research Question 2 . . . . . . . . . . . . . . . . . . . . . . . . . . . . . . . . . . . . . . . . . . . . . . . 81 Rank Order of the Most Significant Predictive Variables . . . . . . . . . . . . . . . . . . .85 Summary . . . . . . . . . . . . . . . . . . . . . . . . . . . . . . . . . . . . . . . . . . . . . . . . . . . . . . . . . . 89
Chapter V . CONCLUSIONS. RECOiMMENDATIONS FOR PRACTICE. RECOMMENDATIONS FOR POLICY ................................................ 91
................................................................................. Introduction 91 Eligible For Free Lunch Variable ......................................................... 92 Conclusions ................................................................................... 92 Recommendation for Practice ............................................................ 93 Recommendation for Policy ................................................................ 93 Experience in New Jersey Variable ...................................................... 94
.................................................................................. Conclusion -94 Recommendation for Practice ............................................................ 95

Recommendation for Policy ............................................................... 96 Attendance Variable ......................................................................... 97 Conclusion .................................................................................... 97 Recommendation for Practice ............................................................. 98 Recommendation for Policy ................................................................ 98
. . . . . . . . . . . . . . . . . . . . . . . . . . . . . . . . . . . . . . . . . . . . . . . . SummaryofPurpose 99 SummaryofProcedures . . . . . . . . . . . . . . . . . . . . . . . . . . . . . . . . . . . . . . . . . . . . . 101 Recommendations for Further Research . . . . . . . . . . . . . . . . . . . . . . . . . . . . . . . . 103 Conclusion . . . . . . . . . . . . . . . . . . . . . . . . . . . . . . . . . . . . . . . . . . . . . . . . . . . . . . . . 105
References . . . . . . . . . . . . . . . . . . . . . . . . . . . . . . . . . . . . . . . . . . . . . . . . . . . . . . . . . 109

Table
LIST OF TABLES
Page
Number of School Districts Used in Study (DFG A-CD) ....................... 55
Collinearity: Pearson Correlation ................................................... 67
Coefficients and Multi-Collinearity Tolerance and Variance .................. 69
Inflation Factor (VIF)
Model Summary ..................................................................... -70
Predictive Variables Used ........................................................... 71
Table V . Descriptive Statistics ................. .. .................................. 85
SPSS Straight Data Tables ........................................................... 86
2009 New Jersey School Report Card Data A-CD Districts ..................... 117
... X l l l

FIGURES
Figure Page
............................................................................. Histogram -72
............................................ P-plot distribution Observed Cum Prob 73
................................. Partial regression plot Total Student Population 74
................................... Partial regression plot Eligible for Free Lunch 75
.............................. Partial regression plot Eligible for Reduced Lunch 77
....................... Partial regression plot Limited English Proficient (LEP) 78
................................................. Partial regression plot Attendance 79
.............. Partial regression plot Experience as Superintendent in District 81
............................... Partial regression plot Experience in New Jersey 82
.......................................... Partial regression plot Experience Total 84
xiv

Chapter I
INTRODUCTION
Superintendent leadership and student achievement are five words that have
become synonymous with our current educational system since the inception of the 200 1
No Child Left Behind Act (NCLB US Department of Education, 2002, p. 5). The NCLB
Act has fostered accountability. The word accountability is synonymous with
standardized tests like the New Jersey Assessment of Skills and Knowledge (NJASK) for
grade 3 students in language arts. The reason for my focus on the New Jersey
Assessment of Skills and Knowledge for grade 3 in language arts is that under the 200 1
No Child Left Behind Act, is "to support states in making every child a proficient reader
by the end of the third grade" (Helf, Cooke, & Flowers, 2008, p. 13). The question that I
am are looking to answer is does the relationship between New Jersey Superintendent
tenure, continuity, and longevity at the district level impact student achievement on the
2009 New Jersey Assessment of Skills and Knowledge (NJASK) for grade 3 in language
arts?
The belief of many is that the superintendent has little impact on the success of
students. In (School Leadership That Works: From Research to Results), Marzano,
Waters, & McNulty reported that there is a significant relationship between the principal
and average student achievement in school with a correlation of .25. This positive
correlation at the building level gives me hope that a positive impact at the district level
may be found. In my research study, I will look to find out if district level superintendent
tenure has a positive impact on student academic achievement.

Background of the Study
The history, evolution, as well as the ever changing roles of the superintendency
in American education, on how demographics like tenure, longevity, and continuity may
impact student achievement are worthy of rigorous research. The role of the
superintendent in today's educational climate is controlled by measures of accountability
and standards on which their job performance is judged. Examining the impact of
superintendent longevity, tenure, and continuity on student achievement is one area of
study that would be of great value to the overall efficacy of the superintendent on student
achievement. Research shows that the average superintendent tenure is 5 to 7 years and
is much better than the perceived tenure of 2 % years (Marzano & Waters, 2009 p. 114).
"For various reasons the superintendency may be evolving into a temporary position"
(Clark, 2001, p. 40). In examining the extant literature, a goal is to see if there is a
relationship between superintendent tenure, longevity, and continuity on student
achievement that limits perceived superintendent turnover in the position. The rapid
turnover of superintendents leads to a break in the continuity of the academic
environment, which, more often than not, leads to additional turnover (Yee & Cuban,
1996).
In 2006, Marzano and Waters published School District Leadership Thaf Works:
The Effect . . ofSuperintendent Leadership on Student Achievement; A Working Paper. In
this study, the Mid-Continent Research For Education and Learning (McREL) research
team looked at a meta-analysis involving a range of quantitative techniques for
synthesizing research regarding a specific topic (Marzano & Waters, 2009). This
working paper was turned into a published book in 2009 called District Leadership That

Works: Striking the Right Balance. This became the framework of my study. In their
research McREL examined 2,8 17 districts, 3.4 million students, and conducted
examinations of 27 studies that met their criteria (Marzano & Waters, 2006). From their
quantitative examination four major findings emerged: Finding 1 : District Level
Leadership Matters, Finding 2: Effective Superintendents focus their efforts on creating
goal oriented districts, Finding 3: Superintendent Leadership is positively correlated with
student achievement, Finding 4: Defined Autonomy Matters.
Synthesis. The literature suggests that district level leadership at the top matters in
terms of impacting student achievement. Although there are limited studies on this topic,
there is a positive relationship between superintendent longevity, continuity, and tenure
on student achievement based on the study conducted by Marzano and Waters in 2009. If
principals are to create the conditions that lead to improved student learning, districts
must consider the research on school leadership practices that are correlated to student
achievement (Marzano & Waters, 2006, p. 14).
Statement of the Problem
In the state of New Jersey, success at the elementary level is defined by student
achievement on the New Jersey Assessment of Skills and Knowledge (NJ ASK) in
language arts for grade 3. As a researcher, the problem I chose to focus on is the New
Jersey Assessment of Skills and Knowledge in 2009 for language arts in grade 3 because
one of the foundations of the No Child Left Behind Act of 2001 is "to support states in
making every child a proficient reader by the end of third grade" (Helf, Cooke, &
Flowers, 2008, p. 13). According to Tienken 2008a: "school district leaders and '
administrators place great emphasis on state standardized test results to make what is

believed to be informed decisions regarding future student placement and overall
academic standings (p.2). Evidence indicates the NJ ASK and similar tests "have
technical limitations and flaws that call into question the use of results from those tests as
high-stakes evaluative and decision-making tools" (Tienken, 2008b, p.4). Under
President George W. Bush by 20 14 100% of all third graders should be literate in
language arts as evidenced by scoring proficient or advanced proficient on the high stakes
assessments each state administers (The New Jersey Assessment of Skills and
Knowledge). There is evidence that exists that superintendents impact student
achievement through the "promotion, support and development of principals as
instructional leaders" (Cuidiero, 2005, p. 16). In examining the most current research
little is known about how superintendents impact student achievement, other than by their
developing strategic plans and their establishing of district goals. The accountability
requirements of the No Child Left Behind Act (NCLB, 2001) will be in full effect
through 2014, so, as educators, we must take the necessary actions and steps to ensure
that we address the challenges in district level leadership and student achievement that
come with the No Child Left Behind Act accountability regulations. In this study, the
findings should provide a connection to improve student achievement in any DFG school
district, especially those located in districts within the A-CD DFG in New Jersey.
"Research increasingly points to the relationship between effective leadership and
increased student achievement" (Marzano & Waters, 2006, p. 12). The role of
superintendent has changed greatly since public education began. In the early days, the
superintendent had the responsibility of overseeing a district. This has changed in that
the superintendent is now a professional who has the responsibility of making sure every

student in hislher care makes and meets the requirements of No Child Left Behind (2001)
in terms of academic achievement. By meeting the federal mandates of the No Child Left
Behind Act, public school superintendents will ultimately take on more significant
responsibilities and duties. Research shows that by fulfilling their duties in a responsive
manner, the superintendent positively impacts student achievement (Marzano & Waters,
2006, p. 14). The students of any school district in New Jersey, regardless of District
Factor Grouping and socio-economic status, will benefit greatly from the educational
achievement opportunities that a superintendent with tenure, longevity, and continuity
can bring to a district.
Purpose of the Study
The purpose of this study is to examine the impact of the length of superintendent
longevity, continuity, and tenure in New Jersey School Districts on student achievement
as evidenced by students scoring proficient in 2009 on the New Jersey Assessment of
Skills and Knowledge in grade 3 for language arts. My study will look at predictive
variables from the percentage of students who scored at or above the proficient level on
the third grade Assessment of Skills and Knowledge language arts in 2009 for grade 3
and other district demographic information.
As the extant literature is examined, it is my wish that the knowledge and insights
gained in this study will further enhance opportunities for those who wish to join the rank
of superintendent in the state of New Jersey to achieve longer tenure, longevity, and
continuity in their careers. The insights gained in my investigation may provide
opportunities for those who have not yet committed to the position of superintendent due

to the uncertainty of the No Child Left Behind Act, the current political climate and the
state of education with the governor of New Jersey, and the current accountability rules.
Examining and identifying the practices of superintendents who have met
accountability standards and Adequate Yearly Progress by having their students in grade
3 pass language arts on the New Jersey Assessment of Skills and Knowledge at the
proficient level will provide great insight for future superintendents on how their
longevity, continuity, and tenure may positively impact student achievement. Examining
superintendents in lower socio-economic district factor groupings and their ability to
achieve Adequate Yearly Progress, as evidenced by scoring proficient or better on the
2009 language arts New Jersey Assessment of Skills and Knowledge in grade 3, will
enable future educational leaders to greater understand their roles as they work to
positively impact student academic achievement.
Significance of the Study
This study is significant because much of the research data adds to the extant
literature on superintendent tenure, continuity, and longevity relative to student
achievement on the New Jersey Assessment of Skills and Knowledge (NJASK) for grade
3 in language arts. Currently, greater emphasis is being placed on New Jersey
superintendents because of their greater accountability since the No Child Left Behind
Act of 2001. New Jersey's achievement scores have been raised each year since the
inception of the No Child Left Behind legislation, with a 100% proficiency level
expected by the year 2014. With the knowledge gained from this research, districts may
be better able to retain their superintendents and may be more apt to offer longer tenure,
continuity, and longevity as long as there is a positive correlation to increased student

achievement. Information can be drawn from this research that would help school
districts maintain quality superintendents. The findings of my research should enable
school superintendents to assist one another in maintaining and achieving student
academic achievement on the 2008-2009 New Jersey Assessment of Skills and
Knowledge in language arts for grade 3.
Research Questions
The following questions guided this research:
What is the relationship between New Jersey Superintendent's district continuity
(i.e. length of tenure as a superintendent), and their longevity (i.e. years of experience as
a superintendent), and the total number of years in education as they relate to student
academic achievement as evidenced on the 2008-2009 third grade New Jersey
Assessment of Skills and Knowledge (NJASK) in language arts?
What is the relationship between New Jersey Superintendent's district
demographics relative to student academic achievement as evidenced by the 2008-2009
third grade New Jersey Assessment of Skills and Knowledge (NJASK) in language arts?
Conceptual Framework
The Mid-Continent Research for Education and Learning (McREL, 2001)
analyzed and conducted a meta-analysis (combining data from separate studies into a
single sample of research) on the influence of district leaders and student performance.
The goal of the study was to determine the characteristics of effective schools, leaders,
and teachers. McREL took the findings from 27 studies that were conducted since the
1970's and analyzed the data. Each study examined used rigorous quantitative methods
to examine the influence school district leadership on student academic achievement

(Marzano & Waters, 2006). From the study conducted by Marzano and Waters (2006),
the following four major findings emerged,
Finding 1 : District-level leadership matters
Finding 2: Effective superintendents focus their efforts on creating goal
oriented districts which include the following:
1. Collaborative goal-setting.
"Researchers found that effective superintendents include all relevant
stakeholders, including central office staff, building-level administrators,
and board members in establishing goals for their districts" (Marzano &
Waters, 2006 p. 3).
2. Non-negotiable goals for achievement and instruction.
"Effective superintendents ensure that the collaborative goal-setting
process results in non-negotiable goals (i.e. goals that all staff members
must act upon) in at least two areas: student achievement and classroom
instruction. Effective superintendents set specific achievement targets for
schools and students and then ensure the consistent use of research -based
instructional strategies in all classrooms to reach those targets" (Marzano
& Waters 2006 p. 4).
3. Board alignment and support of district goals.
"In all districts with higher levels of student achievement, the local board
of education is aligned with and supportive of the non-negotiable goals for
achievement and instruction. They ensure these goals remain the primary
focus of the district's efforts and that no other initiatives detract attention
or resources from accomplishing these goals" (Marzano & Waters 2006
p.4).
4. Monitoring goals for achievement and instruction.
"Effective superintendents continually monitor district progress toward
achievement and instructional goals to ensure that these goals remain the
driving force behind a district's actions" (Marzano & Waters 2006 p.4).
5. Use of resources to support achievement and instruction goals.
"Effective superintendents ensure that the necessary resources, including
time, money, personnel, and materials, are allocated to accomplish the
district's goals. This can mean cutting back on or dropping initiatives that
are not aligned with district goals for achievement and instruction''
(Marzano and Waters 2006 p.4).
Finding 3: Superintendent tenure is positively correlated with student
achievement.
"McREL found two studies that looked specifically at the correlations between
superintendent tenure and student achievement. The weighted average correlation in
these two studies was a statistically significant .19, which suggests that the length of
superintendent tenure in a district positively correlates to student achievement. These
positive effects appear to manifest themselves as early as two years into a
superintendent's tenure" (Marzano & Waters 2006 p.4).
Finding 4: Defined autonomy.
"One set of findings from the meta-analysis that at first appears

contradictory involves building-level autonomy within a district. One study
reported that building autonomy has a positive correlation of .28 with average
student achievement in the district, indicating that an increase in building
autonomy is associated with an increase in student achievement. Interestingly,
the same study reported that site-based management had a negative correlation
with student achievement of (-) .16, indicating that an increase in site-based
management is associated with a decrease in student achievement. Researchers
concluded from this finding that effective superintendents may provide principals
with 'defined autonomy.' That is, they may set clear, non-negotiable goals for
learning and instruction, yet provide school leadership teams with the
responsibility and authority for determining how to meet those goals" (Marzano
& Marzano, 2006 p.4).
Synthesis. The literature suggests that district level leadership matters. Effective
superintendents focus their efforts on creating goal oriented districts. Superintendent
tenure is positively correlated with student achievement. Defined autonomy at the
principal level by the superintendent will lead to an increase in student achievement. The
theoretical framework of this study references McREL's four major findings from
"School District Leadership that Works; The Effect of Superintendent Leadership on
Student Achievement; A Working Paper" (Marzano & Waters, 2006).
Design and Procedures
This research study used a non-experimental exploratory multiple-regression
design. This study involved the review of data from the New Jersey School Report Card
and Data Universe to determine which school districts in the District Factor Grouping of

A-CD made adequately yearly progress by achieving proficiency on the 2008-2009 New
Jersey Assessment of Skills and Knowledge (NJASK) grade 3 in language arts. "Non-
expcrimcntal research is frequently an imporlant and appropriate mode of research in
education" (Johnson, 2001, p. 3) due in part to the inability to perform randomized
experiments and quasi-experiments. The purpose of this descriptive, non-experimental,
cross sectional, explanatory study is to examine if the length of a superintendent's tenure,
longevity, and continuity impact student academic achievement on the 2008-2009 New
Jersey Assessment of Skills and Knowledge for grade 3 in language arts. The
correlational study only collected data from one point in time. The researcher used a
multiple-regression process exploring the relationship of predictive variables as they
relate to the dependent variable in this quantitative study of student academic
achievement as defined by scoring proficient on the 2008-2009 New Jersey Assessment
of Skills and Knowledge in language arts for grade 3. In this research study academic
achievement is defined as the percentage of students who score "Proficient" or better on
the 2009 New Jersey Assessment of Skills and Knowledge in language arts for grade 3.
Information for three of the predictive variables came directly from the New
Jersey School Report Card and Data Universe (www.datauniverse.com). The most
important of these predictive variables was the superintendent's time spent in education,
no matter which positions in education were held.
The predictive variables used in this study include the following: (a) experience in district
length of tenure as a superintendent, (b) educational experience in New Jersey, (c) the
total number of years of experience in education.

In examining the extant research the researcher chose to include descriptive data
for inclusion into the study because of the relationship that each variable had on student
academic achievement. The researcher also had a strong interest in seeing the correlation
of these predictive variables with student achievement.
The other predictive variables that were used in the study related to district
demographics. These predictive variables were chosen for inclusion in the study to show
a district's characteristics and will enable the researcher to be able to determine the best
resources and programs to advance student achievement. The variables taken from the
New Jersey School Report Card 2008-2009 Enrollment Summary include the following:
(a) total students population for each school district, (b) the district percentage of students
who qualify for free lunch, (c) the district percentage of students who qualify for reduced
lunch, (d) the district percentage of students who are limited english proficient (LEP), (e)
the district percentage attendance rates.
I chose to separate free and reduced lunch to two separate predictive variables
because of the separation in the 2008-2009 New Jersey School Report Card Enrollment
Summary. Most of the time, in New Jersey people refer to free and reduced lunch as one
thing. As a researcher this needs to be mentioned to provide hrther clarity to my study.
The New Jersey Department of Education School Report Card website
(http://education.state.ni.us/rc/nclb09/reports/27/2380/27-238O-O) and the website Data
Universe (http://php.app.com/edstaff/details2.ph~?recordID+l2559O) were used to
compile the demographic data for this study. The New Jersey Department of Education
School Report Card for 2008-2009 website describes the percentage of "Proficiency" of
third grade students along with the predictive variables.

Assumptions
Assumptions for this study were that if a superintendent has a long standing
tenure, longevity and continuity in a district, they would be more apt to have a high level
of student achievement as defined by scoring proficient or better on the 2008-2009 New
Jersey Assessment of Skills and Knowledge in grade 3 language arts.
Limitations of the Study
The extant literature that was analyzed serves to add to the current research on
superintendent leadership and the impact on student achievement. However, caution
must be exercised when making generalizations based on the findings of this study, as
delimitations and limitations both apply to this quantitative analysis. Some
superintendents retired and left their positions mid-year prior to students taking the 2008-
2009 New Jersey Assessment of Skills and Knowledge for grade 3 in language arts. The
study only focused on one, year's data. The study only focused on one academic area
language arts.
Delimitations of the Study
Delimitations for the study were as follows: (a) data was only analyzed and collected
during the 2008-2009 school year, (b) the study only focused on districts within the DFG
range of A-CD, (c) the research only focused on one year and one subject area.
Definition of Terms
In this study some of the following terms have been specifically defined by me;
others are defined in the literature and these sources are cited.

Academic Achievement (studeni) is the percentage of students in third grade who
score "Proficient" or better on the 2008-2009 New Jersey Assessment of Skills and
Knowledge in language arts.
Adequate YearZy Progress (AYP) is the target set by each state, based on meeting
the No Child Left Behind Act's overall goal that all students be proficient in reading and
math curriculum standards by 2014. As we look at how schools make AYP, the most
important factors are scores on high-stakes reading and mathematics assessments
administered to children annually. To make AYP, a school must meet achievement
guidelines for its student population as a whole, as well as each demographic subgroup.
These groups included racial and ethnic minorities, students with disabilities, and those
who are eligible for services as English-language learners (ELL).
Blob an acronym for "bloated educational bureaucracy" was coined by the
Secretary of Education William Bennett in 1987. Bennett(as cited in Walker 1987)
defined the blob as "people in the education system who work outside of classrooms,
soaking up resources and resisting reform without contributing to student achievement (
P. 1)-
Characteristics are those specific factors and variables to be explored, which
contribute to the longevity of the superintendent in a district. Variables such as school
size, socio-economics, length of tenure, years in district, and other various demographic
information.
Continuity is an uninterrupted succession while working in an educational
capacity.

Defined autonomy is when the superintendent expects building principals and all
other administrators in the district to lead within the boundaries defined by district goals.
(Waters & Marzano, 2009, p. 8).
Failing schools are schools not making adequate yearly progress (AYP).
Longevity is the length of a superintendent's life span in a school district totaling
10 years or more.
Mid-continent Research.for Ed~fcation and Learning (A4cREL)is a nationally
recognized nonprofit organization created to help educators bridge the gap between
research and practice.
New Jersey Assessment of Skills and Knowledge (NJASK) is the annual testing
process utilized by the state of New Jersey to test student competence in reading, math,
and science.
No Child L@ Behind (NCLB) is legislation that was signed into law in 2001 by
President George W. Bush. Its main objective is "to close the achievement gap with
increased accountability, flexibility, and choices so that no child is left behind" (Public
Law 107- 1 10, 107'" Congress, 2002). NCLB articulates a precise formula for ensuring
"that all groups of students including low-income students, students from major racial
and ethnic groups, students with disabilities, and students with limited English
proficiency reach proficiency within 12 years" (U.S. Department of Education, 2002,
p.5).
Percentage o f students who [email protected] and reduced lunch are the percentage
of the total student population who, based on family income levels, meet federal
guidelines for reduced prices for school lunches/meals.

ProJicient is the student academic achievement mark that represents adequate
knowledge in a given subject area.
School bourds are the corporate bodies that derive their legal authority to organize
and operate a school district for the state with statutory responsibilities for policy, budget,
and programs (Blumberg & Blumber, 1985).
School district refers to the geographic boundaries that are governed by a Board
of Trustees that includes schools in single areas which serve the population of the
community.
Superintendent is the chief administrator of a school corporation responsible for
the actions of the school corporation.
Superintendent leadership is the ability of superintendent to lead a school district
in the capacity of Chief Executive Officer (CEO).
Tenure is defined as the characteristics influencing a superintendent to remain in a
New Jersey School District for a multiple year period.
Total studentpopulation is the total number of students in a school district.
Total years experience in district is the total number of years a person has served
in the same school district in the capacity of superintendent.
Total years experience in New Jersey is the total number of years served working
in education in the state of New Jersey.
Total years experience is the total number of years in education, regardless of
positions held.
Turnover is the amount of movement that occurs in and out of an organization due
to resignations, discharges, retirements, and deaths (Shields, 2002).

Uninterrupted tenure is the number of consecutive years a superintendent stays in
the same position within a school district.
Summary
The role of the superintendent, since the inception of the No Child Left Behind
Act of 2001, has faced increased pressure. Today's superintendents face higher levels of
accountability to achieve adequate yearly progress and "Proficiency" on high stakes
assessments like the New Jersey Assessment of Skills and Knowledge. In Chapter I, the
background of the study, specifies of the problem, significance of the study, and presents
a brief overview of the methodology that will be implemented in examination of
superintendent tenure, longevity, and continuity relative to student achievement were
presented. Definition of terms, limitations, and delimitations were presented. A review
of the research and literature is presented in Chapter 11. In the literature review, the
history, evolution, and ever changing roles of the superintendency are examined. Chapter
I1 will examine critical stages in history and their impact on the role of the superintendent
in American education. Chapter I1 will also examine the impacts of the No Child Left
Behind Act, increased accountability, and the Board of Education Superintendent
relationships. Chapter I11 will provide a description of the research design, methodology
for data collection, and analysis used in the present study. Chapter IV will present the
results and findings of the investigation. Chapter IV will also present a detailed statistical
analysis of the data and an interpretation of the descriptive findings that link to the
research questions. Chapter V will provide a summary of the research, its limitations,
and the implications for further study. Chapter V will conclude with the connections
made between prior research, current findings, and future research that can be examined.

Chapter I1
REVIEW OF RELATED LITERATURE
The Historical Perspective of the Superintendency
The history, evolution, and ever changing role of the superintendency in
American education and how demographics like longevity and continuity may impact
student achievement is a topic that is fascinating to study. In looking at the research of
the superintendency from a historical perspective, its evolution over the last 400 years,
and the constant and changing roles that it faces today makes me intrigued and motivated
to study the many different phases of the superintendency and how the job continues to
evolve and change. With greater accountability since The No Child Left Behind Act
(2002), including districts needing to achieve Adequate Yearly Progress (AYP), the
superintendency has become much more difficult. This research paper will show how the
evolution of the superintendency has changed most dramatically since the inception of
the 2002 No Child Left Behind Act. This research will analyze school district
demographics and the superintendent's longevity and continuity relative to student
achievement.
The role of superintendent in today's educational climate is controlled by
measures of accountability and standards on which their job performance is judged. As
the role of the superintendent has evolved and grown in responsibility, those that hold
these positions have also had to change and evolve. Twenty first century superintendents
are far different from the first superintendents of the early 1600's. In this chapter, I will
look to provide information about the history of the superintendency, explore how the

position has evolved, and investigate today's current superintendents and the many
changing roles they now fill.
Purpose of the Review
In reviewing the literature on the topic of superintendent longevity and continuity
relative to student achievement, research based philosophical and theoretical articles
relating to this topic were examined. Although there is some literature, significant
research studies on the topic are lacking. The current amount of literature on
superintendent longevity and continuity and its impact on student achievement is limited.
The purpose of this review is to identify empirical studies that: (a) examine the
history, evolution, and ever changing roles of the superintendency; (b) investigate how
the era of accountability under the No Child Left Behind Act impacts superintendent
leadership relative to student achievement; and (c) identify the factors concerning school
district demographics on superintendent longevity and continuity relative to student
achievement.
Research Questions
This review will be guided by the following three research questions:
#1 What is the relationship between New Jersey Superintendent's continuity; such
as length of tenure as a superintendent, and their longevity; such as; years of experience
as a superintendent and the total number of years in education as they relate to student
academic achievement as evidenced on the 2008-2009 third grade New Jersey
Assessment of Skills and Knowledge (NJASK) in language arts?

#2 What is the relationship between New Jersey Superintendent's district
demographics relative to student academic achievement as evidenced by the 2008-2009
third grade New Jersey Assessment of Skills and Knowledge (NJASK) in language arts?
Literature Search Procedures
In Chapter I1 the extant literature that I reviewed was accessed through several
on-line data bases including; ERIC, EBSCO host, Pro Quest, Dissertation Abstracts,
PsycINFO, AERA online search services, Academic Search Premier, Data Universe,
State of New Jersey Department of Education School Report Card website, and Alta
Vista. Research was also conducted by looking at print editions of peer-reviewed
educational journals, and peer-reviewed educational books. In looking at the review
procedure that was utilized the researcher used both meta- analysis and descriptive non-
expe;imental, non-experimental, quasi-experimental studies. The researcher also
followed the Boote and Beile (2005) framework for scholarly literature reviews in an
effort to effectively and systematically present results of similar studies.
Inclusion and Exclusion Criteria for Literature Review
Studies that met the following criteria were included in this review: (a) peer-reviewed
journals, dissertations, or government reports were analyzed. Peer-reviewed adds a layer
of academic strength and integrity, (b) experimental, quasi-experimental, non-
experimental groups were analyzed, (c) studies that include the following: descriptive,
non-experimental, multiple regression, meta-analysis and quantitative research were
analyzed, (d) for seminal works and underlying theories, books will need to be consulted
and analyzed. Works published from 1950- present unless considered seminal work and

thus older were analyzed, and (e) works that report at least statistical significance were
analyzed.
The Evolution of the Superintendency
The history of the superintendency dates back to the 1600s, when the pilgrims
landed in America and established a formal educational system. The first public school
was started by the 1640s.
"The governance structure of federal involvement accompanied by states
relegating considerable power and authority to local communities is unique to the
United States. This configuration is rooted in the cherished principles of liberty
and equity. In colonial America, public education was governed through town
meetings and subsequently schools were placed under the control of town
selectmen ... Thus long before the creation of state departments of education,
communities had been self-determining both the type and scope of education
provided" (Kowalski, 2006, p. 10).
In the late 1700's and early 1800's educational institutions started to look like the
modern school house and school districts of today. Communities had devised systems
whereby a group or individual supervised the running of schools and the type and scope
of education provided, long before the creation of state departments of education
(Kowalski, 2006). While not yet an official office, the role of superintendent was
performed, on a part-time basis, by community volunteers given the authority to develop
and enforce policy and the responsibility for all aspects of school organization and
functioning (Campbell, 2001 ; Hodges, 200 1 ).

In the early days of the one room school house, the school was located within
walking distance of the students that it served. In rural communities, educational
institutions were placed in central locations where students could walk to and from
school. The lack of modem transportation and the remoteness of many areas posed
special challenges for the first school houses. As a result, there were over 100,000 small
school districts consisting of single schools. "This condition gradually changed because
of population growth, urbanization, and better transportation; local school districts
became larger in land mass, in the number of schools operated, and in student
enrollment" (Kowalski, 2006, p. 10).
Many of the first superintendents were scholars and educators who were
promoted to the position of superintendent and were unprepared for the position. In fact,
many had no training and learned on the job. The responsibilities of the first
superintendents were very simple and mundane: they consisted of tasks such as
supervising teachers, grounds upkeep, and student testing (Townley, 1992.)
The superintendency, as we have begun to know facets of it today, began in
public education during the early 1800's. The school district superintendency as a
permanent, full-time, administrative position began in 1837, as an element of
standardizing educational practices for all students in the United States (Sharp & Walters,
1997). American Association of School Administrator's executive director, Paul
Houston, (as cited in AASA, 2007) states:
The history of the school superintendent has been a difficult journey from
manager to leader. As conditions have changed over the last 200 years,
the role has evolved from an ad hoc response to local needs for school

management, to leading a complex community learning enterprise.
Superintendents typically lead one of the largest institutions in the
community and they have some of the greatest responsibilities in town, yet
little is known about them. It is around the country I am often asked about
the condition of the superintendency. Where it is going? What's
happening with superintendents and what's happening to them? (p. 37).
The job of the school superintendent has become increasingly complex. We no
longer have the one room school house in our most rural areas. This began changing,
particularly after the American Civil War, as America became more industrialized and
the role of the superintendent became increasingly important as schools divided students
into separate grades and educated them in multiple buildings (Kowalski, 1999). As our
country became modernized, the school system as we currently know it began to develop
and evolve. It was during the great industrial age of the 1800's that the need for an
educational leader to organize the school district was identified. Superintendents were
now referred to as district superintendents and were responsible for the day to day
operations of their districts. In the beginning of the superintendency, many
superintendents were charged with writing their districts' curriculums. This meant that
the role of the superintendent was to be a teacher to the teachers and it was the beginning
of the evolution of the superintendent as instructional leader (Sharp & Waters, 1997).
In 1812, New York became the first state to establish a public education system,
resulting in the establishment of the first superintendent position. However, many
changes for the superintendency were still to come. The state superintendent was given
the responsibility of developing a plan for common schools, reporting on the
management of public funds, and providing school related information to the state
legislature (Kowalski, 2006). Between the years of 1830 and the early 1850's the office
of state superintendent was established in every northern state and some southern states
as well.
Despite its infancy, the superintendency very quickly became more varied and
diversified (Kowalski, 2006). This meant that more was going to be expected of each
superintendent. The superintendent was seen as the primary leader of a school district.
As the district leader, the superintendent has been looked at as a symbol of respect and
authority in our nation's communities and social structure. As the nineteenth century was
came to an end, many new changes and advancement for the superintendency were taking
place (Kowalski, 2006).
"By the end of the nineteenth century, the superintendency had become
generally recognized as the only promising solution to the administrative
problems facing public education. In a few states, school boards were given
statutory authority to appoint superintendents; however, most cases, boards made
such appointments without specific legal authority. By 1880, 34 of the 38 states
had made provisions for the position of superintendent. As of 1890, all large
cities had superintendents; but it was not until well into the twentieth century that
superintendents were found in small cities and towns" (Hodges, 2005, p. 28).
The superintendent role became more focused in scope and sequence. "The
purpose of the superintendent at the state and local level was to have someone provide
standards of best practices for public school administration, communicate elements of the
common curriculum and provide supervision to ensure its implementation" (Kowalski,
2006, p. 12).
There were some problems with slales hiring superintendents. The superintendent
positions existed largely in name only; rather than hiring a separate individual to fill this
position, states often assigned the responsibilities for this office to a state official who
already held another position (Butts & Cremin, 1953). The superintendency needed to
become more specialized to achieve better core academic results and to establish a better
job description for which to hire.
Synthesis. The literature suggests that the position of superintendent has grown
from humble beginnings. From the days of the one room school house to present day, the
superintendency has evolved and changed, at times rapidly, with the growth of our
industrial nation. As the position of superintendent continues to evolve, we will be
reminded of the evolutionary process that has brought us to what we expect of a current
superintendent in modern day. Some superintendents are hired because they are viewed
as instructional leaders, but 60% in a study believe they are hired because they would be
change agents (Glass, 2001 b.)
The Evolutionary Stages in the Role of the Superintendent
Urbanization greatly influenced the role of the superintendent. As the nation
became more urban, school districts grew and with them the responsibilities of the
superintendent. Superintendents, however, were still few and far between in the early
years. The first full-time, local, district superintendent was hired as a school inspector in
Buffalo, New York, in 1837 (Brunner, 2002; Butts & Cremin, 1953). From 1837 to
1850, only 13 local superintendents of urban districts had been hired and by 1890 most of

the major cities followed this lead (Kowalski, 2006). It should be noted that it was not
until well into the twentieth century that small cities and towns hired local school district
superintendents (Hodges, 2005).
Many people have broken the superintendency into various evolutionary stages.
Callahan (1 966) identified four major stages in the evolution of the position of the
superintendent, with each stage bringing new roles and responsibility in its evolution.
In the first stage, beginning after the Civil War and continuing into the early
1900's, the superintendent was seen as a scholarly leader. The position was only held by
men and its role was as the teacher of teachers. The superintendents discussed their jobs
in educational journals and at professional meetings. The superintendent of the early
1900's focused on innovations of the day and on the educational needs of each school.
After the Civil War, urban school systems developed rapidly and the position of
district school superintendent was created, in part, as a means of dealing with the growth
and changes of local school districts and increased administrative duties and
responsibilities needed to oversea effectively the daily operations of those schools (Carter
& Cunningham, 1997).
In the 1920's, the second stage of evolution was the superintendent being seen as
the business manager (Callahan, 1966). He was in charge of all budgetary matters and
expected to be fiscally responsible with tax payer monies. The role of business
administrator evolved from the first superintendent's position.
The third stage (1 930-1 954), according to Callahan, (1 966), had the
superintendent as educational leader in democratic school systems. The leading

professors and practitioners advocated that instructional leadership in democratic
institutions was the most important responsibility of the superintendent.
The final stage in the evolution of the superintendency put the superintendent in
the role of social scientist. From the years of 1955 to 1966 many people believed that
economic and political realities required superintendents to understand and apply social
science principles to their work in school administration (Callahan, 1966).
As the superintendency evolved to a position of social scientist it resulted in a
demand for significantly greater sophistication in communication skills. Superintendents
were expected to be excellent public speakers, competent writers, and proficient in the
use of technology. Another communication skill that was -and still is- invaluable to the
superintendent is the ability to effectively listen to others. Through effective verbal and
written communication, as well as the listening skills, superintendents portrayed an image
of capability and concern. As these skills developed more stages in the evolution of the
superintendent occured (Callahan, 1966).
When looking at other historians of the superintendency, Griffiths (1966) also saw
stages in the historical development of the position. In the first stage (1837-1910), the
superintendent was primarily concerned with instruction. During this period much of the
time spent by the superintendents was devoted to visiting schools and observing the work
of teachers. They tended not to be burdened with many managerial responsibilities.
Often the superintendent wrote about education and their position. They wrote about
pedagogy, history, and the philosophy of education. Their boards of education were
primarily responsible for the management and business of the district (Griffith, 1966).

Griffiths's second stage occured from 19 10 to 1945. In that time the
superintendent became a business manager. During this stage, considerable effort on the
part of the superintendents going into the elements of efficiency, mainly influenced by
Frederick Taylor's Scientific Management Theory (191 1). The population of the nation
was continuing to move in greater numbers to urban areas and employment skills became
increasingly important. The move to urban centers was fueled by the desire to find work
in industry. The critics of the superintendent as business manager lamented over the
belief that schools were inefficient, and because increasing numbers of school board
members were drawn from the business community, there was a common perception that
the application of Taylor's theories would be beneficial to school districts (Griffiths,
1966).
The third stage(1945 to present), in the evolution of the superintendency was
shared leadership according to Griffiths, (1966). Charged with working with local school
boards, communities, and businesses, the role of the superintendent has transformed into
a more public position. The third stage of development fostered the dawn of the
professional school administrator. This era was dominated by administrative theory
(Griffiths, 1966).
In the second and third stages of the superintendency, a significant amount of
control began to get transferred to superintendents from boards of education. As this
occurred, it marked the beginning of the highly centralized structure of school districts
that is continued today (Glass, Bjork, & Brunner, 2000). A division of labor and
specialization became more prevalent because boards of education ran various
committees, such as, the budget committees, policy and planning committees, curriculum

committees, facilities committees and transportation committees. During this period in
education, specialists like the school nurse, social worker, psychologist and other
professionals, were introduced. Specialization was beginning for teachers as well.
Teachers now specialized in teaching in either grammar school or in the high school. In
today's educational institution, this basic structure prevails, even though educational
research has demonstrated that highly centralized and hierarchical structures are an
obstacle to school improvement (Glass, 2000).
The scope of the school superintendency is evolving into one that encompasses a
broad array of skills. In describing the modem superintendency, Dr. Ruben Oliverez
(2008) of the University of Texas Cooperative Superintendency Program identified 12
functions that a successful superintendent manages as he (she) leads a school district.
They are as follows: governance operations, curriculum and instructional services,
instructional support services, human resource services, financebudget operations,
administrativebusiness operations, facilities planning and plant services, accountability,
information management, technology services, external and internal communications,
and safety and security services (Olivarez, 2008).
Synthesis: The literature suggests that the superintendent has now been
empowered by local boards of education to improve overall student achievement. With
local school boards giving up power and control, superintendents became the dominant
force in creating, and making change in school districts. Callahan (1966) identified four
major stages: (a) Superintendent As Scholarly Leader, (b) Business Manager, (c)
Educational Leader, and (d) Social Scientist. Today's current literature supports the
research that Callahan had 45 years ago.
The Ever Changing Roles of the Superintendency in American Education
As a call for reform began in the 1960's, our nation entered into significant
changes and began to grow. Schools were being asked to meet the challenges of a
diverse population and extensive collaborations with the communities was expected
(Shook, 2000). The luxury of time seemed to have evaporated: schools were under
pressure on many fronts and the need for change echoed all around them.
Superintendents no longer had the time for a deliberative approach. The schools they led
were thrown into a constant state of rapid change (Shook, 2000).
As society was changing, so were schools in the area of public school district
governance. In looking at the federal level, the administration of public education has
been handled by four different agencies: (a) the Department of the Interior, (prior to
1939), (b) the Federal Security Agency (1 953-1 978), (c) the Department of Health,
Education, and Welfare, (1953-1 978), and (d) the United States Department of
Education (DOE) (1979 to present) (Kowalski, 2006). As the country has evolved over
the last century, these agencies have been responsible for the oversight of laws enacted
by Congress that have significantly changed the nature of public education. An example
of a federal legislative mandate includes "promoting vocation education (e.g. Smith-
Hughes Act in 191 7); promoting stronger curricula in mathematics, science and foreign
language (e.g. National Defense Education Act in 1958); providing supplemental services
for disadvantaged students (e.g. Elementary and Secondary Education Act in 1965);
mandating special education under civil rights provisions (e.g, Education for All
Handicapped Children Act in 1975); and promoting school productivity in relation to
enhancing the nation's economic welfare (e.g. No Child Left Behind Act in 2002)"

(Kowalski, 2006, p.4) All of these departments have greatly shaped and changed the role
of the superintendency by making it a position of accountability in an era of having No
Child Left Bchind.
There is little room for debate on the question of whether the superintendency in
America changed during the 1960's, if one consults those most able to examine the
question, the superintendents themselves (Marland, 1970). Marland (1 920) noted that at
the time of his writing the causes and effects of the change were multiple and varied.
"The new expectations demand a larger order of leadership, not the
dismissal of the dead and dying order. Broadly, the superintendent's role is one
reaching out, now, to those he serves; students, teachers, and citizens- to find new
accommodations for rational and creative discourse. The superintendent must
learn to be adaptable during times of stress, and rise above the negative personal
connotations. He must, with greater compassion than ever, struggle for the
minority child and the poor. The superintendent must answer directly the
demands for information, for accountability; he must learn the acts of political
effectiveness. Furthermore, the superintendent must remain the humane teacher.
With all this he must find rest and respite. For this too must be a part of the
changing role" (Marland, p. 371, 1970).
The superintendency's organizational structure and the operations of public
education have changed greatly in response to legal decisions, changing societal and
political conditions, and external sources, including federal and state legislation
(Kowalski, 2006). The changing structure of the governance of public education involves
federal, state, intermediate, and local levels of government with a superintendent serving

as the chief executive officer at each of these levels, giving the state considerable
regulatory power and authority. In looking at our states, the first educational boards were
established to oversee the delivery of education in Virgina, South Carolina, Vermont, and
Missouri in the late 1700's. Between 1837 and 1880,24 states had enacted legislation
establishing state boards of education (Butts, & Cremin, 1953; Kowalski, 2006). Today,
state level superintendents are elected in 15 states and appointed in 35 (Kowalski, 2006).
Eventually, all public elementaiy and secondary school districts were linked under the
auspices of state agencies that controlled local schools and formalized government policy
implementation within each state's education system (Spring, 1994).
As American public schools began to experience changes in the 1960's, so did the
superintendency. This era is most known for accountability. By the end of the 196OYs, a
new U.S. cabinet level position, secretary of education, had been created to ensure that all
students received appropriate instructional programs and met minimum standards, thus
affecting the ways superintendents govern. Research studies by the hundreds undertook
the difficult task of identifying teaching strategies and of considering factors such as class
size and the economic makeup of classes that impacted learning. The most well
publicized report of this era came in 1983 with the highly controversial A Nation at Risk
(Goodlad, 1997).
The role of the superintendency since the Nation at Risk report has changed
greatly in our society. Because the A Nation at Risk Report (Education, 1983) generated
considerable controversy, many researchers chose to examine the school and the
principal. A surprising development was the lack of research done on the role of the
superintendent of schools. The role of principal is central to school reform and to

meeting the demands of standards, standardized testing, and curriculum development.
However, this does not explain the relative absence of research on the role of
superintendent (Berg & Barnett, 1998.)
Synthesis. The literature suggests that the role of the current superintendency, as
we know it, has faced rapid change and growth. Schools were being asked to meet the
challenges of diverse populations and extensive collaborations with communities were
expected (Shook, 2000). Governance of school districts became the primary role of
superintendents. The oversight of public school districts was passed on from one
organization to another. In looking at the federal level, the administration of public
education has been handled by four different agencies: (a) the Department of the Interior
(Print, 1939), (b) the Federal Security Agency (1 939- 1952), (c) the Department of Health,
Education, and Welfare (1 953- 1970) and (d) the United States Department of Education
(DOE) (1 979 - present) (Kowalski, 2006). All of the changes in the organizational
structure of school districts led to the superintendent's role in today's current educational
system.
The Superintendent in Contemporary Times of Change
The superintendency in the 21St century is more challenging since the attacks of
September 1 1,2001. The American educational system has become more complex and
diverse than ever before. Superintendents in the 21St century assume far more roles than
their predecessors ever had. The 21'' century superintendent has a high degree of
responsibility in the overall function of the school district. These increased
responsibilities require a significant investment of time. The average week of work for
school superintendents is about 60-75 hours and attending two or three work related

evening meetings. In addition to the time devoted to school district hnctions, the
superintendent is expected to be an active participant on the school board, in the
community, and at civic functions (Kowalski, 1995; 2006; Lober, 1993).
In contemporary times, superintendents have to conquer challenging forces that
look to disrupt the flow of a school district. Houston (2007) proclaims: "Superintendents
at the start of the 2 1 Century work under intense scrutiny &om parents, teachers, board
members and elected officials. They are held responsible for the progress and
achievements of the students in their districts" (Houston, 2007, p. 7).
Brown, Swenson, and Hertz (20 10) provide the following portrait of today's
school superintendent:
The role of the superintendent of schools has become a hotbed of political
focus in recent years. In New Jersey for example, Superintendent contracts are
being capped since Governor Christie took office. No longer is it sufficient for
the designated leader of a school district to be an accomplished educator and
respected person. In a climate of high expectations, and blame placing,
superintendents are expected to be all things to all populations. From adept
politicians to visionaries, superintendents are asked to meld the confusion of here
and now, while focusing on a future vision of sweeping success for all. Further,
school leaders are expected to perform these functions in the context of
institutional hierarchies that allow blame for failure to be placed squarely on the
doorstep of the superintendent's ofice. In short, the role of the superintendent is
at once complex, difficult and fraught with potential failure.

The responsibilities of our educational leaders have dramatically changed in the
last two decades, and will continue to dramatically change in the upcoming decade.
Superintendents in the past were expcctcd to possess an in-depth understanding of
teaching pedagogy and instructional resources and serve as instructional leaders
monitoring instruction and supporting teacher development (Spillane & Louis, 2002).
When looking at how the superintendency has changed and evolved it is easy to
see that beginning in the early 1990's pressures began to mount on superintendents to
improve student achievement. The role of urban superintendents in school reform and
raising student achievement (as cited in Lunenberg, 1992) was seen as crucial by 1992,
just one year after Crowson and Glass reported that only one half of the nations
superintendents saw instructional leadership as their most important role. As
expectations rise in one area they become higher in many other areas. Political pressures,
an expectation of high public visibility, greater instability in school finances, and far
greater external demands from state and national departments of education all mean that
in a time when expectations were rising for raising student achievement and closing
achievement gaps, there was an upshot increase in the time superintendents must spend
with other vital duties and responsibilities (Bredeson, 1995).
The ever changing roles of 2 1 century superintendents have now shifted such
that he or she is devoting the majority of his or her time to management and politics
thinking about and dealing with issues inside and outside the school districts, rather than
as serving as an instructional leader (Cuban, 1998; Hodges, 2005; Howley & Pendarvis,
2002) . Glass, Bjork and Brunner (2000) conducted a national study that found that only
one fourth of superintendents felt they were hired for their skills and abilities in

instructional leadership. A report by the American Association of School Administrators
(ASSA) and the National School Boards Association (NSBA) identified specific
responsibilities for superintendents. The following three responsibilities were seen as the
most significant changes to the superintendency.
#1 To serve as the school board's chief executive officer and preeminent educational
advisor who keeps board members informed about school operations, programs, and
district needs. The superintendent also provides complete background information on
policy and procedure recommendations that ultimately assist the school board in assisting
the board with the governance role it has.
#2 The oversight and management of district operations and to serve as the primary
educational leader for the school system and chief administrative officer of the entire
school district and support staff.
#3 Responsible for instituting a process for long-range and strategic planning as well
as to inform the board of administrative procedures needed to implement board policy at
the public school level. (ASSA, 1994, pp. 1 1-12.)
Synthesis. The literature suggests that in the past several decades there has been
increased pressure for education reform from superintendents to improve student
achievement. This is a reaction to the perceived threat that America's youth would not be
able to compete in a global economy (West & Peterson, 2003.) One of the most notable
education reform efforts is the Goals 2000: Educate America Act. In the Goals 2000 Act
legislation sought to correct the failures by setting national standards and uniform
standards, as well as a means of assessment (United States Department of Education,
2000.)

Era of Accountability under Adequate Yearly Progress
One of the most incredible pieces of legislation enacted to affect education in
America was the No Child Left Behind (NCLB) Act of 2002. The goal of the NCLB was
aimed to improve student and staff performance in primary and secondary schools in the
United States, and was eventually re-classified as a federal program. It built on the
foundation of increasing the standards of accountability for states, school districts, and
local schools. It also provided the parents with more flexibility in being able to choose
which schools their children would attend (U.S. Department of Education, 2006). The
No Child Left Behind Act focused on setting high standards and establishing measurable
goals to improve student achievement.
Federal Requirements of NCLB
The New Jersey Department of Education (NJDOE) (201 0) stated: The federal No
Child Lqfl Behind Act (NCLB) requires all states to establish standards for accountability
for all schools and districts in their states. Furthermore it calls for the inclusion of all
students, even students who may have been excluded or exempted from participating in
state assessment programs in the past. The foundation for the accountability system is
based on a states academic content standards - which define what students should know
and be able to do - and assessments to measure whether students have mastered these
standards. The accountability system looks at the degree to which students across
schools and districts are mastering the state standards. NCLB has set the goal of 100%
proficiency by the year 2014 with states setting incremental benchmarks (New Jersey
Department of Education Office of Student Achievement and Accountability, 2010).

The NJDOE (201 0) stated: In order to meet the federal requirements, New Jersey
has adopted the New Jersey Single Accountability System. In the New Jersey Single
Accountability System state assessments in language arts literacy and mathematics are
based on the New Jersey Core Curriculum Content Standards. All students enrolled in
New Jersey Public Schools, plus all student subgroups, must meet the proficiency
benchmarks to ensure the goal of 100% proficiency. Students must score either
"proficient" or "advanced proficient" on the assessment to be counted toward meeting the
benchmarks. The schools are then evaluated using the Adequate Yearly Progress (AYP)
indicators. In the state of New Jersey, student achievement is determined by grade span
(elementary school - grades 3-5, middle school - grades 6-8, and high school) in each
content area. There are 40 indicators that must be met (including participation and
proficiency rates) plus a secondary indicator. A safe harbor calculation is applied to
measure significant progress if the bench mark is missed. When a school does not meet
AYP for 2 consecutive years in the same content area, it is designated as a "school in
need of improvement" (United States Department of Education Office of Student
Achievement and Accountability, 201 0 p.1).
Calculating Safe Harbor
The NJDOE (2010) stated: The calculation of safe harbor is essentially a measure
of improvement applied to the total population and each subgroup that has not made AYP
benchmark(s). If the percent partially proficient achieved in the previous year is
decreased by 10% in the current year, safe harbor is achieved and the total and/or
subgroups are deemed to have made AYP. The making of safe harbor is a critical
component to the success of superintendent in terms of student achievement.
Instructional Leadership and Student Achievement
The present research on the superintendent's impact on student achievement is
limited. There are few studies that have taken place since the inception of No Child Left
Behind that can support or deny the superintendent's impact on student achievement.
The Mid Continent ~esea rch for Education and Learning Center released a working
paper on the topic in 2006: "School District Leadership that Works: The Effect of
Superintendent Leadership on Student Achievement" (Marzano & Waters, 2006). This
working paper was developed into a book called District Leadership that Works, or
Leadership at the Top. In this meta-analysis study, (Marzano & Waters, 2006) had four
major findings that emerged from their study.
In finding 1, Marzano & Waters stated that district level leadership matters. This
study found a statistically significant relationship (with a positive correlation of .24)
between district leadership and student achievement. In this study Marzano & Waters,
2006 looked at 27 studies from 1970 to today. All together, these studies involved 2,817
districts, and 3.4 million students (Marzano & Waters, 2006). Marzano and Waters were
looking at the influence of the superintendent and other district level leadership on school
and student achievement.
In finding 2, Marzano & Waters stated that effective superintendents focus their
efforts on creating goal oriented districts. They noted five district level leadership
responsibilities that have a statistically significant correlation with average student
academic achievement (Marzano & Waters, 2006). The five district level responsibilities
most used in creating a goal oriented district are:
collaborative goal setting,

non-negotiable goals for achievement and instruction,
board alignment and support of district goals,
monitoring goals for achievement and instruction,
use of resources to support achievement and instruction goals.
In finding 3, Marzano & Waters (2006) found that superintendent tenure is
positively correlated with student achievement. They identified two studies that focused
on superintendent tenure and student achievement. The weighted correlation average of
these two studies was statistically significant at a .19 level. A .19 suggests that the length
of a superintendent's tenure in a position and experience positively correlates with
student achievement (Marzano & Waters, 2006).
In finding 4, Marzano & Waters (2006) identified "defined autonomy" as
positively impacting student achievement. This study found a positive correlation of -28
between building autonomy and student achievement. This indicates that student
achievement in a district increases when a superintendent has more building level
autonomy. As the superintendent's autonomy increased, there was an increase in student
achievement (Marzano & Waters, 2006). This finding appears to be contradicted by the
finding in that "site-based" management had a negative correlation of (- .16), indicating
that an increase in site-based management is associated with a decrease in student
achievement (Marzano & Waters, 2006).
In the "School District Leadership that Works, A Working Paper", the following
research questions were used to guide the study:
What is the strength of relationship between leadership at the district level and
average student academic achievement in the district?

What specific district-level leadership responsibilities are related to student
academic achievement?
What specific leadership practices are used to fulfill these responsibilities?
What is the variation in the relationship between district leadership and student
achievement? Stated differently, do behaviors associated with strong leadership
always have a positive effect on student achievement?
Is there a relationship between length of superintendent service and student
achievement? (Marzano & Waters, 2006).
In examining each question, Marzano & Waters (2006) found that district
leadership does make a difference. Sound leadership at the district level adds value to an
educational system. This belief stands to contrast with the images of superintendents and
their impact on student achievement. There are some studies that support the findings of
Marzano and Waters (2000), especially those studies that have been done since the
inception of NCLB that establish the overall importance of the superintendents
instructional leadership on building a strong district culture that focuses on learning and
student achievement.
In 2009, Marzano & Waters released their latest book called [District Leadership
That Works, Striking the Right Balance.] This book was guided by the focus question:
Does district leadership matter? Based on my findings, it does. In 1987 Secretary of
Education William Bennet attached the nickname "the blob?' to administrators and
administrative systems in public schools (Marzano & Waters, 2009, p. 1). The blob is
made up of people in the education system who work outside of classrooms, soaking up
resources and resisting reform without contributing to student achievement (Walker,

1987). According to Bennett the term blob is an acronym for "bloated educational
bureaucracy." To Bennett the blob includes superintendents, district office staff, and
local board members as an amorphous mass. The extant literature on the relationship
between district administrative leadership and student achievement will continue to be
researched going forward.
Synthesis. The extant literature suggests that there five primary goals that
superintendents can engage in to ensure a high level of student achievement. According
to Marzano and Waters (2009) The five responsibilities and initiatives that district level
leadership should engage in are: (a) ensuring collaborative goal setting, (b) establishing
non-negotiable goals for achievement and instruction, (c) creating board alignment with
and supporting district goals, (d) monitoring achievement and instruction goals, (e)
allocating resources to support the goals for achievement and instruction (Marzano &
Waters, 2009, p.6).
Board-Superintendent Relationships
In education, one of the most important relationships is between the board of
education and the superintendent. The board of education is a policy making body.
Marzano & Waters (2009, p. 75) state that once goals for achievement and instruction
have been established through a collaborative goal-setting process, board alignment and
support for the goals must be firmly established. Many superintendents do not feel that
they are supported by their boards, but they feel that they are accountable.
The accountability movement for superintendents has put school districts and the
board in a new, unfamiliar environment. Plecki et al(2006) and others (Conley, 2003;
Howell, 2005; & Land, 2002) note that historically, schools boards have not focused on

student achievement. Sell (2006) explains that the accountability movement has
decreased the traditional power of school boards. The new accountability has led to a
decrease in superintendent longevity. Marzano and Waters (2009) state that the longevity
of the superintendent's leadership in a district has a statistically significant relationship
with student achievement. The issues of accountability, student achievement, and
longevity sometimes lead to in-district conflict.
Brower and Balch (2006) state that school board conflicts, board politics, and
community support were determined to be highly significant contributors to stress and
success in a district. According to Brower and Balch (2006), lower salaries, more school
board conflicts, greater board politics, less community support, and inexperience created
stress for a superintendent which may contribute to their remaining in a district.
Networking plays a critical role in school board conflicts. Those who network more,
usually have fewer conflicts. "School boards feel intense pressure to recruit superheroes
that will improve student achievement, reduce the employee count, implement
accountability measures, and guarantee safe haven schools in dangerous neighborhoods"
(Jernigan, 1997, p. 4). If we look at.society, the lack of longevity in the superintendency
mirrors that of society. People are changing careers more often than ever. School board
members adopt a "quick-fix, results tomorrow" mentality (Jernigan, 1997, p. 4). School
boards think that "we need things to happen now and we believe we need a new person in
charge" (Jernigan, 1997, p. 4). In fact, some school superintendents who face a brand
new school board composition after an election determine it is easier to obtain another
job than it would be to work together with the newcomers. The superintendency may be
evolving into a temporary position with lots of board related conflicts (Clark, 2001).

Synthesis. The literature suggests that, since the No Child Left Behind Act of
2001, superintendent accountability has increased ten fold. The goal of leaving no child
left behind was to raise the level of student achievement for all students and to reduce the
gap in performance of students from different backgrounds (Abrams, 2004). The
legislation change of NCLB and its new accountability regulations and measurement
requirements were the impetus for driving school improvement and ultimately having all
students proficient by 2014. The higher standards placed on all school districts place
higher accountability standards on superintendents,
Board Hidden Agendas and Superintendent Relationships
In education both board members and superintendents sometimes have hidden
agendas. These agendas can affect the day to day operations of a district and ultimately
can impact student achievement. Board members sometimes have hidden agendas, focus
on single items, mismanage, or could be corruptly influenced. Board members
sometimes look at the issues of the day and get away from their jobs as policy makers.
This has resulted in criticism of school board members (Slaten, 1994).
Trust and honesty are needed in a school board and superintendent relationships:
Hidden agendas need to be left at the door. Honesty and integrity are among the most
identified causes of conflict (Chance, 1992; Capps, 1992; & Malone, 1999). As the CEO
of the district the superintendent is expected to be held and live up to the highest possible
standards by their boards, staffs, students, and community. Sharp and Walters ( I 995)
stated that 93% of superintendents said they are satisfied with their relationships with
their school boards (Sharp and Walter, 1995). Castallo and Natalle (2005) wrote that
successfil administrators must be perceived to be trustworthy, credible, honest, and open.

The district that gets a superintendent with high integrity and a board of education
without hidden agendas will have the greatest chance to positively impact student
achievement.
Synthesis. The literature suggests that for a school district to be successful trust
and honesty must exist between a superintendent and hislher board of education.
Superintendents spend and average of 4 or more hours per week in direct communication
with school board members (Glass, 2001 b). "Astute school boards and superintendents
realize that maintaining sound public relations could mean the difference between
success and failure" (AASA, 1994 p. 19).
Board-Superintendent Expectations in Longevity and Continuity
High expectations by board members, community members, teachers, and school
staff for superintendents, combined with time and financial constraints add to the stress of
the job. High rates of stress related illness lead to individuals vacating the position
(Brower & Balch, 2006). Schools are deemed to have high rates of turnover if they have
had three or more superintendents in a 5 year period (Chance & Capps, 1992).
There are many reasons that a superintendent would want to stay in one district
and have continuity. In most districts there are benefits that school board members could
consider that would result in an increase in superintendent longevity. To make a district
more attractive, so that the services of a great superintendent could be retained school
board members should consider portable retirement plans, 6 year contracts to experienced
superintendents, guaranteed buy out or termination clauses, and paid internships for
aspiring superintendents (Glass, 2001). Brower and Balch (2006) state that, according to
one study, years of experience in the district-level administration showed significant

relationships to maintaining a successful tenure. Continuity can be lost in programming,
which results in an unclear mission and direction for the district. "The superintendency is
the least stable and secure position in education" (Metzger, 1997, p. 4).
The relationship between the superintendent and the board of education could be a
major obstruction in the longevity of a superintendency. Deliberation and decision
making are often the major focus of the relationship between the superintendent and
school board relationship (Slaten, 1994). Micromanaging or board members attempting
to run a district leads to superintendent stress and turnover (American Association of
School Administrators, ASSA). The superintendent should be shaping the climate and
culture of the school district. It is imperative that school board conflicts not get in the
way of moving a district toward its vision and mission. In a recent study, school board
conflicts and board politics were noted as highly statistically significant variables that
added stress for a superintendent (Brower & Balch, 2006).
Synthesis. The literature suggests that individual board members are not
contributing to district success, but in fact may be working in opposition to that end when
their interests and expectations distract attention from board adopted achievement and
instructional goals (Mazano & Waters, 2009 p. 7). Having a good relationship with the
board of education should help with a superintendent's longevity and continuity in a
district. The board and superintendent's most important goal in maintaining a sound
working relationship is to establish a sound guaranteed and viable curriculum (Marzano
& Waters, 2006, p. 14). Having a guaranteed viable curriculum will contribute to better
student achievement and ultimately longer superintendent longevity and continuity in a
district.

Summary
The role of the superintendent has evolved and changed greatly during the history
of the United States. In Chapter I have reviewed the evolution, the era of accountability
(AYP), the impact of the superintendents' leadership on student achievement, along with
the historical perspective of the superintendency. The chapter started by looking at the
inception of the position of the superintendent starting in the 1600's and how it has
evolved into the present day position. Chapter 11, began with a description of the
superintendent filling the role of instructional leader, evolving into a manager, then
falling back into the role of instructional leader of a school district. The second coming
of the superintendent as instructional leader has changed greatly due to the new
accountability regulations and the passing of the No Child Left Behind Act.
The responsibilities of the superintendent continue to change from the original
duties. The first superintendents were originally clerks for the board of education.
Today's superintendents have responsibilities that have shifted from typical management
duties, to that of an instructional leader who is expected to "guide, facilitate, and
coordinate" (Carter & Cunningham, 1997, p. 238) activities within the educational
community that focused on student academic achievement.
The superintendency has been facing difficult times recently that can be traced
back to the publication of A Nation at Risk in 1983. When A Nation at Risk was
published during President Ronald Reagan's term, the position of superintendent went
from that of a manager to that of an educational leader, who still completed all of the
managerial aspects of the job. The new age superintendent had to have political savvy
that could engage people at the local, state, and federal levels. This put a stronger burden

on superintendents to be instructional leaders who also fulfilled these other roles, all the
while seeking success in the area of student academic achievement.
Since the passage of the No Child Left Behind Act (2002), increased pressure has
been placed on the superintendent to raise achievement for all students. Under this
federal legislation, the goal is to have every student with a 100% proficiency on the state
assessments by the year 20 14. These lofty goals seemed to be originally welcomed by
superintendents, but as we continue in 201 1, it is becoming more evident that we will fall
short of 100% proficiency by 2014. The fact that each school district is required by
federal and state law to make Adequate Yearly Progress is a great thing for
superintendents because it has the potential to increase merit based pay incentives for
them.
As we look at the position of superintendent from the evolutionary period to the
era of accountability and adequate yearly progress, and at the impact of superintendent
leadership on student achievement, it has become evident that superintendents have jobs
with huge stress loads and pressures for student academic achievement. There has been
little research in the area of superintendent leadership and its impact on student
achievement. This is interesting because there are several studies on principal leadership
and how it impacts student achievement as well as teacher leadership and how they
impact student achievement. The superintendency is changing and it will require more
emphasis placed on student academic achievement in an era of accountability. It is my
hope that future studies on the superintendents' tenure, continuity, and longevity will
enable those aspiring to the position a road map to career success. Chapter I11 will shed

more light on the role superintendents' play in how their tenure, continuity, and longevity
will be able to successfully impact student academic achievement.
Chapter 111
METHODOLOGY
As the position of superintendent has grown in scope a number of new
responsibilities and duties have emerged. Now, more than any other time in history, as
public schools in the United States progress into the 21'' century, an extreme amount of
emphasis is being placed on student academic achievement. The superintendents of
today are being held accountable for their districts results as evidenced by student
achievement. With such an emphasis being placed on student achievement, we need to
examine the many complexities of the superintendency. The purpose of this descriptive,
quantitative, non-experimental study was to examine the impact a superintendent's length
of tenure, longevity, and continuity relative to student academic achievement as
measured by the 2008-2009 New Jersey Assessment of Skills and Knowledge (NJASK)
for grade 3 in language arts.
The researcher used a multiple regression process for exploring the relationship of
three predictive variables as they relate to the dependent variable of this quantitative
study, the academic achievement of students. The researcher focused on the
superintendents time spent in education, regardless of the position they held.
The predictive variables, including the primary focus of the study, were used to describe
data from the 2008-2009 school year regarding the following: (a) each superintendent's
length of tenure in district (experience in district) in New Jersey; (b) each
superintendents' experience in New Jersey (total years), (c) each superintendent's total
experience in education (total years), (d) each districts student attendance rates, (e)
percent of each districts students who were eligible for free lunch, ( f ) percent of each

districts students who were eligible for reduced lunch, (g) percent of each districts
students who were Limited English Proficient (LEP), and (h) each districts total students.
The researcher chose to focus on New Jersey school districts in the lower socio-
economic groupings of A, B, and CD in the New Jersey State Department of Education
District Factor Grouping Rating Scale (DFG). The researcher chose this population to
study because he wanted to examine if there was a relationship between superintendent
tenure and student achievement as measured by the New Jersey Assessment of Skills and
Knowledge in grade 3 for language arts in lower socio-economic school districts .
The DFG's for New Jersey are broken down into eight different categories by socio-
economics. They are rated: by A (39 Districts in New Jersey), B (61 Districts in New
Jersey), CD (61 Districts in New Jersey), DE (83 Districts in New Jersey), FG (89
Districts in New Jersey), GH (76 Districts in New Jersey), I (103 Districts in New Jersey)
and J (25 Districts in New Jersey). A is the lowest socio-economic class with J being the
most affluent. "The District Factor Groups (DFG'S) were first developed in 1975 for the
purpose of comparing students' performance on statewide assessments across
demographically similar school districts. The categories are updated every ten years
when the Census Bureau releases the latest Decennial Census data" (New Jersey State
Department of Education District Factor Groups, 2004, p. 1).
The purpose of this study was to also use the theoretical constructs identified in
the reviewed literature, as well as the practices outlined by the New Jersey State
Department of Education, the NSDC, PROQUEST, Data Universe, The New Jersey
School Report Card, and ERIC to guide implementation, to examine whether or not
superintendent tenure, longevity, and continuity have a relationship with student

achievement as evidenced by the New Jersey Assessment of Skills and Knowledge
(NJASK) in language arts for grade 3. This chapter will describe the methods used,
including the research design, research questions, and sample population. Chapter I11
will also present the conceptual framework, instrumentation used, and the data collection
methods. Chapter I11 concludes with a discussion of the data analysis that will determine
if there is a relationship between superintendent tenure and student achievement.
Research Questions
This research study addressed the following two research questions:
1. What is the relationship between New Jersey Superintendent's continuity:
such as length of tenure as a superintendent, and their longevity; such as, years of
experience as a superintendent and the total number of years in education as they relate to
student academic achievement as evidenced on the 2008-2009 third grade New Jersey
Assessment of Skills and Knowledge (NJASK) in language arts?
2. What is the relationship between New Jersey Superintendent's district
demographics relative to student academic achievement as evidenced by the 2008-2009
third grade New Jersey Assessment of Skills and Knowledge (NJASK) in language arts?
Statement of the Problem
In the state of New Jersey, elementary school level success is defined by student
achievement on the New Jersey Assessment of Skills and Knowledge (NJ ASK) in
language arts for grade 3. As a researcher, the problem I chose to focus on is the
relationship between superintendent tenure, longevity, and continuity relative to the New
Jersey Assessment of Skills and Knowledge in 2009 for language arts in grade 3. I
examined this area because one of the foundations of the No Child Left Behind Act of

2001 is "to support states in making every child a proficient reader by the end of third
grade" (Helf, Cooke, & Flowers, 2008, p. 13). President George W. Bush proclaimed
that by the year 20 14 100% of all third graders should be literate in language arts as
evidenced by scoring proficient or advanced proficient on the high stakes assessments
each state administers, such as the New Jersey Assessment of Skills and Knowledge
(New Jersey State Department of Education, 2008). There is evidence that exists that
superintendents impact student achievement through the "promotion, support and
development of principals as instructional leaders" (Cudiero, 2005, p. 16). In examining
the most current research, little is known about how superintendents can impact student
achievement other than in their developing strategic plans and their establishing of
district goals. The accountability requirements of the No Child Left Behind Act (NCLB,
2001) will be in full effect through 2014, so educators must take the necessary actions to
ensure that the challenges in district level leadership and student achievement that come
with the No Child Left Behind Act accountability regulations are addressed. In this study
the findings should provide a link to improve student achievement in any DFG school
district A-DE in New Jersey.
"Research increasingly points to the relationship between effective leadership and
increased student achievement" (Marzano & Waters, 2001, p. 12). The role of
superintendent has been changing greatly since the history of public education began. In
the early days of public education, the superintendent had the responsibility of being the
over sight for a district. This has changed greatly in that the superintendent is now a
professional who has the responsibility of making sure every student in his or her care
makes and meets the requirements of the No Child Left Behind (200 1) in terms of student

academic achievement. By meeting the federal mandates of the No Child Left Behind
Act public school superintendents will ultimately take on more significant responsibilities
and duties. By fulfilling their duties in a responsive manner research shows that the
superintendent positively impacts student achievement (Marzano & Waters, 2007, p. 14).
The students of any school district in the state of New Jersey regardless of District Factor
Grouping and socio-economic status will benefit greatly from the educational
achievement opportunities that a superintendent with tenure, longevity, and continuity
can bring to a district.
Research Design
The research design of this study was a non-experimental, explanatory, cross-
sectional design (Johnson, 200 1) that used a backward multiple regression analysis to
measure the relationships of the predictive variables (superintendent experience in
district, tenure; superintendent experience in New Jersey; superintendent total
experience), and the dependent variable of student achievement on the New Jersey
Assessment of Skill and Knowledge in grade 3 language arts for the 2008-2009 school
year. "Non-experimental research is frequently an important and appropriate mode of
research in education" (Johnson, 2001, p.3) due largely in part to the inability to perform
randomized experiments and quasi-experiments. The researcher conducted a non-
experimental, cross sectional, explanatory study. Johnson (2001) advises that an
explanatory study must answer the following questions: (a) Were the researchers trying to
develop or test a theory about a phenomenon to explain "how" and "why" it operates?
(b) Were the researchers trying to explain how the phenomenon operates by identifiing
the causal factors that produce change in it (p. 9)?

In order to determine which district and school variables had a statistically
significant relationship to student achievement, I used simultaneous multiple regression
models for my study. This strategy is used when the researcher has no logical or
theoretical structure for the data. This method is typically used to explore and maximize
prediction (Pedhazur, 1997). Scatter diagrams of residuals and normal probability plots
of residuals were constructed to test assumptions.
Given the sample size of the population, 161 school districts within the New
Jersey demographics of an A, B, or CD district were examined. The number of schools
within each district factor grouping and the number of schools meeting AYP are
displayed in Table Ia.
Table Ia Number of School Districts Used in Study (DFG A-CD).
Number of Schools meeting AYP District Number of Schools
A
B
CD
TOTAL
TOTAL- % Proficient or better on the NJASK in Grade 3 for Language Arts: 5.1%.
This data was acquired, compiled, and analyzed using Data Universe and the New
Jersey School Report Card for the 2008-2009 school year. The 2008-2009 New Jersey
Assessment of Skills and Knowledge (NJASK) for grade 3 in language arts had a raised
linked cut score of 182 for proficiency. The percentage for proficiency under the "New
Target" for the 2008-2009 New Jersey Assessment of Skills and Knowledge was 59%.
In the data analysis of the New Jersey School Report Card, I looked at all districts that

had less than 41% of its students in the partially proficient category on the 2008-2009 NJ
ASK. If a district fell below 41% in the partially proficient category of the 2008-2009 NJ
ASK for grade 3 language arts, then this meant that 59% of the students in that district
scored a "proficient" or better for "literacy" (New Jersey State Department of Education
Adequate Yearly Progress, 2000, p. 2).
I chose to use a multiple regression analysis because, according to Field (2009),
"Regression analysis.. . enables us to predict hture [outcomes] based on values of
predictive variables" (p. 198). This methodology allowed for a statistical analysis of the
data. It was also an efficient means of gathering data without introducing threats to
reliability that can occur with other data collection means (Suskie, 1996). Given the size
of the population, 161 districts, observations and personal interviews were impractical to
use for this study. Observations and personal interviews would have introduced the
potential for bias and inconsistency and the data collected would not have been
appropriate for statistical analysis. Specifically, the backward method of multiple
regression "calculates the contribution of each predictive variable by looking at the
significance value of the t-test for each predictor.. . . If a predictor meets the removal
criterion (i.e. if it is not making a statistically significant contribution to how well the
model predicts the outcome variable) it is removed from the model" (Field, 2009, p. 2 13).
After this is completed, any remaining variable would then be assessed to determine their
contribution to the outcome of the dependent variable.
The two research questions were examined by conducting a descriptive
correlational analysis to discover if the predictor variables contribute to the independent
variable. According to Field (2009): In a multiple regression analysis it is important for

the researcher to check and ensure that the assumption of no multi-collinearity (heavily
related variable) had not been violated by having any variables that were too closely
related to one another by checking thc Pcarson Correlation Coefficient, the tolerance
level and the variance inflation factor (VIF) values between the three predictive variables
(Field, 2009).
The level of significance was set at p< .05, as that is the customary level used
when working on significance (Krawthol and Anderson, 200 1). To check the statistical
significance and relative importance of each predictive variable, I examined the
unstandardized coefficient beta weights and the standardized beta weights of each
predictive variable. In addition, an R squared was used to examine the relationships
between the various predictive variables and the dependent variable.
Sample
The sample for this study was comprised of third grade students, and their
achievement scores on the 2008-2009 New Jersey Assessment of Skills and Knowledge
from the New Jersey School Report Card and Data Universe in 161 A-CD districts was
the data for the study. Of the 549 total districts in the state of New Jersey, I chose to look
at those districts that were in the District Factor Grouping ranges of A, B, and CD.
Again, this comprised 161 districts in the DFG of A, B, and CD. The criteria for
selection was for each district to have a 59% or better proficiency on the 2008-2009 New
Jersey Assessment of Skills and Knowledge. In looking at the data on the New Jersey
School Report Card for the 3rd grade 2008-2009 NJASK, I was able to find 34 districts
out of the 161 total districts for the DFG A, B, CD that met this criteria. The 34 districts
whose students achieved "proficient" or better on the third grade language arts NJASK

were examined in the study. The 34 districts equates to 5.1% of the districts making
AYP for the 2008-2009 third grade NJASK in language arts.
Conceptual Framework
The Mid-Continent Research for Education and Learning (2009) analyzed and
conducted a meta-analysis (combining data from separate studies into a single sample of
research) on the influence of district leaders and student performance. The goal of the
study was to determine the characteristics of effective schools, leaders, and teachers.
McREL took the findings from 27 studies that were conducted since the 1970's and
analyzed the data. Each study that was examined used rigorous quantitative methods to
influence school district leadership on student academic achievement (Marzano &
Waters, 2006). From the study conducted by Marzano & Waters from "School District
Leadership that Works; The Effect of Superintendent Leadership on Student
Achievement; A Working Paper" (2006), the following four major findings emerged
from this study: (a) finding 1 : district-level leadership matters, (b) finding 2: effective
superintendents focus their efforts on creating goal oriented districts which include the
following, (1) collaborative goal-setting: "Researchers found that effective
superintendents include all relevant stakeholders, including central office staff, building-
level administrators, and board members in establishing goals for their districts" (p. 4).
(2) Non-negotiable goals for achievement and instruction: "Effective superintendents
ensure that the collaborative goal-setting process results in non-negotiable goals (i.e.
goals that all staff members must act upon) in at least two areas: student achievement and
classroom instruction. Effective superintendents set specific achievement targets for
schools and students and then ensure the consistent use of research --based instructional

strategies in all classrooms to reach those targets" (p.4). (3) Board alignment and support
of district goals "In all districts with higher levels of student achievement, the local board
of education is aligned with and supportive of the non-negotiable goals for achievement
and instruction. They ensure these goals remain the primary focus of the district's efforts
and that no other initiatives detract attention or resources from accomplishing these
goals" (p.4). (4) Monitoring goals for achievement and instruction: "Effective
superintendents continually monitor district progress toward achievement and
instructional goals to ensure that these goals remain the driving force behind a district's
actions" (p.4). (5) Use of resources to support achievement and instruction goals:
"Effective superintendents ensure that the necessary resources, including time, money,
personnel, and materials, are allocated to accomplish the district's goals. This can mean
cutting back on or dropping initiatives that are not aligned with district goals for
achievement and instruction" (p.4). (c) finding 3: superintendent tenure is positively
correlated with student achievement: "Marzano & Waters found two studies that looked
specifically at the correlations between superintendent tenure and student achievement.
The weighted average correlation in these two studies was a statistically significant .19,
which suggests that the length of superintendent tenure in a district positively correlates
to student achievement. These positive effects appear to manifest themselves as early as
two years into a superintendent's tenure" (Marzano & Waters, 2006, p. 4). (d) finding 4:
defined autonomy:
"One set of findings from the meta-analysis that at first appears
contradictory involves building-level autonomy within a district. One study
reported that building autonomy has a positive correlation of .28 with average

student achievement in the district, indicating that an increase in building
autonomy is associated with an increase in student achievement. Interestingly,
the same study reported that site-based management had a negative correlation
with student achievement of (-) .16, indicating that an increase in site-based
management is associated with a decrease in student achievement. Researchers
concluded from this finding that effective superintendents may provide principals
with "defined autonomy." That is, they may set clear, non-negotiable goals for
learning and instruction, yet provide school leadership teams with the
responsibility and authority for determining how to meet those goals" (Marzano
& Waters, 2006 p. 3-4).
Synthesis. The literature suggests that: district level leadership matters, effective
superintendents focus their efforts on creating goal oriented districts, superintendent
tenure is positively correlated with student achievement, and that defined autonomy at the
principal level by the superintendent will lead to an increase in student achievement. The
theoretical framework for this study references Marzano & Waters, (2006) four major
findings from "School District Leadership that Works; The Effect of Superintendent
Leadership on Student Achievement; A Working Paper."
The results of this analysis will be presented in Chapter IV in table form as
suggested by the American Psychological Association (Field, 2009). Along with the
tables, an analysis and interpretation of the data is also included.

Data Collection
The data used in this study was obtained from several sources. Two of the
primary sources were The New Jersey School Report Card and Data Universe. Data
Universe was accessed using the steps listed below. This provided the data for analysis.
1. Select the website Data Universe. Go to: http://php.app.com
2. Select Public School Teachers.
3. Select Primary Job "Chief School Administrator" for Superintendent.
4. Select Submit.
5. Select Details.
The information on superintendent experience in district, educational experience in
New Jersey, and total number of experience in education then appears.
The researcher took the following steps in obtaining the data from the State of New
Jersey School Report Card.
1. Go to State of New Jersey Department of Education Website Homepage. Go to:
http://www.state.ni .us/ed~ication.com.
2. Click on Data.
3. Click on Enrollment.
4. Click on 2008-2009.
5. Click on District.
6. Click on County
7. Click on Town Preferred.
8. Click on File.
9. Click on Print Preview.

10. Click on Shrink to Fit.
1 1. Click on 30% for full page view and the ability to see all the predictive variables
on one page.
To acquire the attendance data from the New Jersey School Report Card the
researcher took the following steps.
1. Go to State of New Jersey Department of Education Homepage. Go to:
http://www.state.ni .us/education.com.
2. Select Data.
3. Select School Report Card.
4. Select New Jersey School Report Card.
5. Select CountyIDistrict,
6. Select a District.
7. Select a School.
8. Select NCLB Report.
9. Select English.
10. Select a County.
The NCLB School Report Card Page for 2008-2009 Attendance Rate appear on the
top of the page along with the district Adequate Yearly Progress (AYP) results.
After data for the study was gathered, I entered it into the Statistical Package for
Social Sciences (SPSS) version 19.0 software to run the appropriate statistical analysis.
Data Analysis
This study did not use human subjects and therefore did not need to go to the
Institutional Review Board (IRB). The data was obtained from an authentic source, New
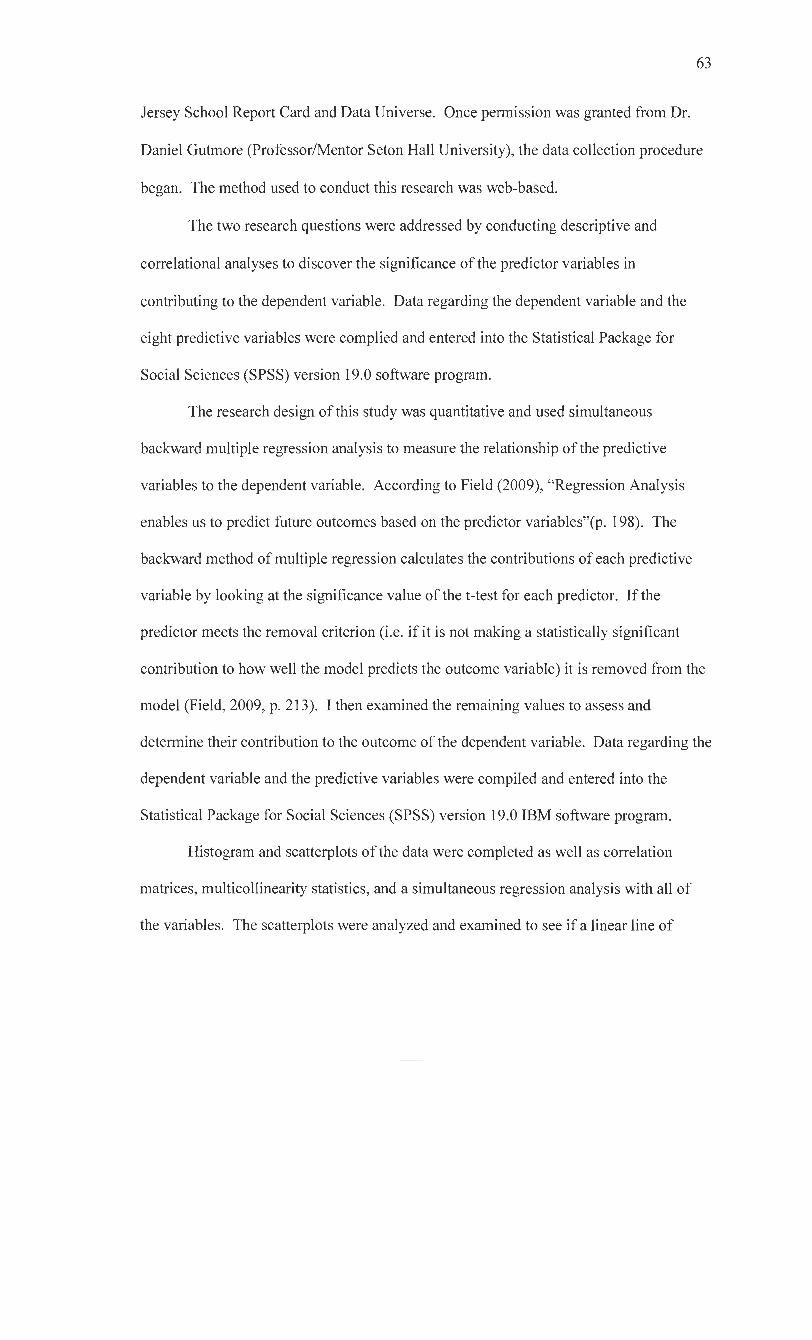
Jersey School Report Card and Data Universe. Once permission was granted from Dr.
Daniel Gutmore (ProfessorIMentor Seton Hall University), the data collection procedure
began. The method used to conduct this research was web-based.
The two research questions were addressed by conducting descriptive and
correlational analyses to discover the significance of the predictor variables in
contributing to the dependent variable. Data regarding the dependent variable and the
eight predictive variables were complied and entered into the Statistical Package for
Social Sciences (SPSS) version 19.0 software program.
The research design of this study was quantitative and used simultaneous
backward multiple regression analysis to measure the relationship of the predictive
variables to the dependent variable. According to Field (2009), "Regression Analysis
enables us to predict future outcomes based on the predictor variables"(p. 198). The
backward method of multiple regression calculates the contributions of each predictive
variable by looking at the significance value of the t-test for each predictor. If the
predictor meets the removal criterion (i.e. if it is not making a statistically significant
contribution to how well the model predicts the outcome variable) it is removed from the
model (Field, 2009, p. 2 13). I then examined the remaining values to assess and
determine their contribution to the outcome of the dependent variable. Data regarding the
dependent variable and the predictive variables were compiled and entered into the
Statistical Package for Social Sciences (SPSS) version 19.0 IBM software program.
Histogram and scatterplots of the data were completed as well as correlation
matrices, multicollinearity statistics, and a simultaneous regression analysis with all of
the variables. The scatterplots were analyzed and examined to see if a linear line of

strength was present or if the scatterplots were unrelated to the dependent variable. The
curvilinear line of the histogram was also analyzed and examined to determine the
strength of the results.
I conducted descriptive and correlational analyses to discover the significance of
the predictor variables in contributing to the dependent variable. I checked to ensure that
the assumption of no multicollinearity had not been violated by having any variables that
were too closely related to one another by checking the Pearson Correlation Coefficient,
the tolerance level, and the variance inflation factor (VIF) values between the predictive
variables (Field, 2009). "The level of multicollinearity can be assessed by looking at the
predictor variables. The predictor variables should not have a strong relationship with
each other. The stronger the relationship between the predictors, the higher the degree
off multicollinearity of the betas" (Walker, 201 1, p. 7).
Summary
The accountability movement of the 21S' century has taken over in public
education. There will be even greater pressure on public schools to produce academically
proficient students and this responsibility will fall on the shoulders of the district leader:
the superintendent. In today's educational establishment, schools are faced with
increasing academic rigor. Schools are responsible for finding adequate programs and
resources to meet with the increased accountability measures imposed since The No
Child Left Behind Act of 2001. As this is today's modern educational reality, this study
is being done to examine the relationship between the length of tenure superintendents
have on the student achievement of New Jersey third grade students as evidenced by their
proficiency or better scores on the 2008-2009 language arts NJASK. In Chapter IV a

presentation and discussion of the data and interpretations will be presented. The
researcher will also present the results of all the analyses that were conducted in Chapter
IV.

Chapter IV
ANALYSIS AND PRESENTATION OF DATA
Education in the 21" century is entering a critical time for school leaders. The No
Child Left Behind Act (2001) has imposed increased standards for and higher measures
of accountability on school leaders, and most notably superintendents. There are
mounting pressures for superintendents to lead their school districts in achieving and
maintaining Adequate Yearly Progress. The ability to make Adequate Yearly Progress is
based on 41 indicators; the most important of which are the high stakes tests like the New
Jersey Assessment of Skills and Knowledge (NJASK) in grade 3 language arts.
The purpose of this research was to investigate if the relationship between
superintendent tenure, longevity, and continuity at the district level impacts student
achievement as evidenced by the 2008-2009 New Jersey Assessment of Skills and
Knowledge (NJASK) for grade 3 language arts. This research determined the impact the
length of tenure as a New Jersey superintendent in the DFG's A-CD had on student
achievement as evidenced by students who scored "proficient" of better on the 2008-2009
New Jersey Assessment of Skills and Knowledge (NJASK) in language arts for grade 3.
This research looked at 8 predictive variables that included the following: (a) total
student population, (b) students who were eligible for free lunch district wide, (c)
students who were eligible for reduced lunch district wide, (d) students who were Limited
English Proficient (LEP) district wide, (e) student attendance district wide. (f) total
superintendent experience in district, (g) total experience in education in New Jersey, and
(h) total educational experience.
The dependent outcome variable for this study is student achievement.
This chapter began with an overview of the quantitative data analysis procedures
that have been collected from the original population of 142 school districts (Originally
16 1 bccause of the exclusioil criteria) that represents school districts in DFG's of A-CD
in the State of New Jersey. The overview and analysis will include the procedures within
the analysis and a description of the demographic characteristics of the sample. The
following research questions were examined in this study:
I . What is the relationship between New Jersey Superintendent's district
continuity; such as, length of tenure as a superintendent, and their longevity; such as,
years of experience as a superintendent and the total number of years in education as they
relate to student academic achievement as evidenced on the 2008-2009 third grade New
Jersey Assessment of Skills and Knowledge (NJASK) in language arts?
2. What is the relationship between New Jersey Superintendent's district
Demographics relative to student academic achievement as evidenced by the 2008-2009
third grade New Jersey Assessment of Skills and Knowledge (NJASK) in language arts?
Chapter IV will conclude with a summary of the data findings as they relate to the
research questions. The outcomes for research questions 1 and 2 were compared to those
of Marzano and Waters (2009) to see if there were any possible relationships between
superintendent tenure at the district level and student achievement as part of this
investigation.

Student Achievement Total Student
c Population Eligible for ' Free Lunch E? Eligible For
J Reduced Lunch LEP
!!? m Attendance .. a, L Experience As
Sup. In District Exp. In New Jersey Exp. Total Student Achievement Total Student Population Elig. For Free Lunch
!! Elig. For Reduced
- Lunch d
LEP 2 Attendance .- Exp. As Sup. In District Exp. In New Jersev Exp. Total Student Achievement Total Student Pop. Elig. For Free Lunch Elig. For Reduced Lunch LEP Attendance Exp. As Supt. In District Exp. In New Jersey - Exp. Total
Table 1. Collinearit : Pearson Correlation P - Student 4chieve merit - 1.000
-.209
-.437
-.071
- 179 ,300 .I21
284
,199 ,000
,006
.ooo
,199
,017 ,000 ,076
,000
,009 142
142
142
142
142 142 142
142
142 -
Total Student
'opulation -.209
1 .ooo
,448
,099
,196 -.210 ,162
-.I42
-.I78 ,006
.ooo
.ooo
.I20
,010 .006 ,027
,045
,017 142
142
142
142
142 142 142
142
142 -
- Elig. For Free
Lunch -.437
.448
1.000
,242
.376 -.326 ,147
-.059
-.045 ,000
,000
,000
,002
,000 000 ,040
,242
,298 142
142
142
142
142 142 142
142
142 -
- Elig. for ?educe 1 Lunch -.071
.099
,242
1.000
.041 ,003 ,163
,059
,030 ,199
,120
,002
,000
,315 ,485 ,026
,242
,361 142
142
142
142
142 142 142
142
142 -
LEP 1 Atten -.I79 .300
- Exp.
As Sup. In Dist. I
.I21
.I62
147
,163
,108 -.008 1 000
,555
,501 ,076
,027
.040
.026
,100 .462 ,000
,000
,000 142
142
142
142
142 142 142
142
142 -
Data Analysis Procedures
Exp. In New
Jersey ,284
-.I42
-.059
,059
.070 -.040 ,555
1.000
,814 .OOO
.045
,242
.242
,203 .318 ,000
,000
,000 142
142
142
142
142 142 142
142
142
The researcher conducted a non-experimental, cross sectional, explanatory study.
Exp. Total ,199
-.I78
-.045
,030
,106 -.065 ,501
,814
1.000 ,009
,017
,298
,361
,104 ,221 ,000
.ooo
,000 142
142
142
142
142 142 142
142
142
The correlational study only collected data from one point in time. Under the auspices of
Johnson (2001) notes that an explanatory study must answer the following questions: (a)
Were the researchers trying to develop or test a theory about phenomenon to explain

"how" and "why" it operates? (b) Were the researchers trying to explain how the
phenomenon operates by identifying the causal factors that produce change in it (p. 9)?
In order to determine which superintendent and district variables had a statistically
significant relationship to student achievement, I used a simultaneous multiple regression
model for my study. This strategy is used when the researcher has no logical or
theoretical structure to the data. This method is typically used to explore and maximize
prediction (Pedhazur, 1997). Scatter diagrams of residuals, partial plots, and normal
probability plots of residuals were constructed to test assumptions.
The researcher used data that was collected from the New Jersey School Report
Card and Data Universe for this study. This chapter provides an overview of the research
questions and examines the results of the analysis performed in the completion of this
study. This study did not use any human subjects. This study used a multiple regression
analysis to examine the data. Specifically this chapter examined the multicollinearity of
the predictive variables, the model summary of the backward multiple regression analysis
of the data and how it was produced, and the standardized coefiicient Beta weights of the
predictive variables. Results are presented both as brief discussions and in table form.
An important step in a multiple regression analysis is to ensure that the
assumption of no multicollinearity has been met. Multicollinearity is a statistical
phenomenon in which two or more predictor variables in a multiple regression model are
highly correlated (Wikipedia, 201 1). As displayed in Table 1 on page 67, Pearson
Correlations were calculated among the eight predictive variables. As none of the
correlations reached the .80 threshold, the analysis shows that no two variables are
closely related.
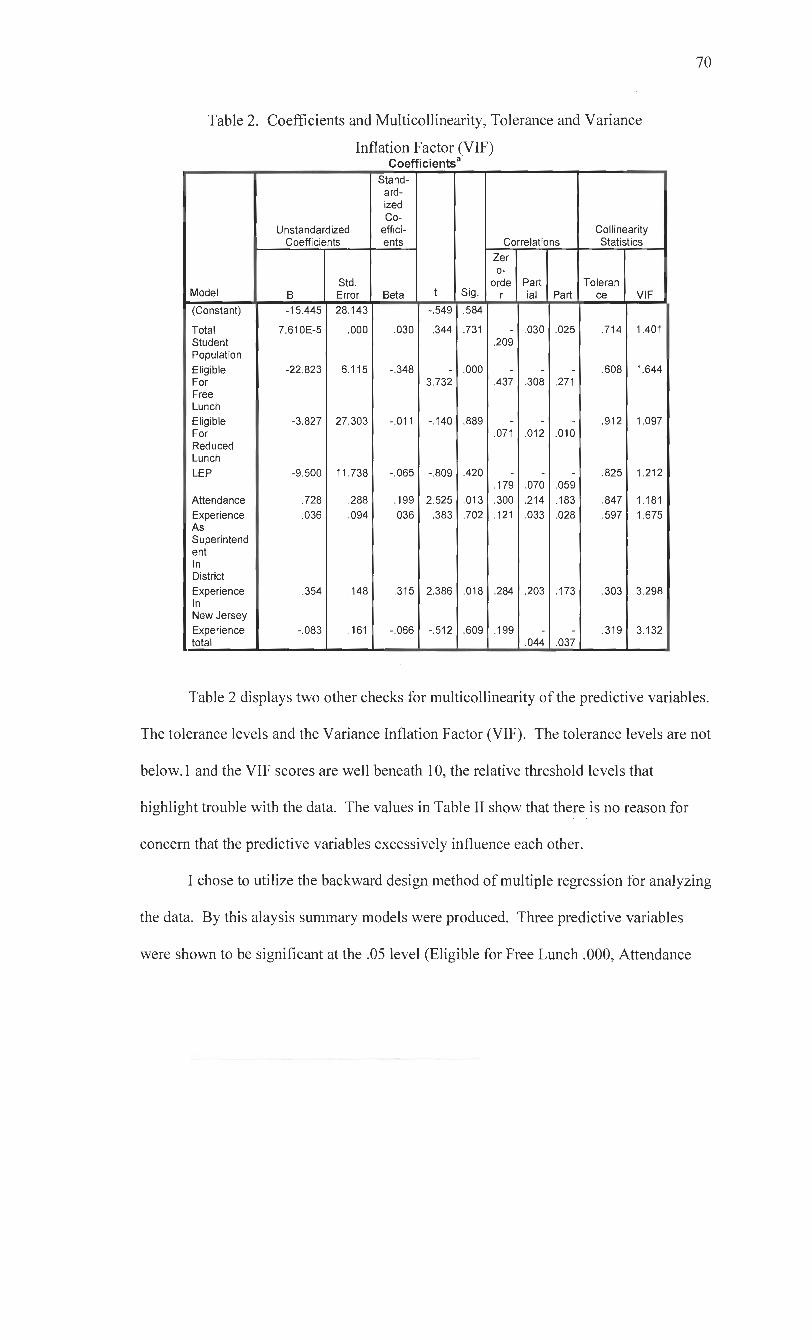
Table 2. Coefficients and Multicollinearity, Tolerance and Variance
Model
(Constant)
Total Student Population Eligible For Free Lunch Eligible For Reduced Lunch LEP
Attendance Experience As Superintend ent In District Experience In New Jersey Experience total
Inflation Factor (VIF) Coefficientsa
Unstandardized :s
Std. Error - 28.143
,000
6.115
27.303
11.738
,288 ,094
,148
,161 -
- stand- ard- ized Co-
effici- ents
Beta - .030
-.348
-.011
-.065
,199 ,036
,315
-.066
Sig. - ,584
.731
,000
.889
,420
,013 ,702
.018
.609 -
Cc - Zer 0-
xde r - ,209
.437
,071
.I 79
.300 ,121
.284
,199 -
elatit -
Part ial - ,030
.308
,012
.070 ,214 .033
,203
,044 -
-- -
Collinearity
CS
VIF - 1.401
1.644
1.097
1.212
1.181 1.675
3.298
3.132 -
Table 2 displays two other checks for multicollinearity of the predictive variables.
The tolerance levels and the Variance Inflation Factor (VIF). The tolerance levels are not
below. 1 and the VIF scores are well beneath 10, the relative threshold levels that
highlight trouble with the data. The values in Table I1 show that there is no reason for
concern that the predictive variables excessively influence each other.
I chose to utilize the backward design method of multiple regression for analyzing
the data. By this alaysis summary models were produced. Three predictive variables
were shown to be significant at the .05 level (Eligible for Free Lunch .000, Attendance

.013, and Experience in New Jersey .O 18), all of the models showed significance levels of
p < -05. Only data for the third model is included here as it was found to be most
parsimonious.
Table 3. Model summary
Model surnmawb
I I 1 I I I Channe Statistics I I Std Error (
a. Predictors: (Constant), Experience Total, Eligible For Reduced Lunch, Attendance, LEP, Total
Student Population, Experience as Superintendent in District, Eligible For Free Lunch, Experience
in New Jersey
b. Dependent Variable: Student Achievement
Mod
el
1
Table 3 shows the results of the predictive variables in the simultaneous backward
multiple regression analysis. Twenty five and six tenths percent of the variance is
explained in the predictors of the variables? (R Square .256 x 100 = 25.6; 74.4 + 25.6 =
100%). The predictive variables of The Total Student Population, Eligible for Free
R
54ea
Lunch, Eligible for Reduced Lunch, LEP, Attendance, Experience as Superintendent in
District, Experience in New Jersey, and Experience Total are displayed in this model.
R
Square
799
The R Square in a multiple regression represents explained variance that can be
contributed to all the predictors in a progression. The R Squared gives explanatory
power. In Table 3 the Model Summary shows the R Squared of .299 (.299 x l00=
Adjusted
R Square
756
29.9%) or 29.9 of the variance in the dependent variable (Student Achievement), the
percentage of students who scored "Proficient" or better on the 2008-2009 Third Grade
of the
Estimate
10 984.13
New Jersey Assessment of Skills and Knowledge in Language Arts was accounted for by
the predictive variables in the model. (F = 7.074; df = 8, 133; p = ,000 or p< .05).
R Square
Change
7 9
Chang
e
7 074
dfl
8
df2
13.1
Sig. F
Change
000
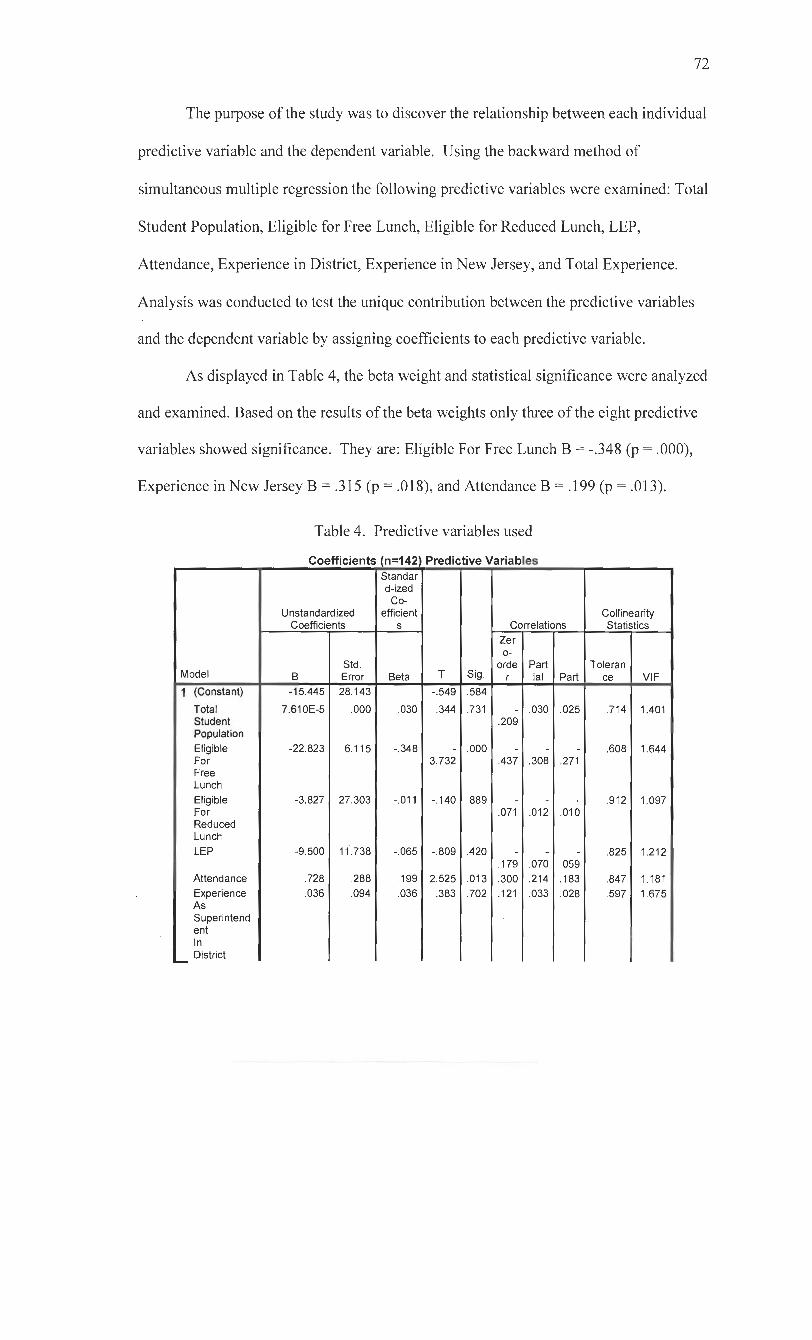
The purpose of the study was to discover the relationship between each individual
predictive variable and the dependent variable. Using the backward method of
simultaneous multiple regression the following predictive variables were examined: Total
Student Population, Eligible for Free Lunch, Eligible for Reduced Lunch, LEP,
Attendance, Experience in District, Experience in New Jersey, and Total Experience.
Analysis was conducted to test the unique contribution between the predictive variables
and the dependent variable by assigning coefficients to each predictive variable.
As displayed in Table 4, the beta weight and statistical significance were analyzed
and examined. Based on the results of the beta weights only three of the eight predictive
variables showed significance. They are: Eligible For Free Lunch B = -.348 (p = .000),
Experience in New Jersey B = .3 15 (p = -01 8), and Attendance B = .I99 (p = .013).
Table 4. Predictive variables used
Model
1 (Constant)
Total Student Population Eligible For Free Lunch Eligible For Reduced Lunch LEP
Attendance Experience As Superintend ent In - District
Coefficient
Unstandardized ts
Std. Error - 28.143
,000
6.1 15
27.303
11.738
288 .094
n=142 - 3andar d- zed
Co- sfficient
S
Beta - ,030
-.348
-.011
-,065
,199 .036
ive ' -
Sig. - ,584
,731
,000
889
,420
,013 ,702
Collinearity Ct -
Zer 0-
orde r -
,209
.437
.071
.I79 ,300 .I21
.elati -
Part ial
,030
,308
.012
.070 ,214 .033
IS
Part - ,025
,271
,010
.059 ,183 ,028
Stat -
roleran ce - .714
,608
,912
.825
.847 ,597

Histogram
Experience
New Jersey Experience total
0 I I I I I I I -3 -2 -1 0 1 2 3
Regression Standardized Residual
.354
-.083
Figure I. Histogram
Figure 1 shows the Histogram is a bar-type graph for quantitative data. It was
developed from the dependent variable student achievements and the eight predictive
variables. The common boundaries between adjacent bars emphasize the continuity of
the data, as with continuous variables (Witte & Witte, 2007, p. 39). This graph shows
that a dense concentration of the predictive variables has an impact on student
achievement. The highest bars on the graph have the greatest impact on student
achievement. They are Eligible for Free Lunch (.000), Attendance (.013), and
Educational Experience in New Jersey (.018). The equal intervals along the abscissa (x-
axis, predictors) reflect the various class intervals relative to student achievement. The

74
frequency polygon or line graph shows a curvilinear relationship. The data can best be
described with a curved line based on this graph.
Normal P-P Plot of Regression Standardized Residual
Dependent Variable: StudentAcheivement
I I I I I 0.0 0.2 0.4 0.6 0.8 1 .O
Observed Cum Prob
Figwe 2. P-plot distribution Observed Cum Prob
Figure 2 shows the cumulative number of 142 school districts in the DFG A-CD
as the population. This scatterplot is misleading. The linear relationship shows that the
more closely the predictive variables the stronger the relationship will be with student
achievement.

Partial Regression Plot
TotalStudentPopulation
Figure 3. Partial regression plot Total Student Population
Figure 3 for the predictive variable of total student population (p = .73 1) (see
table 3) relative to student achievement shows little or no relationship. This dot cluster
does not have a strong or weak relationship. The dot cluster reflects little or no
relationship based on the scatterplot for total student population.
Research question 1
1. What is the relationship between New Jersey Superintendent's district
demographics relative to student academic achievement as evidenced by the 2008-2009
3rd Grade New Jersey Assessment of Skills and Knowledge (NJASK) in language arts?
Based on the beta weights The Total Student Population B = .030 (p= .73 1) in
New Jersey Schools with DFG's A-CD was not shown to significantly impact the
outcome of the dependent variable (student achievement) at the .05 level. This is a very
interesting finding. The mean average for the total student population is 2,993. The
range is 39,867 (39,99 1 S O High, 124 Low). As determined by the multiple regression
anlaysis what is the impact of the predictive variable, total student population, on the

dependent variable, student achievement? Table 3 shows the results of the multiple linear
regression that was conducted (df = 1, 140, F = 6.402, p = .73 1).
Examination of the regression coefficient reveals that the total student population
does not have a statistically significant impact on student achievement. (B = .030, t =
Partial Regression Plot
De~endent Variable: StudentAcheivement
Figure 4. Partial regression plot Eligible for Free Lunch
Figure 4 for the predictive variable Eligible for Free Lunch (p = .000)
demonstrates a strong linear relationship based on the dot cluster (see figure 4). The
scatterplot demonstrates that the dot cluster is strong between students who are Eligible
for Free Lunch and student academic achievement.

Based on the relative strength of the beta weights, Eligible for Free Lunch (B = -
,348, p = .000) was shown to be the most statistically significantly of all the predictive
variables to student achievement. What is the relative impact of the predictive variable
Eligible For Free Lunch, on the dependent variable, Student Achievement as shown in
Table 3? The relative impact indicates that for every unit decrease in students who are
eligible for free lunch there is a beta weight of - .348 increase in student achievement. (B
= -.348, t = -3.732, p = .000).
The R Square (. 19 1) indicates that 19.1 % of the variance in student achievement
is explained by the predictive variable Eligible for Free Lunch. The simultaneous
multiple regression analysis is statistically significant (df = I , 139, F = 25.274, p = .000).
Examination of the regression coefficient reveals that: students being eligible for
free lunch has a statistically significant impact on student achievement (B = -.348, t = -
3.732, p = ,000). Based on the beta the direction of the impact is negative (B = -.348).
The results indicate that for every student who is eligible for free lunch there is a negative
impact on student academic achievement. Simply put, the more students who are on free
and reduced lunch the greater the chance to have lower test scores on the 3rd grade 2008-
2009 New Jersey Assessment of Skills and Knowledge (NJASK) in language arts. Based
on the beta (-.348), students who are eligible for free lunch do not perform as well on
high stakes tests like the NJASK.

Partial Regression Plot
Dependent Variable: StudentAcheivement
Eligibleforreducedlunch
Figure 5. Partial regression plot Eligible for Reduced Lunch
Figure 5 for the predictive variable of eligible for reduced lunch (p = -889)
relative to student achievement shows a weak or little to no relationship. This dot cluster
does not have a strong or weak relationship. The dot cluster reflects little or no
relationship based on the scatterplot for total student population.
Based on the beta weights Eligible for Reduced Lunch (B = - -01 1, p = 3 8 9 ) was
not shown to significantly impact the outcome variable student achievement. Students
who are Eligible for Reduced Lunch showed the weakest relationship (gti') of the eight
predictive variables to the outcome variable student achievement. What is the relative
impact of the simultaneous multiple regression analysis of the predictive variable eligible
for reduced lunch on the dependent variable student achievement as examined in Table
3?

Examination of the regression coefficient reveals that being eligible for reduced
lunch does not have a statistically significant impact on student achievement (B = -.011,
t = -.140, p = .889). (df = 1,138, F = .211, p = .889). This data is consistent with the
NAEP (2010) research that indicates free lunch matters much more than reduced lunch.
This is why when examining extant literature you cannot just look at freelreduced lunch
combined, they need to be examined independently.
Partial Regression Plot
-.20 .OO .20 .40 .60 .80
LEP
Figure 6. Partial regression plot Limited English Proficient (LEP)
Figure 6 for the predictive variable of LEP (p = .429) (see Table 6) relative to
student achievement shows little or no relationship. This dot cluster shows neither a
strong nor a weak relationship and appears to be moderate.
Based on the beta weights, the variable Limited English Proficient (LEP) (B-= -
.065, p = .420) was not shown to significantly impact the outcome of the dependent

variable student achievement. This is very interesting because an assumption would be
that students who are LEP would score lower on the NJASK test of language arts because
of a language barrier. What is the relative impact of the multiple regression analysis of
the predictive variable LEP on the dependent variable student achievement as shown in
Table 3? (df = 1,137, F = ,033, p = .420).
Examination of the regression coefficient reveals that the variable: Limited
English Proficient (LEP) does not have a statistically significant impact on student
achievement (B = -.065, t = -.809, p = .420).
Partial Regression Plot
Dependentvariable: StudentAcheivemenl
Attendance
Figure 7. Partial regression plot Attendance
Figure 7. for the predictive variable for Attendance (p = .013) (see figure 7) shows
a strong linear relationship that can best be represented with a straight line. The
scatterplot shows that there is a strong correlation between students who are Attendance
and student academic achievement.
Based on the beta weights, the District Attendance of students (B = .199, p =
.013) in A-CD DFG's in New Jersey was shown to significantly impact the outcome of
the dependent variable, student achievement. Of the eight predictive variables used in

Table 3, the District Attendance in New Jersey had the third strongest effect size on the
dependent variable, student achievement. The District Attendance of students, based on
the beta weights, was the third most statistically significant predictive variable on the
outcome variable, student achievement. What is the relative impact of the multiple
regression analysis of the predictive variable, district student attendance, on the
dependent variable student achievement as shown in Table 3? The relative impact
indicates that for every unit increase in attendance scores there is a ,199 increase in the
beta weight relative to student achievement.
The model summary shows that the simultaneous multiple linear regression was
conducted. The R Squared (.220) indicates that 22.2% of the variance in student
achievement is explained by the predictive variable district student attendance. The
simultaneous multiple regression analysis is statistically significant (df = 1, 136, F =
6.040, p = .013).
Examination of the regression coefficient reveals that: The district attendance of
students has a statistically significant impact on student achievement (B = .199, t = 2.525,
p = .013). Based on the beta, the direction of the impact is positive. The results indicate
that, for the districts, student attendance had a positive impact on student academic
achievement. Simply put, the better the district student attendance percentage the greater
the chance to have higher test scores on the third grade 2008-2009 New Jersey
Assessment of Skills and Knowledge (NJASK) in language arts. Conversely, based on
the beta (. 199), poor district attendance may result in lower test scores on the third grade
2008-2009 New Jersey Assessment of Skills and Knowledge (NJASK) in language arts.

The relative impact indicates that for every unit increase in attendance scores there is a
.I99 beta weight increase in student achievement.
Partial Regression Plot
De~endent Variable: StudentAcheivement
ExperienceasSuperintendentindistrict
Figure 8. Partial regression plot Experience as Superintendent in District
Figure 8 for the predictive variable of experience as a superintendent in district (p
= .702) relative to student achievement shows a weak or little to no relationship (see
figure 8). This dot cluster does not have a strong or weak relationship. The dot cluster
reflects little or no relationship based on the scatterplot for experience as a superintendent
in the school district.
Research question 2
1. What is the relationship between a New Jersey Superintendent's continuity
(length of tenure as a superintendent) and longevity (years of experience as a
superintendent) and the total number of years in education as they relate to student

academic achievement as evidenced on the 2008-2009 third grade New Jersey
Assessment of Skills and Knowledge (NJASK) in language arts?
Bascd on the beta weights, Superintendent Experience in District (B = .036, p =
.702) was not shown to significantly impact the outcome variable, student achievement.
What is the relative impact of the multiple regression analysis of the predictive variable
superintendent experience in district on the dependent variable student achievement as
examined in Table 3? The model summary shows that the simultaneous multiple linear
regression was conducted. (df = 1 ,I 35, F = 6.040, p = .702).
Examination of the regression coefficient reveals that the superintendent
experience in district does not have a statistically significant impact on student
achievement (B = .036, t = .383, p = .702).
Partial Regression Plot
Dependent Variable: StudentAcheivement
m
Figure 9. Partial regression plot Experience in New Jersey
Figure 9 for the predictive variable of Experience in New Jersey (p = .018)
demonstrates a strong linear relationship that can best be described with a straight line
(see figure 9). The scatterplot shows that there is a strong correlation between the

predictive variable, Experience in New Jersey, and the dependent outcome variable,
student academic achievement.
Based on the beta weights, the variable Experience in Education in New Jersey (B
= .3 15, p = .018) was shown to significantly impact the dependent variable, student
achievement. Of the eight predictive variables used in model 111, Experience in New
Jersey had the second strongest effect on the dependent variable, student achievement.
The superintendent's experience in education in New Jersey was the second most
statistically significant predictive variable on the outcome variable, student achievement.
The relative impact indicates that for every unit increase in the superintendent's
experience in education in New Jersey there is a .3 15 increase in student achievement on
the 2008-2009 New Jersey Assessment of Skills and Knowledge.
The R Square (.297) 29.7% of the variance in student achievement is explained by
the predictive variable in the superintendent's experience in education in New Jersey.
The multiple regression analysis is statistically significant (df = 1, 134, F =8.348, p =
.Ol8).
Examination of the regression coefficient reveals that superintendent experience
in education in New Jersey has a statistically significant impact on student achievement
(B = .3 15, t = 2.386, p = .018). Based on the beta the direction of the impact is positive
(B = -3 15) indicating that the superintendent's experience in education in New Jersey has
a positive impact on student academic achievement. Simply put, the more years of
experience a superintendent has in education in New Jersey the higher the test scores on
the third grade 2008-2009 New Jersey Assessment of Skills and Knowledge (NJASK) in
language arts. Conversely, a lack of experience in education in New Jersey may result in

85
lower test scores on the third grade 2008-2009 New Jersey Assessment of Skills and
Knowledge (NJASK) in language arts. The relative impact indicates that for every unit
increase in the supcrintendent's experience in education in New Jersey there is a .3 15
increase in student achievement on the 2008-2009 New Jersey Assessment of Skills and
Knowledge.
Partial Regression Plot
Dependent Variable: Studentkheivement -
Experiencetotal
Figure 10. Partial regression plot Experience Total
Figure 10 for the predictive variable of total experience in education is (p = .609)
(see figure 10). Relative to student achievement the scatterplot shows a weak or little to
no relationship. This dot cluster does not have a strong or weak relationship. The dot
cluster reflects little or no relationship based on the scatterplot for total experience in
education.
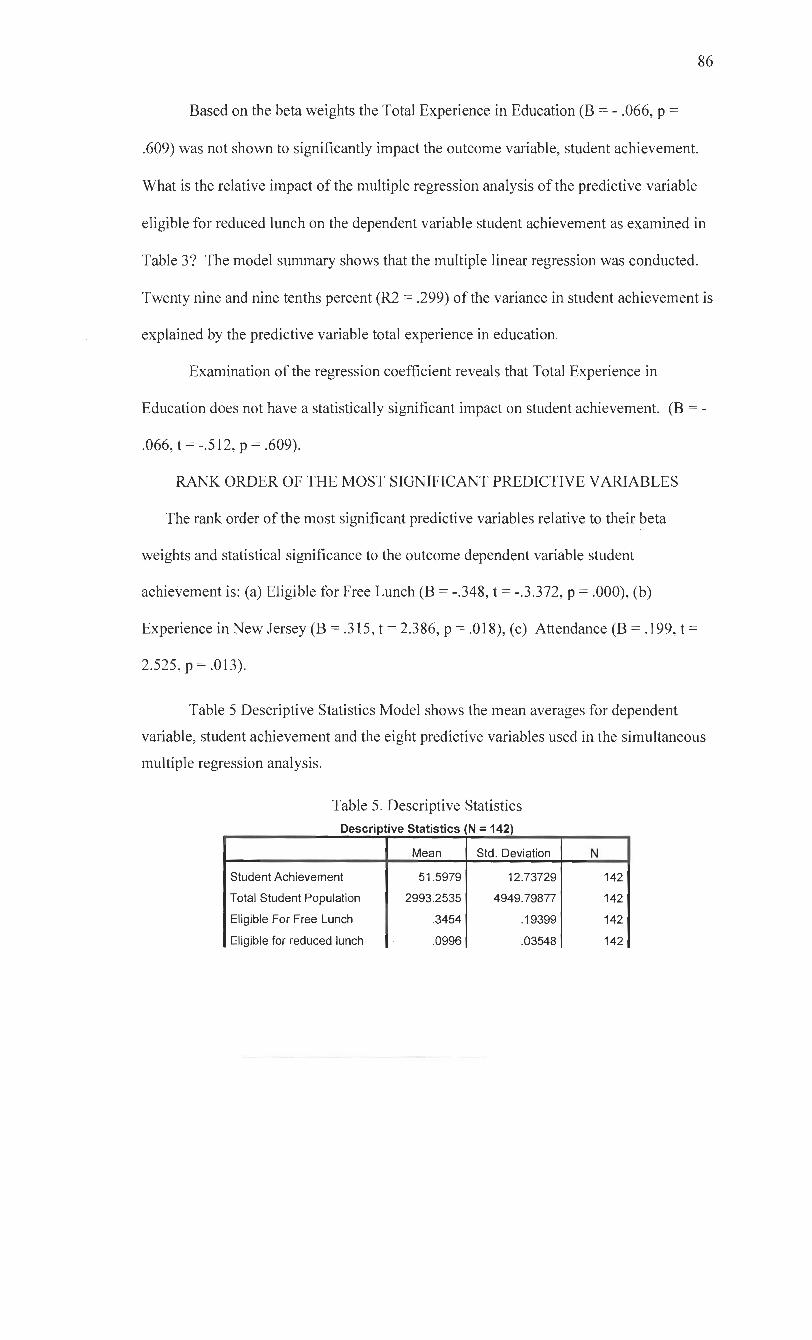
Based on the beta weights the Total Experience in Education (B = - .066, p =
.609) was not shown to significantly impact the outcome variable, student achievement.
What is the relative impact of the multiple regression analysis of the predictive variable
eligible for reduced lunch on the dependent variable student achievement as examined in
Table 3? The model summary shows that the multiple linear regression was conducted.
Twenty nine and nine tenths percent (R2 = .299) of the variance in student achievement is
explained by the predictive variable total experience in education.
Examination of the regression coefficient reveals that Total Experience in
Education does not have a statistically significant impact on student achievement. (R = -
.066, t = -.512, p = .609).
RANK ORDER OF THE MOST SIGNIFICANT PREDICTIVE VARIABLES
The rank order of the most significant predictive variables relative to their beta
weights and statistical significance to the outcome dependent variable student
achievement is: (a) Eligible for Free Lunch (B = -.348, t = -.3.372, p = .000), (b)
Experience in New Jersey (B = .315, t = 2.386, p = .018), (c) Attendance (B = .199, t =
2.525, p = ,013).
Table 5 Descriptive Statistics Model shows the mean averages for dependent
variable, student achievement and the eight predictive variables used in the simultaneous
multiple regression analysis.
Table 5. Descriptive Statistics Descriptive Statistics (N = 142)
Student Achievement
Total Student Population
Eligible For Free Lunch
Eligible for reduced lunch
Mean
51 5979
2993.2535
.3454
.0996
Std. Deviation
12.73729
4949.79877
.I 9399
.03548
N
142
142
142
142

Table 6. Spss Straight Data Output
LEP
Attendance
Experience as
Superintendent in district
Experience in New Jersey
Experience total
SPSS Straight Data Output for the Eight Predictive variables plus district factor
-
grouping and the dependent variable student achievement.
Dist. Total Eligible Eligible Name Student for DFG Pop. Free A-CD Lunch
for Reduced Lunch .05 .10 .08 .10 -05 -14 .17 .10 .15 -09 .12 .I 1 .14 -08 .10 .15 .12 -07 . l l .05 .I0 .09 .10 .08 .I4 .12 . l l -09 .06
LEP
-06 .16 .19 .02 .08 .oo .07 .oo .14 .03 .o 1 .12 .07 .13 .05 .03 .o 1 .18 .09 .o 1 -04 .33 .oo .06 .20 .08 .oo -0 1 -07
Attend- Student Exp, ance
90.60 93 .OO 93.70 93.20 89.00 93.40 95.40 94.20 94.50 93.80 94.20 93.20 94.70 95.80 92.70 95.90 83.00 68.40 90.30 92.10 94.90 92.70 86.70 85.40 95.20 94.70 94.70 90.70 91.60
Achieve- As ment
24.50 44.40 28.10 48.50 19.90 50.00 67.90 40.00 35.00 52.20 35.40 5 1 .OO 3 1.80 43.50 40.60 45.00 41.70 34.70 40.50 53.60 50.50 28.70 28.50 3 5.90 48.20 40.70 82.20 15.70 65.60
Supt.
0 10 16 2 3 4 1 3 6 4 3 3 12 18 6 5 22 8 14 5 1 10 0 33 13 11 33 0 2 3 1 39
Exp. Exp.


Summary
This chapter continues the purpose of the study, an overview of the examination
and evaluation of data analysis procedures, histographs of the data, scatterplots, answers
to the research questions, and a chapter summary. Several models of data that were
pertinent to research in conducting the backward method of simultaneous multiple
regression analysis were examined. Chapter IV presented the results of the data analysis.
The results of the backward multiple regression analysis showed that the variables: total
student population, eligible for reduced lunch, eligible for free lunch, LEP, attendance,
experience in district, experience in New Jersey, and total experience did predict the
percentage of students who scored "Proficient" or better on the 2008 New Jersey
Assessment of Skills and Knowledge (NJASK) in language arts.

This chapter showed how the predictive variables impacted the dependent
variable. Beta weights were computed to show this contribution. Although included as
one of the predictive variables that had an effect on the percentage of students who
scored "proficient" or better on the 2008-2009 New Jersey Assessment of Skills and
Knowledge for grade 3 in language arts, the primary focus of this study which was to
examine whether the superintendent's length of tenure (B = .036) has on student
academic achievement proved to have weak relative impact, according to the beta
weights.
The insights gained by this research will contribute to the quantitative data in
existence regarding superintendent tenure, longevity, and continuity relative to student
achievement as defined by the 2008-2009 New Jersey Assessment of Skills and
Knowledge (NJASK) in language arts for grade 3. This study will hopefidly provide
insights to districts as to how they can best keep their superintendents for a longer period
of time in an effort to increase student academic achievement.
Chapter V will provide an interpretation of the data and the conclusions of the
research study. Findings will be presented in a manner that extends the knowledge base
contained within the accompanying literature review. In addition, suggestions for policy,
practice, and further research will be discussed.

Chapter V
CONCLUSIONS, RECOMMENDATIONS FOR PRACTICE,
RECOMMENDATIONS FOR POLICY
Introduction
This research was conducted to discover if superintendent's tenure, longevity, and
continuity have an impact on student academic achievement as evidenced by the 2008-
2009 New Jersey Assessment of Skills and Knowledge (NJASK) in grade 3 language
arts. Identification of the variables that would most impact student academic
achievement were sought for this study. Insights gained by this investigation may
provide opportunities for future or aspiring superintendents and help them make the leap
into central office positions with the knowledge of knowing the most significant factors
impacting student achievement on the NJASK. In addition, these findings may have
significance in helping districts form strategic plans of action that will address areas of
weakness identified in this research paper, assist in tailoring appropriate professional
development plans based on student demographic needs, aide new lawmakers with
developing more rigorous standards for superintendents that will positively impact
student achievement, and aid institutions of higher education in establishing top notch
administration and preparatory programs for aspiring superintendents.
This chapter presents a summary of the variables and includes conclusions,
recommendations for practice, and recommendations for policy. This chapter also
presents a summary of the purpose of the research, a summary of procedures,
recommendations for future research, a summary of the findings, and conclusions. This
chapter will only focus on the three most significant predictive variables and their impact

on student achievement. They are: students who are eligible for free lunch,
superintendent experience in New Jersey, and the percentage of student attendance in
district. The other five predictive variables were not statistically significant and were
discussed in Chapter IV.
Eligible For Free Lunch Variable
Conclusions
The percentage of students who were Eligible For Free Lunch was the most
significant predictor of student achievement on the third grade New Jersey Assessment of
Skills and Knowledge in Language Arts. 'The results of this study showed that this
variable had a positive relationship with student achievement. This is consistent with the
literature. Lee and Wong (2004) reported that after reviewing the extensive literature
available regarding the potential attainment of educational equality among students it is
evident that enacting accounting policies, providing additional funding, using high stake
consequences, using the results from tests of major indicators of student academic
success, and providing an increased number of education resources to struggling schools
will not, in and of themselves, lead to a successful bridge of existing achievement gaps at
the state and national testing levels (Lee & Wong, 2004). This supports the literature in
that socio-economic status plays a major role in the degree to which most students
achieve on the third grade New Jersey Assessment of Skills and Knowledge in Language
Arts. Coleman reported in 1966 that the greatest influence on student performance was
socioeconomic status (SES), followed by teacher characteristics and class size. Students
who were Eligible For Free Lunch did not perform as well as students who were not
receiving Free Lunch. If this is an indicator of future performance, then the issue of the

disparity in socio-economic status must be addressed. Students' future academic
achievements are influenced and can be predicted by past academic achievements
(Adelman, 2006; Dossett & Munoz, 2000; Ingels et al., 2002; Smith, 2006). The findings
of this study support that conclusion.
Recommendations for Practice
Based on the findings of this study the variable, Eligible for Free Lunch, predicted
the most significant impact on student achievement. Aspiring and current
superintendents need to address the socio-economics of their districts and how it impacts
high stakes tests like third grade New Jersey Assessment of Skills and Knowledge in
Language Arts. In looking at why students qualify, are eligible, and receive free lunch,
districts need to look at federal programs like the Race to The Top Application to see if
they can level the playing field for their students. Superintendents may look to share
more services between districts. By sharing services between affluent and non-affluent
districts superintendents may be able to off set some of the socio-economic disparity
between your poorer and wealthier districts.
Recommendations for Policy
Based on the findings of this study and a review of the literature, I believe it is
imperative to make sure that superintendents are addressing the issues associated with
students who are qualifying for free lunch. The evidence collected from this study
suggests that the allocation of funds from local, state, and federal agencies should be
reconsidered to try and bridge or remove the achievement gap that we currently have in
our educational system. Through policy development schoools could be made to host
career fairs for parents so that they can get and retain quality jobs. If a parent is gainfully
employed there is a greater chance that their children will not need or be eligible for the
free lunch program. Efforts need to be made on the part of school leaders to ensure that
early interventions are in place for those students who qualify for free lunch. Morning
programs that take place before the start of the school day could provide disadvantaged
students with additional academic support that would assist them in better succeeding on
high stakes tests like the third grade New Jersey Assessment of Skills and Knowledge.
Also local, state, and federal agencies need to look at the outcomes of putting so much
value on state mandated tests that are administered only once a year. It is unfortunate
that some students may be labeled throughout their educational years because of the
results of a high stakes assessment that is only administered once per school year.
Experience in Education in New Jersey Variable
Conclusions
The variable Experience in Education in New Jersey significantly predicted
student achievement on the 2008-2009 third grade New Jersey Assessment of Skills and
Knowledge in Language Arts. The superintendent's continuity of leadership was
evidenced by the data in this research. Superintendents remaining in the state of New
Jersey was a significant predictor of student achievement on the New Jersey Assessment
of Skills and Knowledge. The role of the board of education becomes critical when
talking about superintendent experience in education in New Jersey. As the hiring body
for the district, the board of education needs to make sure the superintendent they are
putting at the helm of the district understands the socio-economic climate of the students
he or she services. By having a superintendent with experience in education in New
Jersey the board of education gets and individual who is more likely to understand the

politics and culture than it would be if no superintendent were from outside New Jersey.
This will ultimately impact student achievement through the way instruction is delivered
and through the way that services are provided. The board of education needs to make
sure that the superintendent feels supported. By creating board alignment with district
goals and by supporting these goals, the superintendent will have a better chance of
improving student achievement in their school district. Marzano and Waters (2009)
reported that in effective school districts, the local board of education is aligned with and
supportive of the nonnegotiable goals for achievement and instruction (Marzano &
Waters, 2009, p. 7). Simply stated, this means that for a superintendent to be effective he
or she needs to have a strong board alignment and be supported in achieving district
goals. By hiring superintendents with educational experience in New Jersey districts will
be better able to achieve its goals.
Recommendations for Practice
Based on the findings of this study and a review of the literature it is important for
boards of education to make sure that they hire the right person for the job. The role of
the board of education is to ensure that the candidate they hire as superintendent is the
best fit for the district. Boards of education can ensure that they retain experienced
educators in New Jersey by doing several things. Boards of education can foster a
climate that ensures collaborative goal setting between the superintendent and the board
of education. By involving all relevant stakeholders, from central office to teaching staff,
boards of education will be tapping into a wide array of educational experience in New
Jersey that could enable a superintendent to establish and achieve non-negotiable goals
for the district. Boards of education need to make sure that they allocate their financial

resource in a competitive way. A way to retain New Jersey's best and brightest
superintendents is to make sure they are fairly compensated. This has become more
difficult since the superintendent salary cap has gone into effect. But, in order to keep
our best superintendents and not lose them to nearby states like New York and
Pennsylvania, boards of education are going to have to find a way to fairly compensate
outstanding superintendents.
Recommendations for Policy
To retain and attract experienced educators for the position of superintendent in
New Jersey boards of education need to allocate resources to support goals for
achievement and instruction. Districts need to apply and win grants like the federal Race
To the Top Grant. Boards of education need to allow the superintendent to monitor the
achievement and the instructional goals of the district. The board of education needs to
create policies that will foster board alignment with the superintendent and show
demonstrated support of the superintendent's district goals. The superintendent needs to
establish non-negotiable goals for the district that are aligned with the districts policies.
These goals should reflect student achievement outcomes as well as the results of
evidenced based teaching instruction. Superintendents need to make sure they continue
to emphasize training for school board members in proper boardsmanship. Boards of
education need to make sure that they are offering continuing professional development
to their superintendents so that they can be retained. Boards of education should send
their superintendents to local, state, and national conferences in an effort to foster best
practices in their districts. In an era of high stakes accountability for the superintendent,
the board of education should allow the superintendent to be part of a research based,

superintendent mentoring program. In this era of increased accountability and high-
stakes testing, school district administrators continue to search for ways to meet
expectations and ensure students have the skills they will need to be successful (Fleming,
2004).
Attendance Variable
Conclusions
Attendance was the third strongest predictor of student achievement on the 2008-
2009 third grade New Jersey Assessment of Skills and Knowledge in Language Arts. As
evidenced by the data in this research, poor district attendance negatively impacted
student achievement on the New Jersey Assessment of Skills and Knowledge. An
important factor to note in this study was that the districts that were analyzed in New
Jersey were from the lower socio-economic groups in the DFG classification range of A-
CD. The findings suggest that when socio-economic status is not a factor students
perform better. The findings show that poor district wide student attendance is associated
with poor test scores on the 2008-2009 third grade New Jersey Assessment of Skills and
Knowledge. Conversely, the findings in my study show that high district wide
attendance results in higher test scores on the 2008-2009 third grade New Jersey
Assessment of Skills and Knowledge in Language Arts. Caldas (1993), Roby (2004), and
Sheldon (2007) reported and confirmed that student attendance has a statistically
significant relationship with student achievement on standardized tests. The better the
district wide attendance percentage, the better the student performance scores on high
stakes assessments.

Recommendations for Practice
Based on the findings of this study school districts need to identify students who
have poor attendance in their primary years. A daily attendance report is recommended
to be used by all districts in New Jersey. Districts can purchase very well developed
attendance recording software to better track student attendance district wide.
Technology integration programs like Real Time, Systems Technology Information (STI)
and SASS1 can be used to better track district wide student attendance percentages. An
attendance committee should be established at every school to monitor student
attendance. Once a student is showing an attendance problem, the committee should
notify and meet with the parents regarding improving the students overall attendance.
Home visits can be conducted by the principal or guidance counselor in an effort to
improve student attendance. Building-based student attendance should be posted so that
teachers can see how their students compare to other classes.
Recommendations for Policy
Based on the findings in this study school districts need to examine their
attendance policy. Is their policy antiquated? When was the last time their attendance
policy was updated? In terms of the policy revision cycle, when is the attendance policy
going to be revised? Parents and students should be made aware of the attendance policy
through a student handbook. An attendance committee should establish the policy that
the board adopts. The attendance committee should bring a chronically absent student's
parents to court as a last resort in an effort to assist the student in improving his or her
attendance. Schools should also look at what they are doing in terms of greetings
students at the door, starting the day off with a "Do No Problem," providing a breakfast

program for those who may not or are unable to eat breakfast at home, and looking at
their transportation to see if they can better service students in need. School
administrators need to be proactive with regard to student attendance. Superintendents
and district leaders need to put measures in place to make sure that no student falls
behind due to excessive absences. Attendance interventions should take place prior to the
student hitting his or her maximum number of absences or tardies. In the event that a
student is unable to attend school, the New Jersey State Code needs to be followed and
home bound instruction needs to be provided. These recommendations should assist any
superintendent in improving their district-wide student attendance percentage.
Summary of Purpose
As the American education system of the 21" century is ever changing, the role of
the superintendent becomes more significant. Superintendents are faced with increasing
accountability and greater demands from the public to produce results that would be on
the "Advanced Proficient" level. Superintendents at one time served as clerks for their
school districts and boards of education. Their primary role was to take care of the day to
day operations of the school system (Carter & Cunningham, 1997). As we have entered
the 21 century the role of the superintendent has changed.
The superintendent is no longer just responsible for the day to day operations of
the district. but ultimately he or she is responsible for the districts academic achievement
levels as defined by the No Child Left Behind Act of 2001. The No Child Left Behind
Act focused on increased accountability measures, and that dictated the performance of a
superintendent. Instead of using the test "accountability system" as a diagnostic tool to

assist educators in differentiating and driving academic instruction, tests became the
primary indicator of a school's performance status (Rogers, 2006).
The shifting of responsibilities has placed more and more pressure on the
superintendents of the nation as they strive to meet the obligations set before them while
navigating the highly political world of the superintendency (Parker, 1996). The
increased pressure has had a negative impact on superintendent longevity. Clark (200 1)
states that the superintendency has evolved into somewhat of a temporary position.
The No Child Left Behind Act mandates that all states focus on improving student
academic standings while bridging the achievement gaps for all students. Four principles
steer the education reform policy in the United States: stronger accountability for results,
increased flexibility and local control, expanded options for parents, and an emphasis on
teaching methods that have been proven to work (NJDOE, 2006). Under the No Child
Left Behind Act, states have to meet 100 percent proficiency by the year 2014. The
NCLB Act mandates that each state measure the adequate yearly progress (AYP) attained
toward this goal for all students in language arts. Each state individually implements
AYP targets or benchmarks, to ensure this goal is achieved by 20 14. Districts that fail to
meet AYP targets are held accountable under the NCLB Act. This is why, in my opinion,
the role of the superintendent in impacting student academic achievement is critical;
because, in the eyes of the public, whether the district makes AYP is the only thing they
want to know. Superintendent turnover will continue to increase.
According to Glass (AASA, et al., 2000) the exact number of superintendents is
not known because, in hundreds of very small districts, the superintendent is also the
principal and is not counted when frequencies are tabulated. With this qualification

noted, the AASA estimates the number to be 13,728. This is down from the 14,000 to
14,500 estimated in 1990 because small districts are moving toward consolidation. The
average superintendent is 52, and most superintendents spend about 14 to 17 years on the
job in about two or three districts. The average length of stay is about 5 to 7 years in one
district. This is in contrast to the perception that the tenure of superintendents is about 2
112 years (Glass et al., 2000).
Based on the findings of this study, the researcher sought to examine the most
essential superintendent variables associated with improving student achievement. In
addition to investigating the possibility of relationships between superintendents and
district demographic information that would impact student academic achievement, the
following research questions guided the study
1. What is the relationship between New Jersey Superintendent's continuity; such as
length of tenure as a superintendent, and their longevity; such as; years of experience as a
superintendent and the total number of years in education as they relate to student
academic achievement as evidenced on the 2008-2009 third grade New Jersey
Assessment of Skills and Knowledge (NJASK) in language arts?
2. What is the relationship between New Jersey Superintendent's district
demographics relative to student academic achievement as evidenced by the 2008-2009
third grade New Jersey Assessment of Skills and Knowledge (NJASK) in language arts?
Summary of Procedures
The researcher used the backward method of simultaneous multiple regression to
complete the data analysis. The research design of this study was a non-experimental,
explanatory, cross sectional design and used a backward simultaneous multiple
regression analysis to measure the relationships of the predictive variables
(superintendent experience in district, tenure, superintendent experience in New Jersey,
and supcrintendent total educational experience), and the dependent variable, student
achievement on the New Jersey Assessment of Skills and Knowledge in grade 3 language
'arts for the 2008-2009 school year. "Non-experimental research is frequently an
important and appropriate mode of research in education" (Johnson, 2001, p. 3) due
largely in part to the inability to perform randomized experiments and quasi-experiments.
The researcher conducted a non-experimental, cross sectional, explanatory study.
In order to determine which district and school variables had a statistically
significant relationship with student achievement, I used simultaneous multiple
regression models for my study. This strategy is used when the researcher has no 11
or theoretical structure for the data. This method is typically used to explore and
ogical
maximize prediction (Pedhazur, 1997). Scatter diagrams of residuals and normal and
partial probability plots of residuals were developed to test assumptions.
This data was acquired, compiled, and analyzed using Data Universe and the New
Jersey School Report Card for the 2008-2009 school year. The 2008-2009 New Jersey
Assessment of Skills and Knowledge (NJASK) for grade 3 in language arts had a raised
linked cut score of 182 for proficiency. The percentage for proficiency under the "New
Target" for the 2008-2009 New Jersey Assessment of Skills and Knowledge was 59%.
In the data analysis of the New Jersey School Report Card, I looked at all districts that
had less than 41 % of there students in the partially proficient category on the 2008-2009
NJ ASK.

The two research questions were examined by conducting a descriptive
correlational analysis to discover if the significance of the predictor variables contribute
to the independent variable. This research design set the level of significance at p< -0.5,
as that is the customary level used in research when working on significance. To check
the statistical significance and relative importance of each predictive variable, I examined
the unstandardized coefficient beta weights and the standardized beta weights of each
predictive variable. In addition an R square was used to examine the relationships
between the various predictive variables and the dependent variable.
Recommendations for Future Research
The following recommendations for further research can be made based on the
findings from this research study.
1. This study was limited to school districts that fell in the categorical District Factor
Grouping (DFG) of A-CD based on my interest. Perhaps future research could examine
all of the 549 school districts in New Jersey to see if superintendent tenure, longevity,
and colitinuity have significant impacts on student achievement regardless of socio-
economics as opposed to just the 161 districts that were analyzed in the A-CD schools.
2. Further research should examine the impact of superintendent tenure, longevity,
and continuity on the 2008-2009 third grade New Jersey Assessment of Skills and
Knowledge in mathematics. As with the present research the examination should use the
same 2008-2009 data. It would be interesting to see if superintendent tenure has a more
significant impact on mathematics, than it did on language arts. A comparison between
the results of such a study with those of the present study could be done and the results
shared with all the districts in the A-CD DFG's.

3. The leadership responsibilities identified by Marzano and Waters (2009) on
district level leadership issues matters, emphasizes effective superintendents focus their
efforts on creating goal oriented districts which include the following: collaborative goal-
setting, non-negotiable goals for achievement and instruction, board alignment and
support of district goals, monitoring goals for achievement and instruction, using
resources to support achievement and instruction goals, correlating superintendent tenure
positively with student achievement, and defining administrative district level autonomy
in increasing student academic achievement.
4. It is recommended that future research include a longitudinal study of the impact
the length of a superintendent's tenure, longevity, and continuity have on a school district
in significantly impacting student academic achievement on the 2008-2009 3rd grade New
Jersey Assessment of Skills and Knowledge for language arts. In conducting a
longitudinal study significant patterns should emerge over a period of time. By
conducting a longitudinal study many smaller factors that influenced this study would be
minimized greatly thus causing far less negative impact on the overall data.
5. It would be of great interest to further disaggregate the collected New Jersey
School Report Card and Data Universe data to compare how different predictive
variables could influence student academic achievement on the 2008-2009 New Jersey
Assessment of Skills and Knowledge in grade 3 language arts.
6. It is recommended that future research look at superintendent behaviors and
attitudes as they impact student achievement on the third grade New Jersey Assessment
of Skills and Knowledge in language arts. The proposed study could focus on the day to

day operations of superintendents. This study could be conducted over the course of a
year and could add to this studies existing data.
7. The last recommendation for further research would be to examine the
relationship and impact school boards have with superintendents that influence student
academic achievement on the 2008-2009 3'd Grade New Jersey Assessment of Skills and
Knowledge in language arts, School boards ultimately determine a superintendent's
tenure in the district, their longevity in the district, and their continuity. Maintaining the
right district level leader of superintendent is critical in our educational system as we go
forward and this would make for a phenomenal future research study.
Conclusion
Since the inception of the superintendency in the 1640's by the pilgrims, the role
of the superintendency has faced constant change and evolution. The superintendent in
today's modern era is measured by standards of accountability that have never been seen
before in history due to the No Child Left Behind Act of 2001. The fact that 100% of all
students have to make Adequate Yearly Progress (AYP) to be proficient or better by 20 14
has put an increased pressure on the position of superintendent. The superintendent's
role started off as "the teachers and this was the beginning of the superintendent as an
instructional leader" (Sharp & Walters, 1997, p. 39). I feel that with the increased
pressures of accountability the superintendnecy has become more of a jack of all trades
manager than an instructional leader (teacher).
In looking at the literature pertaining to the superintendency in American
education, little research has been done to examine the superintendent's impact on
student academic achievement. It is to this end that I conducted a non-experimental,

explanatory, cross sectional design, that used a simultaneous backward multiple
regression analysis to measure the relationship of the eight predictive variables (district
students eligible for free lunch, district student attendance, educational experience in
New Jersey, student limited English proficiency (LEP), total experience in education,
experience in superintendent in district, total district student population, and students
eligible for reduced lunch) to the dependent variable (student achievement). By
examining the role a superintendent's tenure, longevity, and continuity has on student
academic achievement, as evidenced by the 2008-2009 grade 3 New Jersey Assessment
of Skills and Knowledge in language arts for students in the DFG of A-CD, greater
strides could be made in making sure that no child is left behind when it comes to
attaining AYP and achieving a status of proficient or better.
Although a great deal of research has been conducted on the impact the classroom
teacher and the building administrator has on student academic achievement that has not
been the case with superintendents. In examining the literature, most studies have
focused on the stress and changes related to the position of superintendent, high turnover
rates associated with the superintendency, and perceptions of the expected characteristics
of the superintendent. To this point, the research examining the impact the
superintendent has on student academic achievement has mainly related to the
superintendent's ability to promote and support quality building level instructional
leaders (Cudeiro, 2005) and has shown that it is important that the superintendent acts in
a responsive manner that includes employing a "comprehensive goal-setting process to
develop board-adopted non-negotiable goals for achievement" (Waters & Marzano, 2007,
p. 4). It is to this end that 1 chose to focus on the present study, to examine the

relationship between the length of tenure of the superintendent and student academic
achievement.
The results of this quantitiative study using the backward method of simultaneous
multiple regression, confirmed that the remaining three predictive variables used to
produce the model summary did account for 29.9% of the variance of the dependent
variable, the percentage of students who scored "Proficient" or better on the 2008-2009
grade New Jersey Assessment of Skills and Knowledge in language arts. While this
model accounted for less than 30% of the variance of the dependent variable, meaning
that over 70% of the variance of the dependent variable is attributed to other factors, this
study does reveal that the superintendency does play a part in student academic
achievement, specifically those students who are Eligible for Free Lunch, the
Superintendents Experience in New Jersey and Student Attendance. This information is
important as the focus on individual student academic achievement will continue to be
emphasized in the next few years. It is essential to examine all contributing factors. In
looking at the research, one factor to examine is the overall role the superintendent plays
in impacting student academic achievement.
The results of the data in this study revealed that those students who are Eligible
for Free Lunch had the strongest relationship to the dependent variable, student
achievement on the 2008-2009 New Jersey Assessment of Skills and Knowledge in grade
3 language arts by scoring "Proficient" or better. In looking at the data, as the number of
students in a district were Eligible for Free Lunch declined, the percentage of students
who scored "Proficient" or better increased. Superintendent Experience in New Jersey
showed that the more experience a superintendent has in New Jersey, the greater the

increase in the number of students who scored "Proficient" or better on the 2008-2009
Grade 3 New Jersey Assessment of Skills and Knowledge in language arts. As the
student attendance rate increased, the students who scored proficient or better also
increased. An interesting discovery in this research is that even though students who
were Eligible for Free Lunch showed a lower percentage of students who scored
"Proficient" or better on the 2008-2009 Grade 3 New Jersey Assessment of Skills and
Knowledge in Language Arts, the student who were Eligible for Reduced Lunch did not
show a significant impact on the study. This may be because of the way New Jersey
dummy codes its classifications relative to other states. In most states Free and Reduced
Lunch are combined on their state report cards. In New Jersey they are separated into
those who receive Free Lunch and those who receive Reduced Lunch. The data also
showed that as districts have decreases in those who are on Reduced Lunch, they have
increases in students who score "Proficient" or better on the 2008-2009 third grade New
Jersey Assessment of Skills and Knowledge in Language Arts.
In conclusion it is interesting to note that only 29.9% ofthe variance in the
dependent variable, the percentage of students who scored "Proficient" or better on the
2008-2009 third grade New Jersey Assessment of Skills and Knowledge in Language
Arts assessment, should not be discounted as insignificant because the research that
examines the impact of the superintendent and district level leadership on student
achievement is severely lacking. It is important to remember that as the superintendency
changes and evolves, a superintendent's tenure, longevity, and continuity will impact the
overall academic achievement of the students in the district that he or she lead.

References
Abrams , L. M. (2004). Teachers' views on high-stakes testing: Implications for the
classroom. Tempe, AZ: Arizona State University, Education Policy Research
Unit.
Adelman, C. (2006). The toolbox revisited: Paths to degree conzpletion from high school
through college. Washington, DC: US. Department of Education , Office of
Vocational and Adult Education.
American Association of School Administrators, (ASSA). (1 994). Roles and
relationships: School board and superintendents. (Report No. EA 025907).
Arlington, VA. (ERIC Document Reproduction Service No. ED37465).
American Association of School Adminstrators (ASSA). (2007). (1 993). Pp. 1 1-1 2.
A nation at risk. (1 983). The imperative for educational rejbrrn. Vol. 26 issue 7 July
1983. Acm, New York, NY USA.
Berg, J.H. & Barnett, B.G. (1 998). The school district superintendent. Attention must
be paid.
Boote, D.N., & Beile, P. (2005). Scholars before researchers: On the centrality of the
dissertation literature review in research pmperation. Edzrcational Researcher,
(34)(6), 3-15.
Blumberg A,, & Rlumberg P. (1985). Motives andpowem of school board members.
Educational Administration Quarte~ly, (40) (5), 704-741.
Bredeson, P.V. (1 995). Szperinrendent 's roles in czrrricultrm development and
instructional leadership: instrzrcrional visionaries, collaborators, stpporters,
and delegators. (15)5, 1 -24.

Brower, R., & Balch, B. (2006). Transformation leadership and decision making in
schools. Thousand Oaks, CA: Convin Press.
Brown, T., Swenson, S., & Hertz., K. (2010). Identifiying the relative strength in
Glasser's 5 basic needs. ISLLC standard 1. NAESP 2009-201 0.
Brunner, C.C. (2002). Shifts in the discourse defining the superintendency: Historical
and current foundations of the position. In J. Murphy (Ed). The educationul
leadership challenge: Redejning leadership for the 21"' century (pp. 21 1-238).
Chicago: The University of Chicago Press.
Butts, R.F. & Cremin, L.A. (1 953). A history ofeducation in American cziltzire. New
York: Henry Holt Company.
Caldas, S.J. (1 993). Reexamination of input and process factor effects in public schools
achievement. The Jozirnal of Educational Research, 86(4), 206-2 14.
Callahan, R. (1966). The stperintendent of schools: An historical analysis. Unpublished
manuscript.
Campbell, R.P. (2001). Aspiring to the superintendency: Factors that influence the
decision. Dissertation Abstracts International, 62(08A), 2637.
Carter, G.R. & Cunningham, W.G. (1 997). The American school superintendent:
Leading in an age ofpreusures. San Francisco: Jossey-Bass.
Castallo, R., & Natalle, J. (2005). A climate of understanding: How one district's board
and superintendent put aside their differences and learned to work together as a
team. American School Board Journal, 192(6), 20-22.

Chance, E.W., & Capps, J.L. (1 992). Superintendent instability in small/rural schools:
The school boardperspective. (Report No. RC018665). Norman, OK: College of
Education. (ERIC Document Reproduction Service No. ED35012 1).
Clark, R.J. (2001). The Superintendent as a temporary school administrator. 58(4), pg.
40.
Coleman, J.S. Campbell, E.Q., Hobson, C.J. McPartland, J., Mood, A.M., Weinfeld, F.D.
& York, R.1. (1966). Equality of educational opportunity. Washington, DC: U.S.
Government Printing Office.
Cuban, L. (1998). Transforming the Frog into a Prince: Effective Schools Research,
Policy and Practice at the District Level. Harvard Educational Review, 54(2),
129-151.
Cudeiro, A. (2005). Leading Student Achievement. School Administrator, 62 (1 I), 16-19.
Data Universe. (2009). Retrieved from
ht[p:/@hp. a-pj?. condedstaf~details2.php?recordID= 125590.
Dossett, D., & Munoz, M.A. (2000). Educational refoi-in in the accountability era: The
impact ofprior achievement and socio-economic conditions on academic
performance. (ERIC Document Reproduction Services No. 468 491 .)
Department of Education Office of Student Achievement and Accountability. (201 0).
Field, A. (2009). Discovering statistic using SPSS (3rd ed.). London: SAGE Publications
Ltd.
Fleming, G. (2004). Leading from any chair. Principal Leadership, 4(9), 14-1 8.
Glass, T.E. Bjork, L., & Brunner, C.C. (2000) The study of the american school
superintendency, 2000. A look at the superintendent ofeducation in the new

millennium: American Association of School Administrators. Glass, T.E. (200 1 a).
Glass, T.E. (2001 a). Leadership: Superintendent crisis: A review by search consultants
(Issue paper No. 2). Denver, CO. Education Commission of the States.
Glass, T.E. (200 1 b). Superintendent leaders look at the superintendency, school boards,
and reform. (Report No. EA03 1887). Denver, CO. Education Commission of the
States. (ERIC Document Reproduction Service No. ED468335).
Goodlad, J.I. (1 997). In praise of education. New York: Teachers College Press.
Griffiths, D.E. (1 966). The school superintendent. New York: Center for Applied
Research in Education.
Helf, S., Cooke, N.L., & Flowers, C.P. (2008). Presenting schooljailure: Alternative
education for children and youth. Vol. 53, Isssue 2. pgs. 1 13- 128.
Hodges, B.S. (2005). Factors influencing qualified candidates' decisions not to pursue
the superintendency. Dissertation Abstracts International.
Houston, P. (2007, Mercht). State of the superintendency. American Association of
School Administrators: The Conference Daily, March 4,2007. 1-5.
Howley, A.,& Pendarvis, E. (2002). Attracting Principals to the Superintendency
Conditions that make a dzHerence to Principals. Education Policy Analysis
Archives, 1 O(43). Retrieved June 20,2005 from http://epaa.asu.edu/epaa/
vlOn43.html.
Ingels, S.L., Curtin, T.R., Owings, J.A., Kaufinan, P., Alt, M.N., & Chen, X. (2002).
Coming of age in the 1990s: The eighth-grade cluss of 1988 12 years Iuter.
Washington, DC: U.S. Department of Education, Office of Educational Research
and Improvement.

Jernigan, S. (1997). Dangerous expectations: Why a superintendent search often breeds
discontent and unsatisfying results [On-line]. The School Administrator, 2, 1-7.
Johnson, S.M. (1996). Leading to change: The challenge of the new superintendency.
San Francisco, California: Jossey-Bass, Inc., Publishers.
Johnson, B. (2001). Toward a new classification of nonexperiemental quantitative
research. Educational Researcher. (30)2,3 - 13.
Kowalski, T.J. (1 995). Keepers of thegame: Contemporary urban szperintendents.
Thousand Oaks, CA: Corwin
Kowalski, T.J. (1999). The school stperintendent: Theorypractice and cases.
Thousand Oaks, CA: Corwin.
Kowalski, T. (2006). The school stperintendent: Theorypractice and cases (2""d)
Thousand Oaks, CA: Sage Publications, Inc.
Krawthol, D., & Anderson, L. (2001). A taxonomy for learning, teaching, and assessing.
Canisius College Press. Buffalo, New York.
Lee, J., & Wong, K. (2004). The impact of accountability on racial and socioecomic
equity: considering both school resources and achievement outcomes. American
Educational Research Journal, 41 (4), 797-832.
Lober, 1.M. (1983). Promoting your school: A public relations handbook. Lancaster, PA:
Technomic.
Lunenberg, F. (1 992). The urban superintendent's role in school reform. Education
and Urban Society, 25 (1). 30-44.
Marland, S. (1 970). The changing nature of the school superintendency. Ptlblic
Administrative Review, 30(4), 365-37 1.

Marzano, R. J., Waters, T., & McNulty, B. A. (2005). School leadership that works:
from research to results. Aurora, CO: Mid-continent Regional Educational
Laboratory.
Marzano, R.J., & Waters, J. T. (2006). School District Leadership that Works: The Effect
of Superintendent Leadership on Student Achievement: A Working Paper. Denver,
CO. Mid-Continent Research for Education and Learning (McREL).
Marzano, R. J., & Waters, T. (2009). District leadership that works: striking the right
balance. Bloomington, IN: Mid-continent Research for Education and
Learning Laboratory.
Metzger, C. (1 997). Involuntary turnover of superintendents. Thrust for educational
leadership, 26(4) 20-22,44.
Mid-continent Research for Education and Learning (McREL). (2001). Leadership for
school improvement. Aurora, CO: Office of Educational Research and
Improvement, United States Department of Education,
New Jersey State Department of Education Adequate Yearly Progress. (2000). Trenton,
New Jersey. P.2.
New Jersey State Department of Education. (2009). NCLB State Report, 2009. Trenton,
New Jersey. New Jersey State Department of Education.
No child left behind. (2002). 20 U.S.C. 6301 et.seq.
Olivarez, R. (2008). The ten.functions o f a superintendent. Austin, TX: The University
of Texas.
Parker, P. (1 996). Superintendent vulnerability and mobility. Peabody Journal of
Edz~cation, 71 (2), 64-77.

Pedhazur, E. J. (1 997). Multiple regression assumptions. (ERIC Document Reproduction
Services No. ED470205.)
Plecki, M. (2006, October). Redefining and improving school district governance.
Washington, D.C: Center for the Study of Teaching and Policy.
Public Law 107-1 10, 107'~ Congress, 2002.
Roby, D.E. (2004). Research on school attendance and student achievement. A study of
Ohio schools. Educational Research Quarterly, 28(10, 3-1 4.
Rogers, T., Terranova, M., Volp, F. (2006). Snapshot of the superintendency VI: A study
of school superintendents in New York State, Albany, NY: New York State
Council of School Superintendents.
Sell, K.R. (2006). The true genius ofAmericct at risk are we losing otu.public universities
to de fltcto privatization? Westport, CT: Praeger.
Sharp, W.L. & Walters, J.K. (1 997). The school superintendent: Theprofession and the
person. Pittsburg, Pennsylvania: Technomic.
Sheldon, S.B. (2007). Improving student attendance with school, family, and community
partnerships. The Journal of Education Research, 100(5), 267-275.
Shields, B. A. (2002). A review of the literature on administrator turnover: Why they
move on or are displaced. (Report No. EA03 1640). Arnherst, NY: Daemen
College Department of Education (ERIC Document Reproduction Service No.
ED464404).
Shook, S.A. (2000). The superintendent and leadership: A collective case study.
Unpublished Ed. D., The University of Texas at El Paso, United States - Texas.

Slaten, B.A. (2002). A review of the literature on administrative turnover: Why they move
on or are displaced. (Report No. EA03 1640). Amherst, NY: Daemen College
Department of Education (ERIC Document Reproduction Service No.
ED464404).
Smith, J. (2006). Examining the long-term impact of achievement loss during the
transition to high school. The Journal of Seconda~y Gifted Education. 17(4), 2 1 1 -
221.
Spillane, J.P., & Louis, K.S. (2002). School improvement processes and practices:
Professional learning for building instructional capacity. In J. Murphy (Ed.),
The educational leadership challenge: Red&ing Leadership for the 21''
Century (pp. 83 - 1 04). Chicago: University of Chicago Press.
Spring, J.H. (1994). The American school, 1642-1 993 (3rd ed.). New York: McGraw
Hill.
SPSS Version 19.0 Brief Guide. (2010). IBM SPSS Brief Guide To Data Analysis. Rel.
11.01.201 0. Chicago, ILL. SPSS Inc.
Suskie, L.A. (1996). Questionnaire survey research that works. Tallahassee, Fl.:
Association for Institutional Research.
Taylor, F.W. (191 1). The principles of scientific management. New York and London:
Harper & Brothers Publishers.
Tienken. C.H. (2008a). A descriptive study of the technical characteristics of the results
from New Jersey's Assessments of Skills and Knowledge in grades 3,4, and 8.
New Jersey Jozrrnal of Szpervision. Cz~rricthrn Development 2,46-61.
Townley, A. (1992). An introduction to school administration. Dubuque, IA: Kendall
Hunt.
United States Department of Education, (2002). No child lefr behind act. p. 5.
Walker, E. (20 1 1). Intermediate Statistics. South Orange, New Jersey.
Walker, R. (1987, March 2). Bennett: "Test gains at a "dead stall." Education Week,
7(23), 5.
West M.R., & Peterson, P.E. (2003). The efrcacy of school threats within school
accountability systems, ReszdtsJi-om legislatively induced rxperiments. PEPG
05-01.
Wikipedia. (201 1). Multiple regression analysis: Multicollinearity. Wikimedia
foundation. April 28,20 1 1.
Witte, R.S., & Witte, J.S. (2007). Statistics. John Wiley and Sons, Inc. Hoboken, NJ.
Yee. G., & Cuban, L. (1996). When is tenure long enough? A historical analysis of
superintendent turnover and tenure in urban school districts. Educational
Administration Quarterly, 32,615-641.

2009 ASK Uads 3 %ale Swnmary 10~012009

Copy ol stale-summery DFG ZWB Glade 3 Wotal and lnstrudimsl Gmups) 13


2009 ASK Gmde 9 Slate Summay 10R012009
Copy of siate-wmm~ry OFGZWB Qmde 3 (Tololand lnslnrclbnal Gmpa) 37

Copy of stab-8ummsy DFG 2009 Grad0 3 Clotel and InW~dimel Grwp8) 49

2003 ASKGnda 3 Slam Summary 101012008
Copy orthla-summary LIFO 2009 Orada 3 (Tolill and InhrtLlonal Omup.) e l

2009 ASK Grsda 3 SUle Summary 1ononDG9
Copy of sble_rummsry DFG 2009 Glilde 3 flolol and InslruUbnal Omup*) 73


2W0 ASK GRdo 3 W e Summary 1012w2008
copy of w - a u m r n a ~ DPG 2008 Gmde 3 (Tofa m a In#rudbal Grmps) 108

Copy of 8tate_nrmrnmy DFG 2009 &ads 3 flolnl and lnmlonnl Gmupa)


2009 ASK Grnda 3 Slsra Summay 1012012009


![LINEAR REGRESSION CHAP 7...LINEAR REGRESSION CHAP 7 AP Statistics 1 The object [of statistics] is to discover methods of condensing information concerning large groups of allied facts](https://img.pdfslide.net/doc/110x75/604f45549079573162360e4f/linear-regression-chap-7-linear-regression-chap-7-ap-statistics-1-the-object.jpg)