Embed Size (px)
Citation preview
A Multivariate Copula Based Macro-level Crash Count Model
Shamsunnahar Yasmin
Department of Civil, Environmental & Construction Engineering
University of Central Florida
Email: [email protected]
Salah Uddin Momtaz
Department of Civil, Environmental & Construction Engineering
University of Central Florida
Email: [email protected]
Tammam Nashad
Department of Civil, Environmental & Construction Engineering
University of Central Florida
Email: [email protected]
Naveen Eluru*
Associate Professor
Department of Civil, Environmental & Construction Engineering
University of Central Florida
Tel: 407-823-4815, Fax: 407-823-3315
Email: [email protected]
November 2017
*Corresponding author 1
2
97th Annual Meeting of the Transportation Research Board, 2018, Washington DC 3 4
Submitted to: Standing Committee on Statistical Method (ABJ80) committee for presentation 5
and publication 6 7
Word count: 135 abstract + 5394 texts + 1219 references+ 3 tables + 0 figures = 7498 equivalent 8
words 9
Yasmin, Momtaz, Nashad and Eluru 2
ABSTRACT 1
The current study contributes to safety literature both methodologically and empirically by 2
developing a macro-level multivariate copula-based crash frequency model for crash counts. The 3
multivariate model accommodates for the impact of observed and unobserved effects on zonal 4
level crash counts of different road user groups including car, light truck, van, other motorized 5
vehicle (including truck, bus and other vehicles) and non-motorist (including pedestrian and 6
bicyclist). The proposed model is estimated using Statewide Traffic Analysis Zone (STAZ) level 7
road traffic crash data for the state of Florida. A host of variable groups including land-use 8
characteristics, roadway attributes, traffic characteristics, socioeconomic characteristics and 9
demographic characteristics are considered. The model estimation results illustrate the 10
applicability of the proposed framework for multivariate crash counts. Model estimation results 11
are further augmented by evaluation of predictive performance and policy analysis. 12
Yasmin, Momtaz, Nashad and Eluru 3
BACKGROUND 1 2
Road traffic crashes affect the society as a whole both emotionally and economically and are 3
rightfully recognized as a national health problem (1; 2). In reducing the undue burden of road 4
crashes and their consequences, road safety literature is focused on devising both proactive and 5
reactive safety management policies at the user, system and/or planning level through evidence-6
based and data-driven strategies. Crash frequency analysis, specifically macro-level crash models, 7
is a major component for devising and evaluating these road safety policies at a planning level. 8
Macro-level studies have mostly evolved in safety research to incorporate safety considerations 9
within the transportation planning process. The outcome of these models is also useful to devise 10
safety-conscious decision support tools to facilitate a proactive approach in assessing medium and 11
long-term policy based countermeasures. The current research effort contributes to the safety 12
literature methodologically and empirically with specific focus on macro-level crash frequency 13
analysis. 14
Econometric approaches of developing crash prediction models in safety literature are 15
dominated by traditional count regression frameworks (Poisson and negative binomial (NB) 16
models) in univariate modeling systems (see (3-5)). These studies identify a single count variable 17
for different crash attribute levels (road user group, crash severity, crash types, or vehicles types) 18
for a spatial unit and study the impact of exogenous variables. However, as documented in 19
literature, crash counts across different attribute levels are likely to be dependent for the same 20
observation resulting in a multivariate crash event set (6). Ignoring such correlation, if present, 21
may lead to biased and inefficient parameter estimates resulting in erroneous policy implications 22
(7; 8). To that extent, road safety researchers and analysts have estimated multivariate count 23
models to produce more accurate predictions (see (9) for a detailed list of these studies). 24
It is beyond the scope of this paper to provide a comprehensive literature review on 25
multivariate crash count models. For a detailed review of multivariate frameworks employed in 26
safety, the reader is referred to recent review studies (3; 10; 11). Within the multivariate scheme, 27
studies have predominantly explored crash counts by severity outcome levels and by crash types. 28
However, multivariate crash event set may also arise when examining crash occurrences by 29
different road user groups involved in crashes. In fact, studies have recognized this and developed 30
multivariate crash count models for different road user groups involved in crashes – for pedestrian 31
and bicyclists (12; 13), for vehicle types (14), for travel modes (15). 32
In these studies, the general trend is to focus entirely either on motorized road user group 33
or on non-motorized road users (except (15)). However, both of these road user groups share the 34
same travel environment within a spatial planning unit over a specific given period of time. 35
Therefore, it is possible that the same set of observed and unobserved factors influence crash 36
occurrences of these two different road user groups. For instance, higher number of uncontrolled 37
intersections (usually observed to analysts) at a zonal level are likely to result in higher number of 38
vehicular conflicts as well as higher number of pedestrian/bicyclists involved crashes. At the same 39
time, if a zone has higher proportion of blind spots at intersections (usually unobserved to analyst) 40
it may contribute to higher crash events involving both motorists and non-motorists. Therefore, it 41
is important to examine crash events as a joint process considering both of these road user groups 42
simultaneously. Further, while analyzing motorized road user groups, recognizing the implicit 43
differences between various motorized vehicle groups is very useful. It is plausible that different 44
exogenous variables may have distinct impact on crash occurrence across various motorized road 45
user groups. For instance, zones with higher truck volumes may have higher number of crashes 46
Yasmin, Momtaz, Nashad and Eluru 4
involving heavy vehicles. Moreover, it is also important to examine separate risk factors related to 1
different types of passenger vehicles rather than considering all passenger vehicles as one category. 2
As documented in literature, the diversity in passenger vehicle fleet has deteriorating effects on 3
overall safety (16). In the United States, the sales of light truck has in fact increased 7% in 2016 4
relative to 2015 (17). The shift from light to heavy passenger vehicles are likely to result in 4.3 5
additional crashes (for each fatal crash that occupants of large passenger vehicles avoid) that may 6
result in fatalities among occupants of light vehicles or non-motorists involved in crashes with 7
these heavy passenger vehicles (18). 8
Given the potential difference in safety impacts of different types of passenger vehicles, it 9
is important to examine separate risk factors for different types of passenger vehicles, which would 10
allow us to devise more tangible actions and policies. The first contribution of our study is to 11
develop multivariate crash count model for crashes involving different road user groups involved 12
in crashes with higher resolution classification of passenger vehicle fleet. Specifically, we examine 13
zonal level car, light truck, van, other motorized vehicles (bus, truck and other vehicles) and non-14
motorist (pedestrian and bicyclist) involved crash counts in a multivariate count model framework. 15
Traditionally, in existing safety literature, the multivariate count models are examined by 16
considering unobserved error components that jointly affect the dependent variables. In particular, 17
the traditional multivariate count modeling approaches partition the error components of the 18
dependent variables to accommodate for a common term and an independent term across 19
dependent variables (see (6) for a detailed discussion of various methodologies). Thus, any 20
probability computation, in accommodating such unobserved effect, requires integrating the 21
probability function over the error term distribution. The exact computation is dependent on the 22
distributional assumption and does not have a closed form expression usually. Thus, the estimation 23
procedure requires the adoption of maximum simulated likelihood (MSL) approach in the classical 24
approach or Markov Chain Monte Carlo (MCMC) approach in the Bayesian realm. MSL and 25
MCMC methods provide substantial flexibility in accommodating for unobserved heterogeneity. 26
However, the probability evaluation with high dimensional integrals is affected by the challenges 27
in generating high dimensionality of random numbers and longer computational run times. The 28
process of applying simulation for such joint processes is likely to be error-prone and the stability 29
of the variance-covariance matrix is often sensitive to model specification and number of 30
simulation draws (see (19) for a discussion). Within this simulated framework, the model 31
structures employed in developing multivariate crash count model include multivariate-Poisson, 32
multivariate Poisson-lognormal, multivariate random-parameters zero-inflated negative binomial, 33
multinomial-generalized Poisson, multivariate conditional autoregressive, multivariate tobit and 34
multivariate Poisson gamma mixture count models. Another multivariate count modeling 35
approach based on the development of multivariate function has most recently been employed by 36
Narayanamoorthy et al. (20). The approach circumvents the challenges associated with simulation 37
by adopting analytical approximation of the likelihood function. 38
More recently, a closed form parametric formulation that obviates the need for an 39
approximation or demanding simulation has been employed in existing econometric literature for 40
examining joint count events. The approach, referred to as copula-based approach, allows for 41
flexible correlation structures across joint dimensions thus enhancing the flexibility of the 42
multivariate approach. The copula-based approach allows for analytical computation of log-43
likelihood based on standard maximum likelihood procedure; it is generally tractable and offers 44
stable inference. The copula formulation allows for additional flexibility in specifying the marginal 45
distribution. While the application of copula has seen a surge of interest in examining multivariate 46
Yasmin, Momtaz, Nashad and Eluru 5
continuous and disaggregate discrete data, the studies employing copulas for examining aggregate 1
level count events are relatively few (for application of copulas in continuous and disaggregate 2
level discrete data see (21-24)). Copula based bivariate count model has been employed in 3
econometrics and applied statistics (25; 26). To date, only one study in safety literature has 4
employed bivariate copula count model in examining pedestrian and bicycle crash risks 5
simultaneously (12). 6
The current study generalizes the bivariate copula count model for examining multivariate 7
count data. Specifically, we formulate and estimate a multivariate copula count model for 8
examining zonal level crash counts by different road user groups involved in crashes. To be sure, 9
the application of multivariate copula count model has been demonstrated by Nikoloulopoulos and 10
Karlis (27) in examining the correlation among the number of purchases of four different products 11
(food, non-food, hygiene and fresh). In current study context, we employ multivariate copula count 12
model for examining five different crash count dimensions – car, light truck, van, other motorized 13
vehicle and non-motorists involved crashes. The second contribution of our study is to develop a 14
closed form multivariate copula count model to accommodate for the impact of observed and 15
unobserved effects on zonal level crash counts of different road user groups. For examining the 16
count components of the multivariate copula-based model, we employ negative binomial (NB) 17
regression framework. The NB model that has a built-in dispersion parameter is widely employed 18
in safety literature. It provides a natural enhancement over the Poisson model and is easy to 19
estimate with a closed form structure to accommodate for over-dispersion (the variance of the 20
crash count variable usually exceeds the mean of the crash count variable). In existing safety 21
literature, researchers have also employed count modeling frameworks accommodating the 22
preponderance of zero count events (such as zero-inflated and hurdle models). However, NB is the 23
most frequently used statistical technique for examining crash count events (10). Therefore, in our 24
current study, we examine crash count within the proposed multivariate copula-based approach by 25
using NB regression framework. The proposed model is estimated using Statewide Traffic 26
Analysis Zone (STAZ) level road crash data for the state of Florida. A host of variable groups 27
including – land-use characteristics, roadway attributes, traffic characteristics, socioeconomic 28
characteristics and demographic characteristics are considered. 29
In summary, the current research effort contributes to safety literature on macro-level crash 30
count analysis both methodologically and empirically. In terms of methodology, we formulate and 31
estimate a multivariate copula-based count model framework to analyze the crash count events for 32
different road user groups involved in crashes jointly, and we employ NB regression framework 33
for examining the count components. The proposed multivariate copula count model can be 34
employed in developing both macro and micro-level count events. In terms of empirical analysis, 35
our study incorporates crash counts for both motorized and non-motorized road user groups while 36
considering different types of passenger vehicles fleet categories. Specifically, we examine crash 37
counts for car, light truck, van, other motorized vehicle and non-motorist involved crashes by 38
employing multivariate copula count framework. Model estimation results are further augmented 39
by evaluation of predictive performance and policy analysis. 40
41
ECONOMETRIC FRAMEWORK 42 43
The focus of our study is to propose and estimate a copula-based multivariate NB modeling 44
framework (see (22; 28) for a detailed background on copula-based models and see (27) for a 45
Yasmin, Momtaz, Nashad and Eluru 6
description of multivariate NB framework). The econometric framework for the joint model is 1
presented in this section. 2
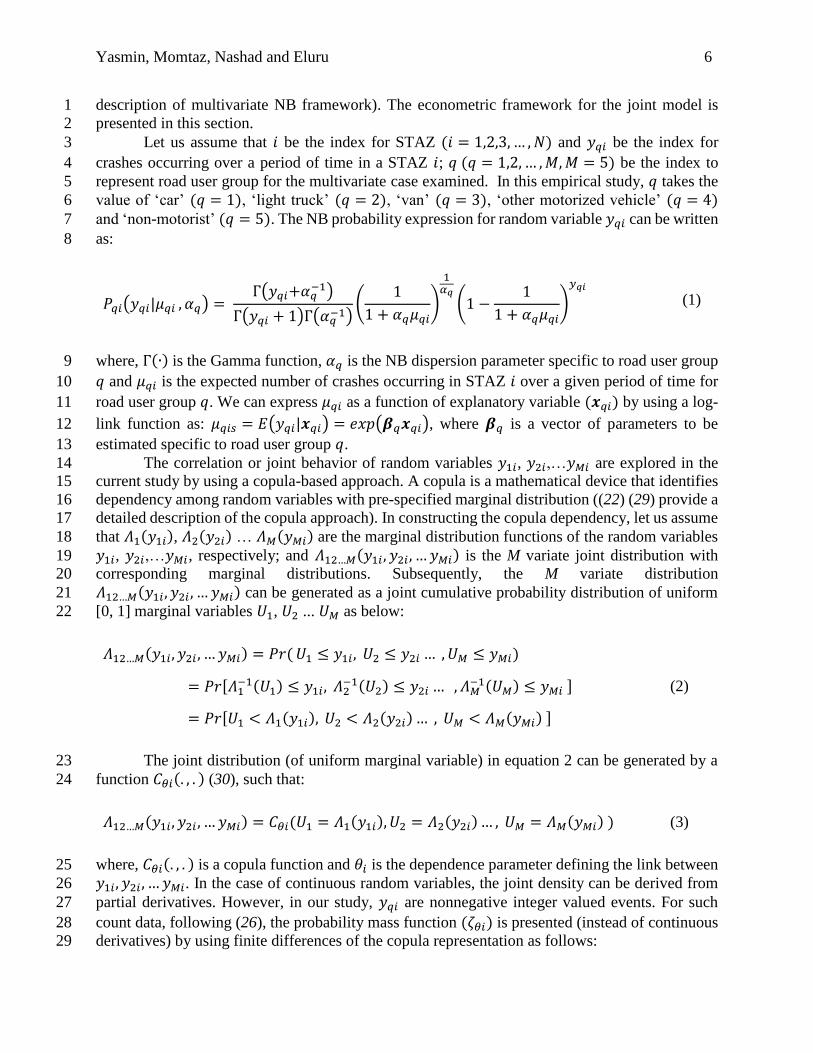
Let us assume that 𝑖 be the index for STAZ (𝑖 = 1,2,3, … , 𝑁) and 𝑦𝑞𝑖 be the index for 3
crashes occurring over a period of time in a STAZ 𝑖; 𝑞 (𝑞 = 1,2, … , 𝑀, 𝑀 = 5) be the index to 4
represent road user group for the multivariate case examined. In this empirical study, 𝑞 takes the 5
value of ‘car’ (𝑞 = 1), ‘light truck’ (𝑞 = 2), ‘van’ (𝑞 = 3), ‘other motorized vehicle’ (𝑞 = 4) 6
and ‘non-motorist’ (𝑞 = 5). The NB probability expression for random variable 𝑦𝑞𝑖 can be written 7
as: 8
𝑃𝑞𝑖(𝑦𝑞𝑖|𝜇𝑞𝑖 , 𝛼𝑞) = Γ(𝑦𝑞𝑖+𝛼𝑞
−1)
Γ(𝑦𝑞𝑖 + 1)Γ(𝛼𝑞−1)
(1
1 + 𝛼𝑞𝜇𝑞𝑖)
1𝛼𝑞
(1 −1
1 + 𝛼𝑞𝜇𝑞𝑖)
𝑦𝑞𝑖
(1)
where, Γ(∙) is the Gamma function, 𝛼𝑞 is the NB dispersion parameter specific to road user group 9
𝑞 and 𝜇𝑞𝑖 is the expected number of crashes occurring in STAZ 𝑖 over a given period of time for 10
road user group 𝑞. We can express 𝜇𝑞𝑖 as a function of explanatory variable (𝒙𝑞𝑖) by using a log-11
link function as: 𝜇𝑞𝑖𝑠 = 𝐸(𝑦𝑞𝑖|𝒙𝑞𝑖) = 𝑒𝑥𝑝(𝜷𝑞𝒙𝑞𝑖), where 𝜷𝑞 is a vector of parameters to be 12
estimated specific to road user group 𝑞. 13
The correlation or joint behavior of random variables 𝑦1𝑖, 𝑦2𝑖,…𝑦𝑀𝑖 are explored in the 14
current study by using a copula-based approach. A copula is a mathematical device that identifies 15
dependency among random variables with pre-specified marginal distribution ((22) (29) provide a 16
detailed description of the copula approach). In constructing the copula dependency, let us assume 17
that 𝛬1(𝑦1𝑖), 𝛬2(𝑦2𝑖) … 𝛬𝑀(𝑦𝑀𝑖) are the marginal distribution functions of the random variables 18
𝑦1𝑖, 𝑦2𝑖,…𝑦𝑀𝑖, respectively; and 𝛬12…𝑀(𝑦1𝑖, 𝑦2𝑖, … 𝑦𝑀𝑖) is the M variate joint distribution with 19
corresponding marginal distributions. Subsequently, the M variate distribution 20
𝛬12…𝑀(𝑦1𝑖, 𝑦2𝑖 , … 𝑦𝑀𝑖) can be generated as a joint cumulative probability distribution of uniform 21
[0, 1] marginal variables 𝑈1, 𝑈2 ... 𝑈𝑀 as below: 22
𝛬12…𝑀(𝑦1𝑖, 𝑦2𝑖 , … 𝑦𝑀𝑖) = 𝑃𝑟( 𝑈1 ≤ 𝑦1𝑖, 𝑈2 ≤ 𝑦2𝑖 … , 𝑈𝑀 ≤ 𝑦𝑀𝑖)
= 𝑃𝑟[𝛬1−1(𝑈1) ≤ 𝑦1𝑖, 𝛬2
−1(𝑈2) ≤ 𝑦2𝑖 … , 𝛬𝑀−1(𝑈𝑀) ≤ 𝑦𝑀𝑖 ]
= 𝑃𝑟[𝑈1 < 𝛬1(𝑦1𝑖), 𝑈2 < 𝛬2(𝑦2𝑖) … , 𝑈𝑀 < 𝛬𝑀(𝑦𝑀𝑖) ]
(2)
The joint distribution (of uniform marginal variable) in equation 2 can be generated by a 23
function 𝐶𝜃𝑖(. , . ) (30), such that: 24
𝛬12…𝑀(𝑦1𝑖, 𝑦2𝑖 , … 𝑦𝑀𝑖) = 𝐶𝜃𝑖(𝑈1 = 𝛬1(𝑦1𝑖), 𝑈2 = 𝛬2(𝑦2𝑖) … , 𝑈𝑀 = 𝛬𝑀(𝑦𝑀𝑖) ) (3)
where, 𝐶𝜃𝑖(. , . ) is a copula function and 𝜃𝑖 is the dependence parameter defining the link between 25
𝑦1𝑖, 𝑦2𝑖 , … 𝑦𝑀𝑖. In the case of continuous random variables, the joint density can be derived from 26
partial derivatives. However, in our study, 𝑦𝑞𝑖 are nonnegative integer valued events. For such 27
count data, following (26), the probability mass function (𝜁𝜃𝑖) is presented (instead of continuous 28
derivatives) by using finite differences of the copula representation as follows: 29
Yasmin, Momtaz, Nashad and Eluru 7
𝜁𝜃𝑖(𝛬1(𝑦1𝑖), 𝛬2(𝑦2𝑖) … 𝛬𝑀(𝑦𝑀𝑖))
= ∑ ∑ … ∑ (−1)𝑎1+𝑎2+... 𝑎𝑀
2
𝑎𝑀=1
2
𝑎2=1
2
𝑎1=1[𝐶𝜃𝑖(𝛬1(𝑦1𝑖 + 𝑎1 − 2), 𝛬2(𝑦2𝑖
+ 𝑎2 − 2) … 𝛬𝑀(𝑦𝑀𝑖 + 𝑎𝑀 − 2) ; 𝜃𝑖)]
(4)
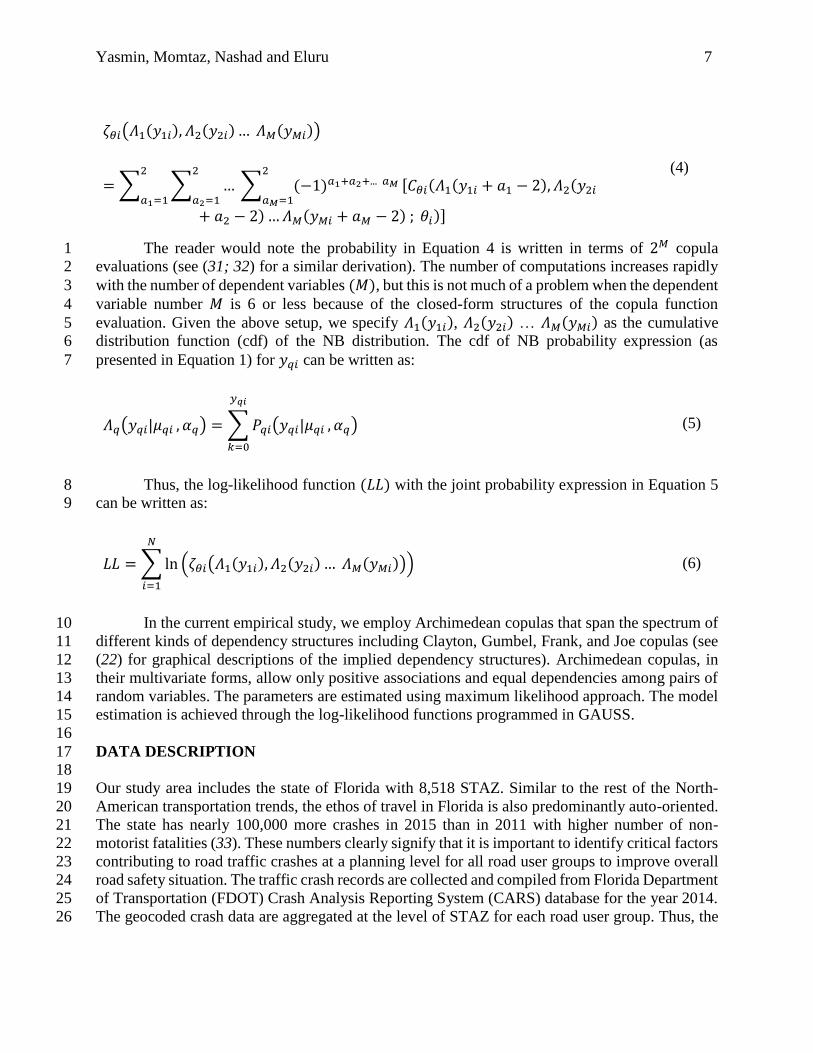
The reader would note the probability in Equation 4 is written in terms of 2𝑀 copula 1
evaluations (see (31; 32) for a similar derivation). The number of computations increases rapidly 2
with the number of dependent variables (𝑀), but this is not much of a problem when the dependent 3
variable number 𝑀 is 6 or less because of the closed-form structures of the copula function 4
evaluation. Given the above setup, we specify 𝛬1(𝑦1𝑖), 𝛬2(𝑦2𝑖) … 𝛬𝑀(𝑦𝑀𝑖) as the cumulative 5
distribution function (cdf) of the NB distribution. The cdf of NB probability expression (as 6
presented in Equation 1) for 𝑦𝑞𝑖 can be written as: 7
𝛬𝑞(𝑦𝑞𝑖|𝜇𝑞𝑖 , 𝛼𝑞) = ∑ 𝑃𝑞𝑖(𝑦𝑞𝑖|𝜇𝑞𝑖 , 𝛼𝑞)
𝑦𝑞𝑖
𝑘=0
(5)
Thus, the log-likelihood function (𝐿𝐿) with the joint probability expression in Equation 5 8
can be written as: 9
𝐿𝐿 = ∑ ln (𝜁𝜃𝑖(𝛬1(𝑦1𝑖), 𝛬2(𝑦2𝑖) … 𝛬𝑀(𝑦𝑀𝑖)))
𝑁
𝑖=1
(6)
In the current empirical study, we employ Archimedean copulas that span the spectrum of 10
different kinds of dependency structures including Clayton, Gumbel, Frank, and Joe copulas (see 11
(22) for graphical descriptions of the implied dependency structures). Archimedean copulas, in 12
their multivariate forms, allow only positive associations and equal dependencies among pairs of 13
random variables. The parameters are estimated using maximum likelihood approach. The model 14
estimation is achieved through the log-likelihood functions programmed in GAUSS. 15
16
DATA DESCRIPTION 17 18
Our study area includes the state of Florida with 8,518 STAZ. Similar to the rest of the North-19
American transportation trends, the ethos of travel in Florida is also predominantly auto-oriented. 20
The state has nearly 100,000 more crashes in 2015 than in 2011 with higher number of non-21
motorist fatalities (33). These numbers clearly signify that it is important to identify critical factors 22
contributing to road traffic crashes at a planning level for all road user groups to improve overall 23
road safety situation. The traffic crash records are collected and compiled from Florida Department 24
of Transportation (FDOT) Crash Analysis Reporting System (CARS) database for the year 2014. 25
The geocoded crash data are aggregated at the level of STAZ for each road user group. Thus, the 26
Yasmin, Momtaz, Nashad and Eluru 8
dependent variable of the empirical study is zonal level number of crash counts involving car, light 1
truck, van, other motorized vehicles and non-motorist. 2
In addition to the crash database, the explanatory attributes considered in the empirical 3
study are also aggregated at the STAZ level. The selected explanatory variables can be grouped 4
into five broad categories: land-use characteristics, roadway attributes, traffic characteristics, 5
socioeconomic characteristics and demographic characteristics. These variables are collected and 6
compiled from different data sources including: 2010 US census data, 2009-2013 American 7
Community Survey (ACS), Florida Geographic Data Library (FDGL) databases. Land-use 8
characteristics included shopping centers, restaurants, park/recreational centers and proportion of 9
urban area. Roadway attributes included proportion of local roads and proportion of major roads 10
length. Traffic characteristics included annual average daily traffic (AADT) and truck AADT. 11
Socioeconomic characteristics included proportion of industrial jobs, proportion of retail jobs, 12
proportion of households with no vehicle and proportion of households with one vehicle. Finally, 13
Demographic characteristics included proportion of Hispanic population and proportion of 14
Caucasian population. 15
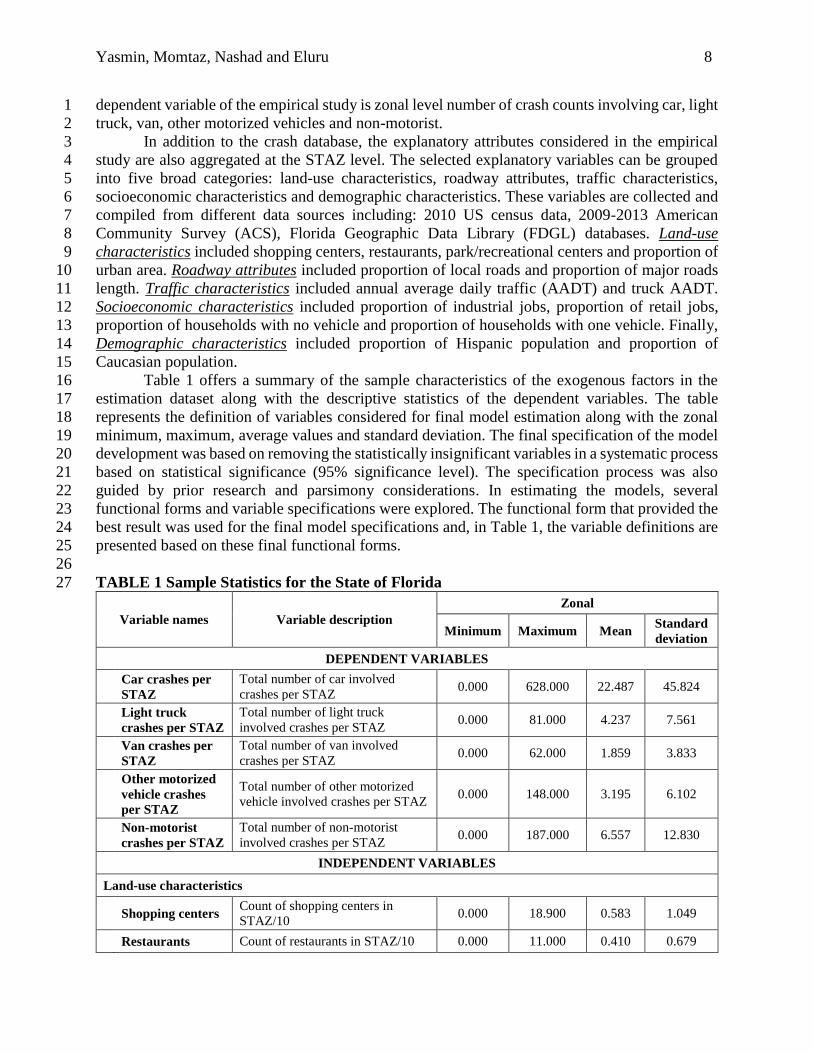
Table 1 offers a summary of the sample characteristics of the exogenous factors in the 16
estimation dataset along with the descriptive statistics of the dependent variables. The table 17
represents the definition of variables considered for final model estimation along with the zonal 18
minimum, maximum, average values and standard deviation. The final specification of the model 19
development was based on removing the statistically insignificant variables in a systematic process 20
based on statistical significance (95% significance level). The specification process was also 21
guided by prior research and parsimony considerations. In estimating the models, several 22
functional forms and variable specifications were explored. The functional form that provided the 23
best result was used for the final model specifications and, in Table 1, the variable definitions are 24
presented based on these final functional forms. 25
26
TABLE 1 Sample Statistics for the State of Florida 27
Variable names Variable description
Zonal
Minimum Maximum Mean Standard
deviation
DEPENDENT VARIABLES
Car crashes per
STAZ
Total number of car involved
crashes per STAZ 0.000 628.000 22.487 45.824
Light truck
crashes per STAZ
Total number of light truck
involved crashes per STAZ 0.000 81.000 4.237 7.561
Van crashes per
STAZ
Total number of van involved
crashes per STAZ 0.000 62.000 1.859 3.833
Other motorized
vehicle crashes
per STAZ
Total number of other motorized
vehicle involved crashes per STAZ 0.000 148.000 3.195 6.102
Non-motorist
crashes per STAZ
Total number of non-motorist
involved crashes per STAZ 0.000 187.000 6.557 12.830
INDEPENDENT VARIABLES
Land-use characteristics
Shopping centers Count of shopping centers in
STAZ/10 0.000 18.900 0.583 1.049
Restaurants Count of restaurants in STAZ/10 0.000 11.000 0.410 0.679
Yasmin, Momtaz, Nashad and Eluru 9
Park and
recreational
centers
Count of park and recreational
centers in STAZ/10 0.000 5.400 0.079 0.167
Proportion of
urban area
Total urban Area in STAZ/Total
area of STAZ 0.000 1.000 0.731 0.425
Roadway attributes
Proportion of
local roads
Length of local roads in
STAZ/Total length of roads in
STAZ
0.000 1.000 0.085 0.192
Proportion of
major roads
Length of major road in
STAZ/Total length of roads in
STAZ
0.000 1.000 0.544 0.371
Traffic characteristics
AADT Total annual average daily traffic
(AADT) of STAZ/100,000 0.000 6.044 0.721 0.732
Truck AADT Total truck AADT of
STAZ/100,000 0.000 0.611 0.028 0.044
Socioeconomic characteristics
Proportion of
industrial jobs
Total number of industrial jobs in
STAZ/Total number of jobs in
STAZ
0.000 1.000 0.506 0.484
Proportion of
retail jobs
Total number of retail jobs in
STAZ/Total number of jobs in
STAZ
0.000 1.000 0.276 0.277
Proportion of
households with
zero vehicle
Total number of households with
no vehicles in STAZ/Total number
of households in STAZ
0.000 1.000 0.094 0.111
Proportion of
households with
one vehicle
Total number of households with
one vehicle in STAZ/Total number
of households in STAZ
0.000 0.967 0.411 0.135
Demographic characteristics
Proportion of
Hispanic
population
Total number of Hispanic
population in STAZ/Total number
of population in STAZ
0.000 1.000 0.171 0.202
Proportion of
Caucasian
population
Total number of Caucasian
population in STAZ/Total number
of population in STAZ
0.000 1.000 0.621 0.278
1
EMPIRICAL ANALYSIS 2 3
Model Selection 4
5 The empirical analysis involves estimation of four different multivariate count models including: 6
1) Clayton, 2) Gumbel, 3) Frank, and 4) Joe copulas. We also estimate an independent copula 7
model (separate NB models for crash counts involving different road user groups) to establish a 8
benchmark for comparison. A comparison exercise is undertaken to identify the most suitable 9
copula model (including the independent copula model). The alternative copula models estimated 10
are non-nested and hence cannot be tested using traditional log-likelihood ratio test. We employ 11
the Bayesian Information Criterion (BIC) to determine the best model among all copula models 12

Yasmin, Momtaz, Nashad and Eluru 10
(12; 21; 29; 32). The model with the lower BIC is the preferred copula model. The BIC value for 1
independent copula model is 192617.83. The BIC values for the estimated multivariate copula 2
models are: Clayton - 166929.78, Gumbel - 165722.37, Frank - 167869.31, and Joe - 167572.03. 3
From the BIC values, we can see that the estimated copula models provide improved data fit 4
relative to independent model. However, copula model with Gumbel distribution outperforms all 5
other copula models. The BIC comparisons confirm the importance of accommodating 6
dependence among crash count events of different road user groups in the macro-level analysis. 7
8
Estimation Results 9 10
In presenting the effects of exogenous variables in the multivariate model specification, we will 11
restrict ourselves to the discussion of the Gumbel Copula specification. The estimation results of 12
the multivariate (Gumbel Copula) model are presented in Table 2.We include car, light truck, van, 13
other motorized vehicle and non-motorist crash count components in second, third, fourth, fifth 14
and sixth column panels, respectively. For brevity, results are discussed together for different road 15
user groups in the following section by variable groups. 16
17
TABLE 2 Multivariate Count Model Estimation Results – Gumbel Copula 18
Variable names
Car Light
truck Van
Other
motorized
vehicle
Non-
motorist
Estimate Estimate Estimate Estimate Estimate
t-stat t-stat t-stat t-stat t-stat
Constant 1.311 0.680 -0.571 0.051 0.474
23.940 21.571 -14.563 2.042 16.514
Land-use characteristics
Shopping centers 0.159 0.097 --* -- 0.140
8.402 6.575 -- -- 9.180
Restaurants -- -- 0.080 0.127 --
-- -- 4.297 7.374 --
Park and recreational centers 0.541 0.347 0.427 -- 0.599
6.941 5.092 5.584 -- 8.579
Proportion of urban area 0.570 0.074 0.562 -- 0.444
20.962 3.381 20.352 -- 17.996
Roadway attributes
Proportion of local roads -- -- -0.298 -- --
-- -- -4.928 -- --
Proportion of major roads 0.312 0.293 -- 0.468 0.373
10.994 10.810 -- 17.745 13.489
Traffic characteristics
AADT 0.851 0.660 0.643 0.553 0.809
29.823 26.507 27.542 24.236 31.662
Truck AADT -2.187 -2.225 -- 2.876 -2.645
-6.340 -7.676 -- 10.052 -8.325
Yasmin, Momtaz, Nashad and Eluru 11
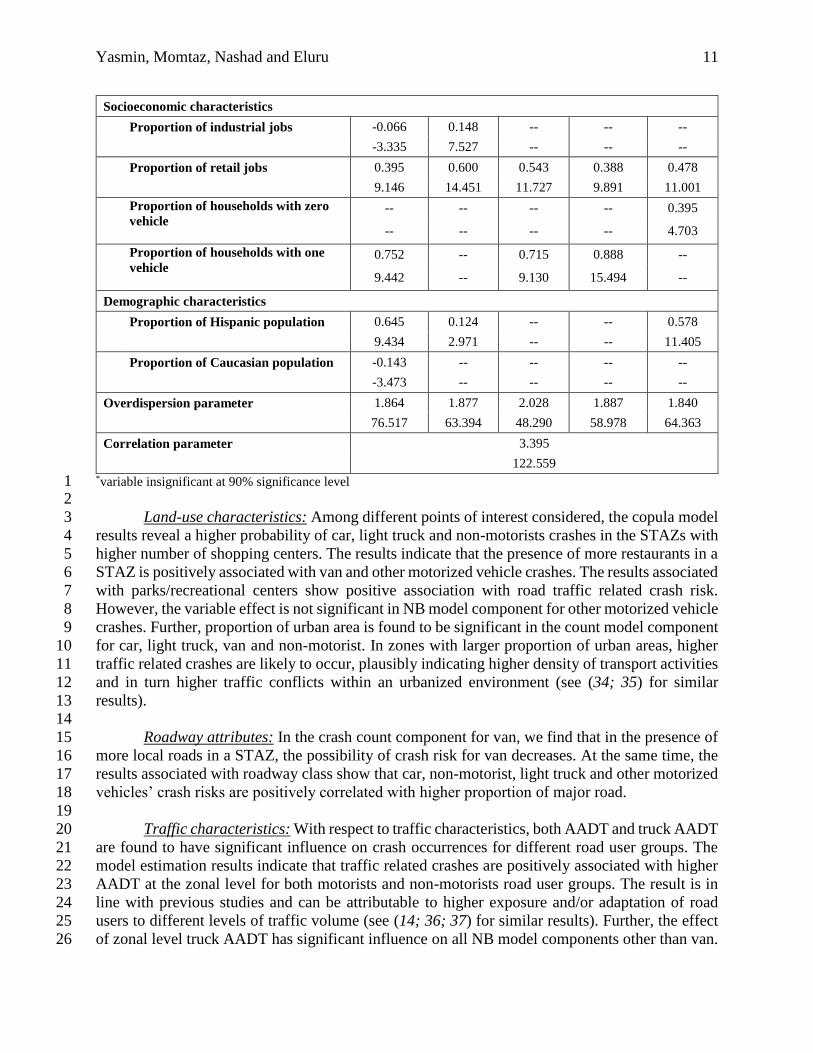
Socioeconomic characteristics
Proportion of industrial jobs -0.066 0.148 -- -- --
-3.335 7.527 -- -- --
Proportion of retail jobs 0.395 0.600 0.543 0.388 0.478
9.146 14.451 11.727 9.891 11.001
Proportion of households with zero
vehicle
-- -- -- -- 0.395
-- -- -- -- 4.703
Proportion of households with one
vehicle
0.752 -- 0.715 0.888 --
9.442 -- 9.130 15.494 --
Demographic characteristics
Proportion of Hispanic population 0.645 0.124 -- -- 0.578
9.434 2.971 -- -- 11.405
Proportion of Caucasian population -0.143 -- -- -- --
-3.473 -- -- -- --
Overdispersion parameter 1.864 1.877 2.028 1.887 1.840
76.517 63.394 48.290 58.978 64.363
Correlation parameter 3.395
122.559 *variable insignificant at 90% significance level 1 2
Land-use characteristics: Among different points of interest considered, the copula model 3
results reveal a higher probability of car, light truck and non-motorists crashes in the STAZs with 4
higher number of shopping centers. The results indicate that the presence of more restaurants in a 5
STAZ is positively associated with van and other motorized vehicle crashes. The results associated 6
with parks/recreational centers show positive association with road traffic related crash risk. 7
However, the variable effect is not significant in NB model component for other motorized vehicle 8
crashes. Further, proportion of urban area is found to be significant in the count model component 9
for car, light truck, van and non-motorist. In zones with larger proportion of urban areas, higher 10
traffic related crashes are likely to occur, plausibly indicating higher density of transport activities 11
and in turn higher traffic conflicts within an urbanized environment (see (34; 35) for similar 12
results). 13
14
Roadway attributes: In the crash count component for van, we find that in the presence of 15
more local roads in a STAZ, the possibility of crash risk for van decreases. At the same time, the 16
results associated with roadway class show that car, non-motorist, light truck and other motorized 17
vehicles’ crash risks are positively correlated with higher proportion of major road. 18
19
Traffic characteristics: With respect to traffic characteristics, both AADT and truck AADT 20
are found to have significant influence on crash occurrences for different road user groups. The 21
model estimation results indicate that traffic related crashes are positively associated with higher 22
AADT at the zonal level for both motorists and non-motorists road user groups. The result is in 23
line with previous studies and can be attributable to higher exposure and/or adaptation of road 24
users to different levels of traffic volume (see (14; 36; 37) for similar results). Further, the effect 25
of zonal level truck AADT has significant influence on all NB model components other than van. 26
Yasmin, Momtaz, Nashad and Eluru 12
The model results reveal that the higher truck AADT at the zonal level are likely to reduce crash 1
propensities for car, light truck and non-motorists (see (38) for similar result). The result may be 2
explained by the overall cautious travel behavior of different road user groups in the presence of 3
high heavy vehicle volume. On the other hand, the model estimation shows a positive correlation 4
between truck AADT and crashes involving other motorized vehicles; perhaps indicating higher 5
exposure of heavy vehicle and bus in these zones. 6
7
Socioeconomic characteristics: In terms of proportion of jobs by industry, the result 8
associated with industrial jobs indicates that zones with higher proportion of industrial jobs 9
increases the likelihood of light trucks’ crash risk. It is likely that zones with higher proportion of 10
industrial jobs experience higher usage of light truck for industrial job related activities. On the 11
other hand, an increase in proportion of industrial jobs in a zone decreases the likelihood of crash 12
risk for auto group of road users. Zones with higher number of retail jobs are likely to result in 13
higher traffic crashes involving both motorized and non-motorized road user groups. Levine et al. 14
(39) found similar impact of retail jobs on total crash count events. Further, non-motorists’ crash 15
risks are found to be higher for STAZs with higher proportion of households without access to 16
private vehicles. The variable is a surrogate indicator for non-motorists exposure. Household 17
members with no private vehicles are likely to walk/bike for daily activities resulting in higher 18
exposure and in turn higher potential of crash risk. As expected, car, van and other motorized 19
vehicle crash risks are found to be higher for STAZs with higher proportions of households with 20
one available private vehicle. 21
22
Demographic characteristics: From Table 2, we can see that proportion of zonal level 23
population by ethnicity are found to be significant determinants of zonal level crash risk in count 24
model components for car, light truck and non-motorist crashes. Road traffic crashes for car, light 25
truck and non-motorist increase with increasing proportion of Hispanic population, a result also 26
observed in Lee et al. (40). On the other hand, the estimation results indicate that STAZs with 27
greater proportion of Caucasian population are likely to experience less auto crashes. 28
29
Dependence effect: As indicated earlier, the estimated Gumbel copula-based multivariate 30
NB model provides the best fit in incorporating the correlation among different road user groups’ 31
crash count events. An examination of the copula parameter presented in the last row panel of 32
Table 2 highlights the presence of common unobserved factors affecting zonal level crash counts 33
of different road user groups considered in current study context. For the Gumbel copula, the 34
dependency is entirely positive and the coefficient sign and magnitude reflects whether a variable 35
increases or reduces the dependency and by how much. The proposed framework by allowing for 36
such correlation allows us to improve data fit. 37
38
Predictive Performance Evaluation and Policy Analysis 39 40
In an effort to assess the predictive performance of the estimated models (Gumbel copula and 41
independent models), we also perform computation of several in-sample goodness-of-fit measures. 42
To evaluate the predictive performance of these models, we employ two different fit measures: 43
mean prediction bias (MPB) and mean absolute deviation (MAD) both at the aggregate and 44
disaggregate level (see (10) for a discussion on computing these measures). At the 45
aggregate/disaggregate level, the computed values of MPB (MAD) for copula and independent 46
Yasmin, Momtaz, Nashad and Eluru 13
models are 4.890 (9.071)/24.448 (45.356) and 9.529 (15.019)/47.645 (75.096), respectively. The 1
resulting fit measures for comparing the predictive performance clearly indicate that multivariate 2
copula count model offers superior predictions compared to independent count model both at the 3
aggregate and disaggregate levels in the current study context. 4
The parameter effects of exogenous variables in Table 2 do not directly provide the 5
magnitude of the effects on zonal level crash counts across different road user groups involved in 6
crashes. For this purpose, we compute aggregate level “elasticity effects” for all the exogenous 7
variables by using the Gumbel copula model estimates. We investigate the effect as the percentage 8
change in the expected total zonal crash counts across different road user groups due to the change 9
in exogenous variable. Road user group specific elasticities would allow us to identify policy 10
measures targeting each group separately. However, it might also be useful in identifying 11
contributions of exogenous variables on total crashes considering contributions from all count 12
components. Total and group specific elasticity effects would allow us to prioritize the safety 13
improvement programs based on the level (all groups need attention in a specific area) and type (a 14
specific group needs attention in a specific area) of safety issues. Therefore, we also present the 15
overall total crash elasticities in our current study. Total crash elasticities are computed by 16
considering the change in exogenous variables across all count components simultaneously. 17
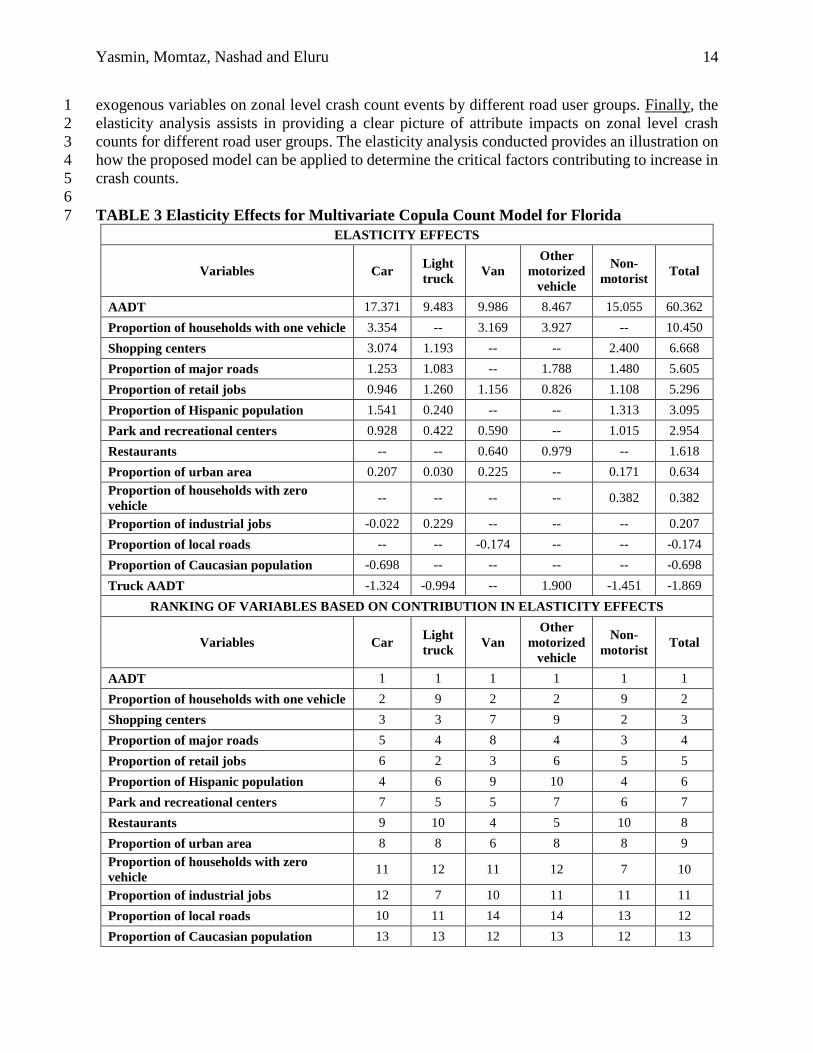
The computed elasticities are presented in the first row panel of Table 3 (see (41) for a 18
discussion on the methodology for computing elasticities). In calculating the expected percentage 19
change of crash counts, we increase the value of variables by 10% for each STAZ. The numbers 20
in Table 3 may be interpreted as the percentage change in the expected total zonal crash counts 21
due to the change in exogenous variable. For instance, the elasticity effects for shopping centers 22
in car model for in-sample data indicates that, the expected mean car crashes will increase by 23
3.074% with an increase in 10% of shopping centers. To emphasize policy repercussions based on 24
most critical contributory factors, we also rank each variables based on their contribution in 25
increasing the elasticity effects – with 1 as the highest contributor and 14 as the lowest contributor 26
across different variables considered. The results of this ranking is presented in second row panel 27
of Table 3. 28
The following observations can be made based on the results presented in Table 3. First, 29
the most significant variable in terms of increase in the expected number of crashes across all road 30
user groups is AADT, which is also the most important contributor for overall road traffic crashes. 31
Second, the ranking of variables are different across the different road user groups, which 32
illustrating that the relative contributions of different exogenous variables are substantially 33
different across different road user groups. This has important implications in identifying critical 34
factors for crash occurrences at a zonal level. For instance, targeted policy measures should be 35
implemented to reduce overall crashes for zones with higher AADT. However, to improve car, 36
van and other motorized vehicle safety, zones with higher proportions of households with one 37
vehicle should be the major focus. On the other hand, to improve non-motorists safety, zones with 38
higher shopping centers should be targeted. While for improved safety of light truck traffic, zones 39
with higher proportion of retail jobs should be the focus. Moreover, the results indicate that there 40
are considerable differences in the elasticity effects across different road user groups, thus 41
illustrating the value of examining separate risk factors for different road user groups. Third, the 42
impacts, in magnitude, are substantially different in crash count events among different passenger 43
vehicles (car, light truck and van) for many variables. The effects are different in magnitude and 44
sign for proportion of industrial jobs. These differences clearly highlight that each road user group 45
has distinct critical risk factors underscoring the importance of examining the effect of various 46
Yasmin, Momtaz, Nashad and Eluru 14
exogenous variables on zonal level crash count events by different road user groups. Finally, the 1
elasticity analysis assists in providing a clear picture of attribute impacts on zonal level crash 2
counts for different road user groups. The elasticity analysis conducted provides an illustration on 3
how the proposed model can be applied to determine the critical factors contributing to increase in 4
crash counts. 5
6
TABLE 3 Elasticity Effects for Multivariate Copula Count Model for Florida 7
ELASTICITY EFFECTS
Variables Car Light
truck Van
Other
motorized
vehicle
Non-
motorist Total
AADT 17.371 9.483 9.986 8.467 15.055 60.362
Proportion of households with one vehicle 3.354 -- 3.169 3.927 -- 10.450
Shopping centers 3.074 1.193 -- -- 2.400 6.668
Proportion of major roads 1.253 1.083 -- 1.788 1.480 5.605
Proportion of retail jobs 0.946 1.260 1.156 0.826 1.108 5.296
Proportion of Hispanic population 1.541 0.240 -- -- 1.313 3.095
Park and recreational centers 0.928 0.422 0.590 -- 1.015 2.954
Restaurants -- -- 0.640 0.979 -- 1.618
Proportion of urban area 0.207 0.030 0.225 -- 0.171 0.634
Proportion of households with zero
vehicle -- -- -- -- 0.382 0.382
Proportion of industrial jobs -0.022 0.229 -- -- -- 0.207
Proportion of local roads -- -- -0.174 -- -- -0.174
Proportion of Caucasian population -0.698 -- -- -- -- -0.698
Truck AADT -1.324 -0.994 -- 1.900 -1.451 -1.869
RANKING OF VARIABLES BASED ON CONTRIBUTION IN ELASTICITY EFFECTS
Variables Car Light
truck Van
Other
motorized
vehicle
Non-
motorist Total
AADT 1 1 1 1 1 1
Proportion of households with one vehicle 2 9 2 2 9 2
Shopping centers 3 3 7 9 2 3
Proportion of major roads 5 4 8 4 3 4
Proportion of retail jobs 6 2 3 6 5 5
Proportion of Hispanic population 4 6 9 10 4 6
Park and recreational centers 7 5 5 7 6 7
Restaurants 9 10 4 5 10 8
Proportion of urban area 8 8 6 8 8 9
Proportion of households with zero
vehicle 11 12 11 12 7 10
Proportion of industrial jobs 12 7 10 11 11 11
Proportion of local roads 10 11 14 14 13 12
Proportion of Caucasian population 13 13 12 13 12 13
Yasmin, Momtaz, Nashad and Eluru 15
Truck AADT 14 14 13 3 14 14
1
CONCLUSIONS 2 3
The current study contributes to safety literature both methodologically and empirically. In terms 4
of methodology, the study generalized the bivariate copula count model for examining multivariate 5
crash count data by formulating and estimating a multivariate copula count model. For examining 6
the count components of the multivariate copula model, we employed negative binomial (NB) 7
regression framework. The empirical contribution of our study was to incorporate crash counts for 8
both motorized and non-motorized road user groups while considering different types of passenger 9
vehicles fleet categories. Specifically, we examined crash counts for car, light truck, van, other 10
motorized vehicle (including truck, bus and other vehicles) and non-motorist (pedestrian and 11
bicyclist) involved crashes by employing multivariate copula count framework. 12
The proposed model was estimated using zonal level (Statewide Traffic Analysis Zone 13
(STAZ) level) road traffic crash data for the state of Florida. A host of variable groups including 14
– land-use characteristics, roadway attributes, traffic characteristics, socioeconomic characteristics 15
and demographic characteristics were considered. The empirical analysis involved estimation of 16
four different multivariate copula count models including: 1) Clayton, 2) Gumbel, 3) Frank, and 17
4) Joe copulas. The Gumbel copula model offered the most superior fit to our data. Further, the 18
comparison between copula and the independent models confirmed the importance of 19
accommodating dependence among crash count events of different road user groups in the macro-20
level analysis. Further, an in-sample validation exercise was conducted to compare the 21
performance of the independent and copula model based on different fit measures. The resulting 22
fit measures for comparing the predictive performance clearly indicate that multivariate copula 23
count model offered superior predictions compared to independent count model both at the 24
aggregate and disaggregate levels in the current study context. 25
In our research, to further understand the impact of various exogenous factors, aggregate 26
level elasticity effects were computed for all the exogenous variables by using the estimates from 27
multivariate copula-based count model. To emphasize policy repercussions based on most critical 28
contributory factors, we also generated a rank for each variable based on their contribution in 29
influencing crash frequency. The elasticity effects clearly indicated that there are considerable 30
differences across different road user groups for the same variable, thus illustrating the value of 31
examining separate risk factors for different road user groups. Further, the impacts were 32
substantially different in crash count events among different passenger vehicles (car, light truck 33
and van). The elasticity analysis conducted provides an illustration of how the proposed model can 34
be applied to determine the critical factors contributing to increase in crash counts. 35
The study is not without limitations. In modeling zonal level crash risks, we did not have 36
access to exposure data for different road user groups considered. It would be useful to compile 37
zonal level exposure data for different motorized and non-motorized road user groups to enhance 38
the model frameworks developed in our work. Further, it would be interesting to examine the count 39
components within the copula-based multivariate approach by using Zero-inflated or Hurdle 40
models in accommodating the preponderance of zero counts (if present) while also considering 41
more flexible copula structures. A comparison of the proposed copula-based model with other 42
multivariate modeling approaches will be a useful future research direction. 43
44
Yasmin, Momtaz, Nashad and Eluru 16
Acknowledgements 1 The authors would also like to gratefully acknowledge Florida Department of Transportation 2
(FDOT) for providing access to Florida crash data. 3
4
REFERENCES 5
6 [1] Subramanian, R. Motor Vehicle Traffic Crashes as a Leading Cause of Death in the United 7
States, 2002. Young, Vol. 1, 2005, p. 3. 8
[2] Blincoe, L., A. Seay, E. Zaloshnja, T. Miller, E. Romano, S. Luchter, and R. Spicer. The 9
economic impact of motor vehicle crashes, 2000.In, Washington, DC, National Highway Traffic 10
Safety Administration, 2002. 11
[3] Lord, D., and F. Mannering. The statistical analysis of crash-frequency data: a review and 12
assessment of methodological alternatives. Transportation Research Part A: Policy and Practice, 13
Vol. 44, No. 5, 2010, pp. 291-305. 14
[4] Mannering, F. L., and C. R. Bhat. Analytic methods in accident research: Methodological 15
frontier and future directions. Analytic methods in accident research, Vol. 1, 2014, pp. 1-22. 16
[5] Yasmin, S., and N. Eluru. Latent Segmentation Based Count Models: Analysis of Bicycle 17
Safety in Montreal and Toronto. Accident Analysis & Prevention (Forthcoming), 2016. 18
[6] Mannering, F. L., V. Shankar, and C. R. Bhat. Unobserved heterogeneity and the statistical 19
analysis of highway accident data. Analytic methods in accident research, Vol. 11, 2016, pp. 1-16. 20
[7] Chamberlain, G. Analysis of Covariance with Qualitative Data. The Review of Economic 21
Studies, Vol. 47, No. 1, 1980, pp. 225-238. 22
[8] Bhat, C. R. Quasi-random maximum simulated likelihood estimation of the mixed multinomial 23
logit model. Transportation Research Part B: Methodological, Vol. 35, No. 7, 2001, pp. 677-693. 24
[9] Barua, S., K. El-Basyouny, and M. T. Islam. Multivariate random parameters collision count 25
data models with spatial heterogeneity. Analytic methods in accident research, Vol. 9, 2016, pp. 26
1-15. 27
[10] Yasmin, S., and N. Eluru. A joint econometric framework for modeling crash counts by 28
severity. Transportmetrica A: Transport Science, 2017, pp. 1-26. 29
[11] Anastasopoulos, P. C. Random parameters multivariate tobit and zero-inflated count data 30
models: addressing unobserved and zero-state heterogeneity in accident injury-severity rate and 31
frequency analysis. Analytic methods in accident research, Vol. 11, 2016, pp. 17-32. 32
[12] Nashad, T., S. Yasmin, N. Eluru, J. Lee, and M. A. Abdel-Aty. Joint Modeling of Pedestrian 33
and Bicylist Crashes: A Copula Based Approach.In Transportation Research Record 34
(Forthcoming), 2016. 35
[13] Heydari, S., L. Fu, L. F. Miranda-Moreno, and L. Jopseph. Using a flexible multivariate latent 36
class approach to model correlated outcomes: A joint analysis of pedestrian and cyclist injuries. 37
Analytic methods in accident research, Vol. 13, 2017, pp. 16-27. 38
[14] Dong, C., D. B. Clarke, X. Yan, A. Khattak, and B. Huang. Multivariate random-parameters 39
zero-inflated negative binomial regression model: An application to estimate crash frequencies at 40
intersections. Accident Analysis & Prevention, Vol. 70, 2014, pp. 320-329. 41
[15] Huang, H., H. Zhou, J. Wang, F. Chang, and M. Ma. A multivariate spatial model of crash 42
frequency by transportation modes for urban intersections. Analytic methods in accident research, 43
Vol. 14, 2017, pp. 10-21. 44
[16] Jacobsen, M. R. Fuel economy and safety: The influences of vehicle class and driver behavior. 45
American Economic Journal: Applied Economics, Vol. 5, No. 3, 2013, pp. 1-26. 46
Yasmin, Momtaz, Nashad and Eluru 17
[17] Alliance, A. Light trucks help fuel 2016 sales. https://autoalliance.org/economy/facts-about-1
auto-sales/. Accessed July, 2017. 2
[18] White, M. J. The “arms race” on American roads: The effect of sport utility vehicles and 3
pickup trucks on traffic safety. The Journal of Law and Economics, Vol. 47, No. 2, 2004, pp. 333-4
355. 5
[19] Bhat, C. R. The maximum approximate composite marginal likelihood (MACML) estimation 6
of multinomial probit-based unordered response choice models. Transportation Research Part B: 7
Methodological, Vol. 45, No. 7, 2011, pp. 923-939. 8
[20] Narayanamoorthy, S., R. Paleti, and C. R. Bhat. On accommodating spatial dependence in 9
bicycle and pedestrian injury counts by severity level. Transportation Research Part B: 10
Methodological, Vol. 55, 2013, pp. 245-264. 11
[21] Yasmin, S., N. Eluru, A. R. Pinjari, and R. Tay. Examining driver injury severity in two 12
vehicle crashes – A copula based approach. Accident Analysis & Prevention, Vol. 66, 2014, pp. 13
120-135. 14
[22] Bhat, C. R., and N. Eluru. A copula-based approach to accommodate residential self-selection 15
effects in travel behavior modeling. Transportation Research Part B: Methodological, Vol. 43, 16
No. 7, 2009, pp. 749-765. 17
[23] Wang, C., M. A. Quddus, and S. G. Ison. Predicting accident frequency at their severity levels 18
and its application in site ranking using a two-stage mixed multivariate model. Accident Analysis 19
& Prevention, Vol. 43, No. 6, 2011, pp. 1979-1990. 20
[24] Ayuso, M., L. Bermúdez, and M. Santolino. Copula-based regression modeling of bivariate 21
severity of temporary disability and permanent motor injuries. Accident Analysis & Prevention, 22
Vol. 89, 2016, pp. 142-150. 23
[25] Nikoloulopoulos, A. K., and D. Karlis. Regression in a copula model for bivariate count data. 24
Journal of Applied Statistics, Vol. 37, No. 9, 2010, pp. 1555-1568. 25
[26] Cameron, A. C., T. Li, P. K. Trivedi, and D. M. Zimmer. Modelling the differences in counted 26
outcomes using bivariate copula models with application to mismeasured counts. The 27
Econometrics Journal, Vol. 7, No. 2, 2004, pp. 566-584. 28
[27] Nikoloulopoulos, A. K., and D. Karlis. Modeling multivariate count data using copulas. 29
Communications in Statistics-Simulation and Computation, Vol. 39, No. 1, 2009, pp. 172-187. 30
[28] Yasmin, S., N. Eluru, A. R. Pinjari, and R. Tay. Examining driver injury severity in two 31
vehicle crashes–A copula based approach. Accident Analysis & Prevention, Vol. 66, 2014, pp. 32
120-135. 33
[29] Trivedi, P. K., and D. M. Zimmer. Copula modeling: an introduction for practitioners. 34
Foundations and Trends® in Econometrics, Vol. 1, No. 1, 2007, pp. 1-111. 35
[30] Sklar, A. Random variables, joint distribution functions, and copulas. Kybernetika, Vol. 9, 36
No. 6, 1973, pp. (449)-460. 37
[31] Sener, I. N., N. Eluru, and C. R. Bhat. On jointly analyzing the physical activity participation 38
levels of individuals in a family unit using a multivariate copula framework. Journal of Choice 39
Modelling, Vol. 3, No. 3, 2010, pp. 1-38. 40
[32] Eluru, N., R. Paleti, R. Pendyala, and C. Bhat. Modeling injury severity of multiple occupants 41
of vehicles: Copula-based multivariate approach. Transportation Research Record: Journal of the 42
Transportation Research Board, No. 2165, 2010, pp. 1-11. 43
[33] FIRES. Quick Stats: Crash summary. Florida's Integrated Report Exchange Sytem (FIRES). 44
https://firesportal.com/Pages/Public/QuickStats.aspx. Accessed July, 2017. 45
Yasmin, Momtaz, Nashad and Eluru 18
[34] Huang, H., M. Abdel-Aty, and A. Darwiche. County-level crash risk analysis in Florida: 1
Bayesian spatial modeling. Transportation Research Record: Journal of the Transportation 2
Research Board, No. 2148, 2010, pp. 27-37. 3
[35] Siddiqui, C., M. Abdel-Aty, and K. Choi. Macroscopic spatial analysis of pedestrian and 4
bicycle crashes. Accident Analysis & Prevention, Vol. 45, 2012, pp. 382-391. 5
[36] Milton, J. C., V. N. Shankar, and F. L. Mannering. Highway accident severities and the mixed 6
logit model: an exploratory empirical analysis. Accident Analysis & Prevention, Vol. 40, No. 1, 7
2008, pp. 260-266. 8
[37] Hadayeghi, A., A. Shalaby, and B. Persaud. Macrolevel accident prediction models for 9
evaluating safety of urban transportation systems. Transportation Research Record: Journal of the 10
Transportation Research Board, No. 1840, 2003, pp. 87-95. 11
[38] Cai, Q., M. Abdel-Aty, J. Lee, and N. Eluru. Comparative analysis of zonal systems for 12
macro-level crash modeling. Journal of Safety Research, Vol. 61, No. Supplement C, 2017, pp. 13
157-166. 14
[39] Levine, N., K. E. Kim, and L. H. Nitz. Spatial analysis of Honolulu motor vehicle crashes: II. 15
Zonal generators. Accident Analysis & Prevention, Vol. 27, No. 5, 1995, pp. 675-685. 16
[40] Lee, J., M. Abdel-Aty, and X. Jiang. Development of zone system for macro-level traffic 17
safety analysis. Journal of transport geography, Vol. 38, 2014, pp. 13-21. 18
[41] Eluru, N., and C. R. Bhat. A joint econometric analysis of seat belt use and crash-related 19
injury severity. Accident Analysis & Prevention, Vol. 39, No. 5, 2007, pp. 1037-1049. 20
21
![Zero-inflated regression models for count data: an ... · (2008) [18]. Another popular approach to model the excess zeros in count data is to use truncated models. Hurdle model developed](https://img.pdfslide.net/doc/110x75/5ece26dccebd7c0f84040f7a/zero-inflated-regression-models-for-count-data-an-2008-18-another-popular.jpg)