Embed Size (px)
Citation preview
A National Study of Capital Infrastructure & Deferred Maintenance
at Schools of Agriculture
Sightlines, LLC | 405 Church Street, Suite 2 | Guilford, CT 06437
Supported by the Board on Agriculture Assembly of the Association of Public and Land-grant Universities (APLU)
October 15, 2015
Changing the Conversation on CampusA National Study of Capital Infrastructure & Deferred Maintenance at Schools of Agriculture Facilities
Contents
Foreword & Acknowledgements 3
Section 1: Introduction 4
Study of Capital Infrastructure and Deferred Maintenance at Schools
of Agriculture Facilities (Including Land Grant and Non-Land Grant Insitutions) 5
Why Study Deferred Maintenance? Why is it a Problem? 5
Section 2: Study Methodology, Respondent Profile and Validation Process 7
Building Inventory 7
Survey 8
Creating the Database 8
Respondent Profile 8
Section 3: Summary of Findings 9
Total Deferred Maintenance Backlog 10
Analysis of Age Profile and the Impact the Deferred Maintenance Figures 10
Summary of Findings by Building Function 13
Functional Breakdown of the Analysis 13
Regional Analysis 15
Age Profile 15
Section 4: Conclusions and Strategies for Change 17
Appendix A: Data Collection Definitions 19
Appendix B: Institution List by Region 20
This report was produced by Sightlines, LLC
Sightlines LLC405 Church Street, Suite 2Guilford, CT 06437
James A. Kadamus, Vice PresidentPeter Reeves, Associate DirectorRebecca Cavalier, Senior Analyst
3
Foreword
The state of campus infrastructure to conduct 21st century research and education is an evermore frequent topic of discussion among campus administrators. The high cost of repairs coupled with a need for capital renewal to address aging facilities continues to add to a growing serious backlog of deferred maintenance needs and if not addressed can seriously impinge upon the ability of institutions to meet their mission mandates. This has been a topic of increasing concern to agricultural administrators as it strives to position the work of its faculty to meet the global challenges before the world.
While individual institutions may have conducted comprehensive facility reviews, there has been no effort to assess the situation from a national perspective. Consequently, the Board of Agriculture Assembly of the Association of Public and Land-grant Universities contracted with Sightlines, LLC to conduct a study which would provide a national overview of deferred maintenance in public agricultural colleges.
The study undertaken was not designed to encompass all public institutions with research and education programming in agriculture and related sciences. Rather a concerted effort was made to include a majority of the land-grant universities along with a representative sample of non-land-grant institutions with agricultural programming. We believe that this was achieved with the ninety-one institutions participating and the diversity among them.
The study results confirm the suspected magnitude of the problem which must be addressed if our institutions are going to continue to be able to deliver the high quality programming that is at the cutting edges of the science and education enterprises. While specific strategies to address this issue are suggested, it is also clear that the responsibility to ameliorate it resides with no single entity, but rather a coalition of efforts and actors.
Ian L. MawVice President, Food, Agriculture and Natural Resources
Association of Public and Land-grant Universities
Acknowledgements
We would like to thank a number of people for their contributions to the set up and execution of this report. We would like to thank Dr. Ian Maw for his guidance and coordination during this process. In addition, we would like to thank the Executive Directors: Dr. Carolyn B. Brooks, Ronald A. Brown, Dr. H. Michael Harrington, Dr. Jeff Jacobsen, Dr. Daniel Rossi, and Dr. Eric Young. We would like to thank the steering committee, which included Dr. Greg Cuomo (University of Minnesota – CFANS), Pam Elliott-Cain (Iowa State University), Stewart Harvey (University of Maine), Christopher Kopach (University of Arizona). And finally, we would like to thank the 91 participating institutions for taking the time to complete the data submission to make the report as comprehensive as possible.
Changing the Conversation on CampusA National Study of Capital Infrastructure & Deferred Maintenance at Schools of Agriculture Facilities
Section 1: Introduction
Agriculture is Big Business in the U.S. and We Feed the World
Agriculture and agriculture related industries contribute nearly $800 billion in gross domestic product in the U.S., about 5% of the economy, which is an increase from just over $600 billion in 2006. Almost 17 million full- and part-time jobs are related to agriculture, or about 9.2% of all U.S. employment.
Food amounts to 13% of all U.S. household expenditures. And while U.S. agriculture feeds our nation, food exports have doubled from 2006 to 2014 and the trade surplus in agriculture products has increased to nearly $40 billion in 2014.1
The Challenge of Productivity
While agriculture and agriculture related business grows, the U.S. is doing more with less. In 1935, there were 6.8 million farms; today, there are 2.2 million. Recent drought in the Midwest has negatively impacted livestock production. Long-term drought in California, which produces 11% of all U.S. agriculture products, threatens production.2
Despite production and climate challenges, U.S. food productivity continues to rise. Crop yields have steadily increased. Milk production has increased 50% since 1980.3 A combination of research, education and extension services funded by the U.S. Department of Agriculture (USDA) has provided answers to productivity questions and assisted the agriculture and agriculture related industries to thrive in the U.S.
National Institute of Food and Agriculture (NIFA)
NIFA is an entity created by the 2008 Farm Bill within USDA to fund research, education and extension services in a wide range of scientific fields related to agriculture. NIFA provides about $1.5 billion annually through grants to “invest in and advance agricultural research, education, and extension to solve societal challenges.”4 The vast majority of these funds go to colleges and universities in support of programs and the emerging workforce in every state.
Increasingly, NIFA senior leadership is concerned about how the condition of agriculture and agriculture related facilities on campuses is negatively impacting the research being funded. As NIFA’s Director Dr. Sonny Ramaswamy stated “we are conducting 21st century cutting edge research in 1950s and 1960s buildings on university campuses.”5 Despite USDA authorization for funds to support agriculture related facilities, no federal money has been appropriated in recent years.
1 U.S. Department of Agriculture Economic Research Service, Agriculture and Food Statistics “charting the Essentials” website 20152 Ibid.3 Ibid.4 U.S. Department of Agriculture, National Institute of Food and Agriculture website 20155 Interview with Dr. Sonny Ramaswamy conducted by James Kadamus, Sightlines LLC in pre-study briefing, fall 2014.
5
Association of Public and Land-grant Universities (APLU) and NIFA
There is a long-term historical relationship between USDA and its agencies such as NIFA and APLU, a research, policy and advocacy organization dedicated to strengthening and advancing the work of public universities in the U.S., Canada and Mexico. APLU, through the Board on Agriculture Assembly (BAA), advocates yearly on behalf of agricultural research, extension, and education funding and works closely with NIFA leadership.
In 2014, Dr. Ramaswamy introduced James Kadamus, Vice President of Sightlines LLC (a national consulting firm that advises over 450 colleges and universities on managing and funding their campus facilities) to APLU staff and leaders of the Board of Agriculture Assembly to discuss strategies to document the condition and deferred maintenance growth in agriculture and agriculture related facilities on campuses being funded by NIFA. The goal was to fund a study to understand the capital infrastructure and condition of facilities and to determine the level of deferred maintenance across the U.S. agriculture campuses.
After discussion, Sightlines presented a proposal to APLU’s Board of Agriculture Assembly to be funded through support from participating campuses. The proposal was approved and work began on the study in March 2015.
Study of Capital Infrastructure and Deferred Maintenance at Schools of Agriculture Facilities (Including land grant and non-land grant institutions)
In the study, Sightlines uses a methodology that includes a survey of 91 colleges and universities accompanied by a comprehensive building by building inventory of agriculture and agriculture related space and detailed reports on deferred maintenance in those buildings. Sightlines also applies statistical models to validate the information provided by the participating campuses using a detailed proprietary database of over 1.5 billion gross square feet (GSF) of space collected from over 450 United States colleges and universities. This validation methodology ensures consistency in reporting across campuses that may have used different methodologies to calculate deferred maintenance on their individual campuses. (The validation methodology is detailed in Section 2 of this report).
Why Study Deferred Maintenance? Why is it a Problem?
Sightlines has recently produced a number of studies and analyses of the growing backlog of deferred maintenance on college and university campuses in the U.S. and Canada.6 We have identified key drivers of this growth and also identified some of the impacts, including increased operating costs, building failures, negative impacts on research and unhappiness among faculty and students who occupy the buildings.
Our research has identified the following key drivers of the backlog of deferred maintenance:
• When buildings were constructed and renovated. The year a building was constructed can tell us a lot about the characteristics of that construction. Sightlines’ database identifies 1960-1975 as an era when large amounts of new construction occurred at universities to accommodate an influx of new students and to support growing federal government investment in research. The amount and speed of construction during
6 Sightlines reports “The State of Facilities in Higher Education: 2014 Benchmarks, Best Practices & Trends,” www.sightlines.com/insight/ state-of-facilities-2014/, and “Deferred Maintenance at Canadian Universities: A 2014 Update,” www.sightlines.com/sightlines-dm-study- published-by-caubo/
Changing the Conversation on CampusA National Study of Capital Infrastructure & Deferred Maintenance at Schools of Agriculture Facilities
this era led to poor construction quality buildings. Unless renovated, all of this space has already come due for renovation or will come due between 2015 and 2025. In addition, we have identified a period from 1995-2015 as a second wave of major space construction.
• Ageprofileofcampusfacilities.The distribution of space across age categories is a critical driver of deferred maintenance. Our research has determined that there are definitive points in time when the life cycles of building mechanical systems, building envelope and interior space come due and need to be replaced or updated. When too much space is concentrated in a specific age category, such as between 25-50 years old, campuses are challenged to find the money to fix everything that is coming due. In this situation, campuses often postpone renovation and defer necessary maintenance to a later date.
• Level of capital investment. Sightlines defines capital investment in two forms: annual stewardship and asset reinvestment. Annual stewardship is the funding the cost of ensuring that buildings will perform properly and building components will reach their useful life. We call this the cost of “keeping-up.” Asset reinvestment is the funding the cost of addressing accumulated the backlog of repair and modernization of buildings — or “catch-up” costs. When campuses allocate adequate resources to keep-up as building life cycles come due, they defer fewer projects to their backlog and need less money to catch-up. When annual stewardship declines and campuses do not keep-up with life cycles, the amount of deferred projects increase. Research has confirmed that the “cost of waiting” to address critical life cycles projects can result in future costs for deferred maintenance that are double or triple the original project costs.
The data collected through the survey of schools of agriculture institutions and the accompanying building inventory and deferred maintenance data enables Sightlines to examine these drivers of deferred maintenance and identify the root causes of deferral. We will provide details on each of these drivers in Section 3 and put the data into context in Section 4.
But what are the risks of a growing problem of deferred maintenance? Is Dr. Ramaswamy right that buildings in poor condition can impact the quality of research and even result in failure of experiments? In prior studies, Sightlines has documented that significant failure of building systems, such HVAC and electrical systems that can impact temperature controls within buildings and cause experiments to fail. We have previously documented incidents of roof failures that resulted in water damage to the building and to research projects. At the very least, these failures can cause delays in research work and add extra costs in personnel time and in cost of mitigation. At worst, we are entering an era when the condition of facilities will limit our ability to conduct world class research that is needed to keep our leadership edge in the agriculture industry.
This increasing risk and cost of building and system failure is why we must better understand the size of the deferred maintenance problem and the root causes. Only then will we be able to develop strategies that address the root causes and drivers of the problem.

7
Section2:StudyMethodology,RespondentProfileandValidationProcess
This study includes only buildings and supporting facilities at schools of agriculture that are authorized to receive USDA funding if it were to be appropriated. The analysis focuses on education, research, and extension buildings related to agricultural programs. Some building types were included in the study, while others were excluded. Examples of included building types are: Animal Sciences, Veterinary Schools, Environmental Studies, Food Science, Plant Science, Forestry, Entomology, Coastal and Marine Science, Natural Resources, Textile and Clothing, Agriculture and Resource Economics, extension sites, off-site farms and research stations. Examples of buildings that were excluded from the analysis are: leased space with minimal to no capital improvement responsibility, residences that are rented out to non-university personnel, off-shore sights such as boats and platforms, utility plants, wind and solar farms, and animal care facilities that are not used for research or teaching purposes.
Sightlines conducted several webinars to introduce the study to participating institutions. Each participant provided Sightlines with a building inventory and completed a survey with additional questions. These items are further explained below. The participants could also submit a deferred maintenance study, if applicable. Sightlines contacted the campuses directly with any follow-up questions.
Building Inventory
The institutions were asked to complete a standardized building inventory template created by Sightlines. They were asked for the following information for each included building:
Name – Building Name
Size – Building size measured in Gross Square Feet (GSF)
Building Function – The main usage of the space such as: Classroom/Teaching, Science Research, Extension, Farm/Animal Buildings, Greenhouses, and Support. (For definitions of these functions please see Appendix A)
Building Type – The technical complexity of the space. The options for this section were: Small, Non-Utility, Simple, Basic, and Complex. (For definitions of these types please see Appendix A)
Construction Year – Date of the original construction of the building
Renovation Year – Date of the most recent major renovation of the building (if applicable). The definition used for a major renovation to a building was “A large-scale renovation that cost at least 50% of the building’s replacement value and/or the scope of which involved work done on at least 50% of the building’s various components.”
Percentage of building included in analysis – Percentage (0-100) of the GSF that met the criteria of a building that is included in the analysis.
After receiving the building inventory documents from the institutions, we reviewed them for missing information and looked for anything outside of normal ranges. We reached out to the campus contact at the institutions to ask follow-up questions to gain clarity, ensure data is consistent, and fill in missing data.

Changing the Conversation on CampusA National Study of Capital Infrastructure & Deferred Maintenance at Schools of Agriculture Facilities
Survey
A survey, administered by Sightlines, was used to collect the building inventory information as well the additional information listed below from each institution:
Deferred Maintenance Study – The institutions were able to upload documents containing deferred maintenance information from studies that have been done either internally or by an outside vendor.
Capital Investment Level – The institutions were asked to estimate the level of capital spending on their agricultural facilities over the past five years. This estimate was only for existing buildings; spending on new construction was not to be included in the estimate. The options they could choose from were: Low (Under $1.00/GSF), Low-Medium ($1.00 - $2.50/GSF), Medium-High ($2.50 - $5.00/GSF), and High ($5.00+/GSF).
Creating the Database
Sightlines compiled all of the data we received from the building inventories and from the additional survey questions into one large database. We used a consistent methodology when processing and classifying this information. When the campus did not have a deferred maintenance study, Sightlines used the building information and capital spending estimates to calculate a deferred maintenance number for each building, which we call the backlog estimate. These estimates are based off of our database of deferred maintenance studies that Sightlines has conducted on more than 100 campuses. This deferred maintenance calculation was not done for buildings in which we received a deferred maintenance estimate from the institution.
RespondentProfile
Of the 101 institutions that were asked to participate in this study, 91 institutions provided their information to be included. The result is a 90% participation rate. Appendix B provides a full list of participants.
The study includes 15,596 buildings comprising more than 87 million gross square feet (GSF). Sightlines calculates that these buildings have a current replacement of $29 billion.
The institutions were split into seven regions: North Central, Northeast, Southern, Western, 1890 land-grants, 1994 Tribal land-grant Colleges, and Non-Land-grant universities with agricultural programs. Collectively they are referred to as the schools of agriculture in this report. The North Central Region has 3,163 buildings roughly 24 million GSF. The Northeast Region has 1,244 buildings making up 9.7 million GSF. The Southern Region has 7,223 buildings comprising 30.9 million GSF. The Western Region has 3,104 buildings and 16.4 million GSF. The 1890 Region has 292 buildings and 2.7 Million GSF. The Tribal Colleges Region has 83 buildings which consist of 0.7 Million GSF. The Non-Land Grant Region has 487 buildings and 3.3 million GSF.
The scope and breadth of this study makes it the largest and most comprehensive study of U.S. schools of agriculture research, academic and support facilities ever completed.
9
Section 3: Summary of Findings
Total Deferred Maintenance Backlog
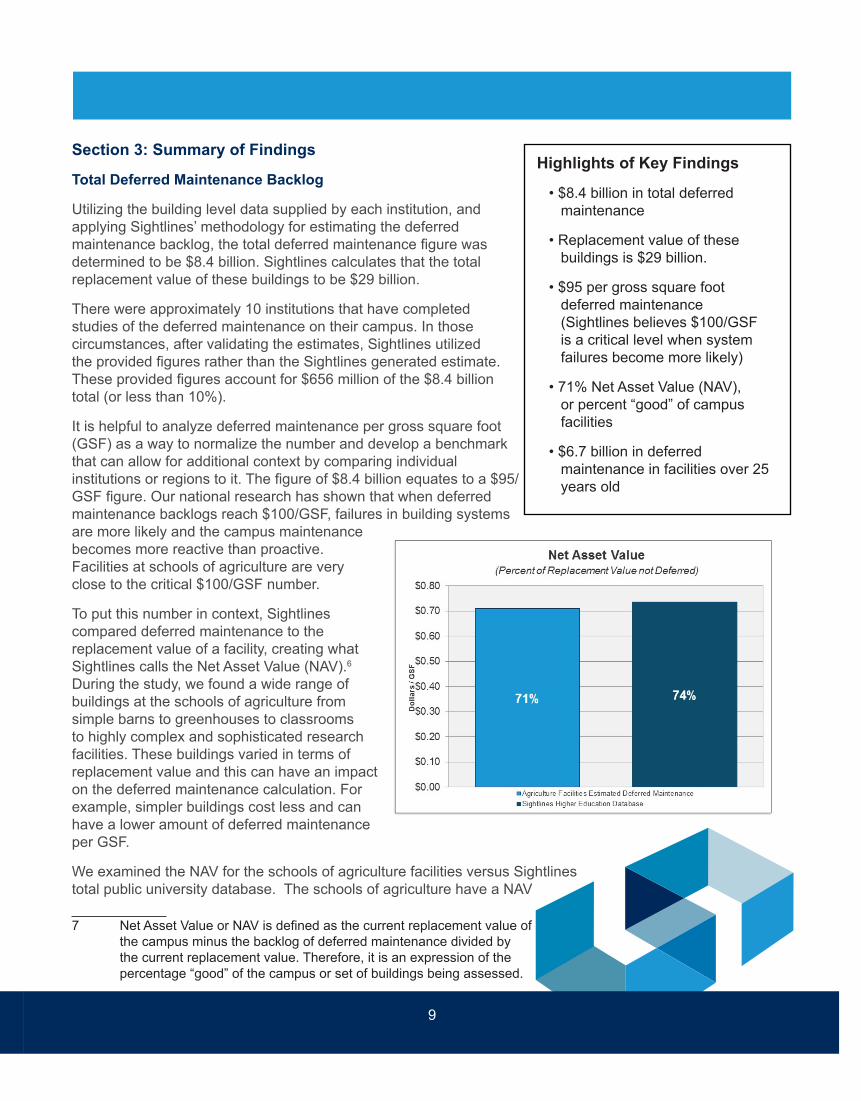
Utilizing the building level data supplied by each institution, and applying Sightlines’ methodology for estimating the deferred maintenance backlog, the total deferred maintenance figure was determined to be $8.4 billion. Sightlines calculates that the total replacement value of these buildings to be $29 billion.
There were approximately 10 institutions that have completed studies of the deferred maintenance on their campus. In those circumstances, after validating the estimates, Sightlines utilized the provided figures rather than the Sightlines generated estimate. These provided figures account for $656 million of the $8.4 billion total (or less than 10%).
It is helpful to analyze deferred maintenance per gross square foot (GSF) as a way to normalize the number and develop a benchmark that can allow for additional context by comparing individual institutions or regions to it. The figure of $8.4 billion equates to a $95/GSF figure. Our national research has shown that when deferred maintenance backlogs reach $100/GSF, failures in building systems are more likely and the campus maintenance becomes more reactive than proactive. Facilities at schools of agriculture are very close to the critical $100/GSF number.
To put this number in context, Sightlines compared deferred maintenance to the replacement value of a facility, creating what Sightlines calls the Net Asset Value (NAV).6 During the study, we found a wide range of buildings at the schools of agriculture from simple barns to greenhouses to classrooms to highly complex and sophisticated research facilities. These buildings varied in terms of replacement value and this can have an impact on the deferred maintenance calculation. For example, simpler buildings cost less and can have a lower amount of deferred maintenance per GSF.
We examined the NAV for the schools of agriculture facilities versus Sightlines total public university database. The schools of agriculture have a NAV
7 Net Asset Value or NAV is defined as the current replacement value of the campus minus the backlog of deferred maintenance divided by the current replacement value. Therefore, it is an expression of the percentage “good” of the campus or set of buildings being assessed.
Highlights of Key Findings
• $8.4 billion in total deferred maintenance
• Replacement value of these buildings is $29 billion.
• $95 per gross square foot deferred maintenance (Sightlines believes $100/GSF is a critical level when system failures become more likely)
• 71% Net Asset Value (NAV), or percent “good” of campus facilities
• $6.7 billion in deferred maintenance in facilities over 25 years old
Changing the Conversation on CampusA National Study of Capital Infrastructure & Deferred Maintenance at Schools of Agriculture Facilities
of 71%, whereas the public database is above 74%. This means that nearly 30% of the value of the schools of agriculture facilities is lost to deferred maintenance and that decline in value will accelerate unless the deterioration is addressed soon. It also means that on the same public university campuses the schools of agriculture facilities have greater needs relative to other buildings on campus, although the numbers suggest serious deferred maintenance problems across the entire campus.
With more than $8 billion in deferred maintenance identified, it is important to understand how various factors have contributed to this significant need and to determine the likelihood that it will grow in the future.
AnalysisofAgeProfileandtheImpacttheDeferredMaintenanceFigures
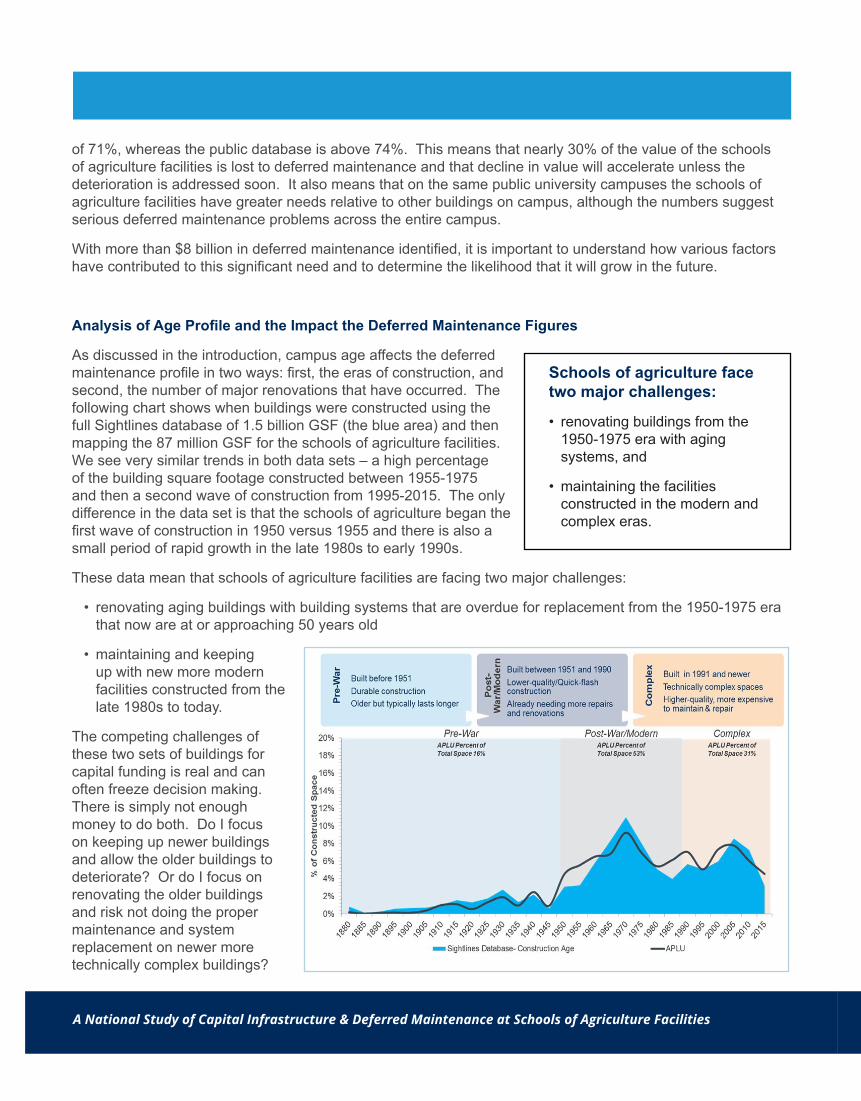
As discussed in the introduction, campus age affects the deferred maintenance profile in two ways: first, the eras of construction, and second, the number of major renovations that have occurred. The following chart shows when buildings were constructed using the full Sightlines database of 1.5 billion GSF (the blue area) and then mapping the 87 million GSF for the schools of agriculture facilities. We see very similar trends in both data sets – a high percentage of the building square footage constructed between 1955-1975 and then a second wave of construction from 1995-2015. The only difference in the data set is that the schools of agriculture began the first wave of construction in 1950 versus 1955 and there is also a small period of rapid growth in the late 1980s to early 1990s.
These data mean that schools of agriculture facilities are facing two major challenges:
• renovating aging buildings with building systems that are overdue for replacement from the 1950-1975 era that now are at or approaching 50 years old
• maintaining and keeping up with new more modern facilities constructed from the late 1980s to today.
The competing challenges of these two sets of buildings for capital funding is real and can often freeze decision making. There is simply not enough money to do both. Do I focus on keeping up newer buildings and allow the older buildings to deteriorate? Or do I focus on renovating the older buildings and risk not doing the proper maintenance and system replacement on newer more technically complex buildings?
Schools of agriculture face two major challenges:
• renovating buildings from the 1950-1975 era with aging systems, and
• maintaining the facilities constructed in the modern and complex eras.
11
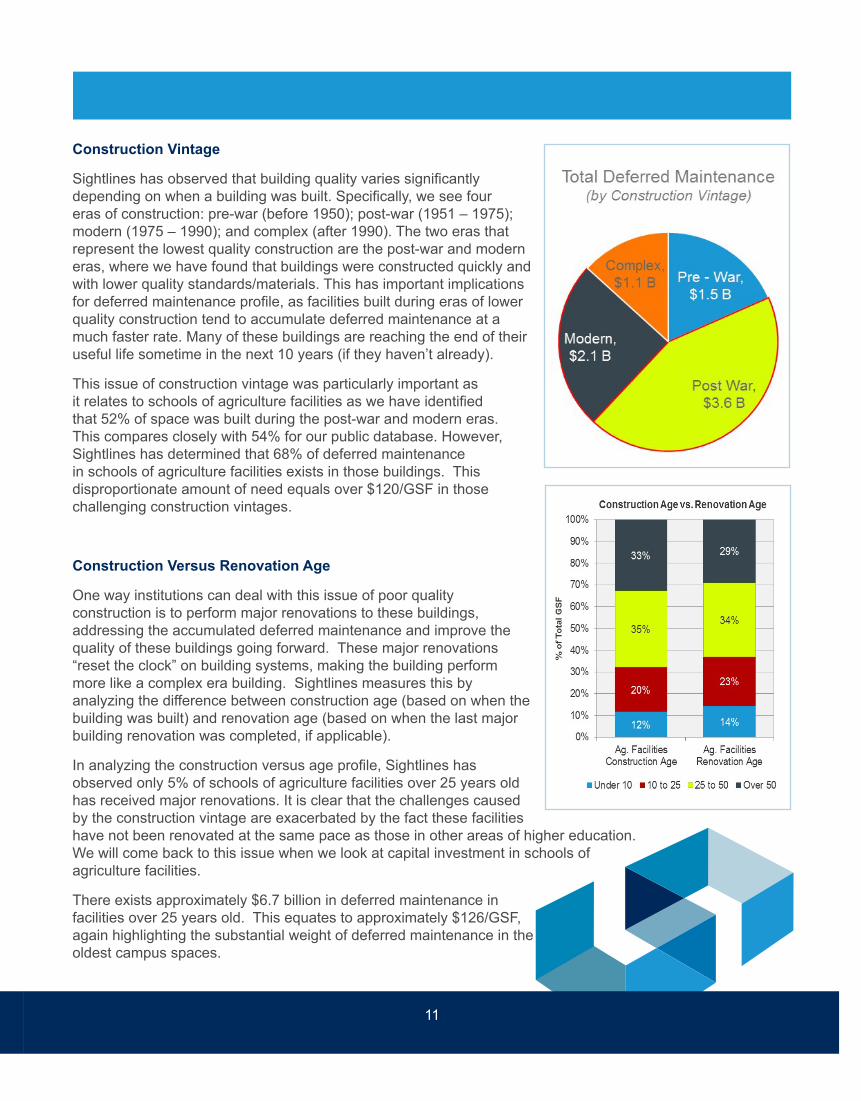
Construction Vintage
Sightlines has observed that building quality varies significantly depending on when a building was built. Specifically, we see four eras of construction: pre-war (before 1950); post-war (1951 – 1975); modern (1975 – 1990); and complex (after 1990). The two eras that represent the lowest quality construction are the post-war and modern eras, where we have found that buildings were constructed quickly and with lower quality standards/materials. This has important implications for deferred maintenance profile, as facilities built during eras of lower quality construction tend to accumulate deferred maintenance at a much faster rate. Many of these buildings are reaching the end of their useful life sometime in the next 10 years (if they haven’t already).
This issue of construction vintage was particularly important as it relates to schools of agriculture facilities as we have identified that 52% of space was built during the post-war and modern eras. This compares closely with 54% for our public database. However, Sightlines has determined that 68% of deferred maintenance in schools of agriculture facilities exists in those buildings. This disproportionate amount of need equals over $120/GSF in those challenging construction vintages.
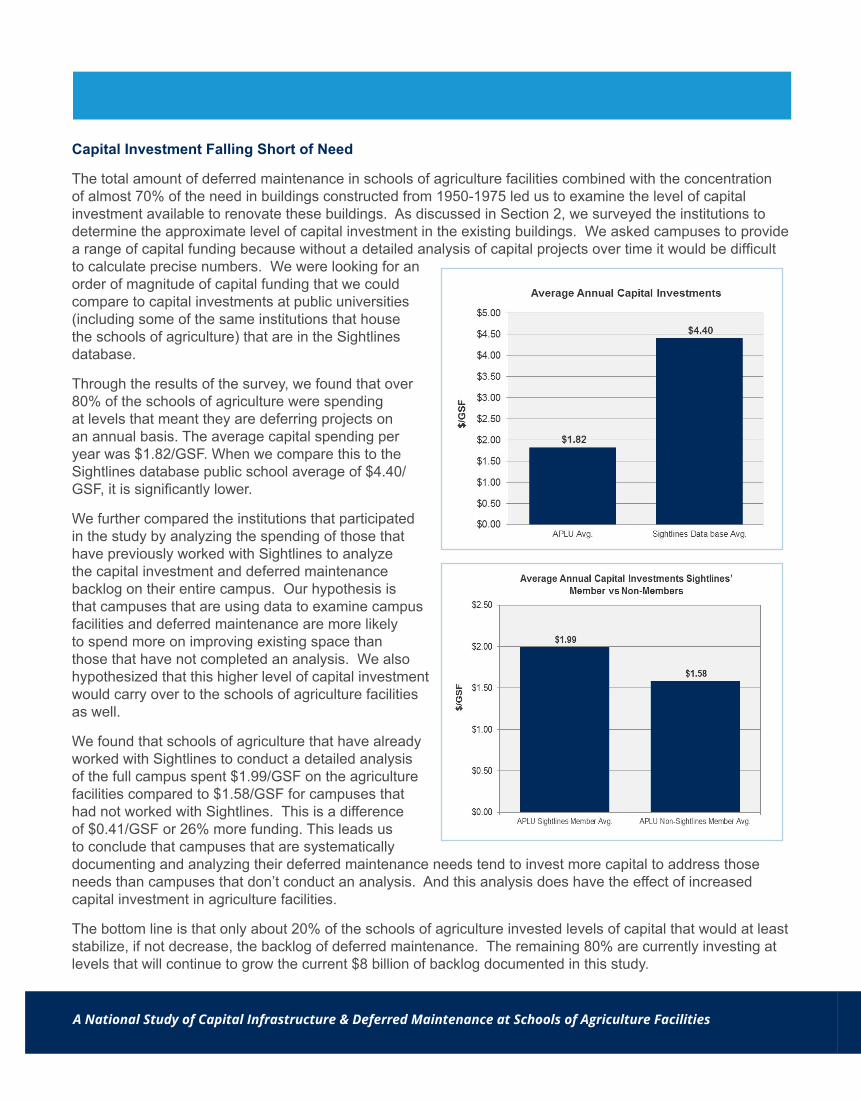
Construction Versus Renovation Age
One way institutions can deal with this issue of poor quality construction is to perform major renovations to these buildings, addressing the accumulated deferred maintenance and improve the quality of these buildings going forward. These major renovations “reset the clock” on building systems, making the building perform more like a complex era building. Sightlines measures this by analyzing the difference between construction age (based on when the building was built) and renovation age (based on when the last major building renovation was completed, if applicable).
In analyzing the construction versus age profile, Sightlines has observed only 5% of schools of agriculture facilities over 25 years old has received major renovations. It is clear that the challenges caused by the construction vintage are exacerbated by the fact these facilities have not been renovated at the same pace as those in other areas of higher education. We will come back to this issue when we look at capital investment in schools of agriculture facilities.
There exists approximately $6.7 billion in deferred maintenance in facilities over 25 years old. This equates to approximately $126/GSF, again highlighting the substantial weight of deferred maintenance in the oldest campus spaces.
Changing the Conversation on CampusA National Study of Capital Infrastructure & Deferred Maintenance at Schools of Agriculture Facilities
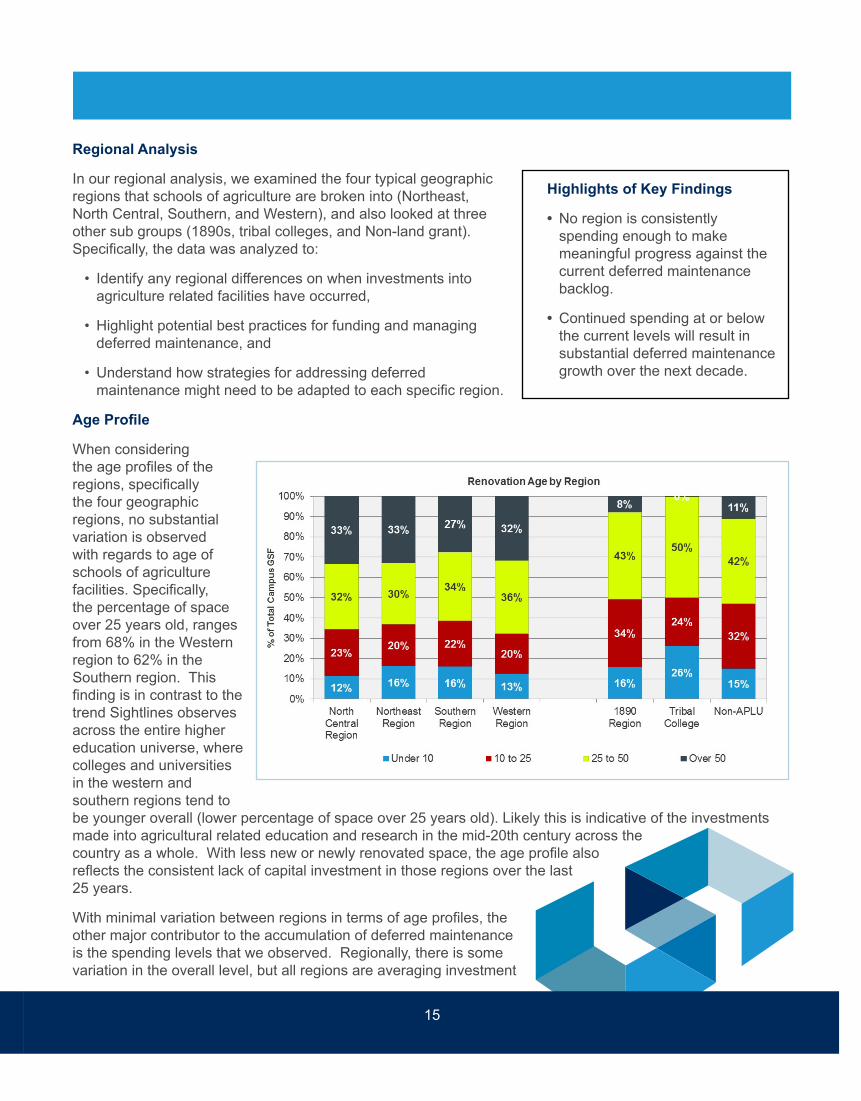
Capital Investment Falling Short of Need
The total amount of deferred maintenance in schools of agriculture facilities combined with the concentration of almost 70% of the need in buildings constructed from 1950-1975 led us to examine the level of capital investment available to renovate these buildings. As discussed in Section 2, we surveyed the institutions to determine the approximate level of capital investment in the existing buildings. We asked campuses to provide a range of capital funding because without a detailed analysis of capital projects over time it would be difficult to calculate precise numbers. We were looking for an order of magnitude of capital funding that we could compare to capital investments at public universities (including some of the same institutions that house the schools of agriculture) that are in the Sightlines database.
Through the results of the survey, we found that over 80% of the schools of agriculture were spending at levels that meant they are deferring projects on an annual basis. The average capital spending per year was $1.82/GSF. When we compare this to the Sightlines database public school average of $4.40/GSF, it is significantly lower.
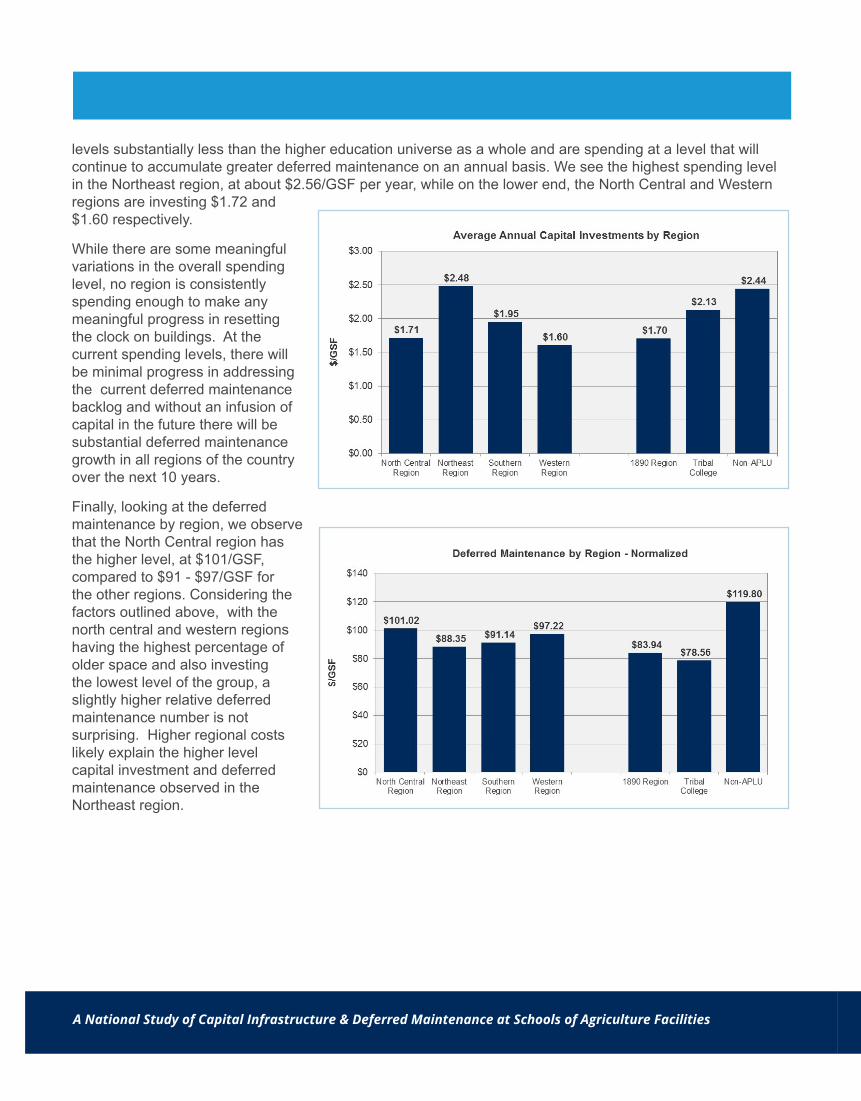
We further compared the institutions that participated in the study by analyzing the spending of those that have previously worked with Sightlines to analyze the capital investment and deferred maintenance backlog on their entire campus. Our hypothesis is that campuses that are using data to examine campus facilities and deferred maintenance are more likely to spend more on improving existing space than those that have not completed an analysis. We also hypothesized that this higher level of capital investment would carry over to the schools of agriculture facilities as well.
We found that schools of agriculture that have already worked with Sightlines to conduct a detailed analysis of the full campus spent $1.99/GSF on the agriculture facilities compared to $1.58/GSF for campuses that had not worked with Sightlines. This is a difference of $0.41/GSF or 26% more funding. This leads us to conclude that campuses that are systematically documenting and analyzing their deferred maintenance needs tend to invest more capital to address those needs than campuses that don’t conduct an analysis. And this analysis does have the effect of increased capital investment in agriculture facilities.
The bottom line is that only about 20% of the schools of agriculture invested levels of capital that would at least stabilize, if not decrease, the backlog of deferred maintenance. The remaining 80% are currently investing at levels that will continue to grow the current $8 billion of backlog documented in this study.

13
Summaryoffindingsbybuildingfunction
Functional Breakdown of the Analysis
With the focus of the analysis on agriculture teaching and research related facilities, including outlying buildings, research stations and farms, there is a concern that many of the facilities included in the analysis would not be mission critical to the programs. For example, are we overly concerned if the deferred maintenance is concentrated in barns and support buildings?
We found that over half (57%) of the space analyzed is related to teaching (classroom/teaching) and research (science research), while the remaining 43% is distributed between extension, farm, support, and greenhouses This highlights that while there are numerous buildings falling into outlying categories, the majority of the space does fall into the critical functions of teaching, research, and extension.
It follows from our discussion on the overall age profile of schools of agriculture facilities, that when we examine the specific profiles of the teaching and research space, we see a substantial percentage of space over 25 years old (an industry threshold for the age when buildings are demanding greater investment to maintain effective operation). Specifically, both science research and classroom/teaching spaces have 60% and 64% of space over 25 years old, respectively.
Sightlines has identified that over $5 billion of the total of $8.4 billion of deferred maintenance needs identified falls in these two categories: $3.2 billion falling in science research and $2 billion in classroom/teaching. Given the high level of deferred maintenance identified and the age profile, these core facilities are reaching a point when they risk increased building system failures, program interruption, or potential loss of research, unless they receive substantial investment.
Highlights of Key Findings
•Over 50% of the space analyzed is considered mission critical.
• Sightlines has identified that over $5 billion of the $8.4 billion total deferred maintenance falls into science research ($3.2 billion) classroom/teaching ($2.0 billion).

Changing the Conversation on CampusA National Study of Capital Infrastructure & Deferred Maintenance at Schools of Agriculture Facilities
In addition, when we examine the deferred maintenance on a dollars per GSF ($/GSF) basis, it is clear that the science research and classroom/teaching space has the highest average need. This level of need, particularly for science research buildings, reflects the complexity of the space, as well as the age and era of construction. These data confirm that Dr. Ramaswamy’s contention that NIFA is funding sophisticated 21st century research that is being conducted in buildings with a high level of deterioration.
15
Regional Analysis
In our regional analysis, we examined the four typical geographic regions that schools of agriculture are broken into (Northeast, North Central, Southern, and Western), and also looked at three other sub groups (1890s, tribal colleges, and Non-land grant). Specifically, the data was analyzed to:
• Identify any regional differences on when investments into agriculture related facilities have occurred,
• Highlight potential best practices for funding and managing deferred maintenance, and
• Understand how strategies for addressing deferred maintenance might need to be adapted to each specific region.
AgeProfile
When considering the age profiles of the regions, specifically the four geographic regions, no substantial variation is observed with regards to age of schools of agriculture facilities. Specifically, the percentage of space over 25 years old, ranges from 68% in the Western region to 62% in the Southern region. This finding is in contrast to the trend Sightlines observes across the entire higher education universe, where colleges and universities in the western and southern regions tend to be younger overall (lower percentage of space over 25 years old). Likely this is indicative of the investments made into agricultural related education and research in the mid-20th century across the country as a whole. With less new or newly renovated space, the age profile also reflects the consistent lack of capital investment in those regions over the last 25 years.
With minimal variation between regions in terms of age profiles, the other major contributor to the accumulation of deferred maintenance is the spending levels that we observed. Regionally, there is some variation in the overall level, but all regions are averaging investment
Highlights of Key Findings
•No region is consistently spending enough to make meaningful progress against the current deferred maintenance backlog.
•Continued spending at or below the current levels will result in substantial deferred maintenance growth over the next decade.
Changing the Conversation on CampusA National Study of Capital Infrastructure & Deferred Maintenance at Schools of Agriculture Facilities
levels substantially less than the higher education universe as a whole and are spending at a level that will continue to accumulate greater deferred maintenance on an annual basis. We see the highest spending level in the Northeast region, at about $2.56/GSF per year, while on the lower end, the North Central and Western regions are investing $1.72 and $1.60 respectively.
While there are some meaningful variations in the overall spending level, no region is consistently spending enough to make any meaningful progress in resetting the clock on buildings. At the current spending levels, there will be minimal progress in addressing the current deferred maintenance backlog and without an infusion of capital in the future there will be substantial deferred maintenance growth in all regions of the country over the next 10 years.
Finally, looking at the deferred maintenance by region, we observe that the North Central region has the higher level, at $101/GSF, compared to $91 - $97/GSF for the other regions. Considering the factors outlined above, with the north central and western regions having the highest percentage of older space and also investing the lowest level of the group, a slightly higher relative deferred maintenance number is not surprising. Higher regional costs likely explain the higher level capital investment and deferred maintenance observed in the Northeast region.
17
Section 4: Conclusions and Strategies for Change
With data on 91 schools of agriculture and analysis of over 15,000 facilities with 87 million gross square feet valued at over $29 billion, this study is the largest and most comprehensive of schools of agriculture in the United States. The conclusions about the age of the buildings, the lack of capital investment in them over time and the levels of deferred maintenance needs are sobering.
• 54% of the square footage analyzed are in buildings constructed from 1950-1975, a period of rapid, poor quality construction. These buildings have not stood the test of time in terms of holding up to wear and tear. They house critical classroom and scientific functions, and the research and experiments conducted in those buildings are in serious jeopardy if building systems like HVAC, electrical and plumbing fail.
• Most of the buildings analyzed received very limited capital investment since constructed. Clearly there have been some projects to improve the space and address leaky roofs and failing systems. But the amount of investment has only been enough to reset the clock on 5% of the space.
• The consequences of aging buildings with limited capital investment is over $8 billion in deferred maintenance in agriculture campuses across the U.S. We found the situation to be true in all regions in the country with very little variation.
• Our analysis suggests that nearly 30% of the replacement value of the 15,000+ buildings we studied has been lost because of the deferred maintenance needs we estimated.
• Sightlines determined that 80% of the campuses are investing capital at such a low level that they will continue to add to their backlog of deferred maintenance every year. This means the current situation we documented will not improve anytime soon without a change in funding and improved capital planning. To make matters worse, there are still large numbers of buildings constructed in the late 1960s and early 1970s that will be turning 50 years old in the next 10 years. These buildings will be waiting in line for renovation.
So what is the answer to this deferred maintenance problem that jeopardizes $1.5 billion of research being funded annually by USDA, in addition to the many other agencies that support research in these spaces with grant money(NSF, NIH, NASA, DOE, etc.)? In past studies, Sightlines has been reluctant to say an infusion of money is the answer to the growing deferred maintenance problem in higher education. But without a major infusion of funding over time, the classroom, scientific research, animal care, extension and support buildings at schools of agriculture will face a future of:
• Roofs that leak, foundations that crack and doors and windows that don’t keep the heat in or cold out.
• HVAC,electrical and plumbing systems that fail.
• Laboratories that cannot function.
• Animal care that is compromised.
• Health and safety problems for building occupants.
Changing the Conversation on CampusA National Study of Capital Infrastructure & Deferred Maintenance at Schools of Agriculture Facilities
At a time when all campuses are faced with fiscal constraints, there is no single entity or level of government that can carry the burden of billions in funding. There needs to be a multi-faceted set of strategies to address the problem over time. Here is what we recommend:
Federal government infusion of capital funding – The Federal government, Congress and USDA in particular have a huge stake in the research being conducted at schools of agriculture. In many campuses, the agriculture and agriculture related buildings are called the “USDA buildings.” A capital infusion of funds to renovate or replace the aging facilities will have an immediate return on investment and protect the billions in research currently being funded by USDA.
States also have a capital funding obligation – States benefit from agriculture research in terms of jobs created on campuses and increasing productivity and profitability of agriculture and agriculture related businesses. In addition, the USDA research is primarily conducted on public university campuses, many of them flagship universities that already benefit from State capital support. There is evidence in the study that very little of the state capital committed to land grant and other campuses in this study has been used to support improvements in agriculture and agriculture related buildings. A possible matching capital program between the federal and state governments could be a promising solution to growing the funding to address the deferred maintenance problem.
Campuses need a long term capital plan to turn the deferred maintenance problem around – Campus deans of agriculture, facilities and finance leaders need to develop multi-year capital plans to address the deferred maintenance backlog based on hard data of building condition. This means engaging in a process to set capital priorities and a plan to phase in work over time. In order to make progress on deferred maintenance, two important strategies need to be part of the capital plan:
• Target major renovations: Given that the majority of the older buildings have substantial deferred maintenance, allocate capital for full catch–up (i.e. major renovation) on all deferred maintenance in that building, rather than addressing building systems on a project by project basis.
• Demolish, or renovate through replacement: Since it may be too costly or impractical to perform a major renovation in some of these older buildings, identify which could be removed completely and which could be replaced with new facilities, and demolishing the existing building to remove the deferred maintenance. It is important to note that if the original building is not demolished, this strategy does not affect deferred maintenance.
Campuses need a plan for proactive maintenance of facilities in good condition – While campuses focus on catch-up with the buildings that have high levels of deferred maintenance, they also need to address planned and preventive maintenance on the buildings constructed after 1995. Our data suggest that these buildings are still in good condition, but will fall into disrepair in the next few years if the life cycles of building systems are not addressed as they come due. It is a challenge to fund keep-up and catch-up at the same time, but that is what these schools of agriculture are faced with and they need to develop strategies that do both renewal of older building and steward newer buildings.
To be successful in reducing the deferred maintenance problem and not letting it grow further, key stakeholders need to pursue all of the above. A single solution will not work. All levels of government and campuses need to do their parts in solving the deferred maintenance problem. Inaction has, over time, resulted in the problem that schools of agriculture are now facing. The future of agriculture research depends on people recognizing the problem and taking the actions recommended in this report.

19
AppendixA:DataCollectionDefinitions
Building Function Definitions:
Building Type Definitions:

Changing the Conversation on CampusA National Study of Capital Infrastructure & Deferred Maintenance at Schools of Agriculture Facilities
Appendix B: Institution List by Region
North Central Region:• Iowa State University – College of Agriculture and
Life Sciences• Kansas State University – College of Agriculture• Michigan State University – College of Agriculture
and Natural Resources• North Dakota State University – College
of Agriculture, Food Systems, and Natural Resources
• Purdue University – College of Agriculture• South Dakota State University – College of
Agriculture and Biological Sciences• The Ohio State University – College of Food,
Agriculture, and Environmental Sciences• University of Illinois – College of Agriculture,
Consumer and Environmental Sciences• University of Minnesota – College of Food,
Agriculture and Natural Resource Sciences• University of Missouri – Columbia – College of
Agriculture, Food and Natural Resources• University of Wisconsin – Madison – College of
Agriculture and Life Sciences
Northeast Region:• Cornell University – College of Agriculture and Life
Sciences• Rutgers University – School of Environmental and
Biological Sciences• The Pennsylvania State University – College of
Agricultural Sciences• University of Connecticut – College of Agriculture,
Health and Natural Resources• University of Maine – Orono – College of Natural
Sciences, Forestry, and Agriculture• University of Maryland – College of Agriculture
and Natural Resources• University of Massachusetts – Amherst – College
of Natural Sciences• University of Rhode Island – College of
Environment and Life Sciences• West Virginia University – Davis College of
Agriculture, Natural Resources and Design
Southern Region:• Auburn University – College of Agriculture• Auburn University – Ag Experiment Station• Clemson University – College of Agriculture,
Forestry and Life Sciences• Clemson University – Edisto Research and
Education Center• Clemson University Pee Dee Research and
Education Center• Clemson University – Sandhill Research and
Education Center• Louisiana State University Agricultural Center• Mississippi State University – College of
Agriculture and Life Sciences• North Carolina State University – College of
Agriculture and Life Sciences• Oklahoma State University – College of
Agricultural Sciences and Natural Resources• University of Arkansas – Dale Bumpers College of
Agricultural, Food and Life Sciences• University of Florida – College of Agricultural and
Life Sciences• University of Georgia – College of Agricultural and
Environmental Sciences• University of Kentucky – College of Agriculture,
Food and Environment• University of Puerto Rico – College of Agriculture
and Mechanic Arts• University of Tennessee – Knoxville – College of
Agriculture Sciences and Natural Resources• University of the Virgin Islands – Agricultural
Experiment Station• Virginia Tech College of Agriculture and Life
Sciences
Western Region:• College of Micronesia• Colorado State University – College of Agricultural
Sciences• Montana State University – College of Agriculture• New Mexico State University – College of
Agricultural, Consumer and Environmental Sciences
• Oregon State University – College of Agricultural Sciences
• University of Alaska – Fairbanks – School of Natural Resources and Extension

21
• University of Arizona – College of Agriculture and Life Sciences
• University of California – Agriculture and Natural Resources
• University of California – Berkeley – College of Natural Resources
• University of California – Davis – College of Agricultural and Environmental Science
• University of Guam – College of Natural and Applied Sciences
• University of Hawaii – College of Tropical Agriculture and Human Resources
• University of Idaho – College of Agriculture and Life Sciences
• University of Nevada – Reno – College of Agriculture, Biotechnology and Natural Resources
• University of Wyoming – College of Agriculture and Natural Resources
• Utah State University – College of Agriculture and Applied Sciences
• Washington State University – College of Agriculture, Human, and Natural Resource Sciences
1890 Region:• Alabama A&M University – College of Agriculture,
Life and Natural Sciences• Florida A&M University – College of Agriculture
and Food Sciences• Fort Valley State University – College of
Agriculture, Family Sciences and Technology• Kentucky State University – College of Agriculture,
Food Science, and Sustainable Systems• Langston University – School of Agriculture and
Applied Sciences• Lincoln University of Missouri – College of
Agriculture, Environmental and Human Sciences• Prairie View A&M University – College of
Agriculture and Human Sciences• South Carolina State University• Tennessee State University – College of
Agriculture, Human and Natural Sciences• Tuskegee University – College of Agriculture,
Environment and Nutrition Sciences• University of Maryland Eastern Shore – School of
Agriculture and Natural Sciences• West Virginia State University
1994 Tribal Land-grant Colleges Region:• Aaniih Nakoda College• Bay Mills Community College• College of the Muscogee Nation• Dine College• Leech Lake Tribal College• Nebraska Indian Community College• Northwest Indiana College• Salish Kootenai College• Sitting Bull College• Southwestern Indiana Polytechnic Institute
Non-Land-grant Region:• Angelo State University• Arkansas Tech University• Austin Peay State University• California State University – Chico – College of
Agriculture• McNeese State University• Southern Illinois University – Carbondale –
College of Agricultural Sciences• Stephen F. Austin State University – Arthur
Template College of Forestry and Agriculture• Tarleton State University – College of Agriculture
and Environmental Sciences• Texas Tech University – College of Agricultural
Sciences and Natural Resources• University of Tennessee – Martin – College of
Agriculture and Applied Sciences• University of Wisconsin – Platteville – College of
Business, Industry, Life Science and Agriculture• University of Wisconsin – River Falls – College of
Agriculture, Food and Environmental Sciences