Embed Size (px)
Citation preview

T h e n e w e ng l a nd j o u r na l o f m e dic i n e
n engl j med 358;11 www.nejm.org march 13, 2008 1137
special article
A Nationally Representative Case–Control Study of Smoking and Death in IndiaPrabhat Jha, M.D., Binu Jacob, M.Sc., Vendhan Gajalakshmi, Ph.D.,
Prakash C. Gupta, D.Sc., Neeraj Dhingra, M.D., Rajesh Kumar, M.D., Dhirendra N. Sinha, M.D., Rajesh P. Dikshit, Ph.D., Dillip K. Parida, M.D., Rajeev Kamadod, M.Sc., Jillian Boreham, Ph.D., and Richard Peto, F.R.S.,
for the RGI–CGHR Investigators*
From the Centre for Global Health Re-search, Toronto (P.J., B.J., R. Kamadod); and the Epidemiological Research Centre, Chennai (V.G.); Healis-Sekhsaria Institute for Public Health, Mumbai (P.C.G.); the Rural Health Training Centre, Najafgarh, New Delhi (N.D.); the School of Public Health, Post Graduate Institute of Medi-cal Education and Research, Chandigarh (R. Kumar); the School of Preventative Oncology, Patna (D.N.S.); Tata Memorial Hospital, Mumbai (R.P.D.); and North Eastern Indira Gandhi Regional Institute of Health and Medical Sciences, Shillong (D.K.P.) — all in India; and the Clinical Trial Service Unit and Epidemiological Studies Unit, University of Oxford, Ox-ford, United Kingdom (J.B., R.P.). Address reprint requests to Dr. Jha at the Centre for Global Health Research, St. Michael’s Hospital, University of Toronto, Toronto, ON M5C 1N8, Canada, or at [email protected].
*The Registrar General of India–Centre for Global Health Research (RGI–CGHR) In-vestigators are listed in the Supplemen-tary Appendix, available with the full text of this article at www.nejm.org.
This article (10.1056/NEJMsa0707719) was published at www.nejm.org on February 13, 2008.
N Engl J Med 2008;358:1137-47.Copyright © 2008 Massachusetts Medical Society.
A bs tr ac t
Background
The nationwide effects of smoking on mortality in India have not been assessed reliably.
Methods
In a nationally representative sample of 1.1 million homes, we compared the preva-lence of smoking among 33,000 deceased women and 41,000 deceased men (case subjects) with the prevalence of smoking among 35,000 living women and 43,000 living men (unmatched control subjects). Mortality risk ratios comparing smokers with nonsmokers were adjusted for age, educational level, and use of alcohol.
Results
About 5% of female control subjects and 37% of male control subjects between the ages of 30 and 69 years were smokers. In this age group, smoking was associated with an increased risk of death from any medical cause among both women (risk ratio, 2.0; 99% confidence interval [CI], 1.8 to 2.3) and men (risk ratio, 1.7; 99% CI, 1.6 to 1.8). Daily smoking of even a small amount of tobacco was associated with increased mor-tality. Excess deaths among smokers, as compared with nonsmokers, were chiefly from tuberculosis among both women (risk ratio, 3.0; 99% CI, 2.4 to 3.9) and men (risk ratio, 2.3; 99% CI, 2.1 to 2.6) and from respiratory, vascular, or neoplastic dis-ease. Smoking was associated with a reduction in median survival of 8 years for women (99% CI, 5 to 11) and 6 years for men (99% CI, 5 to 7). If these associations are mainly causal, smoking in persons between the ages of 30 and 69 years is respon-sible for about 1 in 20 deaths of women and 1 in 5 deaths of men. In 2010, smoking will cause about 930,000 adult deaths in India; of the dead, about 70% (90,000 women and 580,000 men) will be between the ages of 30 and 69 years. Because of popula-tion growth, the absolute number of deaths in this age group is rising by about 3% per year.
Conclusions
Smoking causes a large and growing number of premature deaths in India.
Copyright © 2008 Massachusetts Medical Society. All rights reserved. Downloaded from www.nejm.org at HLTH SCIENCE INFO CONSORTIUM OF TORONTO on March 23, 2008 .

T h e n e w e ng l a nd j o u r na l o f m e dic i n e
n engl j med 358;11 www.nejm.org march 13, 20081138
India is a diverse country, with marked regional variation in lifestyles and in the main causes of death.1 Among adults, most deaths
are from respiratory, vascular, or neoplastic dis-ease or from tuberculosis; the death rates from these diseases can be increased by smoking.2 In recent years, large household surveys have shown that in middle age, more than one third of men and a few percent of women smoke tobacco and that there are about 120 million smokers in India.3,4 Tobacco is commonly consumed in the form of bidis, which are smaller than cigarettes and typi-cally contain only about a quarter as much tobac-co, wrapped in the leaf of another plant. Anec-dotal evidence suggests that many of those who smoke have been doing so for decades, so the haz-ards may already be substantial. However, smok-ing starts at somewhat older ages in India than it does in Europe and North America,3 and the aver-age daily consumption per smoker is lower.5,6
The effects of prolonged smoking of bidis or cigarettes on mortality in India have been assessed reliably in only two specific localities5-9 in which the numbers of female smokers were too small to study. To assess the hazards of smoking in India nationwide among both women and men, we have conducted a case–control study that collected in-formation on all adult deaths from 2001 to 2003 in a nationally representative sample of 1.1 million homes.
Me thods
Study Design
Details of the study sample, case and control def-initions, assessment of exposures, assignment of the underlying causes of death, and statistical methods are in the Supplementary Appendix (avail-able with the full text of this article at www.nejm.org). In brief, the study was conducted in 1.1 mil-lion homes in 6671 small areas chosen randomly from all parts of India (about 1000 persons per area); the Sample Registration System was estab-lished by the Registrar General of India to moni-tor all births and deaths in these areas.10,11 Each home in which a death had been recorded be-tween 2001 and 2003 was visited by 1 of 900 non-medical field-workers to collect information about the cause of death, the history of tobacco and al-cohol use, and educational status. The underlying causes of all deaths were sought by verbal autopsy (a structured investigation of events leading to the death).6,12-14 Two trained physicians indepen-
dently assigned codes to the causes of death on the basis of the nonmedical field-worker’s writ-ten narrative of the death. If the two physicians did not agree on the assigned three-digit code from the International Classification of Diseases, 10th Revision,15 a senior physician adjudicated. A ran-dom sample of about 10% of the areas was re-surveyed independently, generally with consistent results. Details of the methods, quality-control checks, and validation results have been reported previously.12-14,16,17
The field teams asked respondents (typically, household members) whether the deceased per-son had been a smoker within the previous 5 years and, if so, the usual number of bidis or cigarettes the person had smoked per day. Since smoking cessation is uncommon in India,5,18 the key com-parisons were between persons who had smoked in the past 5 years and those who had not. Ques-tions were also asked about other tobacco smok-ing, quid chewing, alcohol consumption, and years of education. Adult respondents were asked simi-lar questions about themselves.
Subjects
Potential case subjects were adults 20 years of age or older who had died between 2001 and 2003 and whose deaths had been recorded in the ear-lier fieldwork of the Sample Registration System. Among case subjects, data were available for 33,069 women and 41,054 men after the exclusion of deaths for nonmedical or maternal causes and of deaths for which data regarding smoking sta-tus were missing (3%). Adults who provided infor-mation about someone who had died were also asked about their own smoking status, and 97% of them provided a response (34,857 women and 43,078 men). This population of respondents served as the control group. The analyses do not match particular case subjects with particular control subjects; therefore, the study design does not adjust for household.
Women and men were analyzed separately. In the major analyses, we used logistic regression to adjust for age, educational level, and use or non-use of alcohol.
Calculation of absolute Risk
In the calculation of absolute risk, we used the World Health Organization (WHO) age-specific death rates for India to correct for any slight un-dercounts in the Sample Registration System.19,20 Deaths of persons between the ages of 30 and 69
Copyright © 2008 Massachusetts Medical Society. All rights reserved. Downloaded from www.nejm.org at HLTH SCIENCE INFO CONSORTIUM OF TORONTO on March 23, 2008 .
Effects of Smoking on Adult Mortality in India
n engl j med 358;11 www.nejm.org march 13, 2008 1139
years are presented separately because deaths at these ages involve substantially more years of life lost than do deaths at older ages. In addition, the assignment of underlying causes of death is sub-stantially more reliable for persons between the ages of 30 and 69 years than for older per-sons,12,14,16,17 and the main effects of smoking on mortality occur after the age of 25 years (the ap-proximate median age at which smoking begins among men in India4).
R esult s
Characteristics of the Subjects
Persons who died were older and less educated and had a higher prevalence of smoking, tobacco chewing, and alcohol use than did living control subjects (Table 1, and Table 1 of the Supplemen-tary Appendix). In the group of control subjects, the prevalence of smoking among men rose with age, from 8% among those between 15 and 19 years to 27% among those between 30 and 34 years. The prevalence then remained approximate-ly constant at 35 to 40% for subjects between the ages of 35 and 69 years (Fig. 1, and Table 2 of the Supplementary Appendix). Between the ages of 40 and 59 years, smoking was more common among men without primary education (44%) than among other men (35%). The age-specific prevalence of smoking among female control sub-jects between 30 and 69 years of age rose fairly steadily from 3 to 6%. Between the ages of 40 and 59 years, the prevalence of smoking was 6% for women without primary education and 2% for other women.
Smoking and Mortality
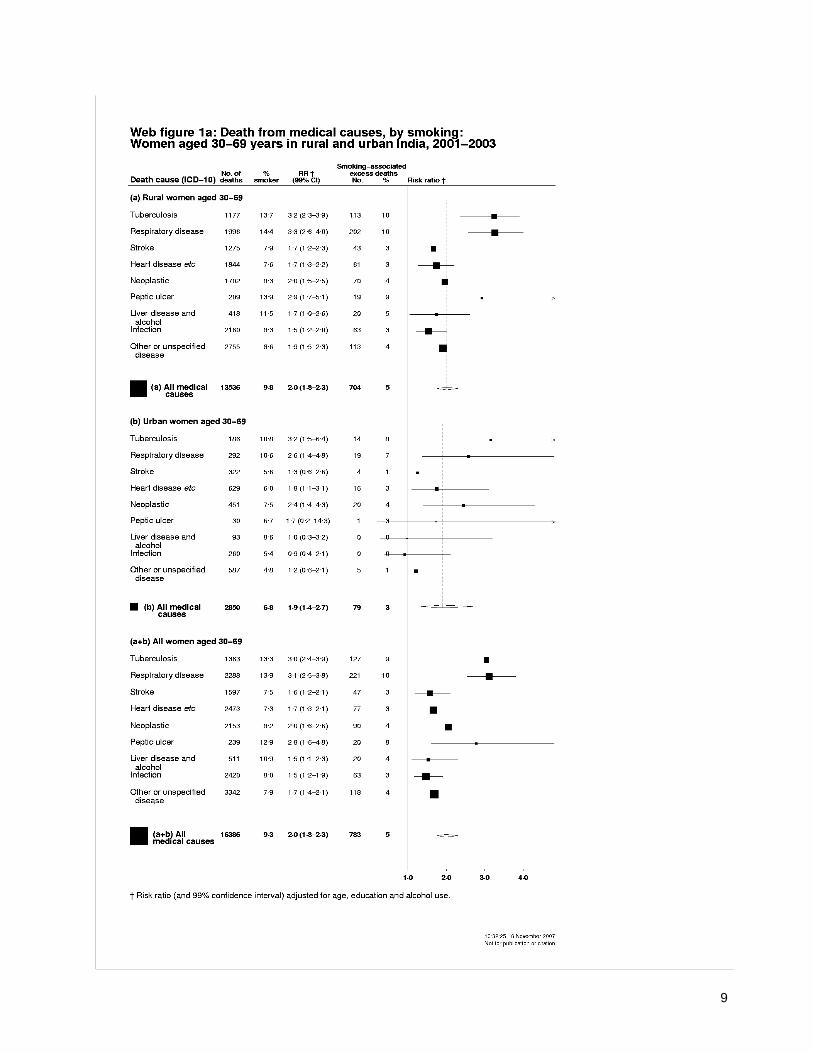
For women between the ages of 30 and 69 years, 9% of those who died from medical causes were smokers; 5% of control subjects were smokers (Table 2). The mortality risk ratio comparing smokers with nonsmokers was 2.0 (99% confi-dence interval [CI], 1.8 to 2.3), after adjustment for age, educational level, and use or nonuse of alco-hol. This mortality risk ratio corresponds to an ex-cess of 783 deaths among female smokers between the ages of 30 and 69 years, constituting 5% (99% CI, 4 to 6) of deaths from any medical cause in the study. Since further adjustment for status with re-spect to tobacco chewing, residence (urban or ru-ral), and religion did not substantially alter the risk ratios, all subsequent analyses were adjusted only for age, educational level, and use or nonuse of al-
cohol (see the Supplementary Appendix). For wom-en 70 years of age or older, the risk ratio was lower than that for women between the ages of 30 and 69 years, and the difference was not sig-nificant (risk ratio, 1.3; 99% CI, 0.9 to 1.7).
Among men between the ages of 30 and 69 years, 55% of those who died from any medical cause were smokers, as compared with only 37% of control subjects of similar ages (risk ratio, 1.7; 99% CI, 1.6 to 1.8). This risk ratio corresponds to an excess of 5751 deaths among male smok-ers between the ages of 30 and 69 years, constitut-ing 23% (99% CI, 21 to 24) of deaths from any medical cause in the study. The risk ratio was slightly lower among older men (1.6; 99% CI, 1.4 to 1.9).
underlying Causes of Death
Among women between the ages of 30 and 69 years, smokers accounted for 13% of those who died from tuberculosis (risk ratio, 3.0, 99% CI, 2.4 to 3.9) and 14% of those who died from respi-ratory disease (risk ratio, 3.1; 99% CI, 2.5 to 3.8). Among the 783 excess deaths of women that were associated with smoking, tuberculosis accounted for 127 (16%) and respiratory disease accounted for 221 (28%); the proportions were lower for stroke (6%) and heart disease (10%).
Among men in this age group, smokers ac-counted for 66% of those who died from tubercu-losis (risk ratio, 2.3; 99% CI, 2.1 to 2.6) and 60% of those who died from respiratory disease (risk ratio, 2.1; 99% CI, 1.9 to 2.3). Thus, of the 5751 smoking-related excess deaths from medical caus-es among men between the ages of 30 and 69 years, 1174 (20%) were from tuberculosis and 1078 (19%) were from respiratory disease. The risk ratio for death from stroke among men was 1.6 (99% CI, 1.4 to 1.8) and that for death from heart disease was also 1.6 (99% CI, 1.5 to 1.8), with deaths from heart disease accounting for 1102 of the smoking-associated excess deaths (19%) in men in this age group. Women and men who had smoked also had an increased risk of death from neoplastic disease and peptic ulcer.
relative risk in subgroups
Among women, the absolute number of deaths associated with smoking was too small to be sta-tistically reliable after stratification for location of residence (urban or rural), educational level, use or nonuse of alcohol, and level of tobacco use, even though no anomalies were apparent
Copyright © 2008 Massachusetts Medical Society. All rights reserved. Downloaded from www.nejm.org at HLTH SCIENCE INFO CONSORTIUM OF TORONTO on March 23, 2008 .

T h e n e w e ng l a nd j o u r na l o f m e dic i n e
n engl j med 358;11 www.nejm.org march 13, 20081140
(Fig. 2, and Fig. 1A and 1B of the Supplementary Appendix). Thus, the results for these subgroups are described here only for men.
For men between the ages of 30 and 69 years, the risk ratio for death from any medical cause
was slightly higher in urban areas (1.9) than in rural areas (1.6) (Fig. 2). The risk ratio for death from tuberculosis was also higher in urban areas (2.7) than in rural areas (2.3), but the difference was not significant (Fig. 1B of the Supplemen-
Table 1. Demographic Characteristics of the Subjects, According to Sex.*
Characteristic Women Men
Case Subjects (N = 33,069)
Control Subjects (N = 34,857)
Case Subjects (N = 41,054)
Control Subjects (N = 43,078)
percentAge
20–29 yr 6 18 5 21
30–39 yr 6 25 7 25
40–49 yr 7 23 11 23
50–59 yr 13 17 18 16
60–69 yr 24 12 26 9
≥70 yr 44 5 34 6
Residence
Rural 82 78 81 84
Urban 18 22 19 16
Educational level†
None completed 83 56 56 31
Primary or middle school 10 18 22 23
Secondary school or higher 6 25 21 45
Unknown 1 1 1 2
Religion
Hindu 82 82 82 83
Muslim 10 10 10 10
Other 7 8 7 6
Unknown 1 1 1 1
Chewing tobacco
Yes 15 8 25 21
No 83 90 71 76
Unknown 2 3 4 3
Alcohol consumption
Yes 4 3 27 16
No 94 95 70 82
Unknown 3 2 4 3
Smoking tobacco
Yes 9 4 51 32
No 91 96 49 68
* Among both men and women, all differences between case subjects and control subjects were significant (P<0.001), except for religion. Percentages may not total 100 because of rounding.
† “None completed” denotes either no formal education or no completion of primary school. Primary education was de-fined as the completion of grade 6, middle-school education as the completion of grade 9, and secondary-school edu-cation as the completion of grade 10.
Copyright © 2008 Massachusetts Medical Society. All rights reserved. Downloaded from www.nejm.org at HLTH SCIENCE INFO CONSORTIUM OF TORONTO on March 23, 2008 .

Effects of Smoking on Adult Mortality in India
n engl j med 358;11 www.nejm.org march 13, 2008 1141
tary Appendix). However, since the proportion of deaths from tuberculosis was lower in urban areas than in rural areas, tuberculosis accounted for only about 15% of the smoking-associated excess deaths in urban areas, as compared with 22% in rural areas. Conversely, heart disease (chief-ly acute heart attack) accounted for about 24% of smoking-associated excess deaths in urban areas, as compared with only about 18% in rural areas.
In a comparison of smokers and nonsmokers, the relative risk of death from any medical cause in men between the ages of 30 and 69 years was similar among those without primary education (1.6), those with primary or middle school edu-cation (1.7), and those with secondary or post-secondary education (1.7); the relative risk was the same among users of alcohol and nonusers of alcohol (1.6).
Most male subjects smoked only bidis, but some smoked only cigarettes, and there was a dose–response relationship between smoking and mortality among men who smoked only bidis (risk ratio for one to seven bidis per day, 1.3; risk ratio for eight or more, 2.2) and among those who smoked only cigarettes (risk ratio for one to seven cigarettes per day, 1.8; risk ratio for eight or more, 2.9; P<0.001 for both trends) (Table 3 of the Supplementary Appendix). Even among those who smoked only one to seven bidis per day (mean, four per day), the smoking-associated ex-cess deaths accounted for a quarter of all deaths from any medical cause (risk ratio, 1.3). Among those who smoked only one to seven cigarettes per day (mean, four per day), smoking-associated excess deaths accounted for almost half of deaths from any medical cause (risk ratio, 1.8).
Absolute risk
To help estimate absolute hazards, we used WHO estimates of Indian national death rates and an-nual numbers of deaths, subdivided according to 5-year age groups. Within each age group, our study provides the proportion of deaths from any medical cause; the relative risk of death from any medical cause among smokers, as compared with nonsmokers; and the prevalence of smoking among control subjects. The combination of these data with the WHO data yields for each age group the death rates for smokers and nonsmokers (ad-justed for any differences in educational level, alcohol use, or death from nonmedical causes) and the number of deaths that would have been
avoided if smokers had had the same death rates as nonsmokers of similar age, education, and use or nonuse of alcohol.
From these age-specific death rates among smokers and nonsmokers, we calculated the cu-mulative rate of death among subjects between the ages of 30 and 69 years (Fig. 3). These rates suggest that about 62% of female smokers who were 30 years of age will die before the age of 70, as compared with only 38% of otherwise similar nonsmokers (absolute difference, 24 per-centage points) (Fig. 3A). A substantial hazard was evident even before the age of 50 years: 15% of female smokers will die between the ages of 30 and 49 years, as compared with only 7% of nonsmokers. The median ages at death suggest-ed that female smokers will die an average of approximately 8 years (99% CI, 5 to 11) earlier than their nonsmoking counterparts. Likewise, about 61% of male smokers who were 30 years of age will die before the age of 70 years, as compared with 41% of otherwise similar male nonsmokers (absolute difference, 20%) (Fig. 3B). The median ages at death suggested that male smokers will die an average of approximately 6 years (99% CI, 5 to 7) earlier than their non-smoking counterparts. Again, a substantial haz-ard was evident before the age of 50 years: 15% of male smokers, as compared with 9% of male non-smokers, will die between the ages of 30 and 49 years. Figure 2 of the Supplementary Appendix
22p3
45
Prev
alen
ce o
f Sm
okin
g (%
) 35
40
30
25
15
10
5
20
015–19 20–24 25–29 30–34 35–39 40–44 45–49 50–54 55–59 60–64 65–69
Men
Women
Age (yr)
AUTHOR:
FIGURE:
JOB:
4-CH/T
RETAKE
SIZE
ICM
CASE
EMail LineH/TCombo
Revised
AUTHOR, PLEASE NOTE: Figure has been redrawn and type has been reset.
Please check carefully.
REG F
Enon
1st
2nd
3rd
Jha
1 of 3
03-13-08
ARTIST: ts
35811 ISSUE:
Figure 1. Prevalence of Smoking in India, According to Age and Sex.
The I bars represent 99% confidence intervals.
Copyright © 2008 Massachusetts Medical Society. All rights reserved. Downloaded from www.nejm.org at HLTH SCIENCE INFO CONSORTIUM OF TORONTO on March 23, 2008 .

T h e n e w e ng l a nd j o u r na l o f m e dic i n e
n engl j med 358;11 www.nejm.org march 13, 20081142
Table 2. Death from Any Medical Cause and Rate of Smoking among Women and Men, Stratified According to Particular Underlying Cause of Death for Subjects between the Ages of 30 and 69 Years.*
Age Group and Underlying Cause of DeathNo. of Deaths
Proportion Who Smoked
Risk Ratio (99% CI)†
Smoking-Associated Excess Deaths
% no. (%)
Women
Age 20–29 yr, any medical cause 2,070 3 1.5 (1.0–2.4) 20 (1)
Age 30–69 yr
Tuberculosis 1,363 13 3.0 (2.4–3.9) 127 (9)
Respiratory disease 2,288 14 3.1 (2.5–3.8) 221 (10)
Stroke 1,597 8 1.6 (1.2–2.1) 47 (3)
Heart disease 2,473 7 1.7 (1.3–2.1) 77 (3)
Neoplastic disease 2,153 8 2.1 (1.6–2.6) 90 (4)
Peptic ulcer 239 13 2.8 (1.6–4.8) 20 (8)
Liver disease and alcohol 511 11 1.5 (1.1–2.3) 20 (4)
Infection 2,420 8 1.5 (1.2–1.9) 63 (3)
Other or unspecified disease 3,342 8 1.7 (1.4–2.1) 118 (4)
Age 30–69 yr, any medical cause 16,386 9 2.0 (1.8–2.3) 783 (5)
Age ≥70 yr, any medical cause 14,613 8 1.3 (0.9–1.7) 281 (2)
Men
Age 20–29 yr, any medical cause 1,841 29 1.2 (1.0–1.5) 88 (5)
Age 30–69 yr
Tuberculosis 3,119 66 2.3 (2.1–2.6) 1174 (38)
Respiratory disease 3,487 60 2.1 (1.9–2.3) 1078 (31)
Stroke 2,200 53 1.6 (1.4–1.8) 423 (19)
Heart disease 5,409 52 1.6 (1.5–1.8) 1102 (20)
Neoplastic disease 2,248 59 2.1 (1.9–2.4) 709 (32)
Peptic ulcer 397 61 1.9 (1.4–2.5) 111 (28)
Liver disease and alcohol 1,596 63 1.6 (1.4–1.9) 389 (24)
Infection 2,842 51 1.3 (1.2–1.5) 366 (13)
Other or unspecified disease 3,992 48 1.3 (1.1–1.4) 399 (10)
Age 30–69 yr, any medical cause 25,290 55 1.7 (1.6–1.8) 5751 (23)
Age ≥70 yr, any medical cause 13,923 45 1.6 (1.4–1.9) 2328 (17)
* Causes of death were defined according to the following codes from the International Classification of Diseases, 10th Revision (with the exclusion of codes related to deaths from maternal causes or injury): tuberculosis (A15-19, B90) includes respi-ratory and other tuberculosis; respiratory disease (J00-99) is chiefly chronic obstructive pulmonary disease, asthma, and pneumonia; stroke (I60-69, G81-83) includes subarachnoid hemorrhage; heart disease (I00-59, I70-99, R96) includes all vascular disease and sudden death except stroke and is mostly directly or indirectly due to ischemic heart disease; neo-plastic disease (C00-D48) includes malignant and benign neoplasms; peptic ulcer (K25-31) includes gastric and duodenal ulcer and gastritis; liver disease and alcohol (K70-77, B15-19, F10, R17-18, X45, X65, Y15, Y90-91) includes cirrhosis, hepa-titis, jaundice, ascites, alcoholism, and alcohol poisoning; infection (rest of A and B, G00-09, R50) includes fever of un-known origin (R50, 18% of this subgroup) and inflammatory central nervous system disease but excludes other respiratory infection, tuberculosis, and hepatitis; other or unspecified disease (all of codes A–N and P–R except for the abovementioned disorders) includes completely ill-defined disorders (R99, 19% of this subgroup) and diabetes but excludes maternal deaths (O) and all deaths from injury (codes V–Y). Percentages may not total 100 because of rounding.
† Risk ratios comparing smokers with nonsmokers were adjusted for age, educational level, and use or nonuse of alcohol.
Copyright © 2008 Massachusetts Medical Society. All rights reserved. Downloaded from www.nejm.org at HLTH SCIENCE INFO CONSORTIUM OF TORONTO on March 23, 2008 .

Effects of Smoking on Adult Mortality in India
n engl j med 358;11 www.nejm.org march 13, 2008 1143
provides estimates of absolute risks of death for smokers and nonsmokers for three major causes of death: respiratory disease, heart disease, and tuberculosis.
Estimated national Mortality in 2010
Table 3 provides estimates of the numbers of adult deaths in India for 2010 and the numbers that would be avoided if smokers had the same rate of death as otherwise similar nonsmokers. These 2010 projections assume that as the population grows, the age-specific distributions of the under-lying causes of death and of the proportions associ-ated with smoking will be similar over the next few years to those suggested by this study. Among
women between the ages of 30 and 69 years, the excess number of deaths associated with smoking will be approximately 5% (99% CI, 4 to 6) of all deaths. Among men in this age group, the excess will be 20% (99% CI, 19 to 22) of all deaths. This proportion differs from the 23% shown in Table 2 and Figure 2, since deaths from injuries were ex-cluded from those denominators. The excess num-ber of deaths among adult smokers in 2010 will be about 930,000, including 580,000 deaths among men and 90,000 deaths among women between the ages of 30 and 69 years. Because of population growth, the annual number of smoking-associ-ated deaths among adults will be about 1 million during the 2010s.
36p6
1.0 2.0 3.0
Women
Residence
Rural
Urban
Education
None completed
Primary or middle school
Secondary school or higher
Unknown
Alcohol use
No
Yes
Unknown
TotalMen
Residence
Rural
Urban
Education
None completed
Primary or middle school
Secondary school or higher
Unknown
Alcohol use
No
Yes
Unknown
Total
Risk RatioRisk Ratio (99% CI)No. ofDeathsCategory
1.9 (1.4–2.7)
1.6 (1.5–1.8)
2.2 (1.7–2.9)1.7 (1.6–1.8)
1.7 (1.6–1.9)
1.7 (1.5–1.8)
1.2 (0.8–1.9)
1.6 (1.5–1.7)
1.6 (1.5–1.7)
1.9 (1.6–2.1)1.6 (1.6–1.8)
1.2 (0.7–2.0)
2.0 (1.8–2.3)
1.5 (1.1–2.0)2.2 (1.9–2.5)
2.4 (0.8–7.2)
1.8 (1.1–2.9)
2.2 (1.5–3.4)2.0 (1.7–2.3)
2.0 (1.8–2.3)13,536
2,850
13,236
1,837
1,145
168
15,202
767
417
16,386
20,150
5,140
13,359
5,836
5,781
314
16,047
8,345
898
25,290
Proportionof Smokers
9.8
6.8
10.2
5.8
4.9
8.9
7.5
41.6
16.6
9.3
56.4
51.3
58.2
56.8
47.8
47.8
44.0
75.7
68.5
55.4
Smoking-AssociatedExcess Deaths
5
3
5
3
2
5
4
14
3
5
23
23
22
23
20
7
17
30
37
23
704
79
678
58
25
9
621
106
12
783
4574
1177
2945
1318
1147
23
2731
2466
335
5751
AUTHOR:
FIGURE:
JOB:
4-CH/T
RETAKE
SIZE
ICM
CASE
EMail LineH/TCombo
Revised
AUTHOR, PLEASE NOTE: Figure has been redrawn and type has been reset.
Please check carefully.
REG F
Enon
1st
2nd3rd
Jha
2 of 3
03-13-08
ARTIST: ts
35811 ISSUE:
no. %%
Figure 2. Risk of Death from Any Medical Cause among Smokers, as Compared with Nonsmokers, between the Ages of 30 and 69 Years.
Risk ratios for residence (urban or rural) were adjusted for age, educational level, and use or nonuse of alcohol; those for educational level were adjusted for age and use or nonuse of alcohol; those for alcohol use or nonuse were adjusted for age and educational level. Subjects for whom data were missing were excluded from the analysis. Horizontal bars represent 99% confidence intervals, and vertical dashed lines and diamonds indicate the overall mortality risk ratios. The area of each square is inversely proportional to the variance of the logarithm of the risk ratio, so a large square corresponds to a short confidence interval.
Copyright © 2008 Massachusetts Medical Society. All rights reserved. Downloaded from www.nejm.org at HLTH SCIENCE INFO CONSORTIUM OF TORONTO on March 23, 2008 .

T h e n e w e ng l a nd j o u r na l o f m e dic i n e
n engl j med 358;11 www.nejm.org march 13, 20081144
Discussion
In this large, nationally representative case–con-trol study, we found that in both rural and urban India, among men between the ages of 30 and 69 years, the rate of death from any medical cause in smokers was 1.7 times that in nonsmokers of
similar age, educational level, and alcohol status (use or nonuse). Among female smokers, mortal-ity from any medical cause was double that among their nonsmoking counterparts. Most of the ex-cess mortality was from tuberculosis or from re-spiratory, vascular, or neoplastic disease.
Although the hazard associated with any smok-ing (even only a few bidis a day) was substantial, the hazard of cigarette smoking (risk ratio, 2.2) was even higher and corresponded to more than a doubling of the risk of death in middle-aged men, suggesting about a 10-year gap in median survival between cigarette smokers and nonsmok-ers. Such risks are similar to those seen in a study in the United Kingdom in which most of the male smokers had been smoking substantial numbers of cigarettes since about 18 years of age.21 We could not study smoking cessation, since quitting is uncommon in India18 and often occurs only after a smoker becomes ill. However, studies elsewhere have shown that cessation can substantially reduce a smoker’s risk.21,22
Although the assessment of smoking-asso-ciated risks for women is subject to more uncer-tainty, the risk of smoking among women ap-pears to be at least as large as that for men. For both sexes, such extreme risks in India are sur-prising,7 since the age at which persons gener-ally start smoking is older23 and the amount that is smoked per person is lower5 than in Europe or North America; India also appears to have a rela-tively low rate of lung cancer.9 Indeed, in our study, the number of smoking-associated deaths from tuberculosis was more than 10 times the number of smoking-associated deaths from lung cancer. These high overall risks reflect the high back-ground rates of death from tuberculosis, respira-tory disease, and heart disease among nonsmok-ers in India.
Our study has some limitations. First, differ-ences between case subjects and control subjects, in factors other than the few variables that we measured, may have affected the relative risks. Second, tobacco use and alcohol use are strongly correlated, so residual confounding by the use of alcohol could explain some of the excess mortal-ity among smokers. However, the relative risk of death from any medical cause among smokers, as compared with nonsmokers, was similar when analyses were restricted to those who did not drink alcohol. Third, verbal-autopsy meth-ods misclassify the underlying causes of some
22p3
70
Cum
ulat
ive
Prob
abili
ty o
f Dea
th (%
)
60
40
30
10
50
20
030 40 50 60 70
Smokers
Nonsmokers
Smokers
Nonsmokers
Age (yr)
B Men
A Women
AUTHOR:
FIGURE:
JOB:
4-CH/T
RETAKE
SIZE
ICM
CASE
EMail LineH/TCombo
Revised
AUTHOR, PLEASE NOTE: Figure has been redrawn and type has been reset.
Please check carefully.
REG F
Enon
1st2nd
3rd
Jha
3 of 3
03-13-08
ARTIST: ts
35811 ISSUE:
70
Cum
ulat
ive
Prob
abili
ty o
f Dea
th (%
)
60
40
30
10
50
20
030 40 50 60 70
Age (yr)
15
33
7
17
62
38
15
33
61
41
20
9
6Yr
8Yr
Figure 3. Cumulative Probability of Death from Any Cause among Smokers and Nonsmokers between the Ages of 30 and 69 Years.
All values have been adjusted for age, educational level, and use or nonuse of alcohol in estimates for women (Panel A) and men (Panel B).
Copyright © 2008 Massachusetts Medical Society. All rights reserved. Downloaded from www.nejm.org at HLTH SCIENCE INFO CONSORTIUM OF TORONTO on March 23, 2008 .

Effects of Smoking on Adult Mortality in India
n engl j med 358;11 www.nejm.org march 13, 2008 1145
deaths.12-14,16,17 Although a more precise classifi-cation of the underlying disease responsible for each death would probably sharpen the findings by increasing the risk ratios for some conditions and decreasing it for others, it would have little effect on the risk ratio for the aggregate of all diseases. Fourth, we did not have information on the smoking status of people who were home-less or living alone when they died; overall, we obtained information on smoking for only 88% of all enumerated deaths. However, persons who were homeless or living alone were also excluded from the control subjects. Finally, the tendency of smokers to live with other smokers could have inflated the rates of smoking among control sub-jects. In addition, control subjects were self-select-ed by their willingness to be interviewed. How-ever, we had few refusals, and the age-specific prevalence of smoking among control subjects was reasonably similar to that in recent indepen-dent, nationally representative surveys.18,24 Dif-ferential reporting of the daily amount smoked between case subjects and control subjects could have distorted the dose–response relationships,
but the overall hazards associated with smoking should not be increased, since it is unlikely that many deceased nonsmokers were misreported as having been smokers.
Previous studies of men in India6-9,25-27 and of men and women elsewhere21,28-31 have provided reasonably robust evidence that smoking can ac-tually cause various types of respiratory, vascular, and neoplastic disease — in other words, that smoking increases the risk of developing such diseases in the near future among otherwise similar people of a given age. Hence, it is reason-able to conclude that the observed association between excess mortality and such diseases after adjustment for age and use or nonuse of alcohol was mostly causal, especially since the relative risks were not materially altered by adjustment for educational level or by restriction of the analyses to persons who did not consume alcohol. In con-trast, the association between smoking and death from liver disease (which is greatly reduced after adjustment for use or nonuse of alcohol) is prob-ably largely or wholly due to the tendency of ha-bitual drinkers to smoke tobacco.
Table 3. Estimate of the Excess Number of Deaths Associated with Smoking among Indian Adults in 2010, According to Age, Sex, and Underlying Cause of Death.*
Age Group and Underlying Cause of Death Excess Deaths Associated with Smoking (in thousands)
Women Men
no./total no. % no./total no. %
Age 20–29 yr, any cause 2/280 1 9/319 3
Age 30–69 yr†
Tuberculosis 14/155 9 120/315 38
Respiratory disease 26/259 10 109/353 31
Stroke 5/182 3 42/223 19
Heart disease 8/281 3 110/548 20
Neoplastic disease 9/228 4 67/211 32
Peptic ulcer 2/27 8 11/40 28
Other medical cause‡ 29/729 4 120/851 14
Injury§ 0/141 0 0/341 0
Any cause 93/2002 5 579/2882 20
Age ≥70 yr, any cause 33/1735 2 219/1628 13
Total (age ≥20 yr), any cause 128/4017 3 807/4829 17
* Data regarding cause-specific total numbers of deaths have been adjusted according to the total number of deaths from any cause on the basis of predictions by the World Health Organization for 2010.2 Some percentages reflect the use of rounded numerators and denominators.
† Codes from the International Classification of Diseases, 10th Revision,15 are listed in Table 2.‡ Maternal deaths were included but none were attributed to smoking.§ Deaths from fires or accidents were included, but none were attributed to smoking.
Copyright © 2008 Massachusetts Medical Society. All rights reserved. Downloaded from www.nejm.org at HLTH SCIENCE INFO CONSORTIUM OF TORONTO on March 23, 2008 .

T h e n e w e ng l a nd j o u r na l o f m e dic i n e
n engl j med 358;11 www.nejm.org march 13, 20081146
Tuberculosis is a special case because the tu-bercle bacillus is obviously a cause of all deaths from tuberculosis. Nevertheless, smoking could also be a cause of many of the deaths from tu-berculosis. Subclinical infection is widespread,32,33 and smoking could facilitate progression to clini-cal disease.6 If so, smoking might also contrib-ute to the spread of tuberculosis to others.
If the associations we observed in our study were mostly causal, we estimate that smoking will cause about 930,000 deaths in 2010 in India. Of these deaths, about 580,000 among men and 90,000 among women will occur between the ages of 30 and 69 years (about 1 in 20 deaths from any cause among women and 1 in 5 deaths from any cause among men in this age group). The excess mortality among smokers in India will account for much of the gap between male and female mortality in middle age.
Because of population growth, the absolute numbers of deaths are rising by about 3% per year among persons between the ages of 30 and 69 years and by a higher rate among persons who are older.2 During the 2010s, therefore, the an-
nual number of deaths from smoking in India will be about 1 million, which is similar to the annual number in China.34 Of the million annual deaths from smoking in India, approximately 70% (100,000 among women and 600,000 among men) will occur in middle age, rather than old age.
Supported by grants from the John E. Fogarty International Center of the National Institutes of Health (R01-TW05991–01 and TW007939-01, to Dr. Jha; and R01-TW05993-02, to Dr. Peto); the Canadian International Development Research Centre (102172); the Canadian Institute of Health Research (IEG-53506); the Li Ka Shing Knowledge Institute and Keenan Research Centre (to Dr. Jha); Cancer Research UK and the United Kingdom Medical Re-search Council (to Dr. Peto); and the Canada Research chair pro-gram (to Dr. Jha).
No potential conflict of interest relevant to this article was reported.
The opinions expressed in this article are those of the authors and do not necessarily represent those of the Government of India or the Office of the Registrar General.
We thank the Office of the Registrar General for the produc-tive collaboration on the Million Death Study; K.T. Shenoy for hosting a meeting in January 2004 to plan the survey of deaths; J. Moore for assistance with the Web-based physician-coding system; D. Corsi, J. Godwin, and W. Suraweera for their expert assistance with the tables and figures; C. Mathers and A.D. Lopez for providing WHO estimates of mortality; and D. Bassani, H. Gelband, and A.S. Slutsky for their helpful comments on the manuscript.
References
Jha P. Avoidable mortality in India: past progress and future prospects. Natl Med J India 2002;15:Suppl 1:32-6.
Lopez AD, Mathers CD, Ezzati M, Jamison DT, Murray CJL, eds. Global bur-den of disease and risk factors, New York and Washington. New York: Oxford Uni-versity Press, 2006.
Special fertility and mortality survey, 1998: a report on 1.1 million homes. New Delhi, India: Registrar-General of India, 2005.
Rani M, Bonu S, Jha P, Nguyen SN, Jamjoum L. Tobacco use in India: preva-lence and predictors of smoking and chew-ing in a national cross sectional house-hold survey. Tob Control 2003;12(4):e4.
Gupta PC. Survey of sociodemograph-ic characteristics of tobacco use among 99,598 individuals in Bombay, India using handheld computers. Tob Control 1996; 5(2):114-20.
Gajalakshmi V, Peto R, Kanaka TS, Jha P. Smoking and mortality from tuberculo-sis and other diseases in India: retrospec-tive study of 43 000 adult male deaths and 35 000 controls. Lancet 2003;362:507-15.
Gupta PC, Mehta HC. Cohort study of all-cause mortality among tobacco users in Mumbai, India. Bull World Health Or-gan 2000;78:877-83.
Pednekar MS, Gupta PC. Prospective study of smoking and tuberculosis in India. Prev Med 2007;44:496-8.
1.
2.
3.
4.
5.
6.
7.
8.
Gajalakshmi CK, Ravichandran K, Shanta V. Tobacco-related cancers in Ma-dras, India. Eur J Cancer Prev 1996;5:63-8.
Sample registration system, statistical report: 2004. New Delhi, India: Registrar-General of India, 2005.
Jha P, Kumar R, Vasa P, Dhingra N, Thiruchelvam D, Moineddin R. Low female-to-male sex ratio of children born in India: national survey of 1.1 million households. Lancet 2006;367:211-8. [Erratum, Lancet 2006;367:1730.]
Jha P, Gajalakshmi V, Gupta PC, et al. Prospective study of one million deaths in India: rationale, design, and validation results. PLoS Med 2006;3(2):e18.
Sinha DN, Dikshit R, Kumar V, et al. Technical document VII: Health care pro-fessional’s manual for assigning causes of death based on RHIME household reports. Toronto: University of Toronto, 2006. (Ac-cessed January 30, 2008, at http://www.cghr.org/project.htm.)
Gajalakshmi V, Peto R, Kanaka S, Bal-asubramanian S. Verbal autopsy of 48 000 adult deaths attributed to medical causes in Chennai (formerly Madras), India. BMC Public Health 2002;2:7.
International classification of diseas-es and related health problems, 10th rev.: ICD-10. Geneva: World Health Organiza-tion, 1992.
Kumar R, Thakur J, Rao BT, Singh MM, Bhatia SP. Validity of verbal autopsy
9.
10.
11.
12.
13.
14.
15.
16.
in determining causes of adult deaths. In-dian J Public Health 2006;50:90-4.
Joshi R, Cardona M, Iyengar S, et al. Chronic diseases now a leading cause of death in rural India — mortality data from the Andhra Pradesh Rural Health Initia-tive. Int J Epidemiol 2006;35:1522-9.
Sample registration system, baseline report of 2004. New Delhi, India: Regis-trar-General of India, 2007.
Mari Bhat PN. Completeness of India’s sample registration system: an assessment using the general growth balance method. Popul Stud (Camb) 2002;56:119-34.
Sivanandan V. An assessment of the completeness of death registration in India over the periods 1975-78 and 1996-99 under the generalized population model: an analysis based on SRS data. Mumbai, India: International Institute for Popula-tion Sciences, 2004.
Doll R, Peto R, Boreham J, Sutherland I. Mortality in relation to smoking: 50 years’ observations on male British doctors. BMJ 2004;328:1519-33.
The hazards of smoking and the ben-efits of stopping. In: Dresler C, Leon M. IARC handbooks of cancer prevention. Tobacco control. Vol. 11. Reversal of risk after quitting smoking. Lyon, France: Inter-national Agency for Research on Cancer, 2007:15-27.
Jha P, Ranson MK, Nguyen SN, Yach D. Estimates of global and regional smoking
17.
18.
19.
20.
21.
22.
23.
Copyright © 2008 Massachusetts Medical Society. All rights reserved. Downloaded from www.nejm.org at HLTH SCIENCE INFO CONSORTIUM OF TORONTO on March 23, 2008 .

Effects of Smoking on Adult Mortality in India
n engl j med 358;11 www.nejm.org march 13, 2008 1147
prevalence in 1995, by age and sex. Am J Public Health 2002;92:1002-6.
International Institute for Population Sciences and Macro International. Nation-al Family Health Survey-3 (2005-6), IIPS, Mumbai, India, 2007. (Accessed January 30, 2008, at http://www.nfhsindia.org/volume_2.html.)
Teo KK, Ounpuu S, Hawken S, et al. Tobacco use and risk of myocardial infarc-tion in 52 countries in the INTERHEART study: a case-control study. Lancet 2006; 368:647-58.
Pais P, Fay MP, Yusuf S. Increased risk of acute myocardial infarction associated with beedi and cigarette smoking in In-dians: final report on tobacco risks from a case-control study. Indian Heart J 2001; 53:731-5.
Rastogi T, Jha P, Reddy KS, et al. Bidi and cigarette smoking and risk of acute
24.
25.
26.
27.
myocardial infarction among males in ur-ban India. Tob Control 2005;14:356-8.
Office of the Surgeon General. The health consequences of smoking: a report of the Surgeon General. Washington, DC: Department of Health and Human Ser-vices, May 27, 2004. (Accessed January 30, 2008, at http://www.surgeongeneral.gov/library/smokingconsequences.)
Peto R, Lopez AD, Boreham J, Thun M, Heath C Jr. Mortality from smoking in developed countries, 1950–2000: indirect estimates from national vital statistics. Oxford, England: Oxford University Press, 1994.
Peto R, Lopez AD, Boreham J, Thun M. Mortality from smoking in developed countries, 1950-2000. 2nd ed. (Accessed January 30, 2008, at http://www.ctsu.ox.ac.uk/~tobacco/.)
IARC monographs on the evaluation
28.
29.
30.
31.
of the carcinogenic risks of chemicals to humans. Vol. 83. Tobacco smoke and in-voluntary smoking. Lyon, France: Interna-tional Agency for Research on Cancer, 2004.
Ministry of Health and Family Wel-fare. TB India 2007, RNTCP status report. (Accessed January 30, 2008, at http://www.tbcindia.org/pdfs/TB%20India%202007.pdf.)
Bates MN, Khalakdina A, Pai M, Chang L, Lessa F, Smith KR. Risk of tuberculosis from exposure to tobacco smoke: a sys-tematic review and meta-analysis. Arch Intern Med 2007;167:335-42.
Liu BQ, Peto R, Chen ZM, et al. Emerg-ing tobacco hazards in China. 1. Retro-spective proportional mortality study of one million deaths. BMJ 1998;317:1411-22.Copyright © 2008 Massachusetts Medical Society.
32.
33.
34.
Copyright © 2008 Massachusetts Medical Society. All rights reserved. Downloaded from www.nejm.org at HLTH SCIENCE INFO CONSORTIUM OF TORONTO on March 23, 2008 .
Supplementary Appendix
This appendix has been provided by the authors to give readers additional information about their work.
Supplement to: Jha P, Jacob B, Gajalakshmi V, et al. A nationally representative case–control study of smoking and death in India. N Engl J Med 2008;358:1137-47. DOI: 10.1056/NEJMsa0707719.

Part I. Additional details of methods Nationally representative study sample The Registrar-General of the Government of India has, in every decade since the 1970s, conducted a nationwide Sample Registration System (SRS) in which several thousand small areas are chosen, based on the preceding census, to be randomly representative of the whole population (10). The 1993 SRS sample, which is the subject of the present study, included 1.1 million homes in 6671 areas (4436 rural, 2235 urban: mean 165 homes [and about 1000 persons] per area). For the next decade (1994-2003), a part-time enumerator living in each area recorded all births and deaths in that area every month, and 800 full-time SRS (non-medical) supervisors independently collected the same information every six months (3, 10-11). Each home in the 1993 SRS sample where a death had been recorded in 2001-3 was to be visited in 2004-5 by an SRS supervisor to collect narrative information about cause of death, smoking, drinking and educational status. This study of the 2001-3 deaths is the first phase of the “Million Death Study”, which will eventually study about 0.35 million childhood and adult deaths during 1997-2003 retrospectively and 0.65 million during 2004-2014 prospectively (12). The underlying causes of all deaths were sought by an enhanced version, “RHIME” (13-14), of a verbal autopsy. Verbal autopsy is a structured investigation of the train of events, circumstances, symptoms and signs of illness leading to death through an interview of relatives or associates of the deceased. This particular verbal autopsy technique had initially been developed for adult mortality in the southern Indian state of Tamil Nadu (6, 14). Nearly 900 (mainly non-medical) field interviewers (800 SRS supervisors and 100 re-sampling staff) were trained to record a narrative of the symptoms, signs and key circumstances leading to death, including a brief descriptive narrative in the local language of the main events, and of any relevant treatments. The mean time between the 2001-3 death and the RHIME interview was 2.1 years (range 0.5-3.9 years). A random sample of about 10% of the areas was re-surveyed independently, generally with consistent results, and the RHIME methods, quality control checks and validation results have been published (12-14, 16-17). Medical assignment of underlying causes of death Causes of death were assigned independently by two physicians who examined scanned images of the written field reports in the local language (eg, Telugu), using a web-based system (12-13) without access to the history of tobacco or alcohol use. If they did not agree on the three-digit ICD-10 (15) code of the underlying cause, their forms were re-assigned to each other (anonymously) for reconciliation. Continuing disagreements were adjudicated by a senior physician. As of October 2007, 82% of the 74 123 deaths had been coded by at least two physicians and 18% by one. The second coding changed the cause in only 4% of the cases, so we have analyzed all single- or double-coded deaths together. A probable cause (ie, excluding ill-defined causes and “senility” [ICD-10 code R54]) was assigned to 91% of the deaths at ages 20-69 and to 71% of those at older ages.
2

Definitions of smoking and of cases and controls The field teams asked a respondent (typically a household member) if the dead person had been a smoker within the last 5 years and, if so, the usual number of bidis and/or cigarettes per day. Cessation of smoking is uncommon in India (5, 18), except when illness leads to quitting. Thus, the key comparisons are of ever versus never smoking within the last 5 years. Questions were also asked about other tobacco smoked, quid chewing, alcohol drinking and years of education. Adult respondents were asked similar questions about themselves. Potential cases were all adults aged 20 years or more whose death during 2001-3 had been recorded in the earlier SRS field work. Of these enumerated deaths, approximately 12.1% could not be studied, chiefly because of out-migration. We had encoded a total of 36 779 female and 47 591 male deaths by October 31, 2007. Of these, 2685 female and 5338 male deaths were excluded from the analyses as they were from non-medical or from maternal causes, a further 1014 women (3%) and 1187 men (3%) were excluded because of missing information on whether they had smoked in the past 5 years and 11 women and 12 men were excluded because of missing address, yielding 33 069 female and 41 054 male cases. Potential controls (who were not individually matched to the cases) were the adult respondents who were living in the same house as a person whose death they were describing, irrespective of whether that death qualified as a case, and provided information on whether they had smoked in the past 5 years. Controls were not matched within households to cases. Thus, they do not control for household. However, they were approximately matched within areas (as the total number of deaths in an area determined the number of controls from that area). There were 36 076 women and 44 560 men available as controls, of whom 1219 women (3%) and 1482 men (3%) were excluded due to missing smoking information, leaving 34 857 female and 43 078 male unmatched controls. Of these, only 11 486 (33%) of the females and 4912 (11%) of the males had been married to the person who had died in 2001-3. The age-standardized, sex-specific prevalences of smoking, drinking and education were similar among controls who had and who had not been married to such a person (data not shown). Statistical methods Women and men were analyzed separately. Controls are not matched to particular cases, so the control group remains the same when studying different underlying causes of death. Controls are, on average, younger than cases, but the major analyses use logistic regression to adjust for age (five-year age groups), education (no education [defined as no formal education or not completing primary school]; primary or middle; grade 10 or higher; unknown) and alcohol use (yes; no; unknown). For each age range, the number of deaths associated with smoking was calculated by multiplying the overall number of deaths among smokers by 1-1/RR, where RR is the risk ratio (adjusted for age, education and alcohol use). Additional adjustment for other variables did not change the results significantly: among women aged 30-69, the smoker: non-smoker RR for deaths from all medical causes [and its 99% confidence interval] was 2.2 [1.9-2.5] with adjustment for age and alcohol, 2.0 [1.8-2.3] after further adjustment for education and 1.95 [1.73-2.21] after further adjustment for chewing. The comparable smoker: non-
3

smoker RRs for deaths from all medical causes among men aged 30-69 years were 1.8 [1.7-1.9] with adjustment for age and alcohol, 1.7 [1.6-1.8] after further adjustment for education and 1.66 [1.57-1.74] after further adjustment for chewing. For both sexes, further adjustment for geographic location or religion did not materially alter the RRs. For each RR, attributable fractions were calculated by the formula P (RR-1)/RR, where P is the prevalence of smoking among cases and RR is the age, education and alcohol use adjusted relative risk. The 99% CIs for these attributable fractions are based only on the variance in the RR, as the contribution from the variance in the proportions of smokers was negligible (data not shown). The terms risk ratio and relative risk are used interchangeably. All reported p-values are 2-sided. Deaths at ages 30-69 years are presented separately because: (i) deaths at these ages involve substantially more years of life lost than deaths at older ages; (ii) the assignment of underlying causes of death is substantially more reliable at ages 30-69 years than at older ages (12, 14-16) and; (iii) the main effects of smoking on mortality occur after age 25 years (the approximate median age of onset of smoking among men in India; 4). The SRS enumeration of individual deaths slightly underestimates overall Indian adult mortality rates (19-20) and, in addition, our survey missed about 12% of the enumerated deaths. Thus, to estimate absolute death rates and cumulative mortality risks at ages 30-69 from various groups of underlying causes (unaffected by under-enumeration and by the deaths we missed), we estimate the absolute rates of death from those causes in India as a whole from the World Health Organization (WHO; 2) estimates of age-specific mortality (irrespective of cause), applying to them the age-specific, cause-specific proportions for the major groups of underlying causes of death in our study. To help estimate absolute hazards, we used WHO estimates of the mortality rates and numbers of deaths, sub-divided by 5-year age groups. Within each age group, our study provides the proportion of deaths from all medical causes (eg, about 90%); the smoker vs non-smoker relative risk for all medical deaths; and the control smoking prevalence. Combination of these with the WHO data yields for each age group: (i) the overall smoker and non-smoker death rates, adjusted for any differences in education, alcohol or non-medical mortality, and (ii) the national number of deaths avoidable if smokers had the same medical mortality as nonsmokers of similar age, education and alcohol use. In any one particular 5-year age group (eg, 45-49 years), the non-smoker death rate from a particular disease category or categories (as above) is obtained by dividing the national death rate from that disease category/categories by 1+p(RR-1), where p is the prevalence of smoking among the controls in that age group and RR is the risk ratio (ever versus never smoker, adjusted for education and alcohol use) in that age group; the smoker death rate is then RR times this. Let d denote the sum of the all-cause mortality rates (per 1000 person-years) in each of the 5-year age groups from the start to the end of a given age range (eg, 30-69 years). The probability of dying from medical and non-medical causes in that age range is then 1-exp(-5d/1000). This yields graphs of all-cause mortality versus age for smokers and nonsmokers. The same formula can be used for mortality from specific causes in the hypothetical absence of other diseases. These are presented in Part II of this Supplementary Appendix for mortality at ages 30-69 from three
4
major groups of causes of death: heart disease, tuberculosis and respiratory disease. (If cumulative risks over the 40-year age range of 30-69 years were to be presented instead, the results would be similar. For example, a 40-year mortality risk of 20% would correspond to a 40-year cumulative mortality risk of 22%, etc.) The error bars in figure 3 (and in Part II of this Supplementary Appendix) combine conservatively the uncertainties in the relative risk and in the prevalence of smoking. As an upper bound they combine the upper confidence limits for the RR and for the control prevalence of smoking, and as a lower bound they combined the corresponding lower confidence limits. Although this exaggerates the purely statistical uncertainty, it does so only slightly as the contribution from the variation in the control prevalence of smoking is relatively unimportant.
5

Part II. Additional Results (Webtables 1-3, Webfigures 1-2): Webtable 1. Effects of standardization to ages 30-69 years* on characteristics on the subjects according to sex:
WOMEN MEN Characteristic Cases
n=33 069 % (*)
Controlsn=34 857
% (*)
Cases n=41 054
% (*)
Controlsn=43 078
% (*)Age group 20-29 6.3 18.3 4.5 20.5 30-39 6.1 24.6 6.8 25.3 40-49 7.4 23.1 10.9 23.0 50-59 12.5 17.3 17.7 15.8 60-69 23.6 11.6 26.2 9.4 70+ 44.2 5.1 33.9 6.0Residence Rural 81.8 (82.6) 78.1 (78.7) 80.6 (79.7) 83.8 (83.6) Urban 18.2 (17.4) 21.9 (21.3) 19.4 (20.3) 16.2 (16.4)Educational level None completed 82.8 (80.8) 56.0 (68.9) 56.3 (52.8) 30.5 (37.8) Primary or middle school 10.1 (11.2) 18.1 (15.3) 22.0 (23.1) 23.4 (24.4) Secondary school or higher 6.1 (7.0) 24.5 (14.4) 20.5 (22.9) 44.6 (36.2) Unknown 1.0 (1.0) 1.4 (1.6) 1.2 (1.2) 1.5 (1.7)Religion Hindu 82.4 (81.9) 81.6 (82.3) 82.2 (82.5) 83.1 (82.8) Muslim 9.9 (10.6) 9.7 (9.1) 9.9 (9.7) 9.8 (9.7) Others 6.6 (6.5) 7.5 (7.6) 6.5 (6.5) 5.7 (6.3) Unknown 1.2 (1.0) 1.1 (1.1) 1.4 (1.3) 1.4 (1.2)Chewing tobacco Yes 15.2 (14.8) 7.8 (10.4) 25.2 (26.4) 21.2 (22.9) No 82.6 (82.9) 89.7 (87.2) 71.1 (69.8) 75.8 (74.2) Unknown 2.2 (2.3) 2.5 (2.4) 3.7 (3.8) 2.9 (2.9)Alcohol consumption Yes 3.6 (4.7) 2.6 (2.9) 26.9 (33.0) 15.5 (16.4) No 93.9 (92.8) 95.2 (94.7) 69.5 (63.5) 81.7 (80.7) Unknown 2.5 (2.5) 2.3 (2.4) 3.6 (3.5) 2.9 (2.9)Smoking prevalence in various subgroups
All adults 8.5 (9.3) 3.5 (4.5) 50.5 (55.4) 31.9 (37.0) - Rural only 8.9 (9.8) 3.8 (4.8) 51.4 (56.4) 33.3 (38.7) - No education completed 9.2 (10.2) 4.5 (5.3) 52.9 (58.2) 41.1 (43.4) - Hindu only 8.3 (8.9) 3.5 (4.6) 51.1 (55.9) 32.1 (37.6) - Tobacco chewers only 12.9 (15.3) 11.0 (10.4) 54.0 (58.2) 37.4 (40.5) - Alcohol drinkers only 40.1 (41.6) 32.1 (33.3) 74.4 (75.7) 62.4 (65.9)
* The numbers in brackets are prevalences standardized (in 5-year age groups) to the age distribution of cases aged 30-69 years.
6

Webtable 2. Smoking and death from any medical cause among women and men in India, 2001-3: age-specific numbers of cases and controls, risk ratio (ever/never smoked) and smoking-associated excess deaths
Smoking-associated excess deaths
Age range (years)
Medical deaths (% ever smoked)
Living controls (% ever smoked)
RR ∗ (99% CI)
No. %
WOMEN 20-29
2070 (2.9) 6388 (1.8) 1.5 (1.0-2.4) 20 1 (0-2)
30-39
2029 (5.8) 8567 (2.7) 2.1 (1.5-2.8) 61 3 (2-4)
40-49
2437 (8.3) 8052 (3.4) 2.3 (1.8-3.0) 115 5 (4-6)
50-59
4126 (9.9) 6027 (4.1) 2.3 (1.9-2.9) 231 6 (5-7)
60-69
7794 (10.2) 4032 (5.6) 1.9 (1.5-2.3) 376 5 (3-6)
70+
14613 (8.3) 1791 (6.8) 1.3 (0.9-1.7) 281 2 (1-3)
Subtotal 30-69 16386 (9.3) 26678 (4.5 † ) 2.0 (1.8-2.3) ‡ 783 5 (4-6)
MEN 20-29
1840 (28.5) 8816 (17.8) 1.2 (1.0-1.5) 88 5 (0-10)
30-39
2805 (50.3) 10883 (31.9) 1.5 (1.3-1.7) 470 17 (12-21)
40-49
4458 (57.4) 9920 (36.8) 1.6 (1.5-1.8) 961 22 (19-25)
50-59
7278 (58.8) 6792 (39.6) 1.7 (1.5-1.9) 1762 24 (20-28)
60-69
10749 (53.5) 4066 (36.7) 1.8 (1.5-1.9) 2558 24 (18-25)
70+
13923 (44.6) 2601 (32.7) 1.6 (1.4-1.9) 2328 17 (13-21)
Subtotal 30-69
25290 (55.4)
31661 (37.0 †)
1.7 (1.6-1.8) ‡
5751
23 (21-24)
∗ Risk ratio (and 99% confidence interval) adjusted for education and alcohol use
† Prevalence among controls aged 30-69 years standardized to the age distribution of cases ‡ Additional adjustment for tobacco chewing did not materially alter the relative risks at ages 30-69 years in women (RR=2.0) or men (RR=1.7); see Methods
7

Webtable 3. Relevance of type of smoking and daily amount smoked to mortality from medical causes among women and men aged 30-69 years
Number of smokers Type of smoking (and mean no./day smoked by controls)
Cases Controls RR (99% CI) *
WOMEN Bidi only (11.1) 1106 632 2.2 (1.9-2.5)
Cigarette only (6.9) 47 39 2.1 (1.1-4.0)
Other † 370 304 1.6 (1.3-1.9)
Any type 1523 975 2.0 (1.8-2.3)
MEN Bidi only, by no./day ‡
1-7 (4.4) 2691 2572 1.3 (1.2-1.4)
8-14 (10.2) 3088 2775 1.5 (1.4-1.6)
15+ (23.9) 3186 1863 2.2 (2.0-2.4)
Unknown 1041 834 1.6 (1.4-1.8)
Any bidi (12.9) 10006 8044 1.6 (1.5-1.7)
Cigarette only, by no./day ‡
1-7 (4.0) 574 588 1.8 (1.6-1.9)
8+ (13.7) 689 385 2.9 (2.5-3.4)
Any cigarette (8.6) 1263 973 2.2 (2.0-2.5)
Other † 2731
2290 1.6 (1.5-1.8)
Any type 14000 11307 1.7 (1.6-1.8)
* Adjusted for age, education, and alcohol use † Includes those who smoked both bidis and cigarettes, those who smoked anything other than bidis and cigarettes and (the largest contributor) those whose type of smoking was unspecified ‡ Chi-squared test for trend (on 1 degree of freedom) for amount smoked among men was 90.0 (p<0.0001) for bidis (nonsmoker, 1-7, 8-14, 15+) and 49.4 (p<0.0001) for cigarettes (nonsmoker, 1-7, 8+). Note that nonsmokers with (zero consumption) also contribute to these trends. If, instead, the trend tests were restricted only to the relevant smokers, the Chi-squared statistics would be smaller.
8
9

10

7%
7%
3%
7%
11%
5%
20%
12%
9%
15%
17%
11%
Non- smokers
Tuberculosis
Tuberculosis
Respiratory disease
Respiratory disease
Ischemic heart disease
Ischemic heart disease
Smokers
Smokers
Smokers
Non- smokers
Non- smokers
Non- smokers
Non- smokers
Non- smokers
Women
Men
Smokers
Smokers
Smokers
Web figure 2. Risks of death* at ages 30-69 years from respiratory disease, ischemic heart disease and tuberculosis among Indian women and men
* Each risk is calculated in the hypothetical absence of all other causes of death (so the cumulative mortality rates at ages 30-69 years would be similar to these risks of death, e.g. 22% instead of 20% for respiratory disease in women, etc). For simplicity, only the lower uncertainty limits are shown.
11

Part III. RGI-CGHR MILLION DEATH STUDY: COLLABORATORS * Indian Academic Partners (in alphabetical order): 1. Clinical Epidemiology Centre, Trivandarum: KB Leena, KT Shenoy (until 2005) 2. Dept. of Community Medicine, Gujarat Medical College, Ahmedabad: DV Bala, P Seth, KN
Trivedi 3. Dept. of Community Medicine, Kolkatta Medical College, Kolkatta: SK Roy 4. Dept. of Community Medicine, Osmania Medical College, Hyderabad: P Bhatia 5. Dept. of Community Medicine, Regional Institute of Medical Sciences, Imphal: L Usharani 6. Dept. of Community Medicine, S.C.B. Medical College, Cuttack, Orissa: B Mohapatra 7. Dept. of Community Medicine, SMS Medical College, Jaipur: AK Bharadwaj, R Gupta 8. Epidemiological Research Center, Chennai: V Gajalakshmi, CV Kanimozhi 9. Gandhi Medical College, Bhopal: RP Dikshit, S Sorangi 10. Healis-Seskarhia Institute of Public Health, Mumbai: PC Gupta, MS Pednekar, S Sreevidya 11. Institute of Health Systems Research, Hyderabad: P Mahapatra (until 2004) 12. St. John’s Research Institute, St. John’s Academy of Health Sciences, Bangalore: A Kurpad,
P Mony, M Vaz, R Jotkar, S Rao-Seshadri, S Shrihari 13. King George’s Medical College, Lucknow: S Awasthi 14. Najafgarh Rural Health Training Centre, Ministry of Health, Government of India, New Delhi:
N Dhingra, J Sudhir, I Rawat 15. National Institute of Mental Health and Neurosciences, Bangalore: G Gururaj (until 2004) 16. Nizams Institute of Medical Sciences, Hyderabad: V Lakshmi, S Sudha 17. North Eastern Indira Gandhi Regional Institute of Health and Medical Sciences, Shillong: FU
Ahmed (until 2005), DK Parida 18. Regional Medical Research Center-ICMR, Bhubaneshwar: AS Karketta, SK Dar 19. School of Preventative Oncology, Patna: DN Sinha 20. School of Public Health, Post Graduate Institute of Medical Education and Research,
Chandigarh: N Kaur, R Kumar, JS Thakur 21. Tata Memorial Hospital, Mumbai: RP Dikshit Lead Partners: 1. Office of the Registrar-General of India (RGI), New Delhi, India: DK Sikri (RGI since Sept
2004), RC Sethi, S Jain, DK Dey, AK Saxena, MK Thapa, JK Banthia (RGI until Sept 2004) 2. Million Death Study Coordinating Centre, Centre for Global Health Research (CGHR), St.
Michael’s Hospital, University of Toronto, Canada: D Bassani, D Corsi, B Jacob, P Jha, R Jotkar, D Kam, R Kamadod, P Mony, J Moore (until 2005), S Jayakumar (until 2007), S Rao-Seshadri, W Suraweera, S Sgaier, D Thiruchelvam (until 2005), P Vasa (until 2005)
Affiliated Partners: 1. Clinical Trial Service Unit and Epidemiological Studies Unit (CTSU), University of Oxford,
England: J Boreham, Z Chen, R Collins, J Godwin, R Peto 2. Indian Council of Medical Research, New Delhi, India: NK Ganguly (Director-General until
2008), L Kant, SK Bhattacharya (Acting Director-General from 2008) 3. School of Population Health, The University of Queensland, Australia: AD Lopez, C Rao 4. World Health Organisation, Geneva and New Delhi: T Boerma, T Evans, A Fric, S Khanum,
CD Mathers, K Shibuya, N Singh, DN Sinha * This list is an update of that published in Jha P, et al, PLoS Med 2006; 3: e18. Disclaimer: The results of this paper do not necessarily represent the official views of any of the Government of India, the Office of the Registrar General, the study partners or the study sponsors.
12