Embed Size (px)
Citation preview
Yukako Saisu Technology Development HeadquartersAzbil Corporation
Tomohiro Konda AI Solution DepartmentAzbil Corporation
Kazuya Harayama Building Systems CompanyAzbil Corporation
Environmental measurement data, CFD analysis, visualization, air conditioning control
Conventionally uniform air-temperature profiles have been made using sensors installed on a wall or pillar. But recently, there has been interest in air conditioning methods that provide both comfort and energy savings by dealing with the uneven distribution of people and heat-generating equipment. This kind of advanced air condi-tioning control requires a detailed understanding of the indoor thermal environment, which wall- or pillar-mounted sensors cannot provide. As a solution, we have developed a thermal environment visualization technology and a system for profiling the thermal environment of a room in detail.
Keywords
1. IntroductionIn the past, air conditioning control was generally used
to give a room a uniform air-temperature profile. With the diversification of office space in recent years, the air conditioning load, such as persons and heat-generating equipment, is more unevenly distributed. At the same time, to achieve the CO2 reduction targets set by the “Energy Basic Plan”1 of the Ministry of Economy, Trade and Industry, air conditioning, which accounts for more than 40 % of the energy consumption in office buildings,2 must be more energy-efficient. For these reasons, an air conditioning control method known variously as task/ambient air conditioning or personalized air conditioning has received attention. This method balances comfort and energy savings by proactively distributing the tem-perature in the room.3 In order to achieve this kind of air conditioning control, it is necessary to have a detailed grasp of the temperature distribution in the room, prefer-ably utilizing three-dimensional temperature data.
Therefore, we have devised an air conditioning control technology using three-dimensional temperature data obtained by combining various environmental data mea-
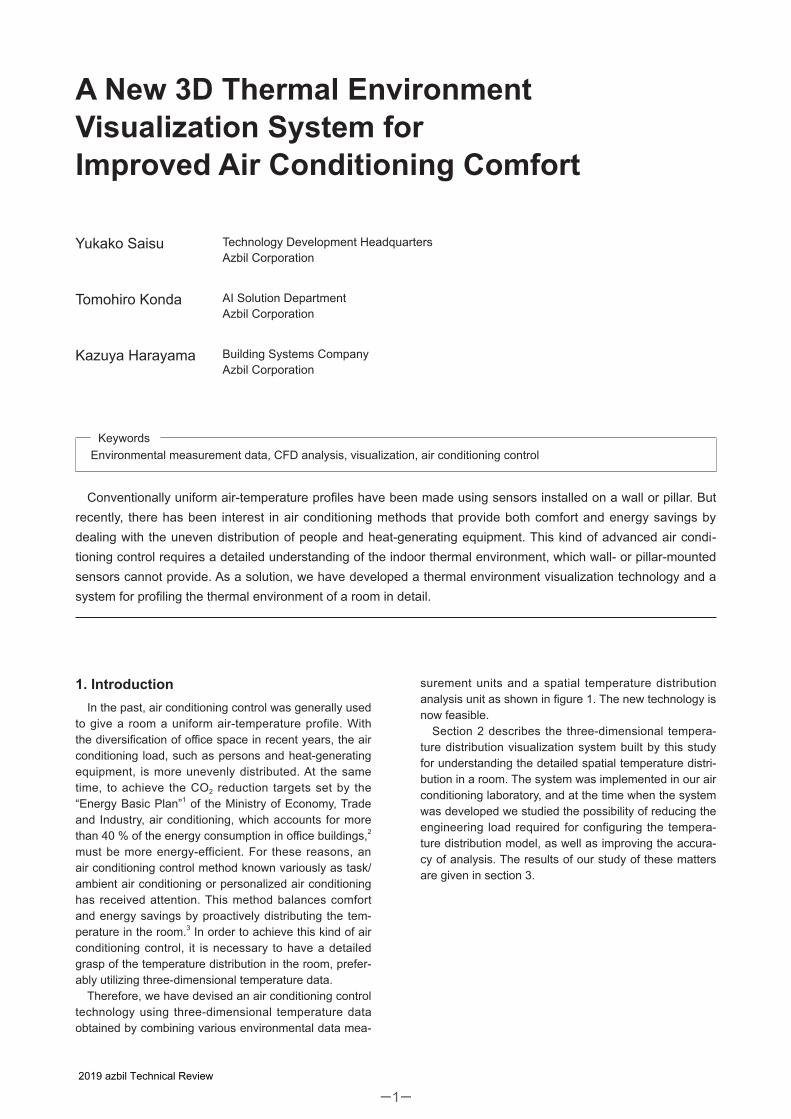
surement units and a spatial temperature distribution analysis unit as shown in figure 1. The new technology is now feasible.
Section 2 describes the three-dimensional tempera-ture distribution visualization system built by this study for understanding the detailed spatial temperature distri-bution in a room. The system was implemented in our air conditioning laboratory, and at the time when the system was developed we studied the possibility of reducing the engineering load required for configuring the tempera-ture distribution model, as well as improving the accura-cy of analysis. The results of our study of these matters are given in section 3.
−1−
A New 3D Thermal Environment Visualization System for Improved Air Conditioning Comfort
2019 azbil Technical Review
In addition, in order to put the new system into practi-cal service in spite of the time required for computational fluid dynamics (CFD)* analysis, we propose a method of continuously alternating indoor environment data measurement intervals and CFD analysis intervals. The control system was used with this method in an actual environment, the results of which are described as an example in section 4.
2.ConfiguringtheNew3DThermalEnviron-ment Visualization System
In order to understand the detailed temperature distri-bution in a room, we built a three-dimensional tempera-ture-distribution visualization system that utilizes CFD analysis. Figure 2 shows a conceptual diagram.
In the past, CFD analysis was generally used in the design of buildings and air conditioning systems to pre-dict the indoor temperature distribution during building use, but in this study it was utilized for air conditioning control. To control air conditioning, it is necessary for CFD analysis to predict indoor conditions, which change constantly. In an actual office, the movements or equip-ment ON/OFF states of heat generators such as people or PCs should be obtained, but these are hard to predict.
Furthermore, in order to make more accurate predic-tions, it was important to set conditions of boundaries such as the walls that separate the analysis area, and it was necessary to build a wall model with complex pa-rameters to reproduce the heat flows from neighboring rooms or from the outdoor air.
Instead, our system uses, in addition to data related to the air conditioning (supply air temperature and vol-ume), data from environmental measurements, including surface temperature data for the walls, ceiling, and floor, and occupant detection data (the number of people and their position). By inputting the constantly changing indoor environmental measurements as the boundary conditions for the CFD analysis, it was possible to obtain and visualize the spatial temperature distribution and other data that reflected the changing conditions in the room. Also, since we used actual measurements, it was not necessary to set complicated parameters for repro-ducing the heat flows from neighboring rooms or outdoor air. Consequently the engineering workload for con-structing the wall model was reduced. For our indoor en-vironmental measurement data, we used infrared array sensors to measure surface temperature and to detect occupants.4
Fig. 1. Conceptual diagram of air conditioning control combining measurement and analysis
Environmental datameasurement unit
Surfacetemperature
data
Calculation
Temperaturedistribution
analysis unit
Visualization
Spatialtemperature data
Air conditioningcontrol unitLink
Input for analysis
Calculation
Occupantdetection
Airconditioning
data
Fig. 2. Conceptual diagram of 3D thermal environment visualization system
Office (actual environment)
CFD (simulation)
CFD analysis
Environmentalmeasurement
data
Conditions input for
CFD analysis
Conditions input for
CFD analysis
Input: air supply conditions
Input: surface temperature conditions
Input: heat generation conditions
Output: spatial temperature distribution data
Air conditioning data• Air supply volume• Air supply temperatureSurface temperature data• Temperature of walls, ceiling, floorOccupant data• Number of occupants• Positions of occupants
* A method of using computer software to simulate fluid flow and heat transfer.
−2−2019 azbil Technical Review
3. Application Example and Verification ofthe New 3D Thermal Environment Visual-ization System
3.1 Overview of Verification
In a room where desks and people were placed, ex-periments were conducted that imitated the movements of people during working hours and the specific air con-ditioning environment. We obtained the input conditions (supply air conditions, surface temperature conditions, heat generation conditions) used in the verification of the system and the indoor environmental measurement data corresponding to the output results (spatial tem-peratures). The CFD analysis was carried out using the environmental measurements (as boundary conditions) as input conditions in order to output three-dimensional temperature distribution data. The accuracy of this sys-tem was verified by comparing the results of analysis with the corresponding spatial temperature measure-ments. Furthermore, in order to verify the effectiveness of our method of using environmental measurements directly as boundary conditions, we compared the results of the method with that of the conventional method (wall modeling) using detailed parameters.
3.2 System Application Environment
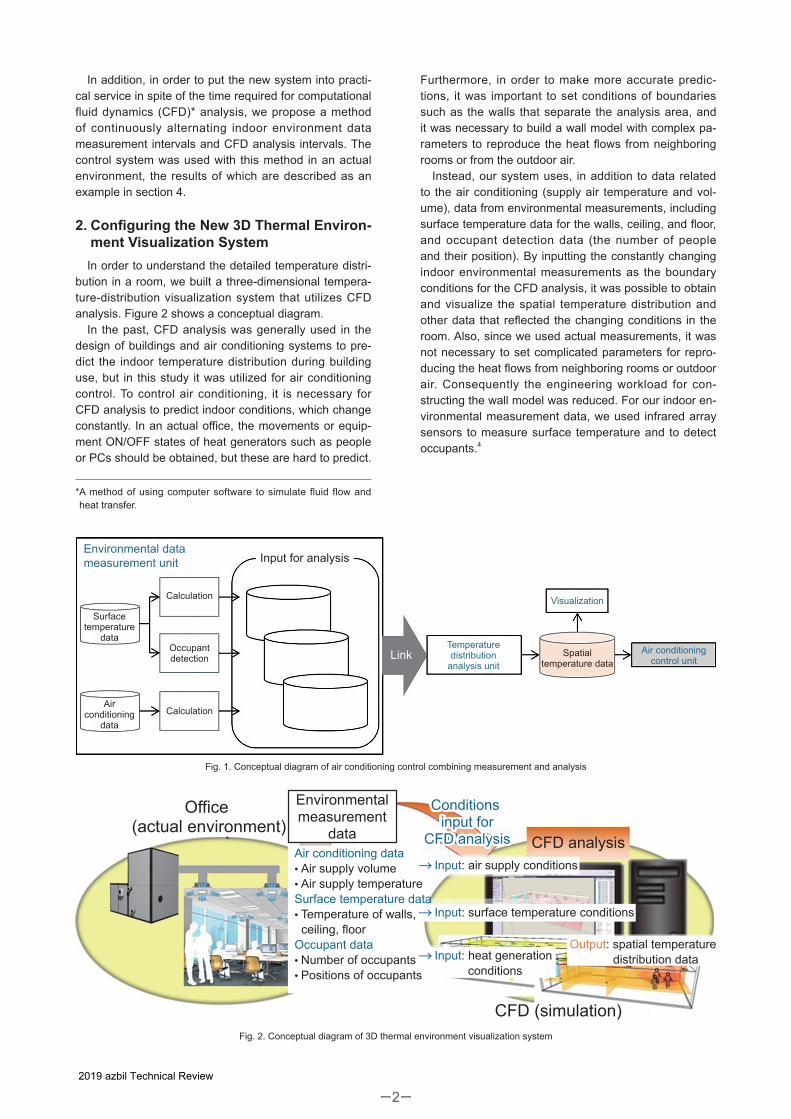
The system was applied in our air conditioning labora-tory (see figure 3), which simulates an office.
The size of the room was 15 × 8 × 3 m, and as shown in figure 4, chambers simulating the outdoor air and neighboring rooms were installed around it. By con-trolling the temperature of each chamber, the desired environment could be reproduced. Central air condition-ing was provided by an AHU using a variable air volume (VAV) system with 12 air inlets and 12 air outlets. Since there is only one AHU, the supply air temperature was equal at all air inlets. One VAV was installed for every two air inlets, so the air velocity of two neighboring air inlets was equal.
3.3 Experimental Conditions
In the laboratory, air conditioning control was executed for a scenario of deskwork and meetings in a summer office environment. Measurement of the environmental data took into account the movements and presence or absence of people. The spatial temperature distribution was measured using thermocouples installed at points A, B, and C in figure 5, and it was then compared with the
results of the CFD analysis.The time schedule for the experiment is shown in fig-
ure 6. The time schedule was set for two-hour operation scenarios, including 30 minutes for startup of the air conditioning before work (period 1), 30 minutes for desk-work after employees arrive at the office (period 2), 30 minutes for meeting attendance in the conference area (period 3), and 30 minutes for deskwork after the meet-ing (period 4). Temperature settings were 26 °C for room temperature, 30 °C for outdoor temperature (the outdoor air chamber), and 26 °C for the air temperature of the neighboring room (the neighboring chamber).
Fig. 3. Air conditioning laboratory
Fig. 4. Air conditioning laboratory overview
Laboratory
Outdoor airchamber
Neighboring chamber (ceiling)
Neighboring chamber (floor)Neighboring chamber
Fig. 5. Temperature measurement points in the experiment
Occupants in deskwork time slots (periods 2 & 4)Measurementpoint usingthermocouples(height: 1.1 m)Occupants in meeting time slot (period 3)
Entrance
Out
door
air
cham
ber
Fig. 6. Time schedule for experiment
Air conditioningprecooling
Outdoors: 30 °CNeighboring room: 26 °C
Outdoors: 30 °CNeighboring room: 26 °C
Outdoors: 30 °CNeighboring room: 26 °C
Outdoors: 30 °CNeighboring room: 26 °C
Deskwork Meeting Deskwork
30 min(Period 1)
30 min(Period 2)
30 min(Period 3)
30 min(Period 4)
Temperaturesetpoint in lab
Temperature setpointin neighboring chamber
28 °C → 26 °C 26℃ 26℃ 26℃
−3−2019 azbil Technical Review
3.4 Conditions for CFD Analysis and Case Settings
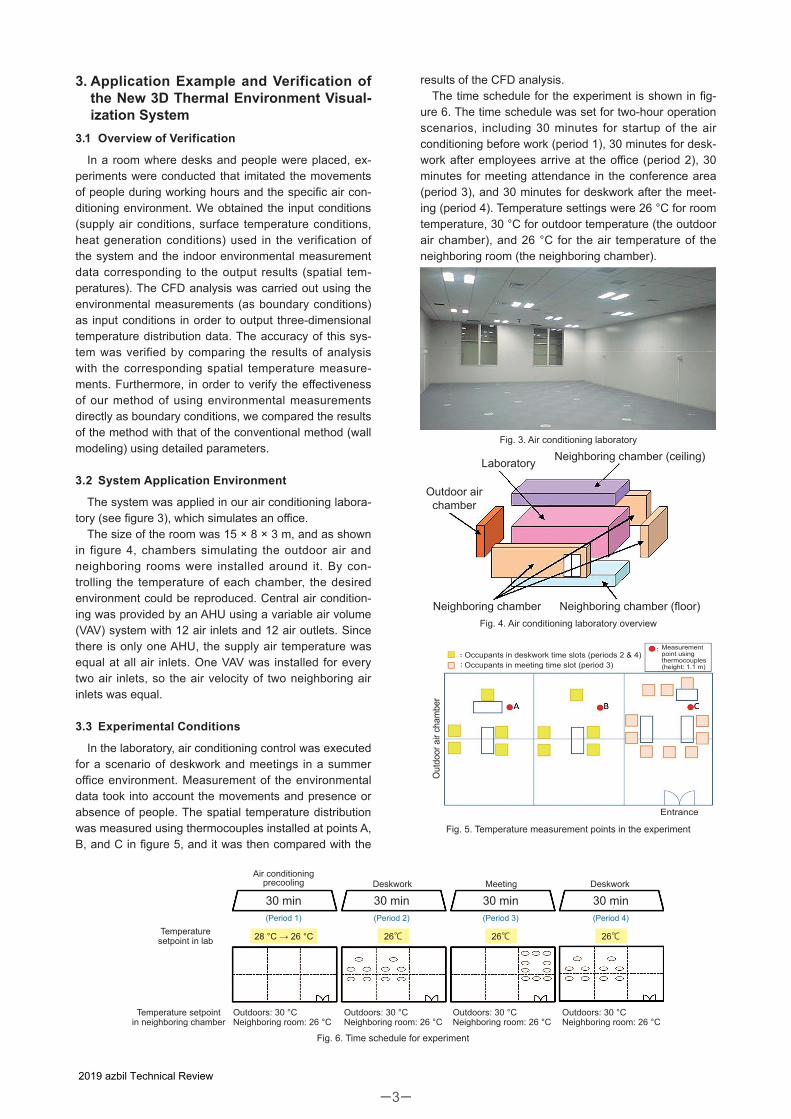
Figure 7 shows the room model used for the CFD analysis. Table 1 shows the conditions for the CFD anal-ysis.
In order to verify the effectiveness of direct use of environmental measurements as boundary conditions, and to compare that method with the conventional wall model with detailed parameters, two versions of the room model were used with different methods of setting the surface temperature of the walls, ceiling, and floor (used as boundary conditions). We compared the results of the CFD analysis in each case (detailed parameters and sensor measurements) with the results from actual spatial temperature measurements.
3.4.1 WallModelCasewithDetailedParameterSet-tings(theDetailedParameterCase)
This is a conventional wall model in which parameters such as the density, specific heat, heat conductivity, and heat transfer coefficient of the wall material are set in detail. The accuracy of the wall model was improved by adjusting the parameters based on the results of actual measurement, and we carried out our analysis using the relatively high-precision wall model constructed by that method. After setting the temperature of the outdoor air or the neighboring room, the surface temperature of the room was calculated based on the conduction heat, so the temperature settings for the outdoor air and the neighboring room, as well as the parameter settings of the wall model, affected the results of analysis.
3.4.2 Wall Model Case with Surface Temperature Mea-surements Using Infrared Array Sensors (the Sen-sor Measurement Case)
In our new wall model, the surface temperature of the walls was directly set by the surface temperature mea-surements taken by infrared array sensors. Therefore, in addition to the fact that the measured temperature conformed to the actual situation, there was no need for complicated configuration of parameter settings or actual measurements in order to construct the wall model, so the model could be easily built.
3.5 Verification Results
In this section we report the visualized temperature distribution data obtained from the CFD analysis of the two cases and the results of comparing the CFD analy-sis to the actual measurements.
3.5.1 Comparison of the Spatial Temperature Distribu-tion in the Two Cases
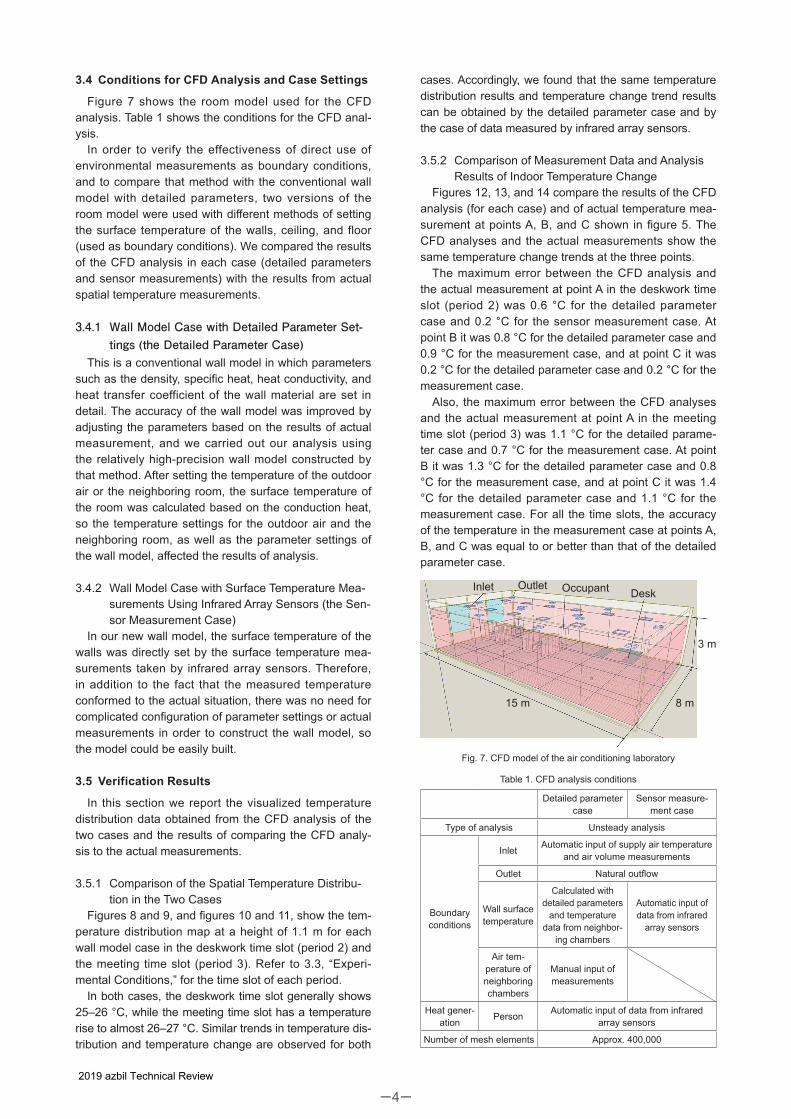
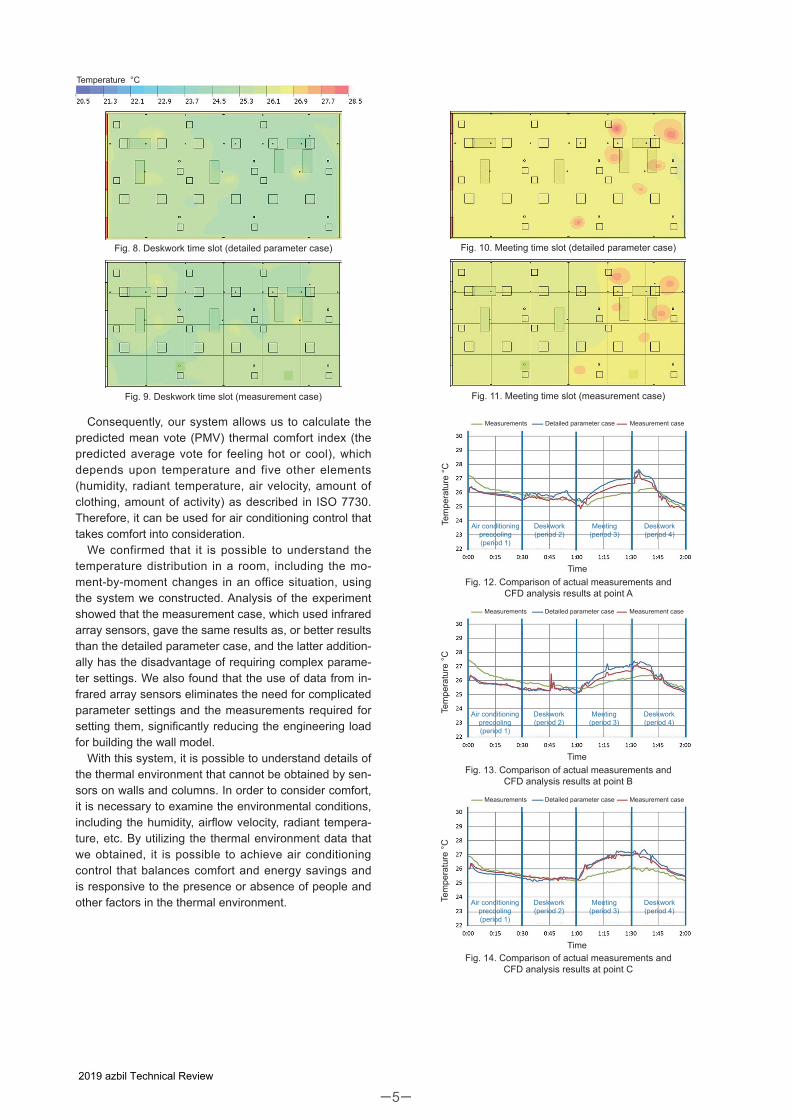
Figures 8 and 9, and figures 10 and 11, show the tem-perature distribution map at a height of 1.1 m for each wall model case in the deskwork time slot (period 2) and the meeting time slot (period 3). Refer to 3.3, “Experi-mental Conditions,” for the time slot of each period.
In both cases, the deskwork time slot generally shows 25–26 °C, while the meeting time slot has a temperature rise to almost 26–27 °C. Similar trends in temperature dis-tribution and temperature change are observed for both
cases. Accordingly, we found that the same temperature distribution results and temperature change trend results can be obtained by the detailed parameter case and by the case of data measured by infrared array sensors.
3.5.2 Comparison of Measurement Data and Analysis Results of Indoor Temperature Change
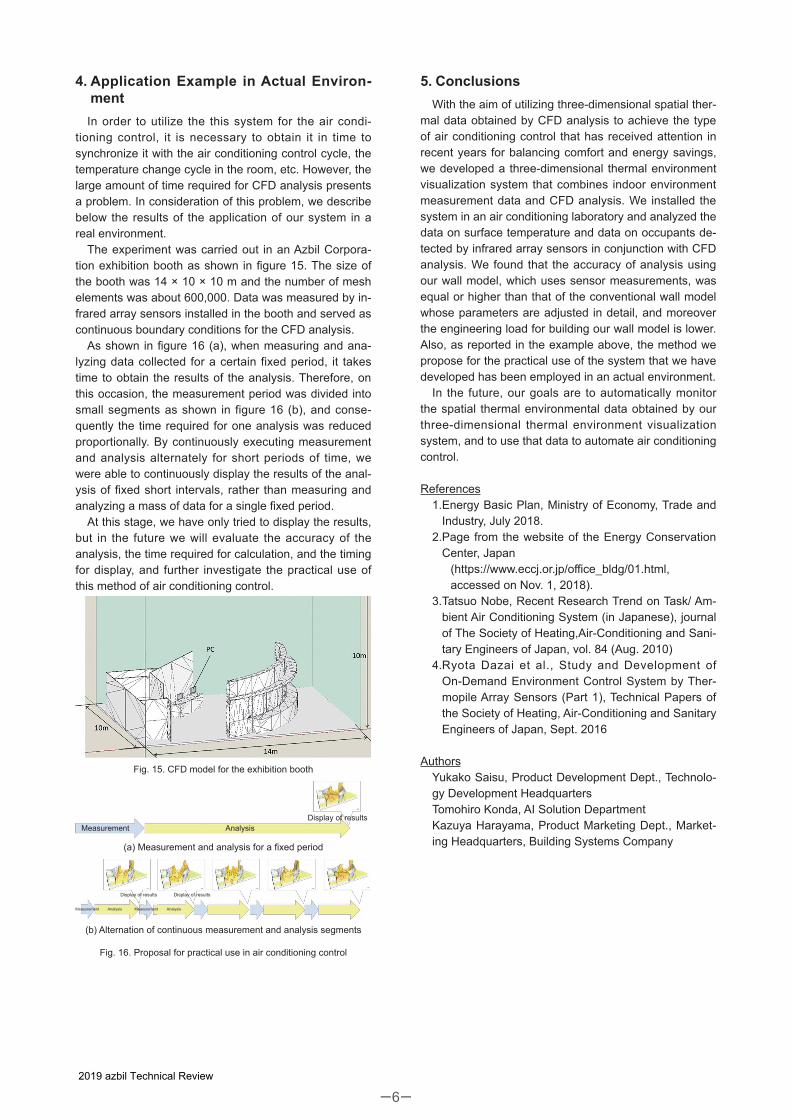
Figures 12, 13, and 14 compare the results of the CFD analysis (for each case) and of actual temperature mea-surement at points A, B, and C shown in figure 5. The CFD analyses and the actual measurements show the same temperature change trends at the three points.
The maximum error between the CFD analysis and the actual measurement at point A in the deskwork time slot (period 2) was 0.6 °C for the detailed parameter case and 0.2 °C for the sensor measurement case. At point B it was 0.8 °C for the detailed parameter case and 0.9 °C for the measurement case, and at point C it was 0.2 °C for the detailed parameter case and 0.2 °C for the measurement case.
Also, the maximum error between the CFD analyses and the actual measurement at point A in the meeting time slot (period 3) was 1.1 °C for the detailed parame-ter case and 0.7 °C for the measurement case. At point B it was 1.3 °C for the detailed parameter case and 0.8 °C for the measurement case, and at point C it was 1.4 °C for the detailed parameter case and 1.1 °C for the measurement case. For all the time slots, the accuracy of the temperature in the measurement case at points A, B, and C was equal to or better than that of the detailed parameter case.
Fig. 7. CFD model of the air conditioning laboratory
Inlet Outlet Occupant Desk
3 m
8 m15 m
Table 1. CFD analysis conditions
Detailed parameter case
Sensor measure-ment case
Type of analysis Unsteady analysis
Boundary conditions
Inlet Automatic input of supply air temperature and air volume measurements
Outlet Natural outflow
Wall surface temperature
Calculated with detailed parameters
and temperature data from neighbor-
ing chambers
Automatic input of data from infrared
array sensors
Air tem-perature of neighboring chambers
Manual input of measurements
Heat gener-ation Person Automatic input of data from infrared
array sensors
Number of mesh elements Approx. 400,000
−4−2019 azbil Technical Review
Temperature °C
Fig. 8. Deskwork time slot (detailed parameter case)
Fig. 9. Deskwork time slot (measurement case)
Consequently, our system allows us to calculate the predicted mean vote (PMV) thermal comfort index (the predicted average vote for feeling hot or cool), which depends upon temperature and five other elements (humidity, radiant temperature, air velocity, amount of clothing, amount of activity) as described in ISO 7730. Therefore, it can be used for air conditioning control that takes comfort into consideration.
We confirmed that it is possible to understand the temperature distribution in a room, including the mo-ment-by-moment changes in an office situation, using the system we constructed. Analysis of the experiment showed that the measurement case, which used infrared array sensors, gave the same results as, or better results than the detailed parameter case, and the latter addition-ally has the disadvantage of requiring complex parame-ter settings. We also found that the use of data from in-frared array sensors eliminates the need for complicated parameter settings and the measurements required for setting them, significantly reducing the engineering load for building the wall model.
With this system, it is possible to understand details of the thermal environment that cannot be obtained by sen-sors on walls and columns. In order to consider comfort, it is necessary to examine the environmental conditions, including the humidity, airflow velocity, radiant tempera-ture, etc. By utilizing the thermal environment data that we obtained, it is possible to achieve air conditioning control that balances comfort and energy savings and is responsive to the presence or absence of people and other factors in the thermal environment.
Fig. 10. Meeting time slot (detailed parameter case)
Fig. 11. Meeting time slot (measurement case)
Fig. 12. Comparison of actual measurements and CFD analysis results at point A
Measurements
Time
Tem
pera
ture
°C
Detailed parameter case Measurement case
Air conditioningprecooling(period 1)
Deskwork(period 2)
Meeting(period 3)
Deskwork(period 4)
Fig. 13. Comparison of actual measurements and CFD analysis results at point B
Measurements
Time
Tem
pera
ture
°C
Detailed parameter case Measurement case
Air conditioningprecooling(period 1)
Deskwork(period 2)
Meeting(period 3)
Deskwork(period 4)
Fig. 14. Comparison of actual measurements and CFD analysis results at point C
Measurements
Time
Tem
pera
ture
°C
Detailed parameter case Measurement case
Air conditioningprecooling(period 1)
Deskwork(period 2)
Meeting(period 3)
Deskwork(period 4)
−5−2019 azbil Technical Review
4. Application Example in Actual Environ-ment
In order to utilize the this system for the air condi-tioning control, it is necessary to obtain it in time to synchronize it with the air conditioning control cycle, the temperature change cycle in the room, etc. However, the large amount of time required for CFD analysis presents a problem. In consideration of this problem, we describe below the results of the application of our system in a real environment.
The experiment was carried out in an Azbil Corpora-tion exhibition booth as shown in figure 15. The size of the booth was 14 × 10 × 10 m and the number of mesh elements was about 600,000. Data was measured by in-frared array sensors installed in the booth and served as continuous boundary conditions for the CFD analysis.
As shown in figure 16 (a), when measuring and ana-lyzing data collected for a certain fixed period, it takes time to obtain the results of the analysis. Therefore, on this occasion, the measurement period was divided into small segments as shown in figure 16 (b), and conse-quently the time required for one analysis was reduced proportionally. By continuously executing measurement and analysis alternately for short periods of time, we were able to continuously display the results of the anal-ysis of fixed short intervals, rather than measuring and analyzing a mass of data for a single fixed period.
At this stage, we have only tried to display the results, but in the future we will evaluate the accuracy of the analysis, the time required for calculation, and the timing for display, and further investigate the practical use of this method of air conditioning control.
Fig. 15. CFD model for the exhibition booth
(a) Measurement and analysis for a fixed period
Measurement AnalysisDisplay of results
(b) Alternation of continuous measurement and analysis segments
Display of results Display of results
AnalysisMeasurement AnalysisMeasurement
Fig. 16. Proposal for practical use in air conditioning control
5. ConclusionsWith the aim of utilizing three-dimensional spatial ther-
mal data obtained by CFD analysis to achieve the type of air conditioning control that has received attention in recent years for balancing comfort and energy savings, we developed a three-dimensional thermal environment visualization system that combines indoor environment measurement data and CFD analysis. We installed the system in an air conditioning laboratory and analyzed the data on surface temperature and data on occupants de-tected by infrared array sensors in conjunction with CFD analysis. We found that the accuracy of analysis using our wall model, which uses sensor measurements, was equal or higher than that of the conventional wall model whose parameters are adjusted in detail, and moreover the engineering load for building our wall model is lower. Also, as reported in the example above, the method we propose for the practical use of the system that we have developed has been employed in an actual environment.
In the future, our goals are to automatically monitor the spatial thermal environmental data obtained by our three-dimensional thermal environment visualization system, and to use that data to automate air conditioning control.
References1. Energy Basic Plan, Ministry of Economy, Trade and
Industry, July 2018.2. Page from the website of the Energy Conservation
Center, Japan(https://www.eccj.or.jp/office_bldg/01.html, accessed on Nov. 1, 2018).
3. Tatsuo Nobe, Recent Research Trend on Task/ Am-bient Air Conditioning System (in Japanese), journal of The Society of Heating,Air-Conditioning and Sani-tary Engineers of Japan, vol. 84 (Aug. 2010)
4. Ryota Dazai et al., Study and Development of On-Demand Environment Control System by Ther-mopile Array Sensors (Part 1), Technical Papers of the Society of Heating, Air-Conditioning and Sanitary Engineers of Japan, Sept. 2016
Authors Yukako Saisu, Product Development Dept., Technolo-gy Development HeadquartersTomohiro Konda, AI Solution Department Kazuya Harayama, Product Marketing Dept., Market-ing Headquarters, Building Systems Company
−6−2019 azbil Technical Review