Embed Size (px)
Citation preview
A New Anthropogenic Emission Inventory System for Asia in Support of Atmospheric Modeling
A New Anthropogenic Emission Inventory System for Asia in Support of Atmospheric Modeling
Qiang Zhang,1 David G. Streets,1 Kebin He,2 Shekar Reddy,3 Akiyoshi Kannari,4 Il-Soo Park,5 Joshua Fu,6 and Zbigniew
Klimont7
1Argonne National Laboratory, Argonne, USA2Tsinghua University, Beijing, China
3UK Met Office Hadley Centre, Exeter, UK4Independent Researcher, Tokyo, Japan
5Meteorological Research Institute, Seoul, Republic of Korea6University of Tennessee, Knoxville, USA
7International Institute for Applied Systems Analysis, Laxenburg, Austria
6th CMAS Conference, Chapel Hill, NC, USAOctober 1-3, 2007
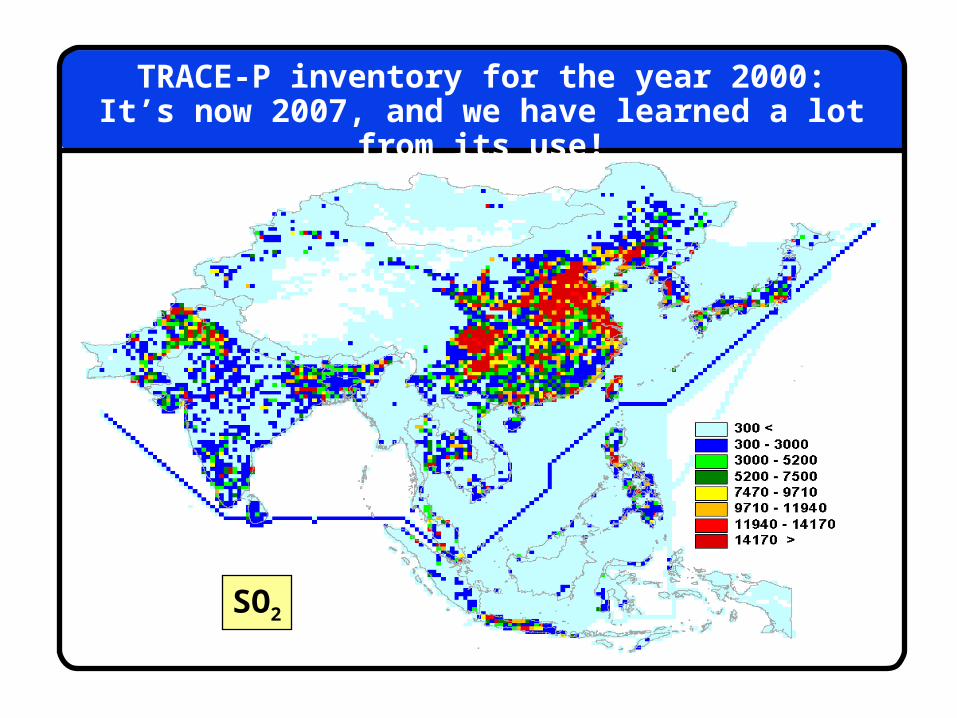
TRACE-P inventory for the year 2000:It’s now 2007, and we have learned a lot from its use!
SO2
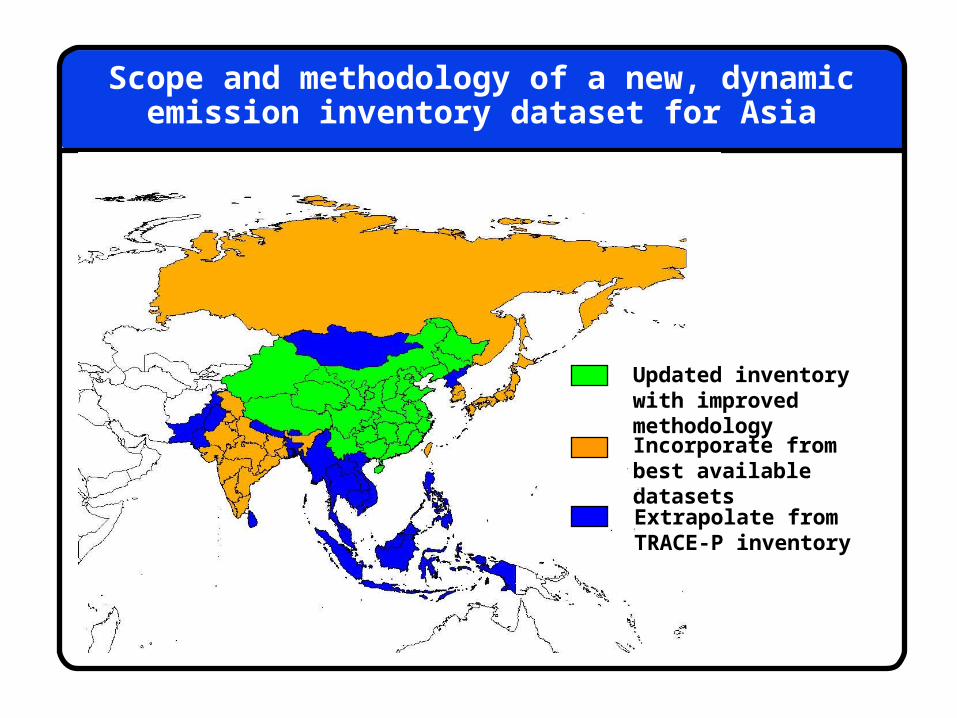
Scope and methodology of a new, dynamicemission inventory dataset for Asia
Updated inventory with improved methodology
Incorporate from best available datasets
Extrapolate from TRACE-P inventory
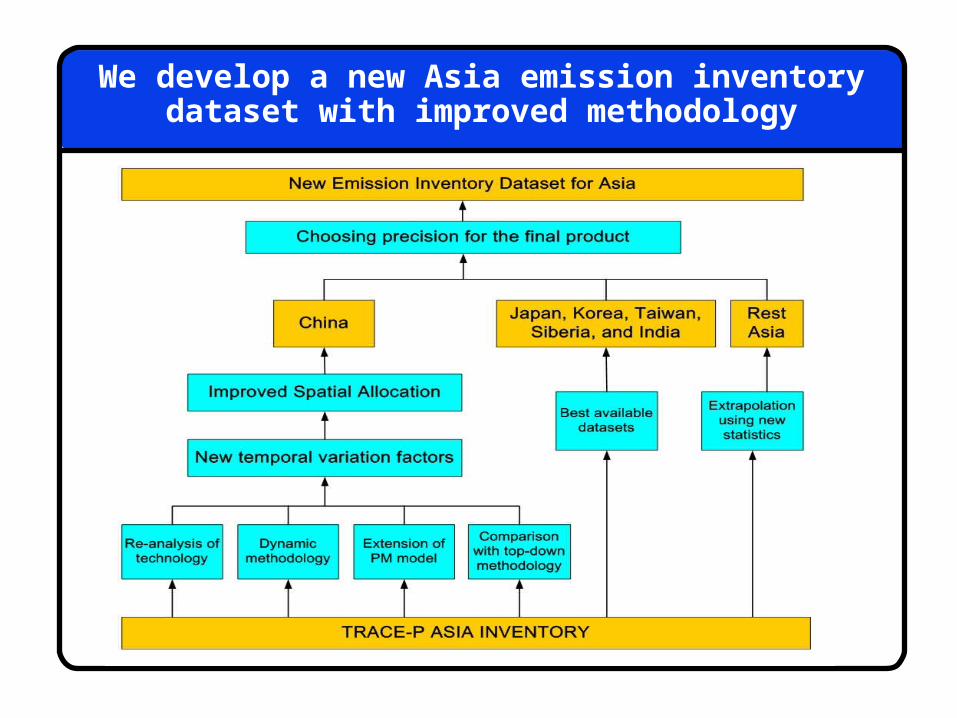
We develop a new Asia emission inventory dataset with improved methodology
Major improvements from TRACE-P Asia inventory
Detailed technology based approach
Dynamic methodology representing rapid technology renewal
Size-fractioned primary PM emissions
The best available national inventories incorporated
New VOC speciation methodology
Improved spatial allocation
Updated temporal profiles
Constraint from top-down method (inverse model/satellite)
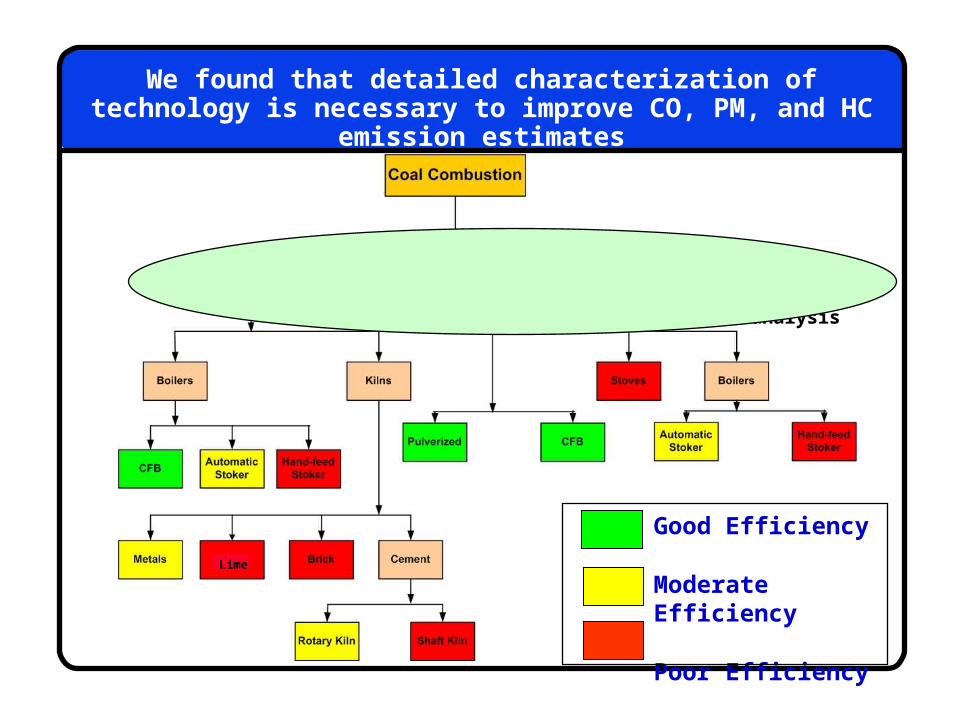
We found that detailed characterization of technology is necessary to improve CO, PM, and HC emission estimates
Good Efficiency
Moderate Efficiency
Poor Efficiency
TRACE-P level of analysis
Lime
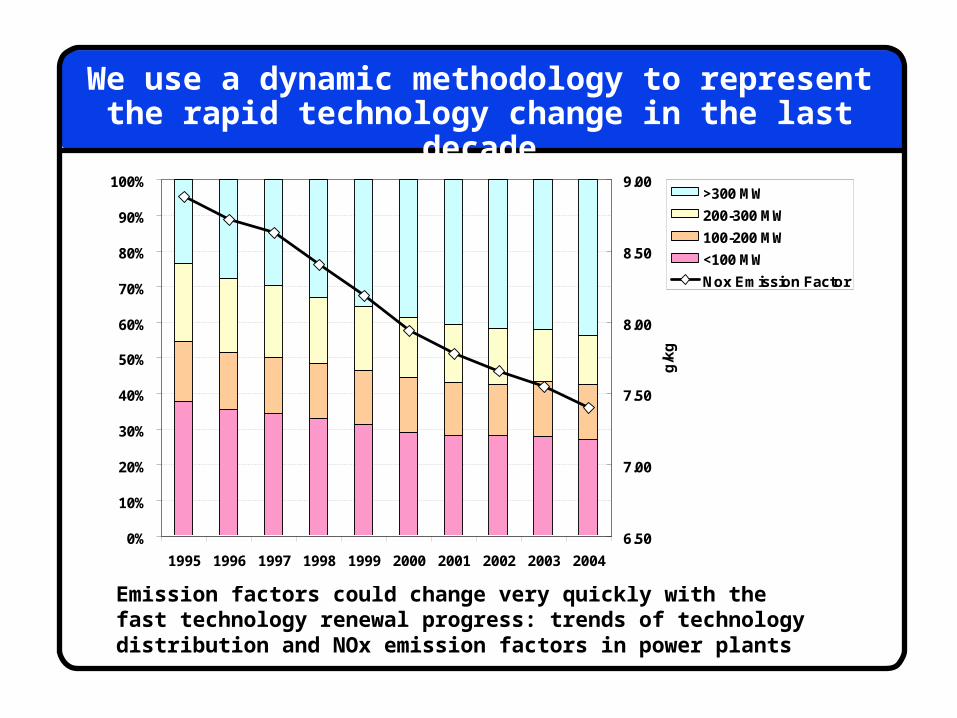
We use a dynamic methodology to representthe rapid technology change in the last decade
Emission factors could change very quickly with the fast technology renewal progress: trends of technology distribution and NOx emission factors in power plants
0%
10%
20%
30%
40%
50%
60%
70%
80%
90%
100%
1995 1996 1997 1998 1999 2000 2001 2002 2003 2004
6.50
7.00
7.50
8.00
8.50
9.00
g/k
g
>300 MW
200-300 MW
100-200 MW
<100 MW
Nox Emission Factor
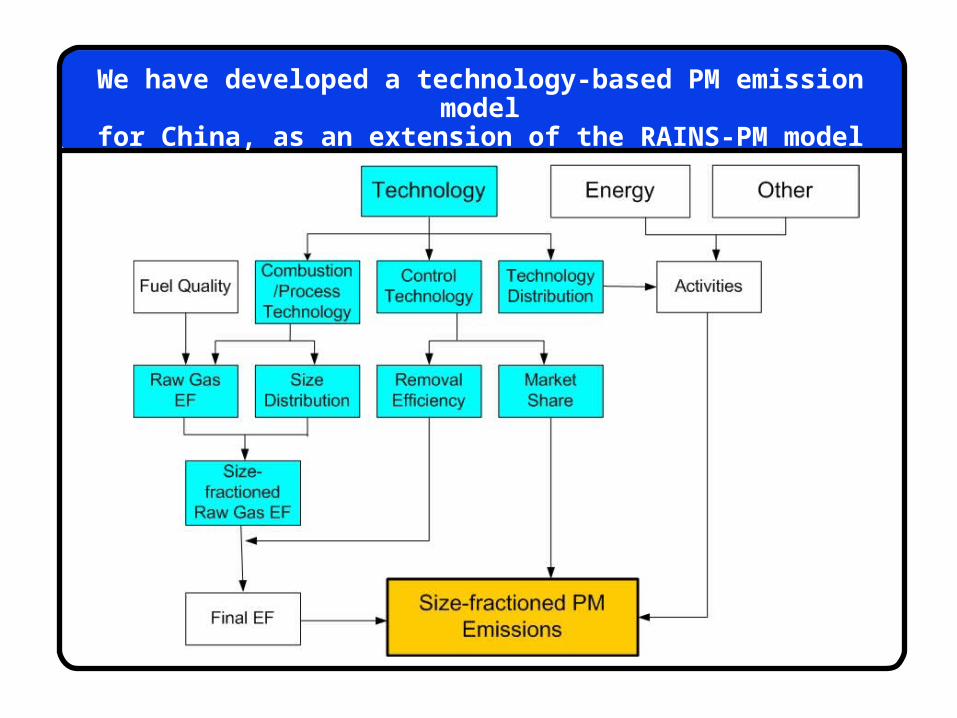
We have developed a technology-based PM emission modelfor China, as an extension of the RAINS-PM model
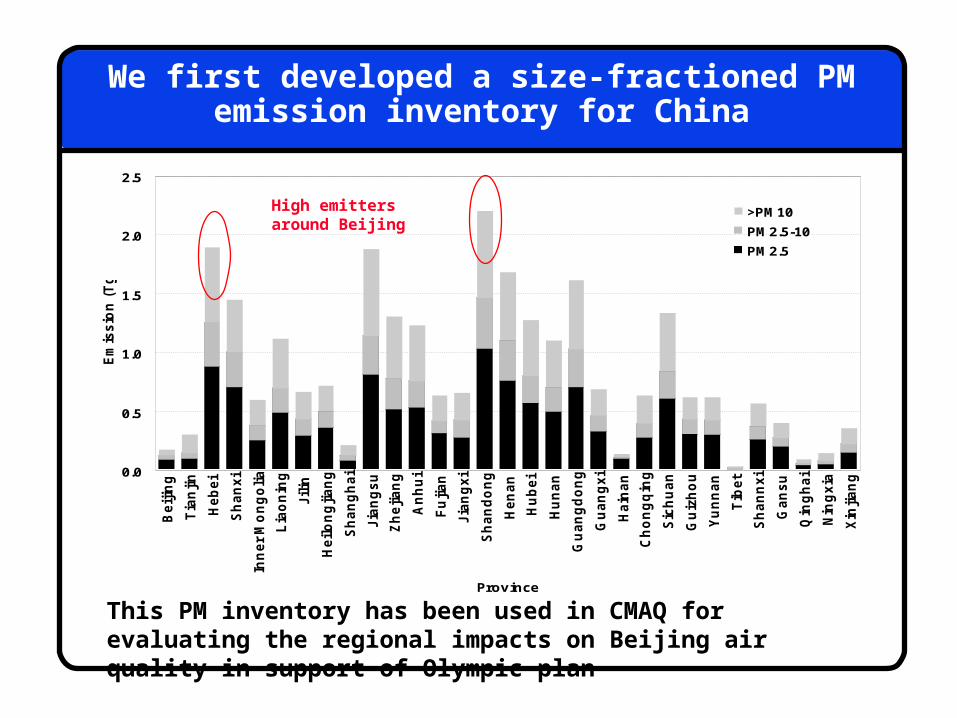
We first developed a size-fractioned PMemission inventory for China
0.0
0.5
1.0
1.5
2.0
2.5B
eij
ing
Tia
nji
n
He
be
i
Sh
an
xi
Inn
er
Mo
ng
oli
a
Lia
on
ing
Jil
in
He
ilo
ng
jia
ng
Sh
an
gh
ai
Jia
ng
su
Zh
eji
an
g
An
hu
i
Fu
jia
n
Jia
ng
xi
Sh
an
do
ng
He
na
n
Hu
be
i
Hu
na
n
Gu
an
gd
on
g
Gu
an
gx
i
Ha
ina
n
Ch
on
gq
ing
Sic
hu
an
Gu
izh
ou
Yu
nn
an
Tib
et
Sh
an
nx
i
Ga
ns
u
Qin
gh
ai
Nin
gx
ia
Xin
jia
ng
Province
Em
iss
ion
(T
g)
>PM10
PM2.5-10
PM2.5
This PM inventory has been used in CMAQ for evaluating the regional impacts on Beijing air quality in support of Olympic plan
High emitters around Beijing
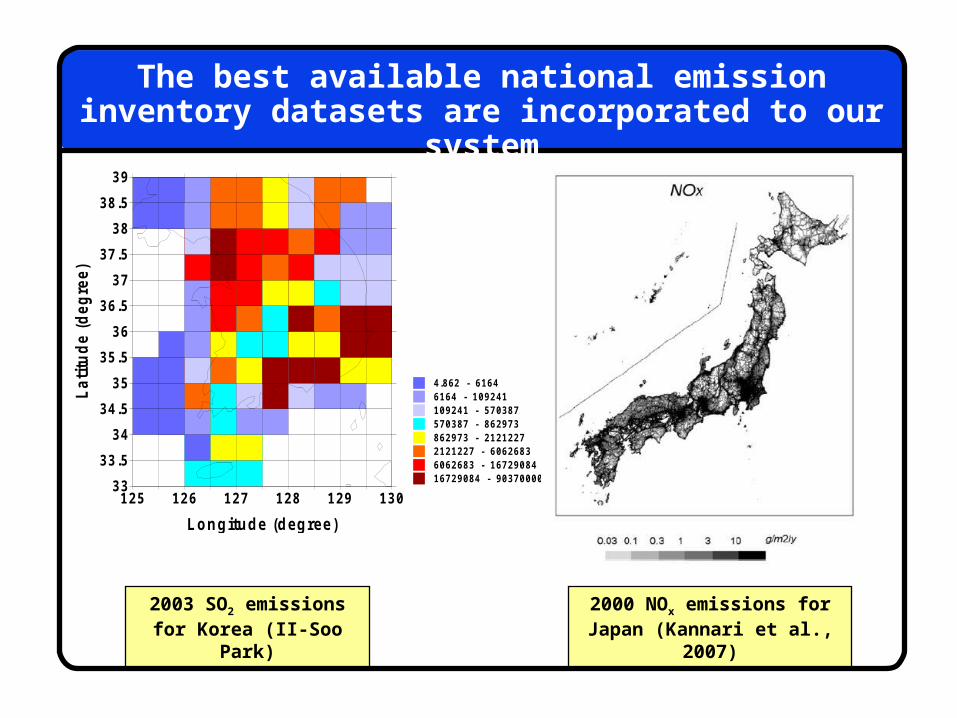
The best available national emission inventory datasets are incorporated to our system
4.862 - 6164 6164 - 109241 109241 - 570387 570387 - 862973 862973 - 2121227 2121227 - 6062683 6062683 - 16729084 16729084 - 90370000
125 126 127 128 129 130
Longitude (degree)
33
33.5
34
34.5
35
35.5
36
36.5
37
37.5
38
38.5
39
Lat
itu
de
(deg
ree)
2003 SO2 emissions for Korea (II-Soo Park)
2000 NOx emissions for Japan (Kannari et al., 2007)
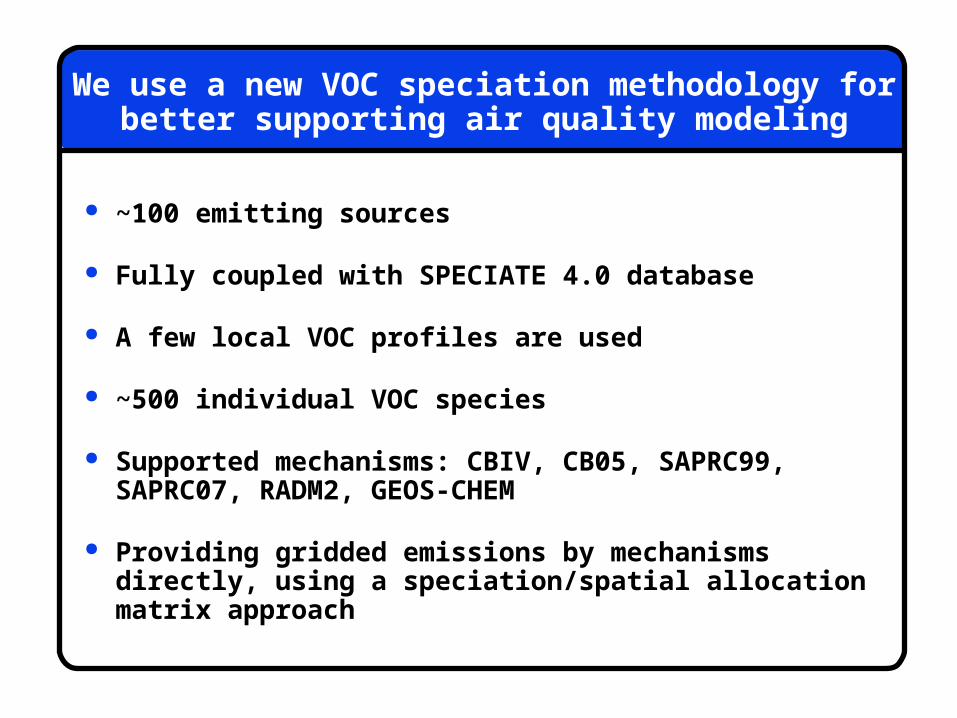
We use a new VOC speciation methodology for better supporting air quality modeling
~100 emitting sources
Fully coupled with SPECIATE 4.0 database
A few local VOC profiles are used
~500 individual VOC species
Supported mechanisms: CBIV, CB05, SAPRC99, SAPRC07, RADM2, GEOS-CHEM
Providing gridded emissions by mechanisms directly, using a speciation/spatial allocation matrix approach
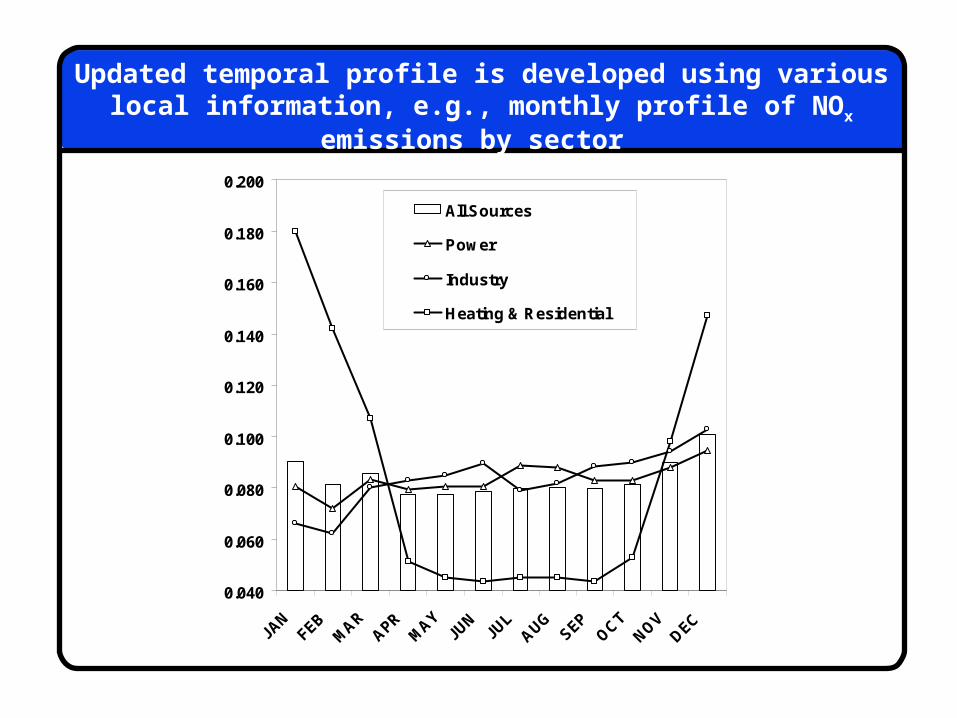
Updated temporal profile is developed using various local information, e.g., monthly profile of NOx emissions by sector
0.040
0.060
0.080
0.100
0.120
0.140
0.160
0.180
0.200
JAN
FEBM
ARAPR
MAY
JUN
JUL
AUGSEP
OCTNOV
DEC
All Sources
Power
Industry
Heating & Residential
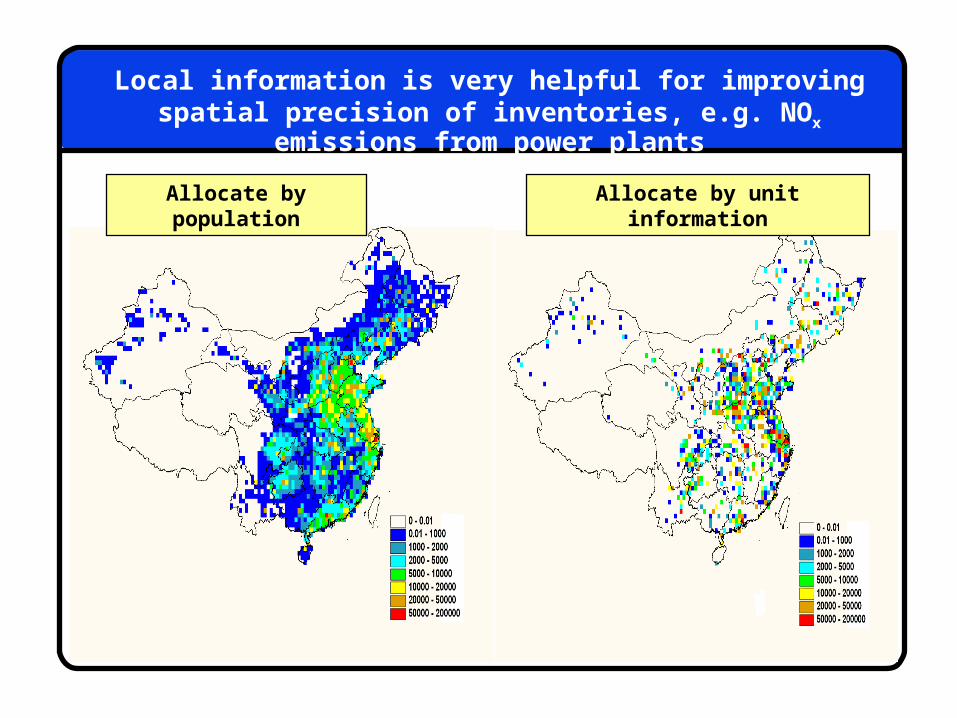
Local information is very helpful for improving spatial precision of inventories, e.g. NOx emissions from power plants
Allocate by population Allocate by unit information
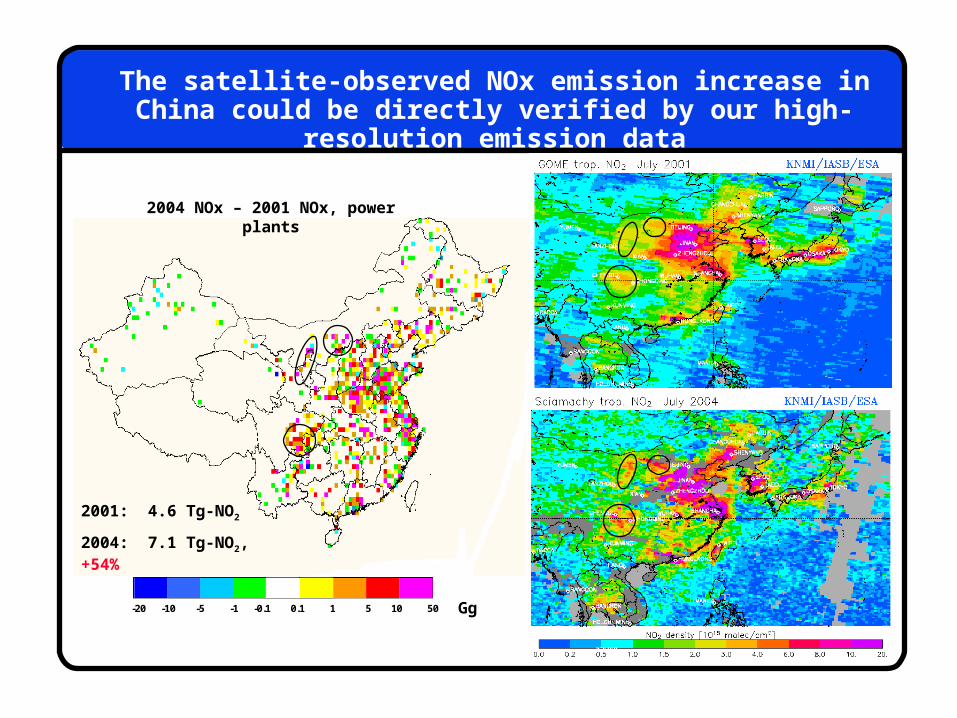
The satellite-observed NOx emission increase in China could be directly verified by our high-resolution emission data
-20 -10 -5 -1 -0.1 0.1 1 5 10 50 Gg
2004 NOx – 2001 NOx, power plants
2001: 4.6 Tg-NO2
2004: 7.1 Tg-NO2, +54%
Summer
0.70
0.80
0.90
1.00
1.10
1.20
1.30
1.40
1.50
1.60
1.70
1996 1997 1998 1999 2000 2001 2002 2003 2004
Inventory
Satellite
Winter
0.70
0.80
0.90
1.00
1.10
1.20
1.30
1.40
1.50
1.60
1.70
1996 1997 1998 1999 2000 2001 2002 2003 2004
Inventory
Satellite
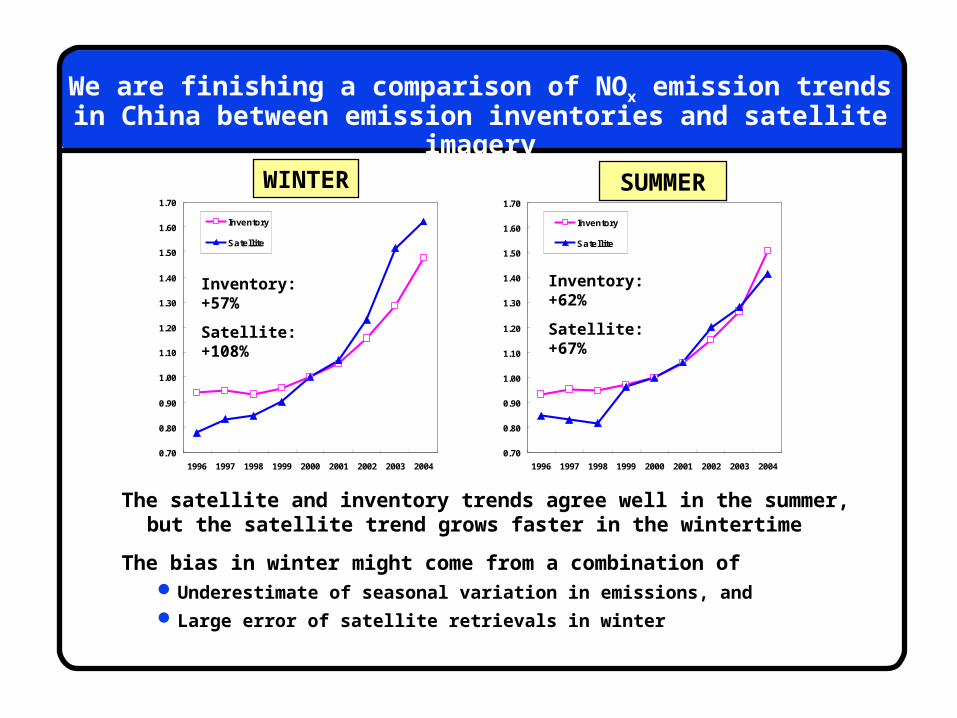
We are finishing a comparison of NOx emission trends in China between emission inventories and satellite imagery
WINTER SUMMER
The satellite and inventory trends agree well in the summer,but the satellite trend grows faster in the wintertime
The bias in winter might come from a combination of Underestimate of seasonal variation in emissions, and
Large error of satellite retrievals in winter
Inventory: +57%
Satellite: +108%
Inventory: +62%
Satellite: +67%
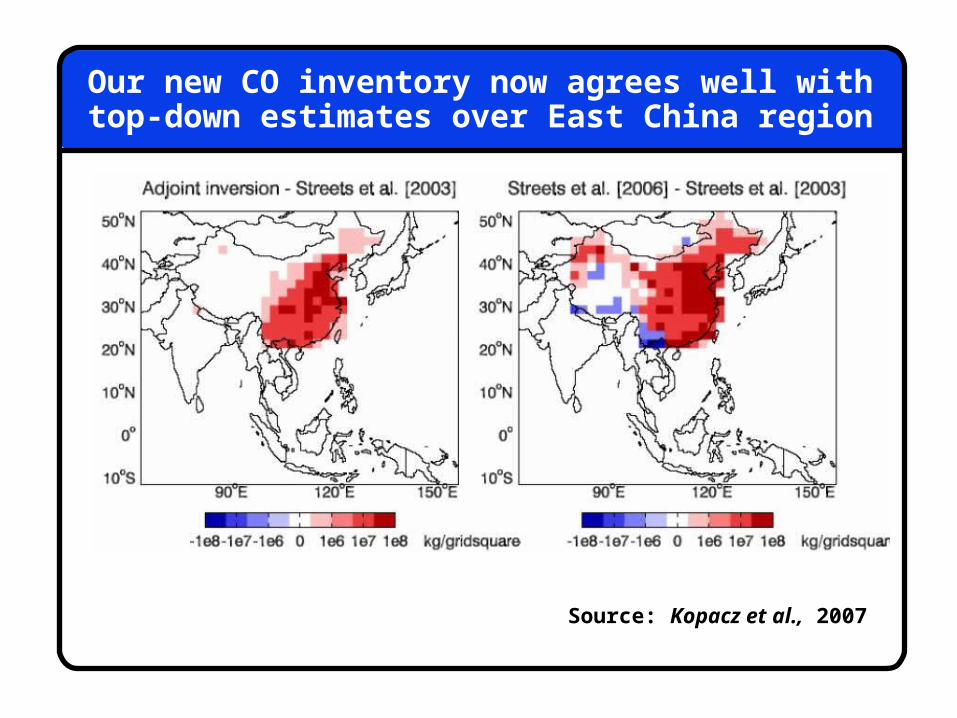
Our new CO inventory now agrees well with top-down estimates over East China region
Source: Kopacz et al., 2007
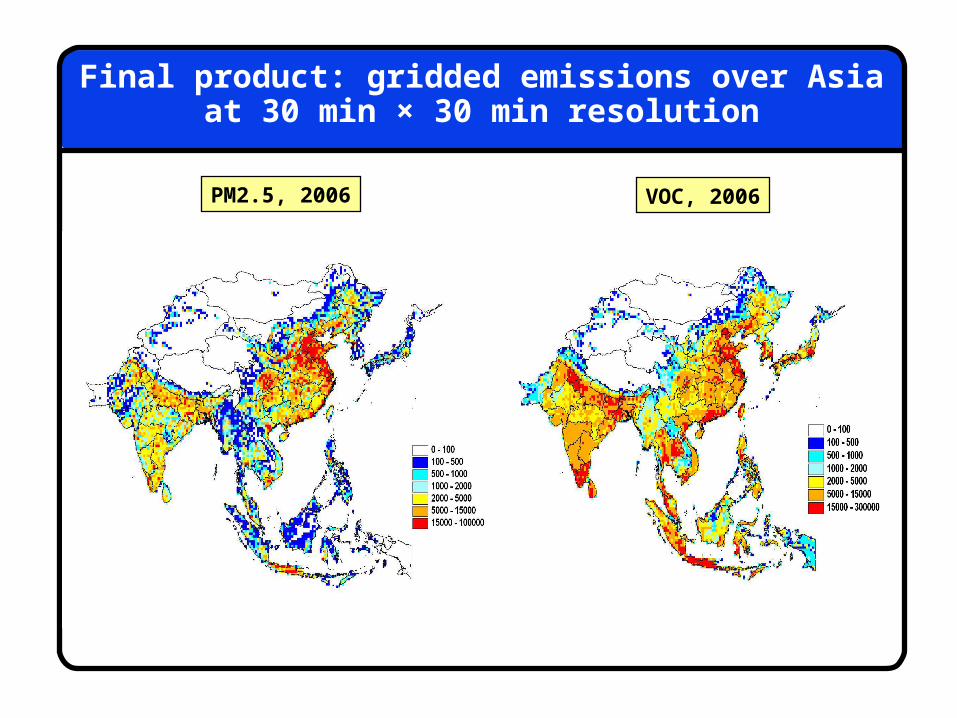
Final product: gridded emissions over Asia at 30 min × 30 min resolution
PM2.5, 2006 VOC, 2006
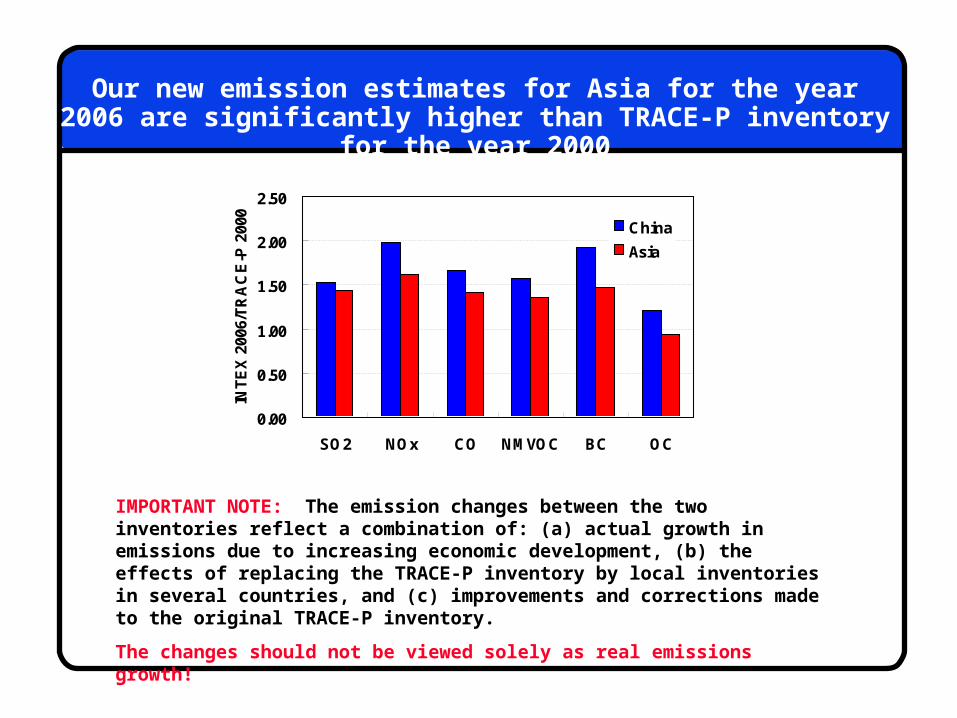
Our new emission estimates for Asia for the year 2006 are significantly higher than TRACE-P inventory for the year 2000
0.00
0.50
1.00
1.50
2.00
2.50
SO2 NOx CO NMVOC BC OC
INT
EX
200
6/T
RA
CE
-P 2
000
China
Asia
IMPORTANT NOTE: The emission changes between the two inventories reflect a combination of: (a) actual growth in emissions due to increasing economic development, (b) the effects of replacing the TRACE-P inventory by local inventories in several countries, and (c) improvements and corrections made to the original TRACE-P inventory.
The changes should not be viewed solely as real emissions growth!
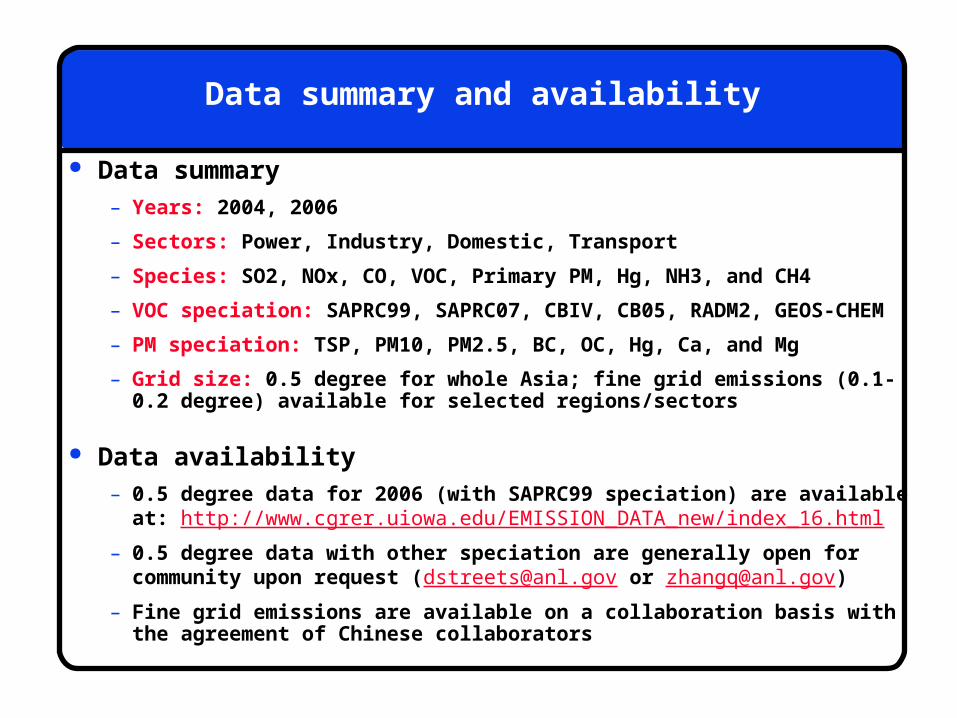
Data summary and availability
Data summary– Years: 2004, 2006
– Sectors: Power, Industry, Domestic, Transport
– Species: SO2, NOx, CO, VOC, Primary PM, Hg, NH3, and CH4
– VOC speciation: SAPRC99, SAPRC07, CBIV, CB05, RADM2, GEOS-CHEM
– PM speciation: TSP, PM10, PM2.5, BC, OC, Hg, Ca, and Mg
– Grid size: 0.5 degree for whole Asia; fine grid emissions (0.1-0.2 degree) available for selected regions/sectors
Data availability– 0.5 degree data for 2006 (with SAPRC99 speciation) are available at:
http://www.cgrer.uiowa.edu/EMISSION_DATA_new/index_16.html
– 0.5 degree data with other speciation are generally open for community upon request ([email protected] or [email protected])
– Fine grid emissions are available on a collaboration basis with the agreement of Chinese collaborators
Further reading for methodologies and numbers
Streets, D.G., J. Hao, Y. Wu, J. Jiang, M. Chan, H. Tian, and X. Feng (2005), Anthropogenic mercury emissions in China, Atmos. Environ., 39, 7789-7806.
Streets, D.G., Q. Zhang, L Wang, K. He, J. Hao, Y Wu, Y. Tang, and G.R. Carmichael (2006), Revisiting China’s CO emissions after TRACE-P: Synthesis of inventories, atmospheric modeling, and observations, J. Geophys. Res., 111, D14306, doi: 10.1029/2006JD007118.
Zhang Q., Streets, D.G., K. He, Y.X. Wang, A. Richter, J. P. Burrows, I. Uno, C. J. Jang, D. Chen, Z. Yao, and Y. Lei (2007), NOx emission trends for China, 1995-2004: The view from the ground and the view from space, J. Geophys. Res., in press
Zhang Q., Streets D.G., K. He, and Z. Klimont (2007), Major components of China’s anthropogenic primary particulate emissions, Environ. Res. Lett., submitted
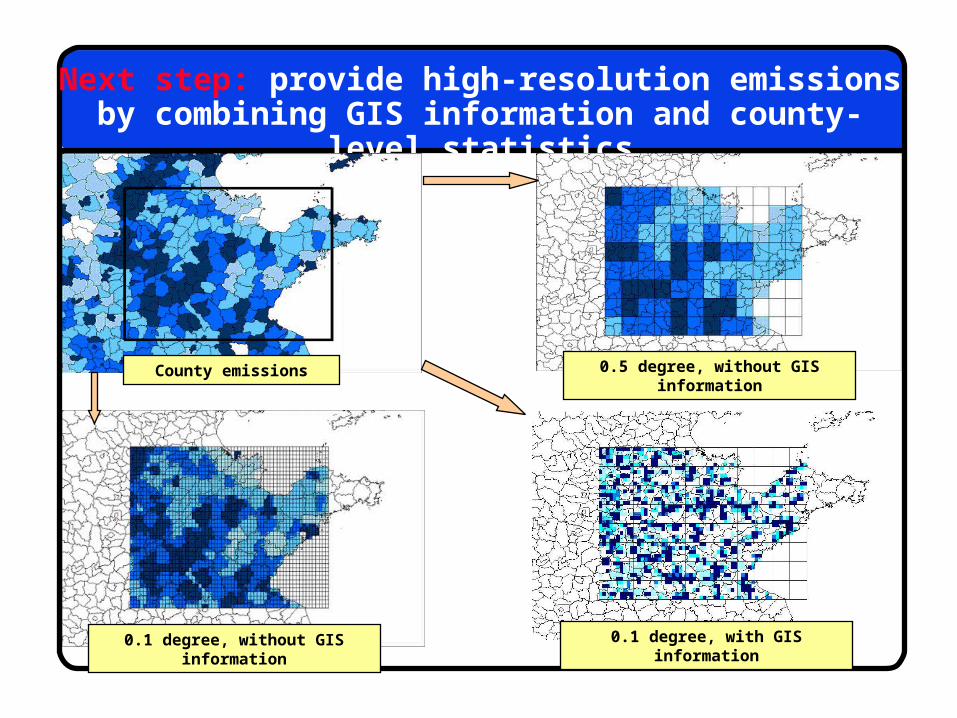
Next step: provide high-resolution emissions by combining GIS information and county-level statistics
0.1 degree, without GIS information 0.1 degree, with GIS information
0.5 degree, without GIS informationCounty emissions
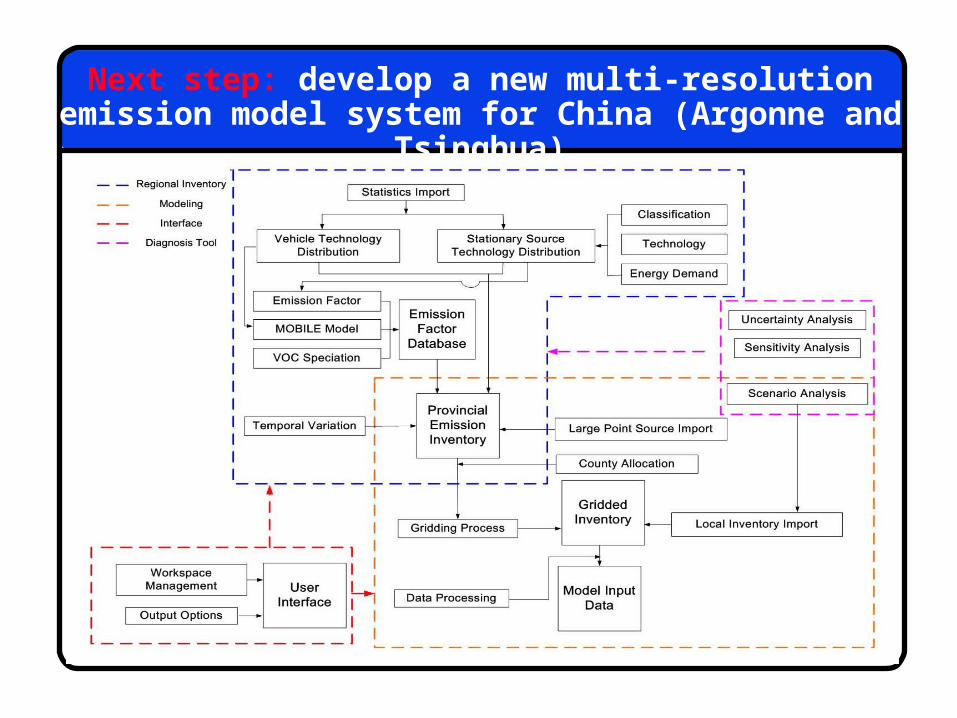
Next step: develop a new multi-resolution emission model system for China (Argonne and Tsinghua)
Acknowledgements
USEPA, especially Dr. Carey Jang
NASA INTEX project
China National Basic Research Program (973) & National High-Technology Research Program (863)
Collaborators at Tsinghua University, China