Embed Size (px)
Citation preview
ESP – plenary meeting – Ispra 21-22 May 2014
A new approach for mapping soil indicators at national level A new approach for mapping soil indicators at national level by upby up--scaling and scaling and harmonisingharmonising local soil data local soil data
Ialina Vinci
ARPAV
ESP – plenary meeting – Ispra 21-22 May 2014
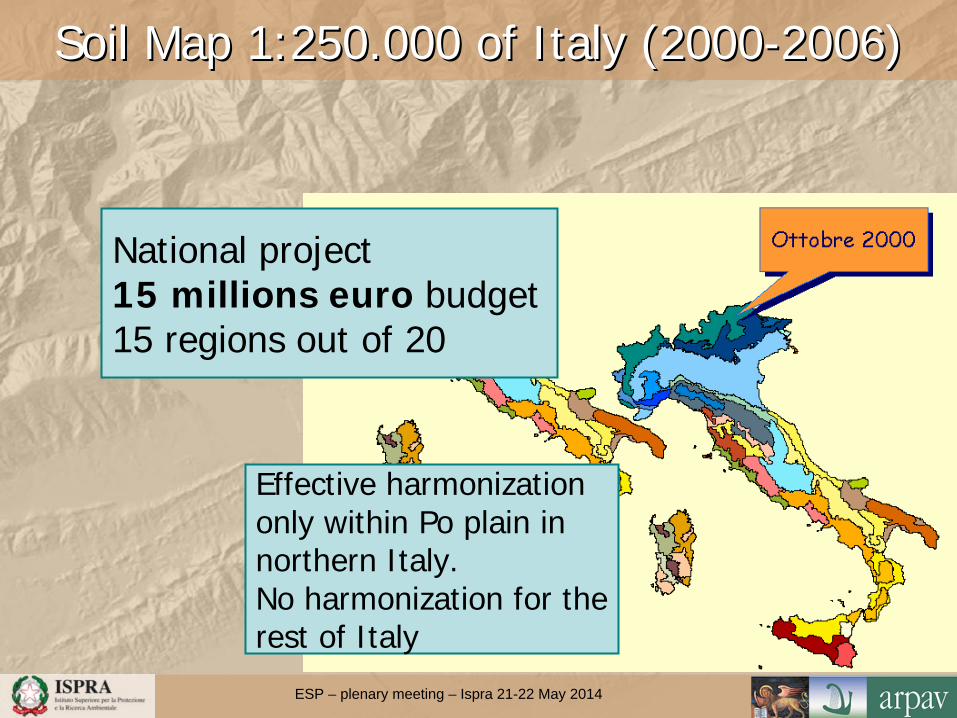
SoilSoil MapMap 1:250.000 1:250.000 ofof Italy (2000Italy (2000--2006)2006)
National project15 millions euro budget15 regions out of 20
Effective harmonization only within Po plain in northern Italy.No harmonization for the rest of Italy

ESP – plenary meeting – Ispra 21-22 May 2014
Soil Map HarmonizationSoil Map HarmonizationPre-zoning of the Po Valley (5 administrative regions)
The Po-valley
ESP – plenary meeting – Ispra 21-22 May 2014
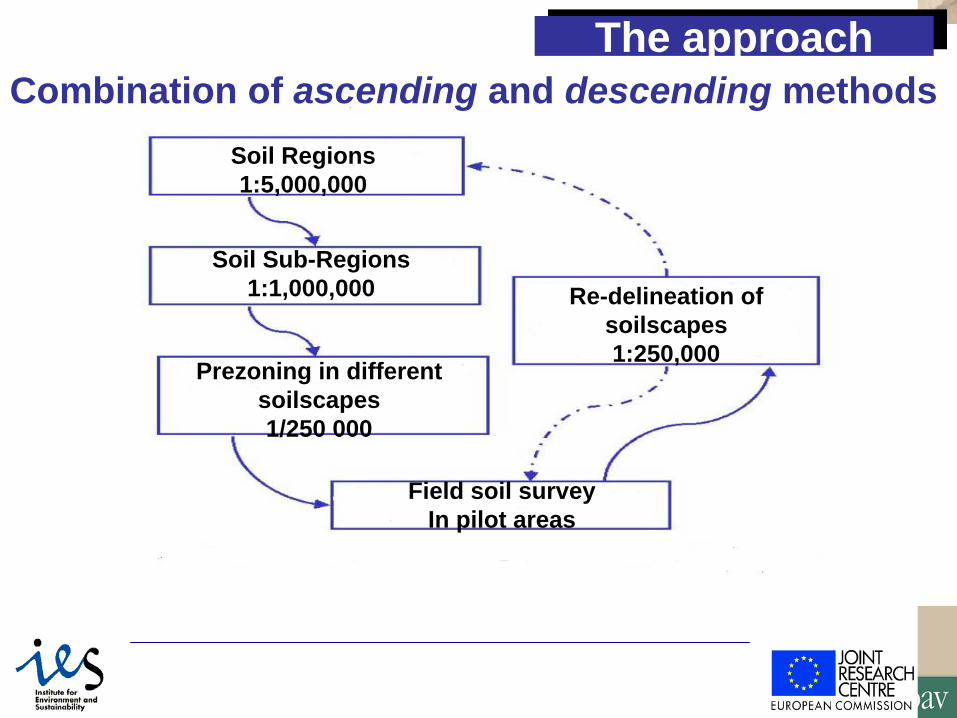
La méthode HéliceThe approachThe approach
Combination of ascending and descending methodsSoil Regions1:5,000,000
Soil Sub-Regions1:1,000,000
Prezoning in different soilscapes1/250 000
Field soil surveyIn pilot areas
Re-delineation of soilscapes1:250,000

ESP – plenary meeting – Ispra 21-22 May 2014
Interregional Harmonization Remarks
Interregional Harmonization Remarks
Soil map harmonization asks for:
a perfect synchronizationof the activities of the different staffs
highly qualified permanent staff
In practice,things are quite different
ESP – plenary meeting – Ispra 21-22 May 2014
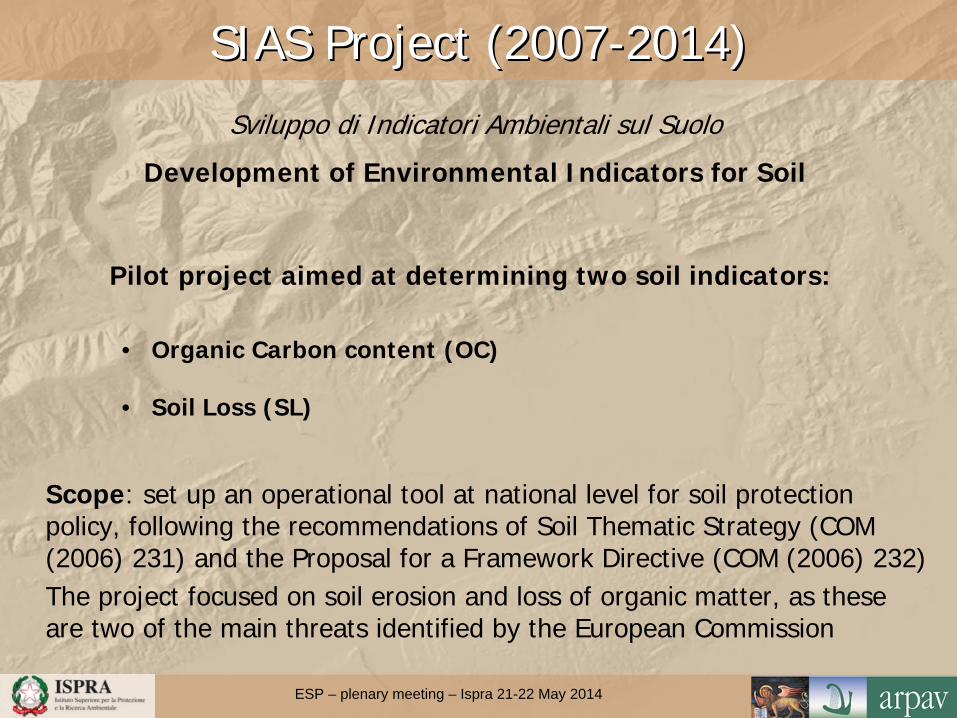
SIAS Project (2007SIAS Project (2007--2014)2014)Sviluppo di Indicatori Ambientali sul Suolo
Development of Environmental Indicators for Soil
Pilot project aimed at determining two soil indicators:
• Organic Carbon content (OC)
• Soil Loss (SL)
Scope: set up an operational tool at national level for soil protection policy, following the recommendations of Soil Thematic Strategy (COM (2006) 231) and the Proposal for a Framework Directive (COM (2006) 232)The project focused on soil erosion and loss of organic matter, as these are two of the main threats identified by the European Commission
ESP – plenary meeting – Ispra 21-22 May 2014
• ISPRA (Institute for Environmental Protection and Research in Italy) - Financing body and project coordinator
• ARPAV (Environmental Protection Agency of the Veneto Region) - technical-scientific coordinator
• Regional Soil Survey Services - contributor for methodology defining, soil data elaboration and soil indicator assessment
• JRC (Land Management and Natural Hazards Unit) - contributor for implementing the methodology of upscaling data, ensuring consistency with European standards and procedures
• CRA-ABP (Research Centre for Agrobiology and Pedology) - support in defining soil erosion methodology
SIAS Project SIAS Project -- PARTNERSPARTNERS
ESP – plenary meeting – Ispra 21-22 May 2014
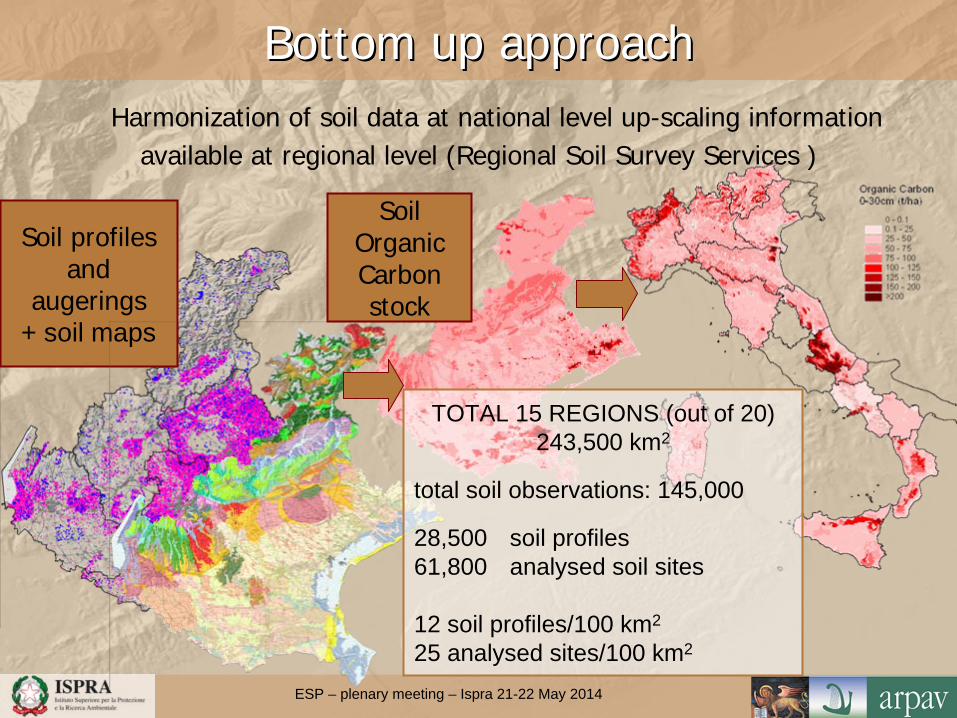
Bottom up approachBottom up approachHarmonization of soil data at national level up-scaling information
available at regional level (Regional Soil Survey Services )
Soil profiles and
augerings+ soil maps
Soil Organic Carbon stock
TOTAL 15 REGIONS (out of 20)243,500 km2
total soil observations: 145,000
28,500 soil profiles61,800 analysed soil sites
12 soil profiles/100 km2
25 analysed sites/100 km2
ESP – plenary meeting – Ispra 21-22 May 2014
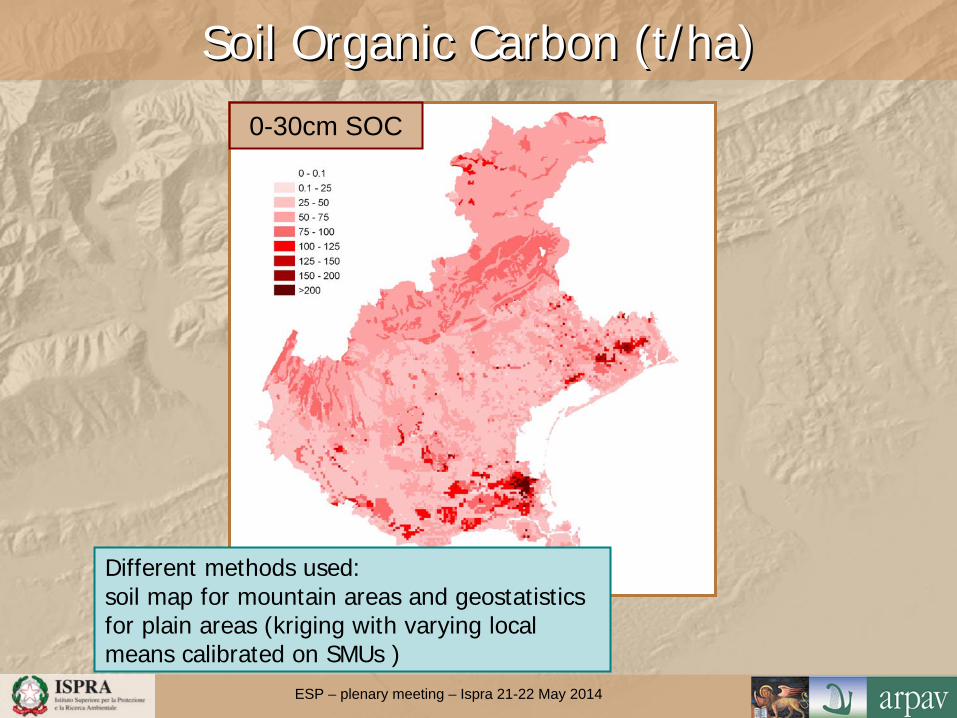
SoilSoil OrganicOrganic CarbonCarbon (t/ha)(t/ha)
0-30cm SOC
Different methods used:soil map for mountain areas and geostatistics for plain areas (kriging with varying local means calibrated on SMUs )
ESP – plenary meeting – Ispra 21-22 May 2014
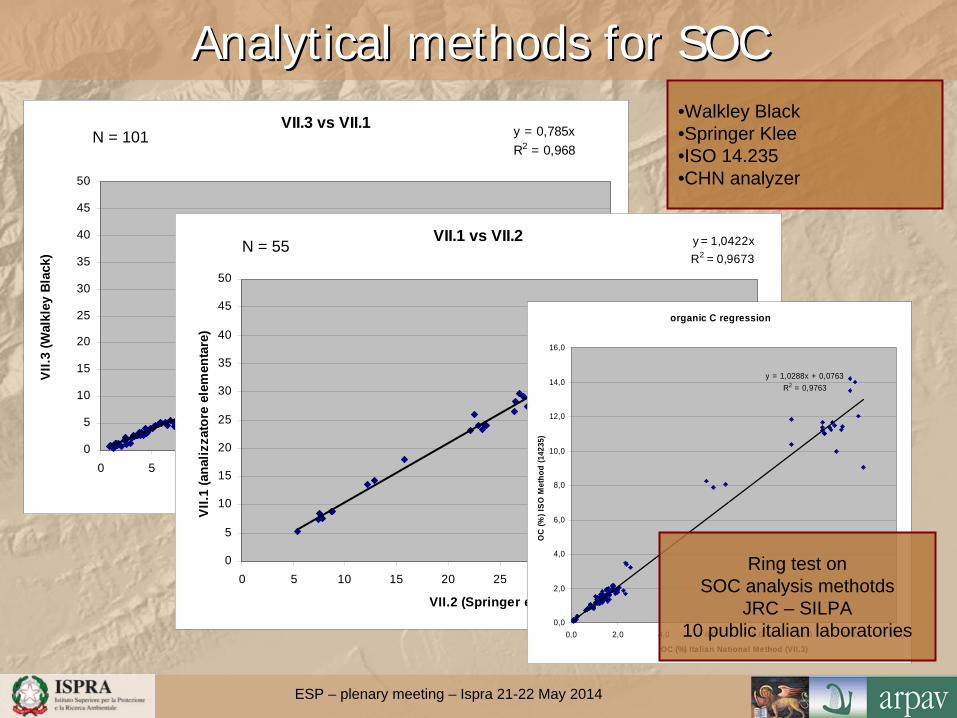
VII.3 vs VII.1 y = 0,785xR2 = 0,968
0
5
10
15
20
25
30
35
40
45
50
0 5 10 15 20 25 30 35 40 45 50
VII.1 (analizzatore elementare)
VII.3
(Wal
kley
Bla
ck)
N = 101
VII.1 vs VII.2 y = 1,0422xR2 = 0,9673
0
5
10
15
20
25
30
35
40
45
50
0 5 10 15 20 25 30 35 40 45 50
VII.2 (Springer e Klee)
VII.1
(ana
lizza
tore
ele
men
tare
)
N = 55
AnalyticalAnalytical methodsmethods forfor SOCSOC
organic C regression
y = 1,0288x + 0,0763R2 = 0,9763
0,0
2,0
4,0
6,0
8,0
10,0
12,0
14,0
16,0
0,0 2,0 4,0 6,0 8,0 10,0 12,0 14,0
OC (%) Italian National Method (VII.3)
OC
(%) I
SO M
etho
d (1
4235
)
Ring test on SOC analysis methotds
JRC – SILPA10 public italian laboratories
•Walkley Black•Springer Klee•ISO 14.235•CHN analyzer
ESP – plenary meeting – Ispra 21-22 May 2014
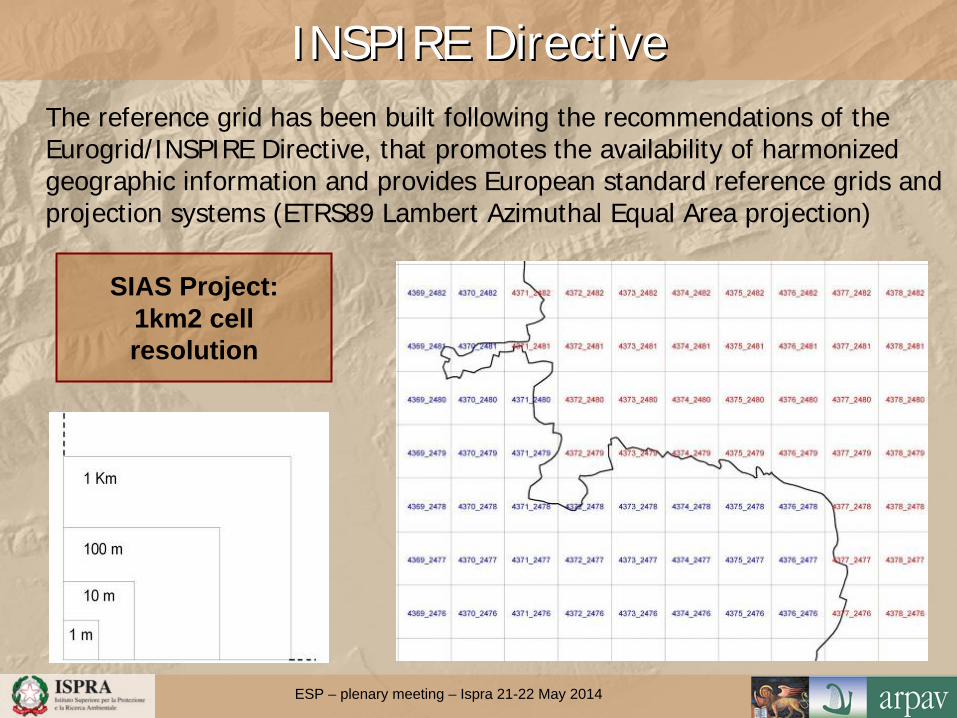
INSPIRE INSPIRE DirectiveDirectiveThe reference grid has been built following the recommendations of the Eurogrid/INSPIRE Directive, that promotes the availability of harmonized geographic information and provides European standard reference grids and projection systems (ETRS89 Lambert Azimuthal Equal Area projection)
SIAS Project:1km2 cell resolution

ESP – plenary meeting – Ispra 21-22 May 2014
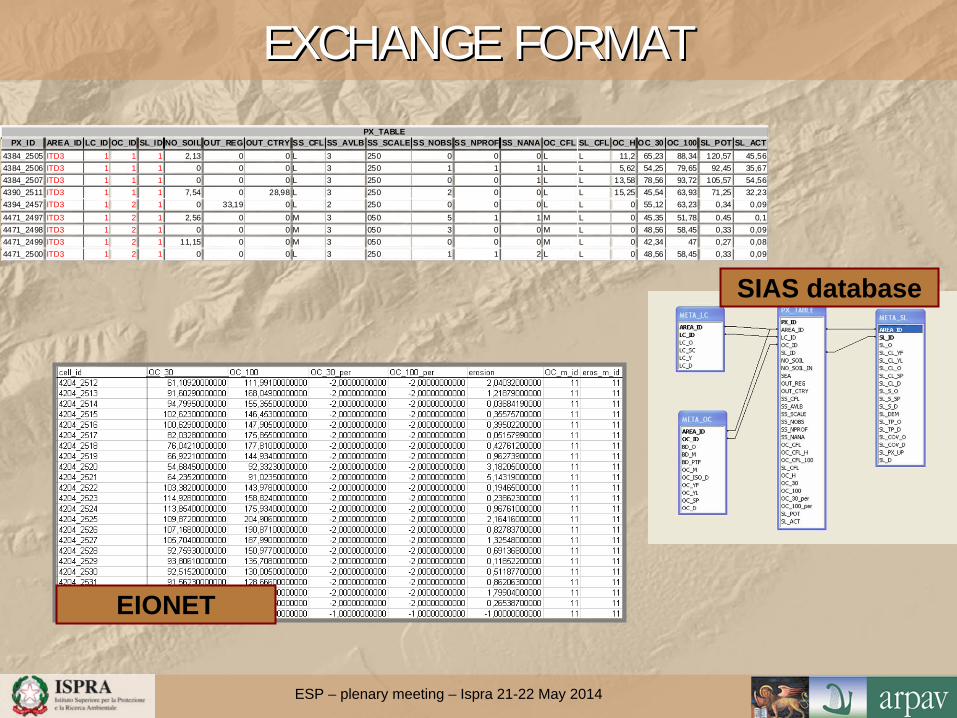
EXCHANGE FORMATEXCHANGE FORMATTo collect pixel data and meta-information, an exchange format has been set up jointly by the working group.The format has four tables:• PX_TABLE (one record per pixel): contains data about soil organic carbon stock,
soil loss, pixel coverage and some quality information indexes (number of available observations, number of analyzed observations, scale of available soil maps and confidence levels for each indicator)
• META_LC, META_OC and META_SL: store meta-information (i.e. information on procedures and raw data used) on land cover, organic carbon stock and soil loss.
PX_TABLE PX_ID AREA_ID LC_ID OC_ID SL_ID NO_SOIL OUT_REG OUT_CTRY SS_CFL SS_AVLB SS_SCALE SS_NOBS SS_NPROF SS_NANA OC_CFL SL_CFL OC_H OC_30 OC_100 SL_POT SL_ACT
4384_2505 ITD3 1 1 1 2,13 0 0 L 3 250 0 0 0 L L 11,2 65,23 88,34 120,57 45,564384_2506 ITD3 1 1 1 0 0 0 L 3 250 1 1 1 L L 5,62 54,25 79,65 92,45 35,674384_2507 ITD3 1 1 1 0 0 0 L 3 250 0 0 1 L L 13,58 78,56 93,72 105,57 54,564390_2511 ITD3 1 1 1 7,54 0 28,98 L 3 250 2 0 0 L L 15,25 45,54 63,93 71,25 32,234394_2457 ITD3 1 2 1 0 33,19 0 L 2 250 0 0 0 L L 0 55,12 63,23 0,34 0,094471_2497 ITD3 1 2 1 2,56 0 0 M 3 050 5 1 1 M L 0 45,35 51,78 0,45 0,14471_2498 ITD3 1 2 1 0 0 0 M 3 050 3 0 0 M L 0 48,56 58,45 0,33 0,094471_2499 ITD3 1 2 1 11,15 0 0 M 3 050 0 0 0 M L 0 42,34 47 0,27 0,084471_2500 ITD3 1 2 1 0 0 0 L 3 250 1 1 2 L L 0 48,56 58,45 0,33 0,09
META_LC AREA_ID LC_ID LC_O LC_SC LC_Y LC_D ITD3 1 C 100 2000 Per il codice 333 "aree a vegetazione rada" è stato utilizzato un coefficiente di copertura di 0,3 sia per il calcolo del Carbonio Organico che per la st ima dell'erosioneITD5 1 R 025 2003 Carta dell'uso reale del suolo in scala 1:25.000. Codifica f ino al IV livello CORINE. Sono rappresentati poligoni di area >= 1 ha
META_OC AREA_ID OC_ID BD_O BD_M BD_PTF OC_M OC_ISO_D OC_YF OC_YL OC_SP OC_D ITD3 1 B 1 08 1 Utilizzo della regress ione ISO =
1,0288 * M.U. + 0,0763 ( R2 = 0.9763), ottenuto dalle prove di 8 lab. pubblici italiani x 4 campioni x 3 ripetizioni = 96 dati
1993 2007 A1 Metodo usato per le aree montane, dove ci sono pochi dati a disposizione; i valori % di C.O. usati per le STU sono i valori modali dei singoli orizzont i derivat i da quelli delle osservazioni con alto grado di ricollegamento all'UTS (profili tipici e rappresentat ivi); le densità apparenti utilizzate sono s timate con pedofunzioni tarate sui dat i regionali misurati, a partire dai dati di argilla, sabbia e C.O., modali dell'UTS
ITD3 2 B 1 08 1 Utilizzo della regress ione ISO = 1,0288 * M.U. + 0,0763 ( R2 = 0.9763), ottenuto dalle prove di 8 lab. pubblici italiani x 4 campioni x 3 ripetizioni = 96 dati
1993 2007 C3 Metodo usato per la pianura dove i dati consentono un appropriato uso della geostatistica; sono s tati usat i i valori % di C.O. delle singole osservazioni, e i dati di densità apparente, misurati, dove disponibili, o stimati con pedofunzioni (tarate sui dati regionali misurat i), a partire dai dati di argilla, sabbia e C.O.; la geostat ist ica è stata calibrata, nelle UC, sui valori modali di C.O. di gruppi funzionali di STU, gruppi creati sulla base di scheletro, tessitura superficiale, drenaggio, presenza di orizzonti mollici/organici
META_SL
AREA_ID SL_ID SL_O SL_CL_YF SL_CL_YL SL_CL_O SL_CL_SP SL_CL_D SL_S_O SL_S_SP SL_S_D SL_DEM
SL_TP_O SL_TP_D SL_COV_O SL_COV_D SL_PX_UP SL_D
ITD3 1 03 1992 2004 03 A3 Intensità dei dati di precipitazione: 5 minuti
02 A1 per i parametri sono stat i usati i valori modali dei singoli orizzont i dell'UTS (derivati dalle osservazioni con alto grado di ricollegamento: prof ili tipici e rappresentat ivi)
2 07 Lunghezza max del versante imposta a 450m
07 Valori di C presi da fonti diverse (Suri et al. 2002, ecc.), adattati a giudizio di esperto alla realtà locale
A2 Controllo dei risultati a giudizio d'esperto per assenza di dati sperimentali
SIAS database
ESP – plenary meeting – Ispra 21-22 May 2014
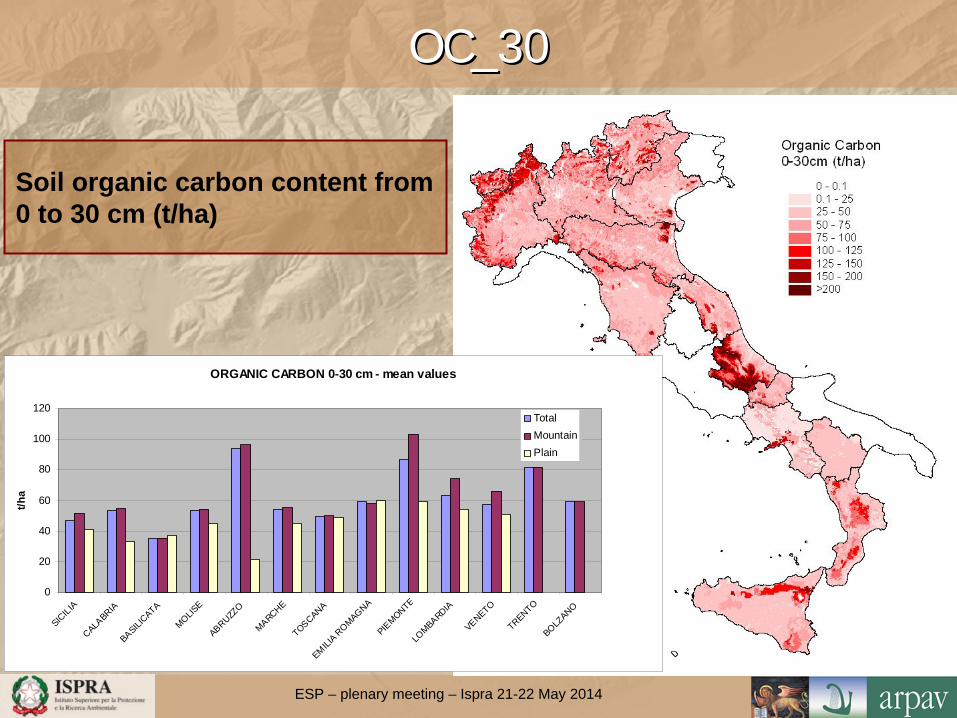
OC_30OC_30
Soil organic carbon content from 0 to 30 cm (t/ha)
ORGANIC CARBON 0-30 cm - mean values
0
20
40
60
80
100
120
SICILIA
CALABRIA
BASILICATA
MOLISE
ABRUZZO
MARCHETOSCANA
EMILIA R
OMAGNAPIE
MONTELO
MBARDIA
VENETO
TRENTOBOLZ
ANO
t/ha
TotalMountainPlain

ESP – plenary meeting – Ispra 21-22 May 2014
PEDOTRANSFER FUNCTIONSPEDOTRANSFER FUNCTIONS
From thousunds of bulk density and measurements PTF (pedotransfer functions)
were derived for our soils(CNR IRPI)
By means of PTFs, bulk density was estimated for all the soil typological units using texture and OC
CNR PTF were tested with other literature PTFs

ESP – plenary meeting – Ispra 21-22 May 2014
ANALISI STATISTICA DATI KSAT MISURATIANALISI STATISTICA DATI KSAT MISURATI--STIMATISTIMATI
Diagramma di distribuzione delle misure della Ksat dopo trasformazione logaritmica
Indici di errore e coefficiente di correlazione R2
Tra MISURE e STIME delle PTF
PTF MPE MSPE SDPE RMSPE R2
CNR -0,0353 1,7784 1,3472 1,3336 0,4007 *SAX 1,1805 2,9766 1,2738 1,7253 0,0459BRA -0,4327 3,4349 1,8212 1,8533 0,4703 *JAR 6,1365 45,2164 2,7786 6,7243 0,2011
*= p≤0,05
PTF MPE MSPE SDPE RMSPE R2
CNR -0,2484 0,5768 0,7185 0,7595 0,6360 *SAX 0,2067 0,5000 0,6770 0,7071 0,5037 *BRA -0,4337 0,7032 0,7184 0,8385 0,7221 *JAR 0,9450 1,7484 0,9279 1,3223 0,4120 *
*= p≤0,05
Indici di errore e coefficiente di correlazione R2
tra STIME D’ESPERTO e STIME delle PTF
n
iibibn
MSPE1
2
,,ˆ1
MSPE - mean square prediction error
ESP – plenary meeting – Ispra 21-22 May 2014
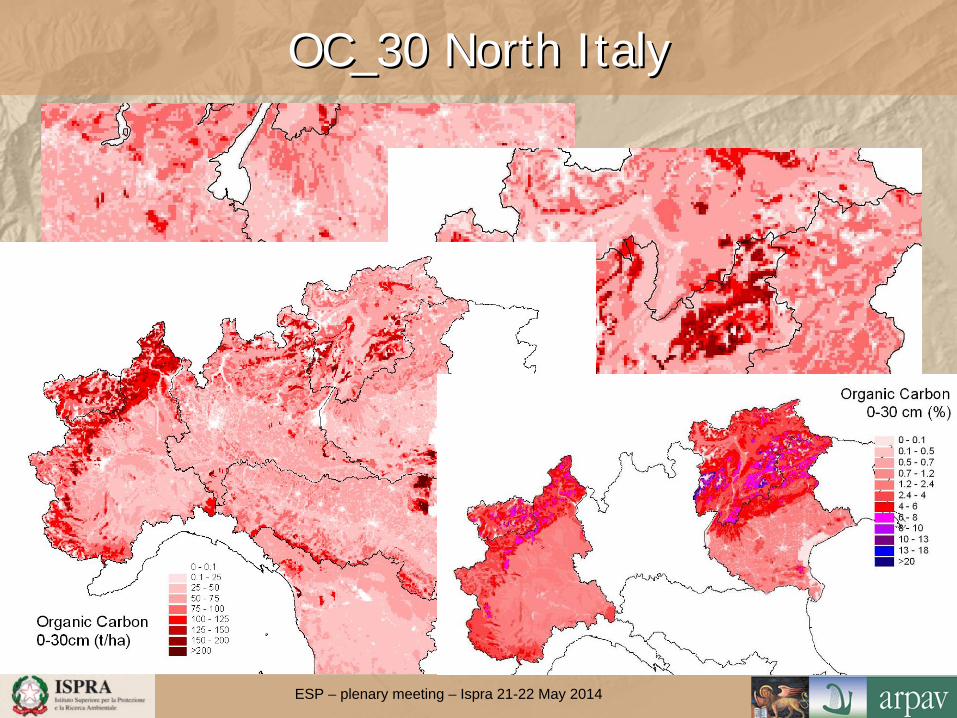
OC_30 North ItalyOC_30 North Italy
ESP – plenary meeting – Ispra 21-22 May 2014
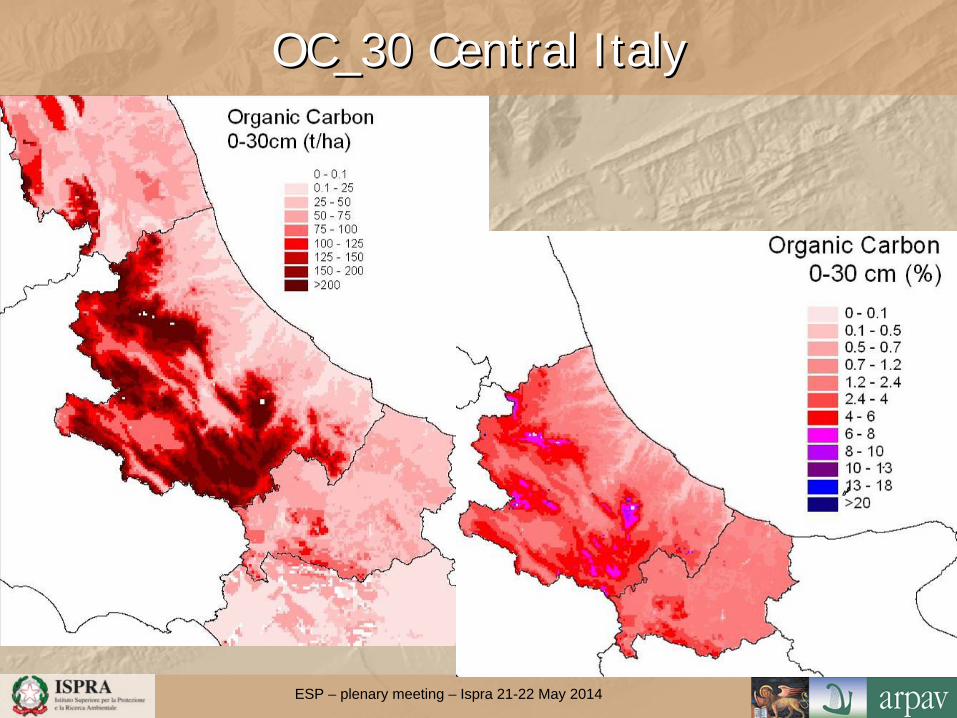
OC_30 OC_30 CentralCentral ItalyItaly
ESP – plenary meeting – Ispra 21-22 May 2014
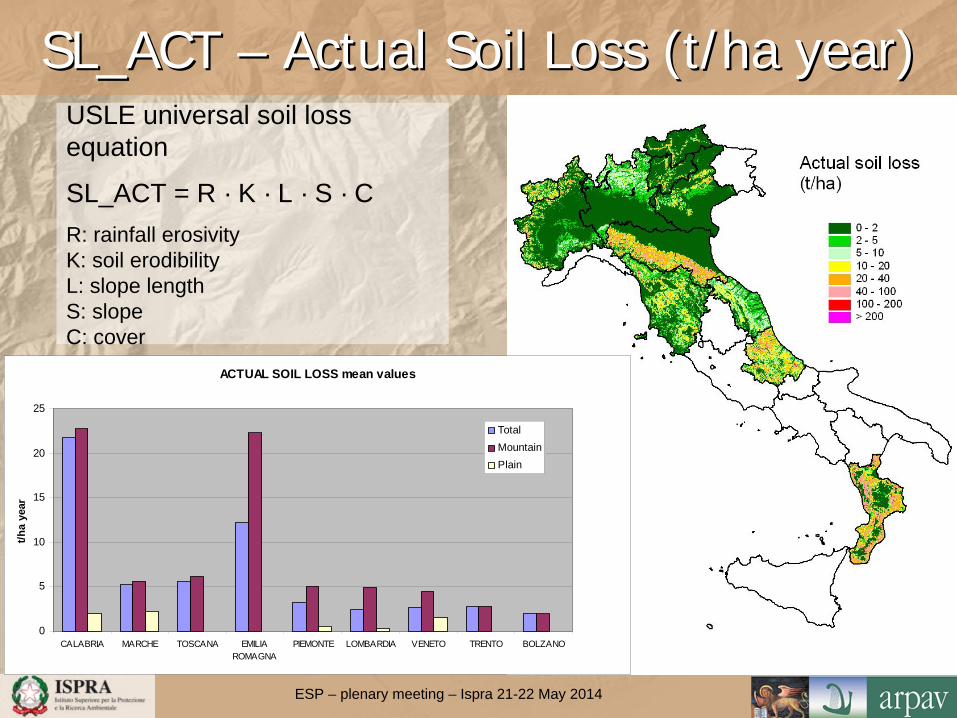
SL_ACTSL_ACT –– ActualActual SoilSoil Loss (t/ha Loss (t/ha yearyear))
ACTUAL SOIL LOSS mean values
0
5
10
15
20
25
CALABRIA MARCHE TOSCANA EMILIAROMAGNA
PIEMONTE LOMBARDIA VENETO TRENTO BOLZANO
t/ha
year
TotalMountainPlain
USLE universal soil loss equation
SL_ACT = R · K · L · S · CR: rainfall erosivityK: soil erodibilityL: slope lengthS: slopeC: cover
ESP – plenary meeting – Ispra 21-22 May 2014
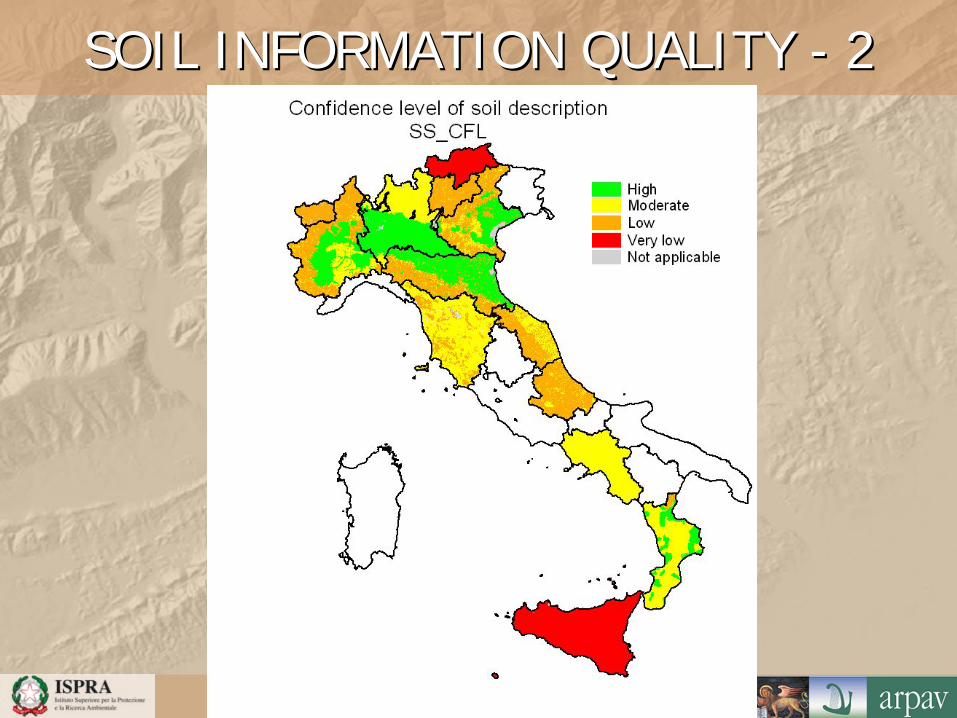
SOIL INFORMATION QUALITY SOIL INFORMATION QUALITY -- 22
ESP – plenary meeting – Ispra 21-22 May 2014
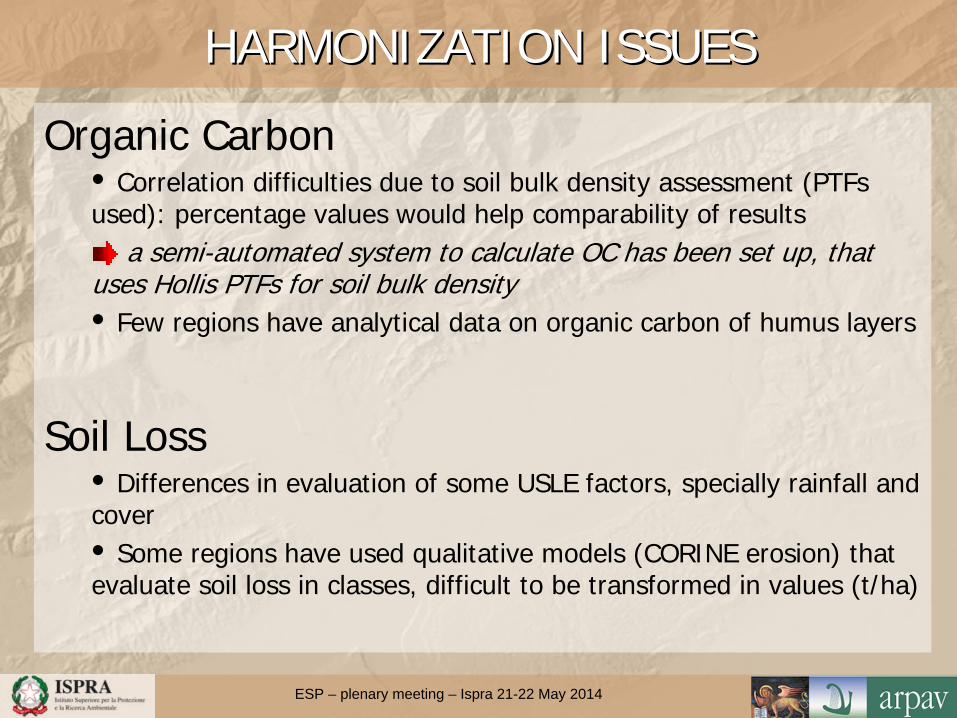
HARMONIZATION ISSUESHARMONIZATION ISSUES
Organic Carbon• Correlation difficulties due to soil bulk density assessment (PTFs used): percentage values would help comparability of results
a semi-automated system to calculate OC has been set up, that uses Hollis PTFs for soil bulk density• Few regions have analytical data on organic carbon of humus layers
Soil Loss• Differences in evaluation of some USLE factors, specially rainfall and cover• Some regions have used qualitative models (CORINE erosion) that evaluate soil loss in classes, difficult to be transformed in values (t/ha)
ESP – plenary meeting – Ispra 21-22 May 2014
EXCHANGE FORMATEXCHANGE FORMAT
PX_TABLE PX_ID AREA_ID LC_ID OC_ID SL_ID NO_SOIL OUT_REG OUT_CTRY SS_CFL SS_AVLB SS_SCALE SS_NOBS SS_NPROF SS_NANA OC_CFL SL_CFL OC_H OC_30 OC_100 SL_POT SL_ACT
4384_2505 ITD3 1 1 1 2,13 0 0 L 3 250 0 0 0 L L 11,2 65,23 88,34 120,57 45,564384_2506 ITD3 1 1 1 0 0 0 L 3 250 1 1 1 L L 5,62 54,25 79,65 92,45 35,674384_2507 ITD3 1 1 1 0 0 0 L 3 250 0 0 1 L L 13,58 78,56 93,72 105,57 54,564390_2511 ITD3 1 1 1 7,54 0 28,98 L 3 250 2 0 0 L L 15,25 45,54 63,93 71,25 32,234394_2457 ITD3 1 2 1 0 33,19 0 L 2 250 0 0 0 L L 0 55,12 63,23 0,34 0,094471_2497 ITD3 1 2 1 2,56 0 0 M 3 050 5 1 1 M L 0 45,35 51,78 0,45 0,14471_2498 ITD3 1 2 1 0 0 0 M 3 050 3 0 0 M L 0 48,56 58,45 0,33 0,094471_2499 ITD3 1 2 1 11,15 0 0 M 3 050 0 0 0 M L 0 42,34 47 0,27 0,084471_2500 ITD3 1 2 1 0 0 0 L 3 250 1 1 2 L L 0 48,56 58,45 0,33 0,09
SIAS database
EIONET
ESP – plenary meeting – Ispra 21-22 May 2014
ESP – plenary meeting – Ispra 21-22 May 2014
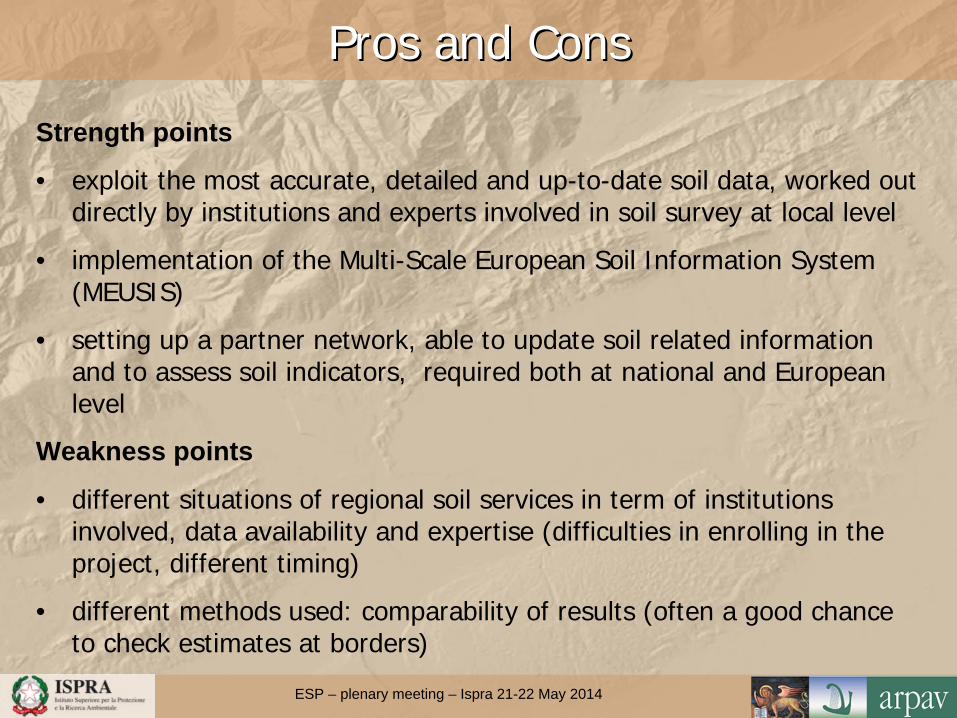
Strength points
• exploit the most accurate, detailed and up-to-date soil data, worked out directly by institutions and experts involved in soil survey at local level
• implementation of the Multi-Scale European Soil Information System (MEUSIS)
• setting up a partner network, able to update soil related information and to assess soil indicators, required both at national and European level
Weakness points
• different situations of regional soil services in term of institutions involved, data availability and expertise (difficulties in enrolling in the project, different timing)
• different methods used: comparability of results (often a good chance to check estimates at borders)
ProsPros and and ConsCons
ESP – plenary meeting – Ispra 21-22 May 2014
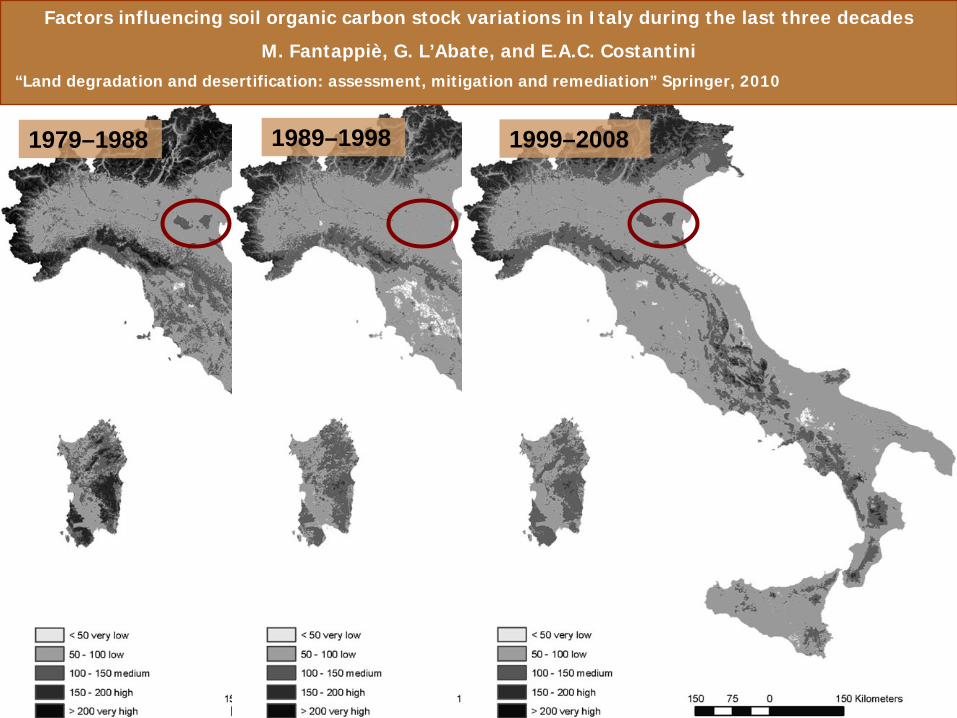
1979–1988 1989–1998 1999–2008
Factors influencing soil organic carbon stock variations in Italy during the last three decades
M. Fantappiè, G. L’Abate, and E.A.C. Costantini“Land degradation and desertification: assessment, mitigation and remediation” Springer, 2010
ESP – plenary meeting – Ispra 21-22 May 2014
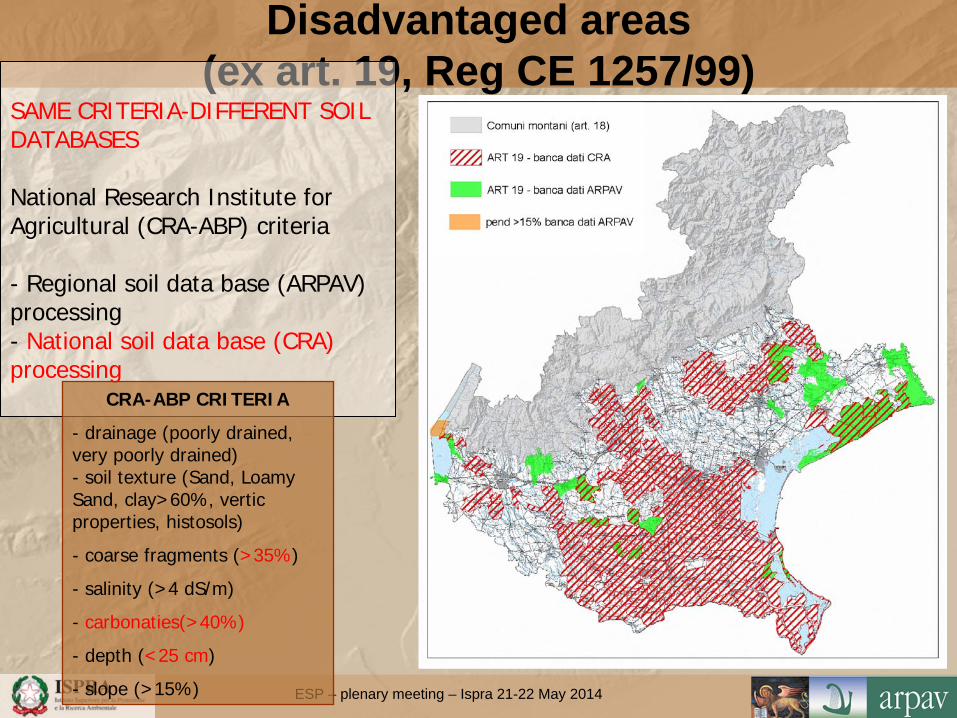
Disadvantaged areas (ex art. 19, Reg CE 1257/99)
SAME CRITERIA-DIFFERENT SOIL DATABASES
National Research Institute for Agricultural (CRA-ABP) criteria
- Regional soil data base (ARPAV) processing- National soil data base (CRA) processing
CRA-ABP CRITERIA
- drainage (poorly drained, very poorly drained)- soil texture (Sand, Loamy Sand, clay>60%, vertic properties, histosols)
- coarse fragments (>35%)
- salinity (>4 dS/m)
- carbonaties(>40%)
- depth (<25 cm)
- slope (>15%)

ESP – plenary meeting – Ispra 21-22 May 2014
Physiographic and depositional units
HEAVY METAL BACKGROUND LEVELHEAVY METAL BACKGROUND LEVEL
Arsenic background level
ESP – plenary meeting – Ispra 21-22 May 2014
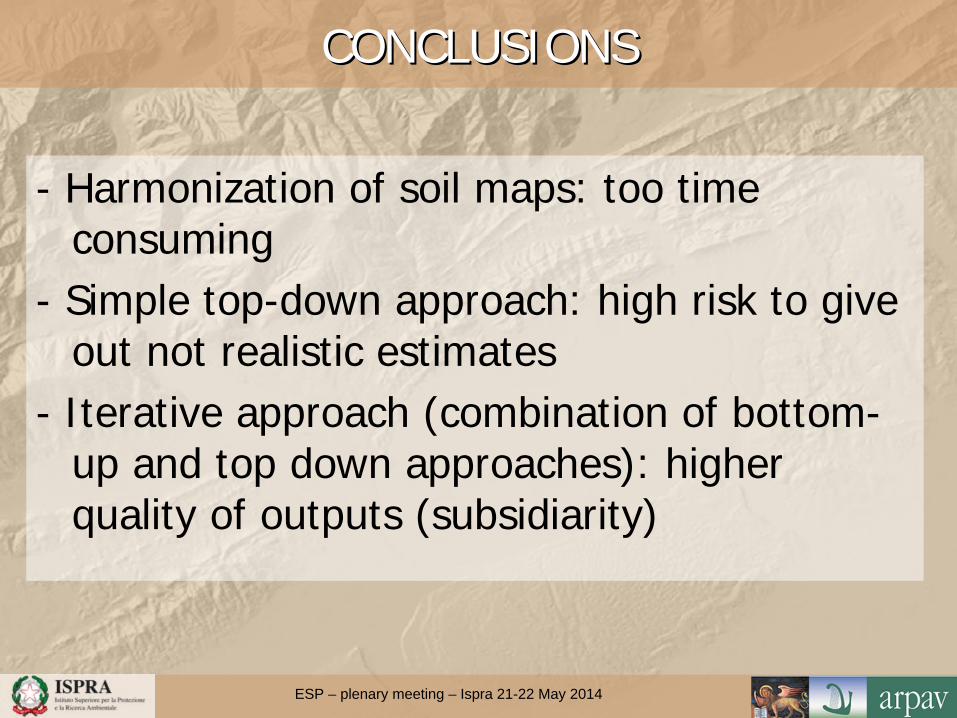
CONCLUSIONSCONCLUSIONS
- Harmonization of soil maps: too time consuming
- Simple top-down approach: high risk to give out not realistic estimates
- Iterative approach (combination of bottom- up and top down approaches): higher quality of outputs (subsidiarity)
ESP – plenary meeting – Ispra 21-22 May 2014
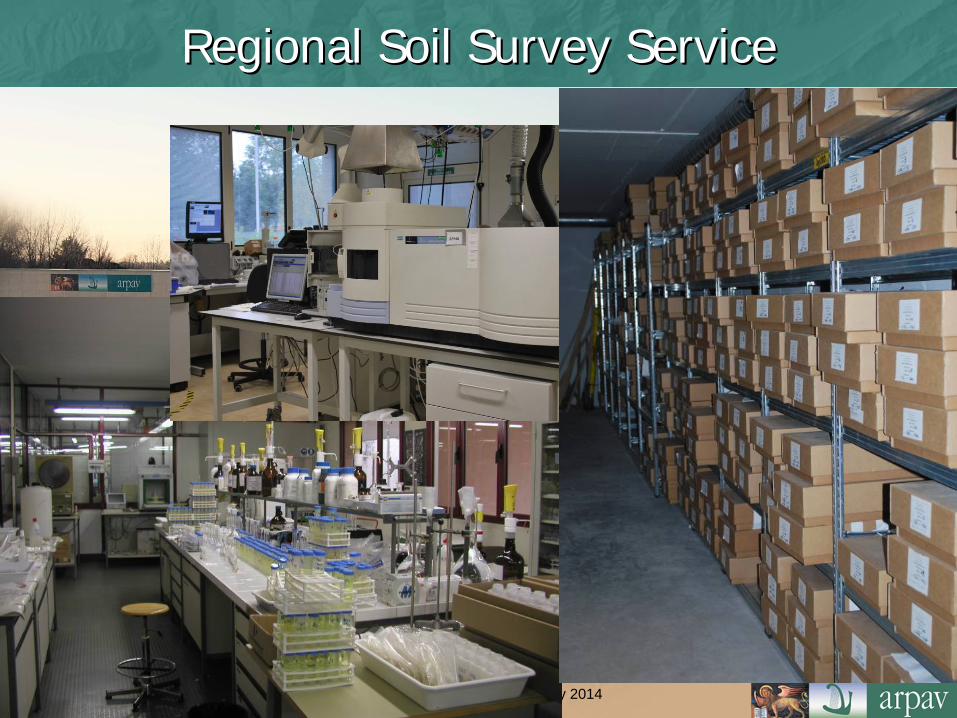
RegionalRegional SoilSoil SurveySurvey ServiceService
ESP – plenary meeting – Ispra 21-22 May 2014