Embed Size (px)
Citation preview
Proceedings of the International Conference on Industrial Engineering and Operations Management
Paris, France, July 26-27, 2018
© IEOM Society International
A new approach for optimal obsolescence forecasting based
on the random forest (RF) technique and meta-heuristic
particle swarm optimization (PSO)
Yosra Grichi, Thien-My Dao and Yvan Beauregard
Department of Mechanical Engineering
École de technologie supérieure
Montreal, H3C 1K3, Canada
[email protected], [email protected],
Abstract
Obsolescence is highly complex problem due to the influence of many factors such as competitive market
pressure, technological advancement and short life cycle of technological components. Basically,
obsolescence problems are often sudden and not planned, causing delays and extra cost. To overcome this
problem, forecasting appears to be one of the most efficient solutions. Indeed, many studies have been
conducted to create models that can effectively forecast obsolescence. In addition, applying machine
learning techniques have attracted many attentions and have been widely used to predict obsolescence
risk and life cycle. Popular algorithms such as random forest, has been reporting satisfactory
performance. To improve the accuracy of machine learning algorithms for obsolescence forecasting, this
paper proposes a new optimization approach for obsolescence forecasting based on random forest (RF)
and Particle Swarm Optimization (PSO). In fact, parameters optimization and features selection of RF
have an important effect on it is predictive accuracy and PSO presents one kind of effective method for
RF parameters and features choosing. To examine the effectiveness of this approach, this paper presents a
comparison between PSO-RF and GA-RF (random forest based on genetic algorithm). Experimental
results show that PSO-RF outperformed GA-RF with 96% of accuracy.
Keywords Obsolescence, forecasting, optimization, machine learning, random forest, particle swarm optimization
1. Introduction
Obsolescence issue occurs in systems that have a longer lifecycle than their components, such as in automotive,
avionics, military, etc. The negative effects of obsolescence on the production performances have been studied in the
literature and represent a major challenge in long term (Rojo, Roy, & Kelly, 2012; Rojo, Roy, & Shehab, 2010;
Peter Sandborn, 2013; P. Sandborn, Prabhakar, & Ahmad, 2011). Rapid technological is one of the factors that
increase the rate of obsolescence. The electronic industry has emerged as the fastest growing sector, and has spread
widely around the world. As defined by Moore’s law, the rapid evolution of electronic components continues to
grow, which stipulates that semiconductor density doubles approximately every 18 months (Voller & Porté-Agel,
2002). This evolution creates new electronic components every year with short lifetimes. In the USA, the industry
has grown at a rapid rate since the 1990s. New technologies are introduced in the market at increasing rates. Today,
the short lifecycle and the lack of forecasting represent a challenge for several companies that need to take into
account the risk of obsolescence. Moreover, obsolescence modeling is a complex problem that requires a good
knowledge of parts. In the same way, it is necessary to know the lifetime of the components, their technological
evolutions and, therefore, know all the factors that influence the obsolescence of components to understand how
obsolescence may occur. These factors can include component criticality, technological watching, technological
maturity, and the number of sources among others.
1680
Proceedings of the International Conference on Industrial Engineering and Operations Management
Paris, France, July 26-27, 2018
© IEOM Society International
Obsolescence forecasting appears to be one of the best solutions in the obsolescence management as it assists
manufacturers to identify part obsolescence. Through obsolescence forecasting, companies can ensure support
for parts in service. There are two methodologies of obsolescence forecasting: long-term forecasting (1 year or
longer), which allows a proactive management and life cycle planning to support a system, and short-term
forecasting, which can be observed from the supply chain. Short term forecasting may involve reducing the number
of sources, reducing inventories, and increasing the price (Bartels, Ermel, Sandborn, & Pecht, 2012).
To overcome the problems caused by obsolescence, many studies have been conducted to create models that can
effectively forecast obsolescence. Statistical methods such as regression, Partial least square regression (PLS),
logistical regression and Gaussian method have been previously employed in many works (Gao, Liu, & Wang,
2011; Jungmok & Namhun, 2017; Solomon, Sandborn, & Pecht, 2000). Indeed, machine learning has attracted the
attention of many researchers in various disciplines, and has been applied in obsolescence recently (Jennings, Wu, &
Terpenny, 2016; D. Wu, Jennings, Terpenny, Gao, & Kumara, 2017; X. Wu et al., 2008; Yun, Ping, & Li, 2010).
Random forest algorithm is a kind of machine learning method that has been used in many areas and has shown a
high degree of satisfactory classifications accuracies (Grichi, Beauregard, & Dao, 2017). However, the performance
of the classification may be reducing due to the irrelevant and redundant features in the dataset. In fact, not all of the
features are useful for classification. Indeed the optimization of the model’s parameters and choosing the right
features can maximize the classification accuracy.
In order to improve the accuracy of obsolescence forecasting, this study attempts to improve the classification
accuracy rate of RF to better forecasting the obsolescence risk by developing an approach based on particle swarm
optimization (PSO) and random forest (RF). PSO algorithm has applied to some machine learning algorithms such
as, SVM, Neural network, etc. However, PSO appears as an optimal approach compared with other optimization
techniques like Genetic Algorithms (GAs) and Ant colony, which require a few parameters to adjust. However, the
developed PSO-RF approach can optimize the parameter of RF as well as identify the right features extraction to
improve the classification accuracy rate of RF. The accuracy of PSO-RF will be compared to GA-RF.
The rest of this paper is organized as follows. Section 2 review pertinent literatures on obsolescence forecasting,
PSO optimization and RF, while Section 3 presents the proposed framework PSO-RF. Numerical case study is
presented in section 4. Finally, section 5 presents the conclusion and recommendations for future research.
2. Literature review
2.2 Potential obsolescence forecasting strategies : Background
Forecasting obsolescence is reactive in nature and was based on the resolution of the problem once noticed. The
most classical approaches include lifetime or last-time buy (Rojo et al., 2010). There are two types of forecasting
methods, namely forecasting of the obsolescence risk and forecasting of the obsolescence date (life cycle
forecasting). Obsolescence risk forecasting is used to predict the probability that a component still in production
(Josias, Terpenny, & McLean, 2004; Rojo et al., 2012). A few researchers focus on the prediction of the risk of
obsolescence. In this context, Rojo et al. (2012) conducted a Delphi study to analyze the risk of obsolescence. They
developed a risk using some indicators, which are; years to end of life, the number of sources available, and the
consumption rate versus availability of the stock. Another approach developed by Josias et al. (2004) aims to create
a risk index by measuring the number of sources, life cycle stage (introduction, growth, maturity, decline, end of
life), and market risk. (van Jaarsveld & Dekker, 2011) developed a method based on historical demand data to
estimate the risk of obsolescence. The risk of obsolescence was estimated based on Markov Chain. Last, (Grichi et
al., 2017; Jennings et al., 2016) have used data-driven method by create machine learning algorithms to forecast the
obsolescence risk of a large number of parts. Alternatively, for life cycle forecasting, Solomon et al. (2000) were the
first to introduce the life cycle forecasting method. In their paper, the researchers conducted a study to predict the
life stage of a part from the life cycle curve, which included six stages: introduction, growth, maturity, saturation,
decline, and obsolescence. Another method was developed by (P. Sandborn, 2007) using data mining with Gaussian
method to predict the zone of obsolescence. This zone is given between +2.5σ and +3.5σ and gives time intervals for
the period for the part will become obsolete. Moreover, other researchers have introduced regression analysis to
predict the date of obsolescence (Gao et al., 2011).
1681
Proceedings of the International Conference on Industrial Engineering and Operations Management
Paris, France, July 26-27, 2018
© IEOM Society International
2.2 Random forest
Introduced by Breiman (2001), Random forests are an integration of tree predictors where every tree depends on
the values of a random vector separately (Breiman, 2001). A similar distribution applies for all the trees in the forest.
The tree classifier of a forest has a generalization error which relies on the strong correlation between all trees in the
forest. Classification accuracy increases significantly when the group of trees is enlarged. A primary example is
bagging, where to raise every tree, an arbitrary selection (without replacement) is done from the set examples.
Another example is random split selection where arbitrarily, the split is selected from among the K best splits at
every single node. A random forest algorithm consists of rotating many decision trees that are randomly constructed
and then generating them. Bootstrap sampling (OOB: Out-Of-Bag sampling) is used in RF to have a better estimate
of the distribution of the original data set. Indeed, bootstrapping means randomly selecting a subset of the data for
each tree rather than using all the data to build the trees. In statistical terms, if the trees are uncorrelated, this reduces
the forecast variance. The main advantage of random forests is their resistance to variances and biases.
The random forest algorithm is used in the regression case to predict a continuous dependence and classification
variable in order to predict a categorical dependent variable. For the regression type, a random forest consists of a
set of simple prediction trees; each is capable of producing a numerical response when presented with a subset of
explanatory variables or predictors. The error in this forecast is called Out Of Bag (OOB).
For the classification type, a categorical variable with N modalities is broken down into a disjunctive array (with N-
1 variables) according to a 0-1 coding scheme. Thus, a categorical variable with N modalities can be considered as a
set of N-1 variables, of which only one will assume the value 1 for a given observation. In fact, the ability to make
predictions on a random subset of predictive variables is one of the strengths of the Random Forest module, which
makes it particularly well suited to processing data sets with extremely high predictive variables. This random
feature selection encourages systems diversity, and by the end, it enhances classification performance. The random
forest is constructed by sampling arbitrarily the features subset as well as the training subset with regard to every
system. The majority vote combines the final prediction. Finally, the random forest attains a favorable and vigorous
performance with various applications (Cheng, Chan, & Qiu, 2012; Friedman, Hastie, & Tibshirani, 2001).
2.3 Particle swarm optimization
PSO called swarm intelligence or collective intelligence is developed by Eberhart and Kennedy in 1995
(Kennedy & Eberhart, 1995; Shi, 2001). The overall behavior of the PSO is not programmed in advance but emerges
from the sequence of elementary interactions between individuals. In this context, many researchers have applied the
PSO in several machine learning for optimization (Lin, Ying, Chen, & Lee, 2008; Xiaodan, 2017).
The Optimization method of PSO can be iterative; each particle consists of changing the velocity toward its fitness
value and global version of PSO. For the movement, the particle must decide on its next movement (its new speed)
by linearly combining three pieces of information: its current speed 𝑉𝑖𝑗𝑛 (velocity), its best performance already
found 𝑃𝑖𝑗𝑛 and which is known as the personal best position (pbest), and the best performance of its neighbors or
informants 𝑃𝑔𝑗𝑛 known as the global best position (gbest) (See equation below). The iteration of the velocity and
position of the particles are getting by following equations:
𝑉𝑖𝑗𝑘+1 = 𝑤 ∗ 𝑉𝑖𝑗
𝑘 + 𝑐1 ∗ 𝑟1 (𝑃𝑖𝑗𝑘 − 𝑥𝑖𝑗
𝑘 ) + 𝑐2 ∗ 𝑟2(𝑃𝑔𝑗𝑘 − 𝑥𝑖𝑗
𝑘 )
𝑥𝑖𝑗𝑘+1 = 𝑥𝑖𝑗
𝑘 + 𝑉𝑖𝑗𝑘+1
Where 𝑃𝑖𝑗 = (𝑝𝑖1 , 𝑝𝑖2, … 𝑝𝑖𝑚) and 𝑃𝑔𝑗 = (𝑝𝑔1, 𝑝𝑔2, … 𝑝𝑔𝑚) . k is the number of iteration, 𝑥𝑖𝑗𝑘 present the particle
position. Positive coefficient 𝑟1 and 𝑟2 are random number, generated uniformly in the range [0 1]. w presents the
inertia coefficient of PSO algorithm. This weight is updated according to the following equation (Chen et al., 2011):
𝑤 = 𝑤𝑚𝑖𝑛 + (𝑤𝑚𝑎𝑥 − 𝑤𝑚𝑖𝑛) (𝑡𝑚𝑎𝑥 − 𝑡)
𝑡𝑚𝑎𝑥
1682

Proceedings of the International Conference on Industrial Engineering and Operations Management
Paris, France, July 26-27, 2018
© IEOM Society International
Where 𝑡𝑚𝑎𝑥 presents the maximum number of iterations. Usually, the inertia coefficient is generated in the range
[0.4 0.9] (Chen et al., 2011). The coefficients 𝑐1 and 𝑐2 are calculated as follows:
𝑐1 = (𝑐1𝑓 − 𝑐1𝑖)𝑡
𝑡𝑚𝑎𝑥
+ 𝑐1𝑖
𝑐2 = (𝑐2𝑓 − 𝑐2𝑖)𝑡
𝑡𝑚𝑎𝑥
+ 𝑐2𝑖
With𝑐1𝑓,𝑐1𝑖, 𝑐2𝑓 , and 𝑐2𝑖 are a positive constants.
The position of the particles as well as their initial velocity must be initialized randomly according to a uniform law.
The original process for implementing the local version of PSO is as follows:
Step 1: Initialize randomly a population. Step 2: Measure the fitness of each particle in the population (calculate
fitness score for each particle using selected features). Step 3: Update the velocity and position of each particle by
looking for the best performance for each particle (local optimum). If the current fitness is better than the previous
fitness, the previous pbest is replaced with the current pbest. Finally, in step 4: continues until the process
converges. Stop the algorithm if the termination criterion is satisfied; otherwise, return to step 2.
3 Proposed PSO-RF optimization approach
In this paper, the PSO-RF model is developed and applies for forecasting of obsolescence risk. This main
objective of this paper is to apply particle swarm optimization to enhance the classification performance of random
forest algorithm by searching for the optimal parameters for RF and discovering the best subset of features as well.
The proposed PSO-RF optimization approach consists of 4 steps as follows:
Step 1: The initialization of the data processing. The dataset is initialized to construct the RF model based on
supervised learning (known data), also the data is split into two groups (training and testing) randomly.
Step 2: The initialization of PSO and RF parameters. For the PSO, the number of generations, population size
(number of particles) and so one, are initialized. The position and velocity set to x0i and v
0i respectively, are
determined as well. Each particle has (1) dimension (d) which is the length of features and the number of parameters
to be optimized. (2) Position (x): position of the ith
particle. The initialization the parameters of RF (number of trees
and the number of variables to split on at each node (mtry)) are included into the algorithm as well.
Step 3: PSO is adopted to construct PSO-RF model. In fact, PSO is looking for the optimal solution of particles by
evaluation of fitness based on the update particle velocity and its position. However, if the current fitness is better
than the previous fitness, the previous pbest is replaced with the current pbest until to find the optimal solution (if
current gbest is better than previous gbest, then replace gbest score and gbest particle. If the particle is already
created and evaluated, then generate a new one. As introduced by Kennedy, the PSO is searching in a discrete space
(0 or 1). Each feature in the PSO represents a binary bit (0 or 1), where 1 represents a selected feature while 0
represents a feature that is not selected. The features selected are based on the particle’s position.
Step 4: presents the training subset of features selection and parameters optimization is introduced in the RF model;
therefore the PSO-RF is obtained. For each terminal node of the tree, these steps are repeated until the specified
number of trees is reached and the minimum node size is obtained. Next, the Out of Bag (OOB) error for the model
is estimated. For classification, OOB error is estimated as the proportion of times that the categorical variable is not
equal to the true class prediction. Finally, the output is represented as an ensemble of trees{𝑇𝑏}. To make prediction
at a new point x, let 𝑐�̂�(𝑥) be the class predicting of the bth
random forest tree. The equation is given as follows:
𝐶𝑟𝑓�̂� = 𝑚𝑎𝑗𝑜𝑟𝑖𝑡𝑦 𝑣𝑜𝑡𝑒{𝑐�̂�(𝑥)}.
Finally, the precision of the model is calculated by comparing the current state with the state predicted by the model
using a confusion matrix. The fitness function is calculated as follows:
𝑓 = 𝑎𝑐𝑐𝑢𝑟𝑎𝑐𝑦 (AUC)
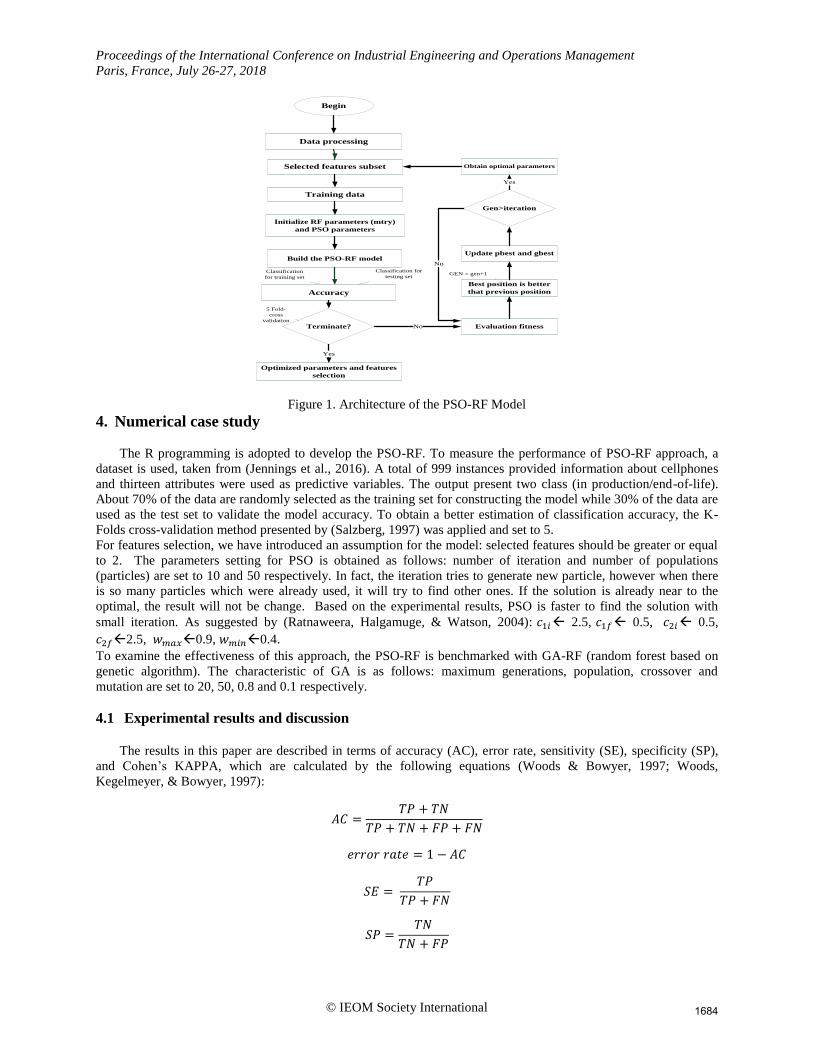
The architecture of the proposed method is illustrated in Figure 1.
1683
Proceedings of the International Conference on Industrial Engineering and Operations Management
Paris, France, July 26-27, 2018
© IEOM Society International
Begin
Data processing
Selected features subset
Training data
Initialize RF parameters (mtry)
and PSO parameters
Build the PSO-RF model
Accuracy
Optimized parameters and features
selection
Terminate? Evaluation fitness
Best position is better
that previous position
Update pbest and gbest
Gen>iteration
Obtain optimal parameters
Yes
No
Yes
No
5 Fold-
cross
validation
Classification
for training set
Classification for
testing setGEN = gen+1
Figure 1. Architecture of the PSO-RF Model
4. Numerical case study
The R programming is adopted to develop the PSO-RF. To measure the performance of PSO-RF approach, a
dataset is used, taken from (Jennings et al., 2016). A total of 999 instances provided information about cellphones
and thirteen attributes were used as predictive variables. The output present two class (in production/end-of-life).
About 70% of the data are randomly selected as the training set for constructing the model while 30% of the data are
used as the test set to validate the model accuracy. To obtain a better estimation of classification accuracy, the K-
Folds cross-validation method presented by (Salzberg, 1997) was applied and set to 5.
For features selection, we have introduced an assumption for the model: selected features should be greater or equal
to 2. The parameters setting for PSO is obtained as follows: number of iteration and number of populations
(particles) are set to 10 and 50 respectively. In fact, the iteration tries to generate new particle, however when there
is so many particles which were already used, it will try to find other ones. If the solution is already near to the
optimal, the result will not be change. Based on the experimental results, PSO is faster to find the solution with
small iteration. As suggested by (Ratnaweera, Halgamuge, & Watson, 2004): 𝑐1𝑖 2.5, 𝑐1𝑓 0.5, 𝑐2𝑖 0.5,
𝑐2𝑓2.5, 𝑤𝑚𝑎𝑥0.9, 𝑤𝑚𝑖𝑛0.4.
To examine the effectiveness of this approach, the PSO-RF is benchmarked with GA-RF (random forest based on
genetic algorithm). The characteristic of GA is as follows: maximum generations, population, crossover and
mutation are set to 20, 50, 0.8 and 0.1 respectively.
4.1 Experimental results and discussion
The results in this paper are described in terms of accuracy (AC), error rate, sensitivity (SE), specificity (SP),
and Cohen’s KAPPA, which are calculated by the following equations (Woods & Bowyer, 1997; Woods,
Kegelmeyer, & Bowyer, 1997):
𝐴𝐶 =𝑇𝑃 + 𝑇𝑁
𝑇𝑃 + 𝑇𝑁 + 𝐹𝑃 + 𝐹𝑁
𝑒𝑟𝑟𝑜𝑟 𝑟𝑎𝑡𝑒 = 1 − 𝐴𝐶
𝑆𝐸 = 𝑇𝑃
𝑇𝑃 + 𝐹𝑁
𝑆𝑃 =𝑇𝑁
𝑇𝑁 + 𝐹𝑃
1684
Proceedings of the International Conference on Industrial Engineering and Operations Management
Paris, France, July 26-27, 2018
© IEOM Society International
𝐾 =Pr(𝑎) − Pr (𝑒)
1 − Pr (𝑒)
TP, TN, FP and FN are defined as true positive, true negative, false positive and false negative. For KAPPA
equation, Pr(a) presents the probability of success of classification (accuracy) and Pr(e) presents the probability of
success due to chance. In order to validate the accuracy of the proposed PSO-SVM algorithm, the results obtained
by PSO-RF is compared with the GA-RF (RF with genetic algorithm) developed by (Grichi, Beauregard, & Dao,
2018). The classification accuracy rates of GA-RF are cited from their original papers that was achieved a good
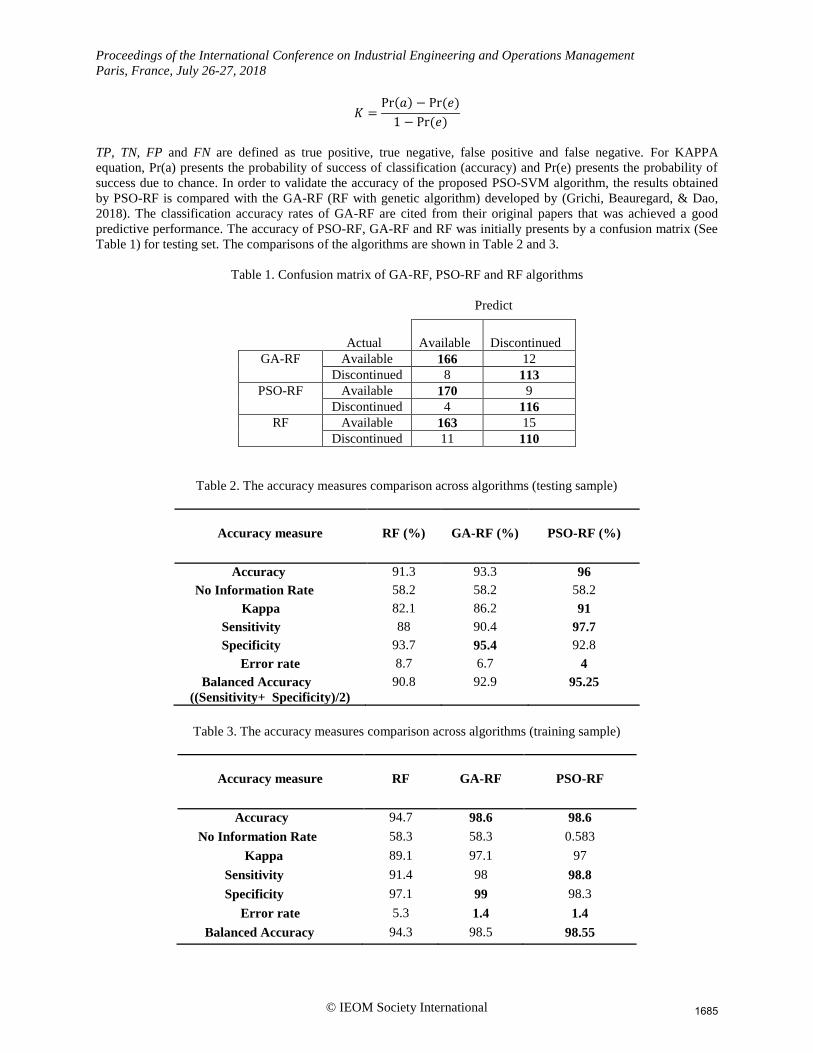
predictive performance. The accuracy of PSO-RF, GA-RF and RF was initially presents by a confusion matrix (See
Table 1) for testing set. The comparisons of the algorithms are shown in Table 2 and 3.
Table 1. Confusion matrix of GA-RF, PSO-RF and RF algorithms
Predict
Actual
Available
Discontinued
GA-RF Available 166 12
Discontinued 8 113
PSO-RF Available 170 9
Discontinued 4 116
RF Available 163 15
Discontinued 11 110
Table 2. The accuracy measures comparison across algorithms (testing sample)
Accuracy measure
RF (%)
GA-RF (%)
PSO-RF (%)
Accuracy 91.3 93.3 96
No Information Rate 58.2 58.2 58.2
Kappa 82.1 86.2 91
Sensitivity 88 90.4 97.7
Specificity 93.7 95.4 92.8
Error rate 8.7 6.7 4
Balanced Accuracy
((Sensitivity+ Specificity)/2)
90.8 92.9 95.25
Table 3. The accuracy measures comparison across algorithms (training sample)
Accuracy measure
RF
GA-RF
PSO-RF
Accuracy 94.7 98.6 98.6
No Information Rate 58.3 58.3 0.583
Kappa 89.1 97.1 97
Sensitivity 91.4 98 98.8
Specificity 97.1 99 98.3
Error rate 5.3 1.4 1.4
Balanced Accuracy 94.3 98.5 98.55
1685
Proceedings of the International Conference on Industrial Engineering and Operations Management
Paris, France, July 26-27, 2018
© IEOM Society International
The result obtained from the PSO-RF model proves that the prediction through parameters optimization and
choosing the best small features can improve significantly the classification accuracy of the RF. The experiments
results were compared with RF-PSO and RF. PSO-RF approach yielded a higher classification accuracy rate
compared to the other approaches. Thus, PSO-RF yielded more appropriate subset with few iteration.
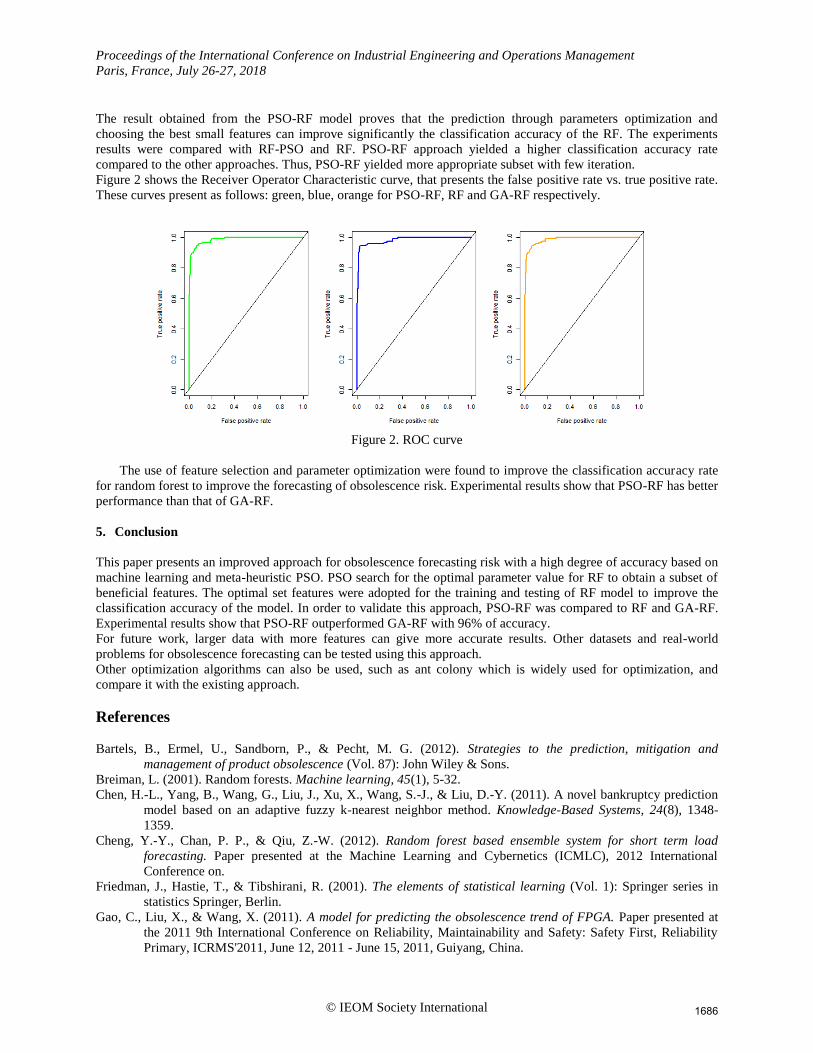
Figure 2 shows the Receiver Operator Characteristic curve, that presents the false positive rate vs. true positive rate.
These curves present as follows: green, blue, orange for PSO-RF, RF and GA-RF respectively.
Figure 2. ROC curve
The use of feature selection and parameter optimization were found to improve the classification accuracy rate
for random forest to improve the forecasting of obsolescence risk. Experimental results show that PSO-RF has better
performance than that of GA-RF.
5. Conclusion
This paper presents an improved approach for obsolescence forecasting risk with a high degree of accuracy based on
machine learning and meta-heuristic PSO. PSO search for the optimal parameter value for RF to obtain a subset of
beneficial features. The optimal set features were adopted for the training and testing of RF model to improve the
classification accuracy of the model. In order to validate this approach, PSO-RF was compared to RF and GA-RF.
Experimental results show that PSO-RF outperformed GA-RF with 96% of accuracy.
For future work, larger data with more features can give more accurate results. Other datasets and real-world
problems for obsolescence forecasting can be tested using this approach.
Other optimization algorithms can also be used, such as ant colony which is widely used for optimization, and
compare it with the existing approach.
References
Bartels, B., Ermel, U., Sandborn, P., & Pecht, M. G. (2012). Strategies to the prediction, mitigation and
management of product obsolescence (Vol. 87): John Wiley & Sons.
Breiman, L. (2001). Random forests. Machine learning, 45(1), 5-32.
Chen, H.-L., Yang, B., Wang, G., Liu, J., Xu, X., Wang, S.-J., & Liu, D.-Y. (2011). A novel bankruptcy prediction
model based on an adaptive fuzzy k-nearest neighbor method. Knowledge-Based Systems, 24(8), 1348-
1359.
Cheng, Y.-Y., Chan, P. P., & Qiu, Z.-W. (2012). Random forest based ensemble system for short term load
forecasting. Paper presented at the Machine Learning and Cybernetics (ICMLC), 2012 International
Conference on.
Friedman, J., Hastie, T., & Tibshirani, R. (2001). The elements of statistical learning (Vol. 1): Springer series in
statistics Springer, Berlin.
Gao, C., Liu, X., & Wang, X. (2011). A model for predicting the obsolescence trend of FPGA. Paper presented at
the 2011 9th International Conference on Reliability, Maintainability and Safety: Safety First, Reliability
Primary, ICRMS'2011, June 12, 2011 - June 15, 2011, Guiyang, China.
1686
Proceedings of the International Conference on Industrial Engineering and Operations Management
Paris, France, July 26-27, 2018
© IEOM Society International
Grichi, Y., Beauregard, Y., & Dao, T.-M. (2018). Optimization of Obsolescence Forecasting Using New Hybrid
Approach Based on the RF Method and the Meta-heuristic Genetic Algorithm. American Journal of
Management(18(2)). (Forthcoming)
Grichi, Y., Beauregard, Y., & Dao, T. (2017). A random forest method for obsolescence forecasting. Paper
presented at the Industrial Engineering and Engineering Management (IEEM), 2017 IEEE International
Conference on (pp. 1602-1606). IEEE.
Jennings, C., Wu, D., & Terpenny, J. (2016). Forecasting obsolescence risk and product life cycle with machine
learning. IEEE Transactions on Components, Packaging and Manufacturing Technology, 6(9), 1428-1439.
doi: 10.1109/TCPMT.2016.2589206
Josias, C., Terpenny, J. P., & McLean, K. J. (2004). Component obsolescence risk assessment. Paper presented at
the IIE Annual Conference and Exhibition 2004, May 15, 2004 - May 19, 2004, Houston, TX, United
states.
Jungmok, M., & Namhun, K. (2017). Electronic part obsolescence forecasting based on time series modeling.
International Journal of Precision Engineering and Manufacturing, 18(5), 771-777. doi: 10.1007/s12541-
017-0092-6
Kennedy, J., & Eberhart, R. (1995). PSO optimization. Paper presented at the Proc. IEEE Int. Conf. Neural
Networks.
Lin, S.-W., Ying, K.-C., Chen, S.-C., & Lee, Z.-J. (2008). Particle swarm optimization for parameter determination
and feature selection of support vector machines. Expert Systems with Applications, 35(4), 1817-1824.
Ratnaweera, A., Halgamuge, S. K., & Watson, H. C. (2004). Self-organizing hierarchical particle swarm optimizer
with time-varying acceleration coefficients. IEEE Transactions on evolutionary computation, 8(3), 240-
255.
Rojo, F. R., Roy, R., & Kelly, S. (2012). Obsolescence risk assessment process best practice. Paper presented at the
Journal of Physics: Conference Series.
Rojo, F. R., Roy, R., & Shehab, E. (2010). Obsolescence management for long-life contracts: state of the art and
future trends. International Journal of Advanced Manufacturing Technology, 49(9-12), 1235-1250. doi:
10.1007/s00170-009-2471-3
Salzberg, S. L. (1997). On Comparing Classifiers: Pitfalls to Avoid and a Recommended Approach. Data Mining
and Knowledge Discovery, 1(3), 317-328. doi: 10.1023/a:1009752403260
Sandborn, P. (2007). Software obsolescence-Complicating the part and technology obsolescence management
problem. IEEE Transactions on Components and Packaging Technologies, 30(4), 886-888.
Sandborn, P. (2013). Design for Obsolescence Risk Management. Procedia CIRP, 11(0), 15-22. doi:
http://dx.doi.org/10.1016/j.procir.2013.07.073
Sandborn, P., Prabhakar, V., & Ahmad, O. (2011). Forecasting electronic part procurement lifetimes to enable the
management of DMSMS obsolescence. Microelectronics Reliability, 51(2), 392-399. doi:
10.1016/j.microrel.2010.08.005
Shi, Y. (2001). Particle swarm optimization: developments, applications and resources. Paper presented at the
evolutionary computation, 2001. Proceedings of the 2001 Congress on.
Solomon, R., Sandborn, P. A., & Pecht, M. G. (2000). Electronic part life cycle concepts and obsolescence
forecasting. IEEE Transactions on Components and Packaging Technologies, 23(4), 707-717. doi:
10.1109/6144.888857
van Jaarsveld, W., & Dekker, R. (2011). Estimating obsolescence risk from demand data to enhance inventory
control—A case study. International Journal of Production Economics, 133(1), 423-431. doi:
https://doi.org/10.1016/j.ijpe.2010.06.014
Voller, V. R., & Porté-Agel, F. (2002). Moore's Law and Numerical Modeling. Journal of Computational Physics,
179(2), 698-703. doi: http://dx.doi.org/10.1006/jcph.2002.7083
Woods, K., & Bowyer, K. W. (1997). Generating ROC curves for artificial neural networks. IEEE Transactions on
medical imaging, 16(3), 329-337.
Woods, K., Kegelmeyer, W. P., & Bowyer, K. (1997). Combination of multiple classifiers using local accuracy
estimates. IEEE transactions on pattern analysis and machine intelligence, 19(4), 405-410.
Wu, D., Jennings, C., Terpenny, J., Gao, R., & Kumara, S. (2017). Data-Driven Prognostics Using Random
Forests: Prediction of Tool Wear. Paper presented at the ASME 2017 12th International Manufacturing
Science and Engineering Conference collocated with the JSME/ASME 2017 6th International Conference
on Materials and Processing.
Wu, X., Kumar, V., Ross Quinlan, J., Ghosh, J., Yang, Q., Motoda, H., . . . Steinberg, D. (2008). Top 10 algorithms
in data mining. Knowledge and Information Systems, 14(1), 1-37. doi: 10.1007/s10115-007-0114-2
1687

Proceedings of the International Conference on Industrial Engineering and Operations Management
Paris, France, July 26-27, 2018
© IEOM Society International
Xiaodan, W. (2017). Forecasting short-term wind speed using support vector machine with particle swarm
optimization. Paper presented at the 2017 International Conference on Sensing, Diagnostics, Prognostics
and Control (SDPC), 16-18 Aug. 2017, Los Alamitos, CA, USA.
Yun, C., Ping, L., & Li, Y. (2010). Aftermarket demands forecasting with a Regression-Bayesian-BPNN model.
Paper presented at the 2010 IEEE International Conference on Intelligent Systems and Knowledge
Engineering (ISKE 2010), 15-16 Nov. 2010, Piscataway, NJ, USA.
Biographies
Yosra Grichi is currently pursuing the Ph.D. degree at the department of mechanical engineering, École de
technologie supérieure (ÉTS), University of Québec (Canada). She received a bachelor’s degree (Licence degree)
and Master’s degree in mechanical engineering from University of Tunisia (ENSIT) in 2012 and 2015 respectively.
Her current research interests include predictive modeling, management of manufacturing systems, data mining,
machine learning and statistics.
Thien-My Dao is a Professor in the Department of Mechanical Engineering, École de technologie supérieure (ÉTS),
University of Québec (Canada). He received a Bachelor’s Degree, Master’s Degree and PhD in Mechanical
Engineering (Design option) from Sherbrooke University in 1969, 1971 and 1974 respectively. After four (4) years
in industry sector, he joined the Department of Mechanical Engineering of École de technologie supérieure,
University of Québec, in 1976 where he is teaching particularly production and operations management, quality
management and design of manufacturing systems. His research interests are in optimization of the design, the
reliability and the management of manufacturing systems.
Yvan Beauregard is a professor in the Department of Mechanical Engineering at École de Technologie Supérieure.
Mr. Beauregard holds a Bachelor's degree in Industrial Engineering from École Polytechnique de Montréal, a
Master's Degree in Administration from McGill University and a PhD in Mechanical Engineering from Concordia
University. He has more than thirty years of industrial experience at Pratt & Whitney and IBM Canada. His research
interests include among others operations and risk management, as well as product development performance
improvement
1688