Embed Size (px)
Citation preview

145
Carpathian Journal of Earth and Environmental Sciences, May 2015, Vol. 10, No. 2, p. 145 - 158
A NEW APPROACH TO DETERMINE LAND USE PLANNING AND SOIL CONSERVATION MEASURES BASED ON SOIL EROSION
CLASSIFICATION
Ertuğrul KARAŞ1 & İrfan OĞUZ 1Corresponding author. Department of Biosystem Engineering, Faculty of Agriculture, University of Osmangazi,
Eskisehir, Turkey.email: [email protected]
Abstract: Although most soil conservation studies use the same data type and obtain the same results, a common method to measure soil erosion is lacking. This problem has remained unsolved for a long time. If a soil erosion problem is known and defined regarding all aspects in any catchment, the measures that are proposed by the experts should be the same or similar. A new approach, called the SLUP (Sustainable Land Use Planning) model, was developed based on these considerations. The proposed model was used for the first time in a small scale rural basin near Ankara, Turkey. This approach, based on the soil loss tolerance (T), was used to determine the soil conservation measures and land use planning in catchments. In this study, this new model’s potential soil erosion (A) was determined using the USLE (Universal Soil Loss Equation) model in a GIS environment. In the study area, soil loss tolerance values were determined for each soil series based on the soil depth. Then, the potential soil erosion values were rated to the values of soil loss tolerance. According to the A/T results, erosion degree, description and proposed soil conservation, precautions were determined considering the limit values that were specified in the table and that reflect the combined effects of the support practice factor (P) and soil loss tolerance (T). The results show that the mean soil erosion potential of the watershed was 16.30 t ha−1 year−1 and the most influenced land use cover exposed to erosion was bare land, which its potential soil loss was approximately 97.52 t ha-1year-1. The estimated amount of soil loss over 10 t ha−1 at the basin was contained in 25.84% of the total area. The areal distribution of soil erosion classes and soil conservation precautions was also obtained. According to the results, 64.68% of the basin had a non-existent or too-low erosion degree, 9.18% had a low-moderate erosion degree, 7.53% had a moderate-high erosion degree, 4.33% had a high erosion degree, and 14.33% had a very high level erosion degree. Consequently, this research suggests a new approach that can be used in terms of simplicity, flexibility and ease of application in rural catchments. Keywords: USLE, soil erosion, soil conservation, soil loss tolerance
1. INTRODUCTION
For worldwide food security and for the security of the environment, land degradation represents a major issue. Approximately 11 percent of the global land surface is considered prime land for feeding 6.3 billion people today or the 8.2 billion people who are expected by 2020. Therefore, land degradation will remain high on the international agenda in the 21st century. Soil degradation is a decline in and loss of soil quality and yield potential caused by its improper use, usually for agricultural, pasture, industrial or urban purposes.
In fact, decreasing soil quality and
productivity are degradative processes that include physical, chemical and biological processes (Lal, 1997). Today and in the future, the food resources for the world population and other living organisms depend on sustainability. Sustainable land management practices are required to avoid land degradation, which typically occurs because of land management practices or human development that is not sustainable over a period.
As a land degradation type, soil erosion is an environmental concern that leads to declining soil fertility and the sedimentation of reservoirs. The relationships between the rainfall and runoff and processes that result in erosion at a given location

146
are complex. The prediction of runoff and soil loss is important for assessing soil erosion hazards and for determining suitable land uses and soil conservation measures for a catchment. In turn, this knowledge can help in deriving the optimum benefit from the use of the land while minimising the negative impacts of land degradation and other environmental problems (Moehansyah et al., 2004). Currently, the most important environmental problems are soil loss and its associated impacts.
Agriculture and agriculture-based industries are the main income of Turkey, which has approximately 28×106 ha arable land. Only 17.5% of the total land surfaces cover the prime soils. Topographical, chemical (e.g., high calcium carbonate content, alkalinity and low organic matter), and physical (e.g., water logging and texture) limit the soil productivity. Topographical conditions, deforestation, unsuitable tillage and irrigation management have encouraged soil erosion in this country for centuries. Due to steep slopes (>6%), 72% of the soils are more or less influenced by water and wind erosion. These unsuitable conditions cause soil degradation. In important parts of the country, the soils have several degrees of limitations and require some type of soil conservation practices for the sustainability of production as the essential part of the management system. Water logging, salinity, and the calcareous area require expensive investments in land management, particularly for the land capability class (LCC) of the soils. This area is almost equal to 25% of the country’s land. The marginally productive land (LCC IV) has approximately 7.4 million ha, some of which (4.9 million ha) is used for cultivation, pastures, forests and settlement areas. An important part of land (573,000 ha), most of which is of prime quality (LCC I), is occupied by various industries and urban settlements and is larger than the cultivated soils of many townships. Unplanned (approximately 6.2 million ha) and unsuitable for cultivation (approximately 6.3 million ha) land is under increased soil erosion (Cangir & Boyraz, 2008).
Turkey has mountain topography, its mean height is 1100 m, and greater than 12% of the slope group has approximately 62% of the total area, which has a steep and very hilly sloped. Because of its topographical structure, 72% of the entire area is classified as shallow in terms of depth at the World Reference Base for Soil Resources according to the U.S.D.A. soil classification system. Of this area, 14% should be accepted as absolutely protected and as using a measured area against soil erosion. In a study, the spatial variation of some soil variables was more self-similar in mild to moderate steep soils than mild to steep slope soils and showed lower
desertification potential (Oğuz et al., 2013). The Mediterranean region in which Turkey is
located has long dry periods followed by heavy storms of erosive rainfall. In Turkey, according to the obtained data, the calculated mean potential soil loss is approximately 13 ton ha-1 yearly, and the mean measured sediment yield for the whole country is 0.71 mm year-1. According to comparative statistical data, the violence of soil erosion in Turkey is greater than six times that of the entire world and two times larger than continental Asia. The amount of transported soil is approximately 24×106 tons yearly, 1/30 of which is carried from Turkey. Soil erosion has been controlled only 8% of the 56 ×106 ha area of under erosion risk up to now due to catchment management (Oğuz et al., 2013). Due to these values, Turkey is one of the most endangered countries in the world in terms of soil erosion.
Most soil scientists have intensified their efforts on soil amount and severity in the last half century. To understand the dynamics and mechanics of soil erosion and to generate solutions, thousands of studies have been conducted on parcels and/or watersheds. A large number of methods, equations, tables and coefficients have been developed to estimate soil erosion (Wischmeier & Smith, 1978; Williams et al., 1982; Laflen et al., 1997; Renard et al., 1997). To reduce the effects of soil erosion, terraces can be built on hillsides or the steepness of the slope can be decreased. Moreover, to make the soil more fertile, good farming techniques that include contour ploughing and crop rotation can also be used. There is no single or specific method of protection that has been adopted in terms of precautions of soil erosion. Soil conservation precautions can be of more than one type in any catchment. The requirements include the shape and size of the problem and whether soil conservation actions are sustainable and investment costs in the basin are decisive. Whatever precaution methods are adopted or implemented, the cost of application should be ordered from the cheapest to the most expensive.
Scientific planning for soil erosion reduction requires knowledge of the relationships between the factors that cause the loss of soil and water and those that help reduce such losses. The Universal Soil Loss Equation (USLE) is used to estimate the quantity of soil erosion (sheet and rill) that is caused by water and to design water erosion control systems. The USLE was developed by the USDA Agricultural Research Service (ARS), and 49 research locations across the U.S. have contributed more than 10,000 plot years of basic runoff and soil loss data to the ARS for summarising and overall

147
statistical analyses. Since the early 1960s, the USDA Natural Resources Conservation Service and others have used the USLE to predict soil losses and to plan conservation treatment (Anonymous, 2000). Significant research advances have been made on the environmental problems dealing with soil erosion that were started by Wischmeier and Smith beginning of 1960-70s. Many models (USLE, RUSLE, and WEPP etc.) were used, developed and sustained based on their research results in different soil, climate, topography and land use types. Being a convenient tool that predicts rill and inter-rill erosion, USLE was a basic model, when the first studies were finished. After that, RUSLE was developed with some additional corrections and different calculation approaches. Many models are also based on USLE’s principles when computing soil erosion on other upland areas, such as construction sites, urban areas, mine developments, or other disturbed areas, and can also cause on-site and off-site problems in addition to agricultural areas.
The main attempts include identifying the areas that are susceptible to soil erosion and making an erosion risk assessment. Soil erosion studies require environmental data, including soil, climate, topography and land use. Microcomputer technology has made important advances to processing environmental data in the last two decades. The microcomputer technology Geographic Information System (GIS) was designed to store, manipulate, and display spatial and non-spatial data and has become an important tool in the spatial analysis of factors, such as topography, soil, and land use/land cover. GIS provides a digital representation of the catchment that can be used in catchment modelling. GIS is used to estimate the parameters that enter the catchment models by analysing the terrain, land cover or other features. Using this technique, the land surface slope, land use and soil characteristics can be extracted (Jain & Dolezal, 2000). For processing, analysing, identifying and drawing a conclusion, GIS is a valuable tool providing environmental information (soil erosion, runoff, etc.) using models. Spatial variability and severity in soil erosion should be identified before the application of any soil conservation measures. The identification of areas that are vulnerable to soil erosion can be helpful for improving our knowledge about the extent of the affected areas and, ultimately, for developing measures to control the problem whenever possible. Using USLE and GIS together in the catchment can provide the effects of soil erosion spatially and quantitatively. The results can expose the vulnerability class of the catchment. According
to the obtained information, sustainable land use management plans give to soil conservation services an immediate and suitable decision. Although there were some similar efforts (i.e., Mellerowicz et al., 1994) in the past, no common applicable or acceptable approach was found until now.
Soil erosion studies that are interested in sustainable productivity have been conducted by many researchers in the last half century. This approach, which was explained as soil loss tolerance for the first time and started by Stamey & Smith (1964), was principally considered in terms of the environmental effects of soil erosion, sustainability and productivity loss due to erosion, as realised by Smith & Stamey (1965), Wishmeier & Smith (1978), McCormack et al., (1981), Mannering (1981), Skidmore (1982), Schertz (1983), Pierce et al., (1984), Jones et al., (1985), Johnson (1987), Pretorius & Cooks (1989), Sparovek & De Yong (1997), Sparovek et al., (1997), Sparovek & Schnug (2001), Sparovek & De Maria (2003), Bhattacharyya et al., (2008), Verheijen et al., (2009) and Mandal et al., (2010). Many of these studies investigated the sensitivity class of soil erosion, the land use types of different slope groups and the classification of soil loss tolerance as related to depth.
However, most endeavours have been concentrated on finding and defining erosion risk areas and the severity of erosion. Unfortunately, the main aim of soil erosion studies is the establishment of soil conservation precautions of the catchments. Therefore, the objective of this paper is to introduce and focus on a new approach for land use management, sustainability and environmental quality enhancement based on USLE results. Although the USLE method is a commonly used methodology worldwide, there is no simple method to compare different soil loss values for land use management in different areas by USLE. In this study, we aimed to improve the simplest method base on the USLE results to determine erosion risk and management precautions for different catchment and fields for same basis.
2. MATERIALS AND METHODS 2.1. Materials This study was conducted to evaluate the
SLUP model in the Güvenç pond basin in Ankara, which is the east side of the Ankara-Istanbul highway (Fig. 1). The river of the watershed, which is located in the Sakarya River basin, is a fourth-degree tributary of the river system.

148
Figure 1. The location and drainage map of the study area
The altitude of the basin outlet is 1053 m and is located at 42°08'10"N and 32°45'15" E; 42°08'10"N and 32°45'15"E. The basin area covers approximately 15.83 square kilometers. The annual rainfall is 482.0 mm, the annual runoff is 119.00 mm, the average temperature is 11.4°C, and the mean relative humidity is 62% (Cebel et al., 2003). The basin’s climate may be defined as arid or semiarid.
The drainage pattern of the basin has been observed as mainly dendritic in the upper side of the study area. The topography of the basin has a fairly steep slope. The mean basin slope and main stream waterway slope are 24.3% and 6.1%, respectively. The median and mean heights of the basin are 1235 and 1256 m, respectively. The total waterways are approximately 44.62 km, and the mean drainage density is 2785 m km-2. The total lengths of the streams are between 1.50 and 3.00 km for each sub-basin. The lowest and greatest heights are 1052 and 1459 m, respectively.
There are twelve different soil series in the basin. The catchment’s soils have a mostly heavy clay texture that is susceptible to soil erosion. The depths of soil series are mostly shallow and range between 100 and 1300 mm; the mean depth is approximately 556 mm. Because of the low hydraulic conductivity and low water-holding capacity, intensive rainfall causes huge soil loss.
The major land use type of the basin is pasture land (48.28%). Pasture land use is fairly poor considering the grass yield and quality in terms of animal feeding. The numbers of the determined species are 34, which are belonging to Graminea (11.9%), Leguminosae (16.4%) and species of other families (71.7%). The quality of the pasture cover of the basin is classified as poor and in need of improvement (Anonymous, 2011). Bare land areas, which occupy 10.21%, originate chiefly from abandoned agricultural areas because of improper use. The second major land use is farmland with a
low crop productivity (35.10%). The other land use types are forestland (4.23%), brushland (1.16%) and horticultural land (0.96%).
2.2. Methods In this study, the potential soil loss that was
calculated from the USLE method results was compared to soil loss tolerance values for each assigned soil series, and the effectiveness of soil conservation that can be applied to agricultural land use was determined. At the end of the study, the final land use planning was prepared for sustainable management in the basin with a high potential erosion risk compared to the assigned tolerance value.
The potential soil loss of the basin was estimated using the Universal Soil Loss Equation (USLE) that was developed by Wischmeier & Smith (1978). To determine the USLE, the following formula was used:
A= R.K.L.S.C.P (1) where:
A, Average annual soil loss in tons per hectare per year
R, Rainfall and runoff factor K, Soil erosion factor LS, Slope length-gradient factor C, Crop/vegetation and management factor P, Support practice factor The R factor value for the basin is 40.71
according to the studies of Doğan & Küçükçakar (1994). The soil K factor values were calculated by the equation for each soil series using organic matter, texture, structure, and hydraulic conductivity values of the collected soil samples (Wischmeier & Smith, 1978). The LS factor values were calculated by GIS using the method that was proposed by Moore and Burch (1986). The C factor was determined by selecting the crop type and tillage method for the existing land use. The C factor values were taken from the reports of Doğan & Küçükçakar (1994), Çanga (1995) and Cebel et al., (2003). The C factor values are 0.24 for agricultural area, 0.005 for forest and contour pasture, 0.05 for poor pasture vegetation and brush land, 0.10 for horticultural area and 1.00 for the bare used area according to crop type. The P factor is 1.00 for the entire basin except for the contour pasture area.
After calculation, the USLE can be used to compare soil losses from a particular field with a specific crop and management system to "tolerable soil loss" rates. Alternative management and crop systems may also be evaluated to determine the

149
adequacy of conservation measures in farm planning.
2.3. Soil Loss Tolerance Soil loss tolerance is defined as the maximum
acceptable level of soil loss from an area that will permit a high level of productivity. The impact of erosion on a given soil type and hence the tolerance level varies depending on the type and depth of soil. Broadly, soils with deep, uniform, stone free topsoil materials and/or that were not previously eroded have been assumed to have a higher tolerance limit than do soils that are shallow or that previously eroded. The US Soil Conservation Service sets limits for tolerable erosion, mostly in the range of 2.2-11.2 t ha-1year-1, the basis being that shallow soils over hard rock have a lower tolerance than deep soils or those that formed from unconsolidated parent materials. In fact, such limits are often not achieved (Young, 1990).
Soil loss tolerance values, which were adapted from McCormack et al., (1982) according to rooting depth, were categorised as five classes as in Table 1.
Table 1. Implication of soil loss tolerance Rooting depth, cm
Soil loss tolerance (ton ha-1year-1) Renewable soil Non-renewable
soil 0-25 2.2 2.2 25-50 4.5 2.3 50-100 6.7 4.5 100-150 9.0 6.7 >150 11.2 11.2
2.4. Land Use Management Approach A method that was proposed by Karaş (2007)
fundamentally was applied in the Güvenç pond basin. The described approach in table 2 was used for both the soil erosion rates and soil loss tolerance values together. The presented table mainly includes all land use types. The principal idea of the table is to apply the required soil conservation precautions (SCP) for land use types according to existing soil erosion and present conditions using only one or a combination of as many of them as possible. Applying of all types of SCP has certain costs. Therefore, SCP practices were ordered from the cheapest to the most expensive. All of the SCP practices were compared to the soil loss tolerance (T) values. Customarily, unused (bare land) and agricultural areas are the most exposed to soil erosion. For example, the first and second SCP at the agricultural land use includes cultural methods,
which contain practices such as conservation tillage, strip cropping and contour farming. If soil erosion is still greater than soil loss tolerance despite cultural precautions of the agricultural land use, third-degree SCP needs to be applied. Physical applications contain, such as terracing or the design and the installation of a combined practice to remove settled solids and associated pollutants in the all runoff for at the larger storms. However, if there are not possible events to prevent or reduce soil erosion to the level of T values by using the first three SCP, the fourth-degree SCP, which includes changing land use type (natural transformation to pasture, rangeland and forest), needs to be applied. If it is not possible to reduce soil erosion under a level of T values via the first four SCP practices, the fifth-degree SCP (including the fourth-degree precautions+physical structures) needs to be applied. Physical structures include graded stabilisation structures, stream bed improvement, gabion threshold construction, and grassed waterways.
3. RESULTS AND DISCUSSION 3.1. Soil Loss Tolerance of the Basin The area, depths, K factor and T values for
each soil series in the Güvenç basin are given in table 3, and the map of soil loss tolerance is shown in figure 2. Almost 56.80% of the basin area is under the mean soil depth (556 mm) and generally is approximately 200 mm deep. Of the remaining area, 20.97% and 22.23% have 600-850 mm and 1200-1300 mm depths, respectively. Because of the very shallow depth, the soil loss tolerance (T) values of the basin soil series are low, and their T values were assigned as 2.2 ton ha-1year-1. Organic matter in the soil series at the basin has a mostly low content that produces compounds that bind particles together, increasing aggregation and reducing the susceptibility of the particles to detachment by raindrop impact and surface runoff. In addition, basin soil has a tendency to increase runoff and erosion. The soil erodibility (K) factor values of the basin soils were calculated as roughly high values because of low organic material and low hydraulic conductivity. Nearly 1/4 of the basin is under 0.39, and the remaining area (3/4) is above this value.
The calculated potential soil loss (PSL) using the USLE for the basin is given in figure 3. Detailed statistical results that were obtained for each land use types are given in table 4. The Potential Soil Loss (PSL) values for existing land use types were obtained.

150
Table 2. Soil conservation precautions according to land use and potential soil loss
Erosion degree
The Value of (A/T) Erosion description Proposed Soil Conservation Precautions
1 ≤ 1.0 None exists or too few
First-Degree Precautions (FDP) Consider cropping systems that will provide maximum protection for the soil. Use minimum tillage systems where possible. Soil management (increasing organic matter content, using soil stabilisers), crop rotation on agricultural areas, suitable tillage, minimum tillage, conservation tillage, mulching, mulch tillage, ridge tillage, strip tillage, fertilising, controlled grazing, pasture management) using suitable mechanisation tools for cultivation.
2 1.0 T – 2.0 Low – Moderate
Second-Degree Precautions (SDP) Use support practices, such as cross slope farming, that will cause the deposition of sediment to occur close to the source. (In addition to FDP applications, contour farming, inter cropping, mixed cropping, agro forestry and shrub establishment of agricultural areas, continued covering, and developing rangelands)
3 2.0 – 4.0 Moderate – High
Third-Degree Precautions (TDP) Cultural Precautions + Physical Structures (In addition to SDP, strip cropping, cross slope, wind breaks, drainage, terracing on brush land and rangeland) terracing, contour strips, installation of trench and holes for pasture management
4 4.0 – 6.0 High Fourth-Degree Precautions (FoDP) Changing land use type (natural transformation to pasture, rangeland and forest)
5 > 6.0 Very High or Severe
Fifth-Degree Precautions (FiDP) Including FoDP + Physical structures Physical structures (graded stabilisation structures, stream bed improvement, construction of gabion threshold, grassed waterways, etc.) Proper forest management, Reforestation / afforestation, shifting cultivation, controlled cutting.
Descriptions: A-Potential Soil Loss; T- Soil Loss Tolerance Value Table 3. Area, depths, K factor and assigned soil loss
tolerance values for each soil series in the basin.
Soil Series Area, km2
Depth, mm
K Factor
Soil loss tolerance
t ha-1 Çayırınkafa 2.48 1300 0.52 9.0 Kervanyolu 1.39 850 0.46 6.7 Kervanpınarı 0.69 1300 0.57 9.0 Acısu 0.78 850 0.50 6.7 Kara 1.33 200 0.52 2.2 Okatılan 1.84 200 0.58 2.2 Ahlatlıbayır 0.78 200 0.31 2.2 Yaşmeşe 1.15 600 0.39 6.7 Tabyabayır 1.80 200 0.60 2.2 Akpınar 2.23 100 0.21 2.2 Lezgi 1.02 250 0.47 2.2 Yanıklıtepe 0.35 1200 0.46 9.0 Total/mean 15.83 556
The results show that the PSL is for 16.05 t
ha-1 of agricultural practice fields, 0.98 t ha-1 for pasture, 0.49 t ha-1 for contour pasture, 0.46 t ha-1 for
forest, 5.90 t ha-1 for horticultural use, 8.42 t ha-1 for brushland, and 97.52 t ha-1 for bare land. The mean calculated potential soil loss is 16.30 t ha-1 for the entire basin. According to the obtained results, agricultural, bare land and brush lands are under the high potential soil loss risk.
The bare land area, occupying 10.26% of the total area, is mostly on the north-west side and in the nested agricultural land use on the north side. Bare land is the most endangered in terms of PSL and originated due to abandonment in the last two decades because of unproductive growth under rain-fed agriculture. Approximately 62.67% of total potential soil loss of the basin arises from bare land. The soil series on this land use include Kervanyolu, Kervanpınarı and Çayırınkafa, which are on a steep slope with a clay texture and low organic material. Although these soil series have a greater-than-mean soil depth and medium level soil loss tolerance, they were abandoned from agricultural usage because of the steep slope.
Bare land use, deprived of vegetation cover, is open to intense rainfall, and the soils in this area are susceptible of particle detachment by raindrop

151
impact on bare soil and surface runoff. Nearly 72% of bare land use has greater than 10 t ha-1 and 30.51
Figure 2. Soil loss tolerance of the basin
Figure 3. USLE-based PSL of the basin
% of the total area with a 160.5 t ha-1 PSL. It is recommended to change to natural land use (pasture), as this area includes physical structures
(i.e., Terracing) to prevent soil loss or reduce to the level of soil loss tolerance.
Agricultural land use, with the density being on the north-east and south-west side of the basin, was converted from natural pasture more than a half-century ago. Having 16.05 t ha-1 of PSL, agricultural land use is second in the basin in terms of PSL. The soil series under agricultural land use include Çayırınkafa, Kara and partially Kervanyolu, which are on the north side of the basin with depths of 1300, 200 and 850 mm, respectively. Although all of these series have clay texture class due to low organic matter and hydraulic conductivity values, their K factor values are high. The soil loss tolerance of these soil series is different because of the depths. Soils of the Kara series are not convenient for agricultural land use because of the steep slope and shallow depth. These conditions are exposed to soil erosion with unprotected land usage at the basin. The estimated PSL for these series range between 10-20 t ha-1, which is greater than that of the T values. Agricultural land use on the south side of the basin mostly includes Akpınar, Lezgi, Tabyabayır and somewhat Ahlatlıbayır and Yaşmeşe series. Apart from Yaşmeşe, the other series have a very shallow depth and low tolerance values and are not suitable for agricultural usage. These soils, having a steep slope, high K factor and unprotected usage, have under erosion risk greater soil loss tolerance. Almost 35.51% of the PSL in the basin arose from agricultural land use. A considerable part (50.18%) of the total agricultural land use produces 85.49% of the PSL, mostly between 10-100 t ha-1 yearly. This situation generates some noteworthy precautions to maintain soil in its place. Agricultural land usages should be applied to mostly first- and second-degree precautions up to fourth-degree measurement for sustainability. Brush land area, third order in terms of PSL, has primarily two (Lezgi and Yanıklıtepe) soil series. Both series typically originated under damaged forest. Due to the heavy cutting of forest trees, the land uses of these soils were converted to brush land in the last three decades. With the effects of other agents (steep slope and low K factor), an unusual decrease of the tree density of this area was due to soil erosion, which ranges from 50-250 ton ha-1 for Yanıklıtepe. Soil losses from brush land constitute 0.61% of the basin. The high obtained PSL values of this soil series are much larger than its high T value. Therefore, according to figure 4, areas that are adjacent to forests and nested in bare land are should have applied predominantly third- and fourth-degree precautions, which are mostly the installation of physical structures or the conversion to natural land use (forest) to conserve the soil.

152
Table 4. Potential soil loss, according to land use types Land use Statistical
results Potential soil losses (t ha-1 year-1)
0-5 5-10 10-20 20-50 50-100 100-250 > 250 General
Agricultural
Mean* 1.01 7.46 14.54 30.94 65.62 124.34 366.21 16.05 Cell unit** 18501 8831 12,373 12493 3009 342 7 55,556 TSL (t)*** 187.99 658.79 1799.03 3865.33 1974.51 425.24 25.63 8934.71 Area (%) 33.31 15.89 22.28 22.49 5.41 0.61 0.01 100.00
Pasture
Mean (t/ha) 0.87 6.11 14.62 29.36 64.28 124.34 - 0.98 Cell unit 66832 217 73 89 40 342 - 67593 TSL (t) 581.44 13.26 10.67 26.13 25.71 425.24 - 662.41 Area (%) 99.45 0.32 0.11 0.13 0.06 0.51 - 100.00
Contour pasture
Mean (t/ha) 0.45 7.78 14.92 32.86 66.13 - - 0.49 Cell unit 8816 4 5 14 5 - - 8844 TSL (t) 39.67 0.31 0.75 4.60 3.31 - - 43.34 Area (%) 99.68 0.05 0.06 0.16 0.06 - - 100.00
Forest
Mean (t/ha) 0.31 7.24 16.76 27.28 72.95 - - 0.46 Cell unit 6662 5 13 13 3 - - 6696 TSL (t) 20.65 0.36 2.18 3.55 2.19 - - 30.80 Area (%) 99.42 0.08 0.20 0.20 0.05 - - 100.00
Brush land
Mean (t/ha) 1.47 7.2 13.6 23.08 75.9 193.62 311.03 8.42 Cell unit 884 514 358 44 11 11 5 1827 TSL (t) 12.99 37.01 48.69 10.16 8.35 21.30 15.55 153.83 Area (%) 48.39 28.13 19.59 2.41 0.60 0.60 0.27 100.00
Horticultural
Mean (t/ha) 1.36 7.28 13.42 23.5 - - - 5.90 Cell unit 723 489 285 27 - - - 1524 TSL (t) 9.83 35.58 38.26 6.33 - - - 90.00 Area (%) 47.44 32.08 18.70 1.78 - - - 100.00
Bare land
Mean (t/ha) 0.1 7.41 15.09 36.13 74.14 160.5 336.31 97.52 Cell unit 4464 161 444 1679 3090 4961 1461 16260 TSL (t) 4.46 11.93 67.00 606.62 2290.93 7962.41 4913.49 15,856.75 Area (%) 27.45 0.99 2.73 10.33 19.00 30.51 8.99 100.00
General
Mean (t/ha) 0.80 7.41 14.51 31.5 69.92 158.20 336.36 16.30 Cell unit 107158 10234 13565 14368 6172 5326 1477 158300 TSL (t) 857.47 758.34 1968.28 4525.92 4315.46 8425.73 4968.04 25,300.49 Area (%) 67.70 6.46 8.57 9.07 3.90 3.36 0.93 100.00
* unit t ha-1year-1, **grid cell unit size: 10×10 m (100 m2), ***TSL, abbreviation for Total Soil Loss Horticultural land uses are as nested and scattered in agricultural and pasture land use types in the soil series of Yaşmeşe, Lezgi, Yanıklıtepe, Acısu and Kervanyolu. Apart from Lezgi, the others have a greater-than-mean soil depth. Three of these series have a clay (C) textured soil; two of these series have a silty clay loam (SCL) texture. These series include 15.24 ha at the basin and have produced 90 tons PSL as totally, representing 5.90 t ha-1 yearly. Of the total area, 47.44% has a 0-5 t ha-1 soil loss capacity, averaging 1.36 t ha-1. Of these areas, 32.08% produce 35.58% of the PSL; the mean soil loss is approximately 7.28 t ha-1 yearly. An area of 2.85 hectare it produces exactly 38.26 tons of soil
loss, equal to 13.42 tons ha-1year-1. Only 1.78% of the total area produces 6.33 tons of PSL yearly. In most cases, approximately 80% of horticultural land uses are partly under soil erosion risk. Although the horticultural land use produces such a small part (0.35%) of the total PSL, soil conservation measurements in this area require mostly third-degree precautions, including physical structures, to prevent soil erosion. Pasture land use, one of the main land uses of the basin, produces a PSL of 0.98 t ha-1 on average. Although 99.45% (668.32 ha) of the pasture land use produces 0.87 t ha-1, totalling 581.44 tons, an area of only 3.42 ha with severe soil loss produces 425.24

153
tons totally, calculating a PSL of approximately 124.34 t ha-1. This over-predicted area is in the Kara soil series. The steep slope, shallow depth and high K factor of this area causes the high PSL. To protect this area, mostly the first three precautions should be applied in the basin. Contour pasture and forest land uses produce the lowest PSL. For both of these land uses, more than 99% of the area produced on average less than 0.5 t ha-1. The existing PSL are 0.12% and 0.17% of the entire basin of forest and contour pasture land use, respectively. These values are shown in table 4 and do not require any soil conservation precautions. While 74.16% of the basin produces only 3.38% of the PSL, 25.84% of the basin produces a PSL of greater than 10 t ha-1. Some restrictive precautions should be taken to reduce soil loss values to less than the tolerance values to sustain the basin. For the mentioned problems, we first need to determine the place and degree of PSL for the application of the SCP. Table 2 includes the SCP that can be applied according to the A/T values for the land uses. Based on the land use approach described above, a map and table of the distribution of the potential soil erosion degree were prepared. Figure 4 and table 4 show the classes and areal distribution of soil erosion.
Figure 4. Soil erosion classes of the basin
The areas in the basin under soil erosion risk are described as bare land and farmland. Pasture land use areas have erosion rates that are generally
between 0-5 t ha-1 and greater soil loss tolerance values. The areas with greater soil loss tolerance values and the required SCP are shown in figure 5.
Figure 5. Potential soil loss over soil loss tolerance
at the basin
3.2. Land use planning of the basin The natural land usages of the basin are
primarily pasture and forest. Areas in the basin under severe erosion risk are agricultural, bare and brush land uses. The suggestions in table 5 can help select the SCP using the soil erosion degree and land use instead of attempting all of the applicable alternatives. The erosion status, location and existing soil series were explained in detail using basin characteristics (i.e., soil, slope and land use) in the preceding section. As explained in table 5, the proposed land use approach was applied in the entire basin. For the sustainable management of the basin, bare, brush and some of the agricultural land usages were converted to pasture and forest as natural land uses. The existing situation arose as a result of the conversion to agricultural from deforestation and the ploughing of pasture land. As the main source of erosion, this is not suitable and sustainable. Therefore, creating a natural situation can help to control soil erosion. Continuous surface cover for these areas will prevent much of the erosion. Contour and strip cropping, including conservation tillage practices (minimum tillage, mulch tillage, ridge tillage, conservation tillage, etc.)
154
and permanent natural vegetation strips, was applied to the remainder of the agricultural areas. Therefore, all of these applications on the soil surface will protect the soil from erosion.
Table 5. Soil erosion degree, description and areal distribution of the basin
Erosion Degree
A/T Ratio Description Area
(km2) Area (%)
1 0 – 1 None or too few exist
10.241 64.68
2 1 – 2 Low – Moderate
1.452 9.18
3 2 – 4 Moderate – High
1.192 7.53
4 4 – 6 High 0.685 4.33 5 > 6 Severe 2.261 14.28 Total 15.830 100.00
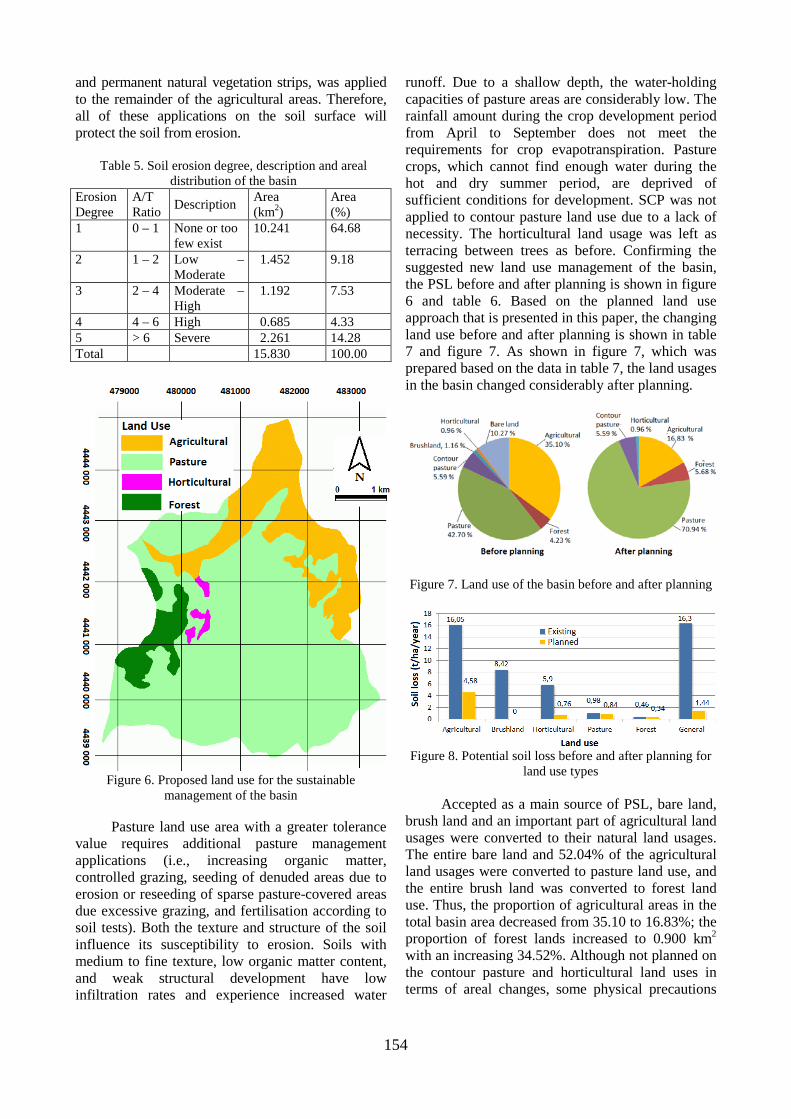
Figure 6. Proposed land use for the sustainable
management of the basin
Pasture land use area with a greater tolerance value requires additional pasture management applications (i.e., increasing organic matter, controlled grazing, seeding of denuded areas due to erosion or reseeding of sparse pasture-covered areas due excessive grazing, and fertilisation according to soil tests). Both the texture and structure of the soil influence its susceptibility to erosion. Soils with medium to fine texture, low organic matter content, and weak structural development have low infiltration rates and experience increased water
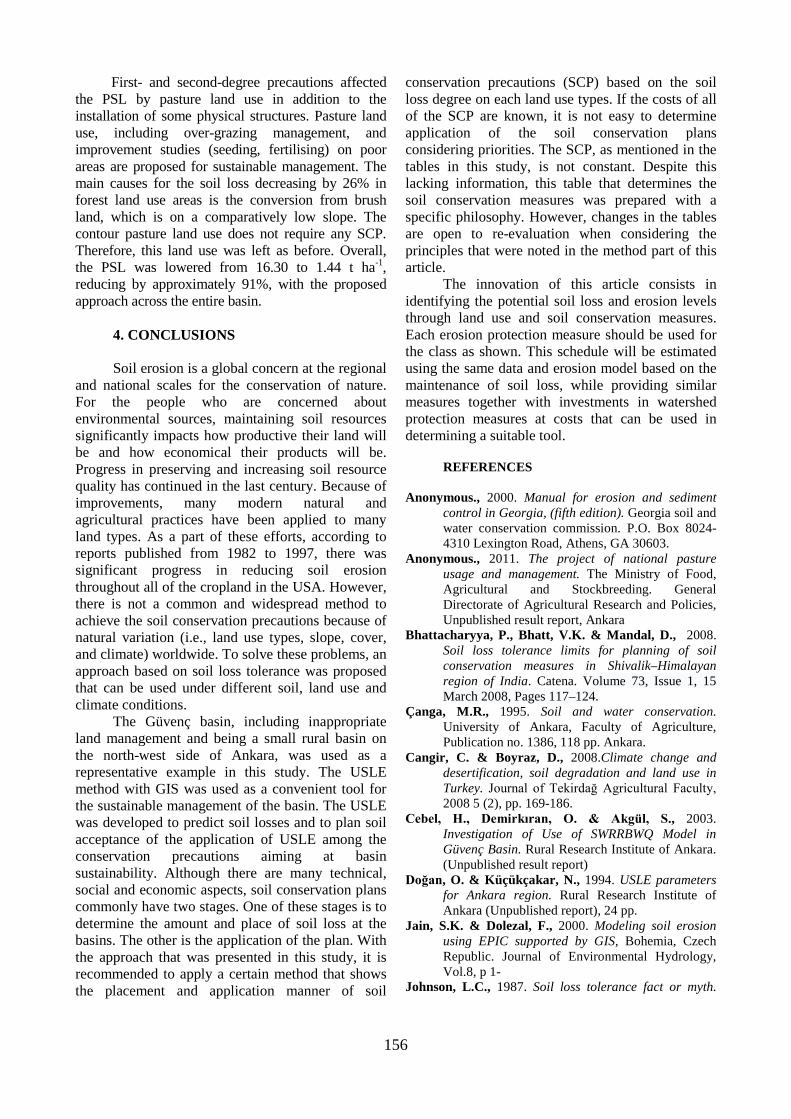
runoff. Due to a shallow depth, the water-holding capacities of pasture areas are considerably low. The rainfall amount during the crop development period from April to September does not meet the requirements for crop evapotranspiration. Pasture crops, which cannot find enough water during the hot and dry summer period, are deprived of sufficient conditions for development. SCP was not applied to contour pasture land use due to a lack of necessity. The horticultural land usage was left as terracing between trees as before. Confirming the suggested new land use management of the basin, the PSL before and after planning is shown in figure 6 and table 6. Based on the planned land use approach that is presented in this paper, the changing land use before and after planning is shown in table 7 and figure 7. As shown in figure 7, which was prepared based on the data in table 7, the land usages in the basin changed considerably after planning.
Figure 7. Land use of the basin before and after planning
Figure 8. Potential soil loss before and after planning for
land use types
Accepted as a main source of PSL, bare land, brush land and an important part of agricultural land usages were converted to their natural land usages. The entire bare land and 52.04% of the agricultural land usages were converted to pasture land use, and the entire brush land was converted to forest land use. Thus, the proportion of agricultural areas in the total basin area decreased from 35.10 to 16.83%; the proportion of forest lands increased to 0.900 km2 with an increasing 34.52%. Although not planned on the contour pasture and horticultural land uses in terms of areal changes, some physical precautions

155
were proposed for the horticultural land use. The rate of pasture land use increased from 42.70 to 70.93% due mostly to conversion from agricultural land usage. The potential soil losses after planning were evaluated for comparison with the existing conditions as in figure 8.
Based on the presented approach, soil losses on the agricultural land usages decreased from 16.05 to 4.58 t ha-1, and the reducing rate was approximately
71.46%. In particular, first- (crop rotation, suitable tillage, minimum tillage, conservation tillage, mulching, ridge tillage, strip tillage and using suitable mechanisation tools for cultivation) and second-degree SCP are proposed to reduce soil losses in agricultural areas. Soil losses on horticultural land decreased from 5.90 to 0.76 t ha-1 using physical precautions.
Table 6. Potential soil loss in the basin after planning
Land Use Statistical data
Potential soil losses, t ha-1 year-1
0.0–2.5 2.5 –5.0 5 - 10 10-20 > 20.00 General
Agricultural
Mean*(t ha-1) 0.76 3.68 7.09 13.64 25.91 4.58
Cell unit** 11985 5989 5378 2662 629 26645 TSL (t)*** 92.87 218.10 379.03 363.50 167.69 1221.19 Area (%) 44.98 22.48 20.19 9.99 2.36 100.00
Forest
Mean*(t ha-1) 0.34 2.84 - - - 0.34 Cell unit 8978 15 - - - 8993 TSL (t) 30.09 0.43 - - - 30.52 Area (%) 99.83 0.17 - - - 100.00
Pasture
Mean(t/ha) 0.66 3.22 6.51 13.20 27.76 0.84 Cell unit 105054
6542 588 93 17 112,294
TSL (t)*** 693.35 210.72 38.30 12.28 4.72 1013.99 Area (%) 93.55 5.83 0.52 0.08 0.02 100.00
Contour pasture
Mean*(t ha-1) 0.37 2.91 6.96 14.41 31.84 0.49 Cell unit** 8788 27 10 12 9 8844 TSL (t)*** 32.27 0.78 0.70 1.73 2.86 38.34 Area (%) 99.34 0.31 0.11 0.14 0.10 100.00
Horti- cultural
Mean(t ha-1) 0.76 - - - - 0.76 Cell unit 1524 - - - - 1524 TSL (t) 11.26 - - - - 11.26 Area (%) 100.00 - - - - 100.00
Basin General
Mean (t ha-1) 0.65 3.42 7.00 13.64 27.41 1.44 Cell unit 135853 12546 5966 2755 629 158,300 TSL (t) 882.10 429.25 417.33 375.78 172.41 2276.96 Area (%) 86.12 7.94 3.78 1.75 0.41 100.00
Descriptions: A-Potential Soil Loss; T- Soil Loss Tolerance Value
* Mean t ha-1 year-1, **grid cell unit size: 100 m2, ***TSL, abbreviation of Total Soil Loss
Table 7. Existing and planned land uses of the basin
Land use Existing Area, Planned Area Area Change km2 % km2 % km2 %
Agricultural 5.557 35.10 2.665 16.83 -2.892 -52.04 Forest 0.669 4.23 0.899 5.68 +0.230 +34.52 Pasture 6.759 42.70 11.230 70.94 +4.471 +66.13 Contour pasture 0.884 5.59 0.884 5.59 - - Brush land 0.183 1.16 - - -0.183 -100.00 Horticultural 0.152 0.96 0.152 0.96 - - Bare land 1.626 10.27 - - -1.626 -100.00 Total 15.830 100.00 15.830 100.00
156
First- and second-degree precautions affected the PSL by pasture land use in addition to the installation of some physical structures. Pasture land use, including over-grazing management, and improvement studies (seeding, fertilising) on poor areas are proposed for sustainable management. The main causes for the soil loss decreasing by 26% in forest land use areas is the conversion from brush land, which is on a comparatively low slope. The contour pasture land use does not require any SCP. Therefore, this land use was left as before. Overall, the PSL was lowered from 16.30 to 1.44 t ha-1, reducing by approximately 91%, with the proposed approach across the entire basin.
4. CONCLUSIONS Soil erosion is a global concern at the regional
and national scales for the conservation of nature. For the people who are concerned about environmental sources, maintaining soil resources significantly impacts how productive their land will be and how economical their products will be. Progress in preserving and increasing soil resource quality has continued in the last century. Because of improvements, many modern natural and agricultural practices have been applied to many land types. As a part of these efforts, according to reports published from 1982 to 1997, there was significant progress in reducing soil erosion throughout all of the cropland in the USA. However, there is not a common and widespread method to achieve the soil conservation precautions because of natural variation (i.e., land use types, slope, cover, and climate) worldwide. To solve these problems, an approach based on soil loss tolerance was proposed that can be used under different soil, land use and climate conditions.
The Güvenç basin, including inappropriate land management and being a small rural basin on the north-west side of Ankara, was used as a representative example in this study. The USLE method with GIS was used as a convenient tool for the sustainable management of the basin. The USLE was developed to predict soil losses and to plan soil acceptance of the application of USLE among the conservation precautions aiming at basin sustainability. Although there are many technical, social and economic aspects, soil conservation plans commonly have two stages. One of these stages is to determine the amount and place of soil loss at the basins. The other is the application of the plan. With the approach that was presented in this study, it is recommended to apply a certain method that shows the placement and application manner of soil
conservation precautions (SCP) based on the soil loss degree on each land use types. If the costs of all of the SCP are known, it is not easy to determine application of the soil conservation plans considering priorities. The SCP, as mentioned in the tables in this study, is not constant. Despite this lacking information, this table that determines the soil conservation measures was prepared with a specific philosophy. However, changes in the tables are open to re-evaluation when considering the principles that were noted in the method part of this article.
The innovation of this article consists in identifying the potential soil loss and erosion levels through land use and soil conservation measures. Each erosion protection measure should be used for the class as shown. This schedule will be estimated using the same data and erosion model based on the maintenance of soil loss, while providing similar measures together with investments in watershed protection measures at costs that can be used in determining a suitable tool.
REFERENCES
Anonymous., 2000. Manual for erosion and sediment
control in Georgia, (fifth edition). Georgia soil and water conservation commission. P.O. Box 8024-4310 Lexington Road, Athens, GA 30603.
Anonymous., 2011. The project of national pasture usage and management. The Ministry of Food, Agricultural and Stockbreeding. General Directorate of Agricultural Research and Policies, Unpublished result report, Ankara
Bhattacharyya, P., Bhatt, V.K. & Mandal, D., 2008. Soil loss tolerance limits for planning of soil conservation measures in Shivalik–Himalayan region of India. Catena. Volume 73, Issue 1, 15 March 2008, Pages 117–124.
Çanga, M.R., 1995. Soil and water conservation. University of Ankara, Faculty of Agriculture, Publication no. 1386, 118 pp. Ankara.
Cangir, C. & Boyraz, D., 2008.Climate change and desertification, soil degradation and land use in Turkey. Journal of Tekirdağ Agricultural Faculty, 2008 5 (2), pp. 169-186.
Cebel, H., Demirkıran, O. & Akgül, S., 2003. Investigation of Use of SWRRBWQ Model in Güvenç Basin. Rural Research Institute of Ankara. (Unpublished result report)
Doğan, O. & Küçükçakar, N., 1994. USLE parameters for Ankara region. Rural Research Institute of Ankara (Unpublished report), 24 pp.
Jain, S.K. & Dolezal, F., 2000. Modeling soil erosion using EPIC supported by GIS, Bohemia, Czech Republic. Journal of Environmental Hydrology, Vol.8, p 1-
Johnson, L.C., 1987. Soil loss tolerance fact or myth.

157
Journal of Soil and Water Conservation, v.42, p.155-160.
Jones, O.R., Eck, H.V., Smith, S.J., Coleman, G.A. & Hauser, V.L., 1985 Runoff, soil, and nutrient losses from rangeland and dry-farmed cropland in the southern high plains. Journal of Soil and Water Conservation, January/February 1985, vol. 40 no. 1, 161-164.
Karaş, E., 2007. Application of SWAT, USLE and RUSLE on Güvenç basin. Soil and Water Resources Research Institute of Eskişehir, Research report: TAGEM-BB-TOPRAKSU-2007/43. 123 pp. Eskişehir.
Laflen, J.M., Elliot, W.J., Flanagan, D.C., Meyer, C.R & Nearing, M.A., 1997. WEPP predicting water erosion using a process-based model. Journal of Soil and Water Conservation, 52, 96–102.
Lal, R., 1997. Degradation and resilience of soils. Phil. Trans. R. Soc. Lond. B (1997) 352, 997-1010.
Mandal, D., Sharda, V.N. & Tripathi, K.P., 2010. Relative efficacy of two biophysical approaches to assess soil loss tolerance for Doon Valley soils of India. Journal of Soil and Water Conservation January/February vol. 65 no. 1, 42-49.
Mannering, J. V., 1981.The use of soil loss tolerances as a strategy for soil conservation. In: Morgan, R.P.C. (Eds.) Soil conservation. Problems and Prospects, pp. 337–350, John Wiley, Chichester.
McCormack, D.E., K.K. Young, & Kimberlin, L.W., 1981. Technical and societal implications of soil loss tolerance. In R.P.C. Morgan [ed.] Soil Conservation, Problems and Prospects. John Wiley & Sons. New York, NY.
McCormack, D.E., K.K. Young, & Kimberlin, L.W., 1982. Current criteria for determining soil loss tolerance. Pages 95-111 in D. M. Kral (ed.), Determinants of soil loss tolerance. American Society of Agronomy Special Publication 45. Madison, Wisconsin
Mellerowicz, K.T., Rees, H.V., Chow, T.L. & Ghanem, I., 1994. Soil conservation planning at the watershed level using the Universal Soil Loss Equation with GIS and microcomputer technologies; a case study. Journal of Soil and Water Conservation, 49 (2); 194-200.
Moehansyah, H., Maheshwari, B.L. & Armstrong, J., 2004. Field Evaluation of Selected Soil Erosion Models for Catchment Management in Indonesia. Biosystems Engineering (2004) 88 (4), 491–506.
Moore, I. & Burch, G., 1986. Physical basis of the length-slope factor in the universal soil loss equation. Soil Science Society of America Journal 50:1294-1298.
Oğuz, I., Erşahin, S. & Susam, T., 2011. Evaluation of desertification potential in a sloping catchment. Carpathian Journal of Earth and Environmental Sciences, February 2011, Vol 6, No.1, p. 81-88.
Oğuz, I., Karaş, E. & Dengiz, O., 2013. Observation and evaluation of desertification and soil erosion at rural basins and improvement a valid method
for sustainable land use planning. The Scientific and Technological Research Council of Turkey (TÜBİTAK): Project Proposal 1007-OSİB-2012-03, pp.29, Ankara.
Pierce, F.J., Larson, W.E. & Dowdy, R.H., 1984. Soil loss tolerance: maintenance of long-term soil productivity. Journal of Soil and Water Conservation 39, 136–138.
Pretorius J. R. & Cooks, J., 1989. Soil loss tolerance limits: an environmental management tool. GeoJournal, July 1989, Volume 19, Issue 1, pp 67-75.
Renard K.G., Foster G.R., Weesies G.A., McCool, D.K. &Yoder, D.C., 1997. Predicting Soil Erosion by Water: A Guide to Conservation Planning With the Revised Universal Soil Loss Equation (RUSLE). U.S. Department of Agriculture, Agriculture Handbook No. 703, 404 p.
Schertz, D. L., 1983 The basis for soil loss tolerances. Journal of Soil and Water Conservation, 38(1):10-14
Skidmore, E.L., 1982. Soil loss tolerance. p. 87–93. In Determinants of soil loss tolerance. ASA Spec. Publ. 45. ASA, Madison, WI.
Smith, R.M. & Stamey, W.L., 1964. How to Establish Erosion Tolerances. Journal of Soil and Water Conservation, Volume 19, Number 3, May-June, 1964.
Smith, R.M. & Stamey, W.L. 1965. Determining the range of tolerable erosion. Soil Science.100: 414-24.
Sparovek, G. & De Maria, I.C., 2003. Multiperspective analysis of erosion tolerance. Scientia Agricola, v.60, n.2, p.409-416, Abr. /Jun. 2003.
Sparovek, G. & De Yong V.L.Q., 1997. Definition of tolerable soil erosion values. Revista Brasileira de Ciência do Solo, v.21, p.467-471, 1997.
Sparovek, G. & Schnug, E., 2001.Temporal erosion-induced soil degradation and yield loss. Soil Sci. Soc. Am. J. 65:1479–1486.
Sparovek, G., Weill, M.M., Ranieri, S.B.L., Schnug, E. & Silva, E.F., 1997. The life-time concept as a tool for erosion tolerance definition. Sci. Agric. Piracicaba, 54. (Numero Especial) 130-135.
Stamey, W.L. & Smith, R.M., 1964. A conservation dehition of erosion tolerance. Soil Sci. 97(3):183-186.
USDA, 1972. Sediment sources, yields, and delivery ratios. National Engineering Handbook, Section 3 Sedimentation.
Verheijen, F.G.A., Jones, R.J.A., Rickson, R.J. & Smith. C.J., 2009. Tolerable versus actual soil erosion rates in Europe. Earth-Science Reviews, Volume 94, Issues 1-4, May 2009, Pages 23-38.
Williams, J.R., Dyke, P.T. & Jones, C.A., 1982. EPIC a model for assessing the effects of erosion on soil productivity. Analysis of Ecological Systems: State of the art in Ecological Modelling, pp 553–572. Elsevier, Amsterdam.

158
Wischmeier, W.H. & Smith, D.D., 1978. Predicting rainfall erosion losses: a guide to conservation farming, USDA Handbook: No. 537.
Young, A., 1990. Agroforestry for soil conservation. CAB International. International Council for Research in Agroforestry, pp. 32, Wallingford.
Received at: 01. 09. 2014 Revised at: 10. 02. 2015 Accepted for publication at: 26. 02. 2015 Published online at: 08. 04. 2015