Embed Size (px)
Citation preview

A New Approach to Partial Discharge Detection
Under DC Voltage
Pietro Romano, Giuseppe Presti, Antonino Imburgia L.E.PR.E. HV Laboratory, D.E.I.M. Department,
Palermo University,
Palermo, Italy
Roberto Candela
Prysmian Electronics Srl
Palermo, Italy
SUMMARY A new method for PD detection under HVDC is proposed, based on the application of a
periodic continuous waveform. It is suitable for testing HVDC cable systems.
Index Terms — HVDC, partial discharge, DC measurements, testing method,
pattern recognition, discharge phenomena
1 INTRODUCTION
The continuing development of HVDC power transmission
systems presents many problems related to evaluation of the
reliability of power system assets [1] – [5]. In this context the
identification of insulation defects plays a key role in
preventing unexpected failures of electrical components.
Partial discharge (PD) measurement is a useful approach to
assessing the condition of HV power apparatus and cables.
Such measurements are also widely employed for HVAC
systems. The inception mechanisms of PD in AC systems are
well-known, and measurements are usually performed
following the IEC 60270 standard [6].
PD measurements under DC voltage present complexities
related to the nature of the phenomenon and the supply
conditions [7]. In AC systems phase-resolved-partial-discharge
(PRPD) patterns allow assessment of the insulation condition,
and provide information on the types of defect present [8].
Such analysis cannot be performed under DC voltage, since
each discharge event cannot be related to a phase value. The
interpretation of the acquired data therefore requires a different
approach.
Fromm was the first researcher to propose an approach for
the classification of PD under DC voltage [9]. Other authors
[10]-[12] have proposed statistical approaches to the
recognition of phenomena generated by artificial defects
(internal, surface and corona specimens), using parameters
such as the discharge magnitudes (Q) and the time between
discharges (TBD). The aim was to extract Weibull
distribution parameters fitting the empirical Q and TBD
distributions and use these distributions for defect
identification purposes. New pattern recognition
methodologies for PD observed under DC stress have been
proposed more recently [13], [14].
PRPD patterns acquired under AC conditions allow the
investigator to distinguish easily between noise and PD signals.
Under DC voltages it is necessary to implement a noise
rejection strategy in order to remove noise signals from
acquired data. Niu et al [15] proposed a strategy based on
cross- correlation analysis.
The PD repetition rate under AC is orders of magnitude
higher than that under DC with the same amplitude [9]. For
this reason, some DC tests have been performed applying
positive and negative voltage ramps [16].
In order to acquire enough data for diagnosis under DC,
voltages higher than the corresponding AC voltages need to be
applied, and for longer times [7]. In a recent paper [17]
Montanari et al suggested that adoption of time-frequency (TF)
maps for PD phenomena identification, and separation
algorithms developed for AC PD measurements, might prove
effective for DC work.
In this paper we propose a new approach to PD
measurement under DC voltage. It offers the possibility of
building PRPD-like patterns, using analysis similar to that
adopted for AC, and overcomes some of the problems
mentioned above. No standard for HVDC PD tests exists at
present.
2 THE VOLTAGE WAVEFORM
To overcome the problem of PD synchronization with the
DC voltage, a new DC waveform has been introduced. It has a
positive or negative average value (Figure 1), and is derived
from a single-phase half-wave rectifier with added variable
offset δVx. It is defined mathematically by
𝑣(𝑡) = {𝑉𝑥sin(𝜔𝑡) 𝑓𝑜𝑟 𝛼 ≤ 𝜔𝑡 ≤ 𝜋 − 𝛼
𝛿𝑉𝑥 𝑓𝑜𝑟 0 ≤ 𝜔𝑡 < 𝛼, 𝜋 − 𝛼 < 𝜔𝑡 ≤ 2𝜋 (1)

where δVx takes values between 0 and Vx. It follows a
sinusoidal law from 𝛼 to 𝜋 − 𝛼 and is constant over the
remainder of the period.
Figure 1: Voltage waveform proposed for PD tests under DC voltage.
The average and rms values of the voltage (Va and Vrms
respectively) can be varied by varying the parameter 𝛿 over the
range 0 - 1. We have
𝑉𝑎 =𝑉𝑥
2𝜋[𝛿(2𝛼 + 𝜋) + 2cos (𝛼)] (2)
𝑉𝑟𝑚𝑠 = 𝑉𝑥√1
2𝜋{𝛿2(2𝛼 + 𝜋) +
1
2[𝜋 − 2𝛼 + sin(2𝛼)]} (3)
where α = arcsin (δ). Given δ = 0.625, Vrms = 0.707 Vx,
corresponding to the RMS value of a sinusoidal voltage
with the same peak value (Figure 2). Figure 3 shows Vrms
versus Vx for various values of δ; δ = 1 coincides with the
DC case and δ = 0.625 coincides with the AC case. The
latter statement is the well-known equivalence relationship
between RMS value and DC value, and does not imply any
other similarity between the AC and DC cases.
Figure 2: Vrms / Vx versus 𝛿
Using this periodic waveform it is possible to acquire a 50
Hz synchronization signal from which a PRPD pattern can be
plotted. Pattern recognition criteria similar to those adopted for
AC PD phenomena can then be developed. Frequency can also
be used as an additional parameter for varying the test
conditions.
The aim in adopting this waveform was to have a unipolar
electric field distribution, so that electrons available for the
partial discharge process are generated by the space charge
distribution inside the material, and in the interface of the
material with the cavity. In this way an electric field
distribution and electrons are generated, as in DC.
Figure 3: 𝑉𝑟𝑚𝑠 versus 𝑉𝑥 for different values of δ.
Recommendations for testing HVDC extruded cable systems
will be found in Cigré TB 496 [18]. Standards (not specific for
HVDC) have also been issued by IEC [19], and
recommendations by Electra [20].
In many tests, the extruded cable system (cable, joints and
terminations) form a closed loop in order to ensure that the
tests are performed under real load conditions, with current
generated using specific transformers. The temperature drop
across the insulation is reproduced not by applying a voltage
source, but by supplying current. In this way PD measurements
can be made taking into account both temperature variation
and space charge accumulation under realistic operating
conditions.
An HVDC periodic source could be made using the circuit
shown in Figure 4. It consists of a high voltage transformer and
a single-phase full-bridge rectifier, the output of which is
regulated by a control circuit which drives two insulated-gate -
bipolar-transistors (IGBTs) S1 and S2 (or more depending on
the required voltage level). With S1 on and S2 off, the
Figure 4: HVDC periodic source.
sinusoidal waveform shown in the Figure 1 in the interval
– () is generated. With S1 off and S2 on, the single
phase full bridge rectifier is connected to the output through
a large capacitor filter and generates a pure DC voltage at
the output, as shown in Figure 1 in the intervals 0 – and
() – 2
3 EXPERIMENTAL SETUP
The measurement set-up used for the experimental tests is
shown in Figure 5. The test cells adopted in the present work
were such that internal, surface and corona discharges could
be initiated within them (Figure 6). The internal discharge
test cell consisted of two 127 μm thick overlapping Kapton
layers, one of which had been drilled in order to simulate a
cavity. The cell was immersed in a container filled with
silicone oil, in order to avoid inception of surface
discharges over the area of the Kapton layers protruding

over the electrodes (Figure 6 (a), (b)). A similar test cell
was used to simulate surface discharges, but only one
Kapton layer was interposed between the two electrodes
with different diameters (Figure 6 (c)). Corona discharges
were obtained using the classic air-insulated point-plane
gap geometry (Figure 6 (d)).
Figure 5: Measurement set-up.
In order to investigate the ability of the set-up to
recognize multiple and concurrent phenomena, some
measurements were performed with two cells connected
together (see below).
a) Internal discharge specimen with two overlapping Kapton layers.
Figure 6: Test cells used to simulate partial discharge phenomena.
The continuous voltage waveform was generated by a
Tektronix signal generator, with maximum output signal
amplitude ± 10 V, connected to a Trek Model 664 power
amplifier capable of amplifying the input signal by 1000.
PD signals were acquired using a wireless sensor Prysmian
Pry-Cam, which has a bandwidth of 100 MHz and transmits
the acquired data to the software PDiscover. The latter uses
a WiFi communication protocol [21], [22]. The sensor was
placed at a distance of 10 cm from the cable connecting the
test cell to ground. The Trek 664 power amplifier could also
function as a constant DC voltage source, and was used to
compare the results obtained using the proposed waveform
with those obtained using a constant voltage.
Unfortunately the maximum applied voltage available
was insufficient to enable us to study other materials and
other types of defects.
4 EXPERIMENTAL RESULTS
4.1 Test procedure
In order to verify that the proposed method yields
reliable results, we compared the results obtained by (a)
stressing the internal artificial void specimen with a
constant DC voltage, (b) applying a sinusoidal voltage, and
(c) applying the waveform shown in Figure 1. The
inception voltage and the discharge repetition rate were
recorded for each test. More specifically, the variation of
these two quantities with δ was recorded. When δ is
increased from 0 to 1, the ripple on the DC voltage
decreases and the voltage is almost constant. PRPD patterns
were also acquired and analyzed using the software
PDiscover. Finally, internal - corona and internal - surface
cells were combined in order to verify that patterns acquired
using the Figure 1 waveform can be used to identify various
PD phenomena, thereby simplifying the statistical analysis
of the data.
4.2 AC results
The AC tests were performed using a 50 Hz sinusoidal
waveform with an rms value of 5 kV. The resulting PRPD
pattern for an internal discharge sample (Figure 7) shows
the expected behavior, with “rabbit-like” shape typical of
internal discharges. The discontinuities in discharge
magnitude after both voltage polarity inversions (transition
from “rabbit-ear” to “rabbit-body”) are mainly due to
reduced electron availability, leading to a delay in PD
inception (PDIV) [23]. The PD repetition rate recorded
during the measurements was about 66 pulses/sec, and the
inception voltage Vx was about 2 kV. The vertical color
scale, showing the number of discharges with the same
magnitude and phase, runs from 1 to 250 discharges in steps
of 3.5 discharges.
Figure 7: PRPD pattern acquired under AC conditions (50 Hz) with an
applied voltage 𝑉𝑟𝑚𝑠 = 5 𝑘𝑉 (𝑉𝑥 = 7.07 𝑘𝑉) on an artificial internal
discharge specimen. The red line shows the applied voltage, while
and show the width of the spectrum for positive and negative PDs
respectively.
4.3 Constant DC results
The DC test was performed with constant voltages of 5
kV and 10 kV (Trek 884), and no PD activity was detected.
The test was repeated with a Fug HCN-14 DC voltage
generator (20 kV); the PDIV was 14 kV, and the PD pattern
observed at this voltage is shown in Figure 8. The total
b) Internal specimen c) Surface specimen d) corona specimen
-(°)
+(°)

number of acquired discharges was 101,
Figure 8: PD pattern obtained under 14 kV DC voltage on an artificial
internal discharge sample. The continuous red line shows the DC applied voltage.
corresponding to a repetition rate of 0.084 pulses/sec.
4.4 DC Periodic waveform results
The direct current periodic (DCP) tests using the continuous
waveform were performed with 𝛿 = 0.625. With this
waveform, repetitive PDs were first detected at 𝑉𝑥 = 5.8 𝑘𝑉
(PDIV), following which PD acquisition was performed at
𝑉𝑥 = 7.07 kV, in order to obtain an rms value of 5 kV. Figure 9
shows the associated PRPD pattern, the vertical color scale
being the same as that in Figure 7. The acquisition time was
about 60 sec. Under these conditions it was possible to
acquire partial discharges synchronized with the DCP
waveform, as in the AC case (Figure 7), while the
discharges in the DC case (Figure 8) were acquired over a
20 minute period.
Figure 9: PD pattern acquired using the DCP waveform (f=50 Hz,
=0.625, 𝑉𝑟𝑚𝑠 = 5 𝑘𝑉, 𝑉𝑥 = 7.07 𝑘𝑉) and an artificial internal discharge
specimen. The acquisition time was about 60 sec. The red line shows the
DC periodic applied voltage.
The presence of both negative and positive discharges
should be noted. Only one polarity would be expected since
the applied voltage is unipolar. It is well know that the
polarity of AC PDs is linked to the sign of the voltage
derivative dv/dt [24]. Accordingly, since positive and
negative dv/dt are present in the DCP waveforms, positive
and negative discharges are generated. Application of an
electric field greater than that used in the present work
might result in unipolar discharges, because of the influence
of space charge accumulated on the dielectric/air interface
[25].
PD pulses are generated when 𝑑𝑣 𝑑𝑡⁄ is not zero, and the
amplitudes of the acquired discharges are similar to those
observed in the AC tests (compare Figures 7 and 9). The
absence of a zero crossing in the DCP waveform would be
expected to reduce the width of the PD spectrum for both
positive and negative discharges. In particular, it is
expected that, for positive discharges, the DCP waveform
(with no positive dv/dt values when the voltage is negative)
will cause the disappearance of the "ear" part of the pattern,
and for negative discharges, the DCP waveform (with no
negative dv/dt values when the voltage is negative) will
cause the disappearance of the "body" part of the pattern.
This reduction occurs mainly for internal discharges in
which an inception phase angle less than the phase angle of
zero crossing can often be observed [23].
Figures 10 and 11 show pulse shapes and admittance
amplitude harmonic spectra of the PDs, under the AC and
DCP applied voltages respectively. These Figures are very
similar, confirming that the artificial internal defect is the
same under both waveforms.
Figure 10: Internal PD pulse shape and admittance amplitude harmonic
spectrum observed under the AC waveform.
Figure 11: Internal PD pulse shape and admittance amplitude harmonic
spectrum observed under the DCP waveform.

4.5 Dependence of PDIV and PD repetition rate on 𝛿
As explained in Section 2, the parameter 𝛿 links the AC
case (δ = 0.625) and the DC case (δ = 1). The dependence
of the PDIV and repetition rate on δ was investigated at
𝑉𝑥 = 7.07 𝑘𝑉. 10000 pulses were acquired for each value of δ.
The results are presented in Table 1. PDIV and PD repetition
rate (PDRR) variation with δ are shown in Figures 12 and
13 respectively.
The inception voltage increases steadily when 𝛿 increases
from zero to 0.8, i.e., as the sinusoidal part of the waveform
varies between α and π − α (Figure 1). The width of positive
and negative discharge clusters and the discharge maximum
magnitudes decrease as the voltage waveform tends to a
constant (δ → 1). The discharge repetition rate decreases
steadily as δ increases. No PDs were detected for δ = 0.9 and δ
=1. It may be that the inception voltages at these δ values are
higher than 10 kV.
Table I: PD inception voltage PDIV and discharge repetition rates PDRR
for various values of 𝛿, and repetition rates under AC and DC (Sections 4.2 and 4.3).
𝜹 PDIV [kV]
PD repetition rate under
DCP [PD/s]
PD repetition rate under AC (5 kV)
[PD/s]
PD repetition rate under DC
(14 kV ) [PD/s]
0 2.2 55.37
66.40 0.084
0.1 2.6 47.34
0.2 2.9 37.87
0.3 3.4 30.92
0.4 3.7 23.40
0.5 4.4 18.35
0.6 5.7 12.34
0.7 7.5 9.55
0.8 9.8 0.45
0.9 - -
1 - -
Figure 12 and 13 also show the results of fitting second
order polynomials in δ to the experimental PDIV and PD
repetition rate data respectively. The polynomials were
PVID = 14.15δ2 - 2.71δ + 2.56 (4)
PDRR = 27.48δ2 - 88.10δ + 55.19 (5)
The correlation coefficients R2 were 0.9941 and 0.9954 for (4)
and (5) respectively. As far as we are aware, there is no widely
accepted theoretical reason why the PDIV and PDRR should
follow a second order polynomial in δ. We chose it as the
simplest mathematical expression yielding a good fit to the
experimental data. However, first order polynomials in δ
also yielded good fits to the experimental data with R2
values of 0.8688 and 0.9866 for PDIV and PDRR
respectively.
Figure 12 suggests that the PDIV corresponding to a constant
DC voltage is approximately 14 kV at δ = 1, in agreement with
the PDIV evaluated in the constant DC test (Section 4.3).
Figure 13 shows that the PDRR decreases at a nearly
constant rate from δ = 0 to δ = 0.8. Substitution of δ = 1
(constant DC, Section 4.3) in (5) yields PDRR ≈ -5 PD/s,
qualitatively consistent with the very small experimental rate
of 0.084 PD/s.
Figure 12: Variation of measured PDIV with δ (red circles), and a second
order polynomial in δ fitted to the experimental data (solid blue curve).
Figure 13: Variation of measured PD repetition rate (PDRR) with δ (red
circles), and a second order polynomial in δ fitted to the experimental data
(solid blue curve).
Figure 14 shows the PD patterns obtained using the
internal discharge specimen, over the range δ = 0 to δ = 0.8.
The phase angle at which positive discharges commence
increases from about 10° to about 60
° over this 𝛿 range. No
discharges were detected close to the maximum value of the
DCP waveform, as often happens with internal defects [26].
Negative discharges appear around 130° for all values of δ. The
negative discharge extinction phase angle lies in the range
127-180° for all δ values. The decreasing width of both
positive and negative discharge phase angle ranges is
closely correlated with the decreasing width of the α −(π − α) part of the DCP waveform. At δ = 0.1 negative
discharges occur after the input voltage has decreased to a
constant value, similar to the behavior ("echo PD") reported
in [27]. The occurrence of PDs at much the same phase angles
for all values of δ strongly suggests that they are generated by

the same phenomena, and are not the result of random noise in
the apparatus.
Figure 14: PD patterns acquired for nine values of 𝛿, using the internal
discharges cell.
A model which we proposed some years ago [28], taking
into account the effect of temperature on the dynamics of
PDs in a cavity within a dielectric, may be consistent with
the present results [29]. Using the PEA space charge
measurement technique we found that the space charge
profiles in a sample consisting of a single kapton layer,
following application of DCP (δ = 0.6) and DC waveforms,
were very similar, assuming that both waveforms have
equivalent effect in terms of charge distribution,
determining the same electric field gradient. Consequently.
in the presence of a void embedded within the dielectric
subjected to DCP, the charge, which will also appear at the
dielectric/air interface, can contribute to the electron
availability and the localized field enhancement, leading to
PDs [30].
In this article, PDIVs, PD repetition rates and PD
patterns were obtained only for internal discharge
specimens.
4.6 Detection of combined PD phenomena
PD measurements on real components often reveal the
simultaneous presence of various PD phenomena. Correct
diagnosis of a dangerous insulation defect requires a reliable
PD pattern recognition strategy. The measurement circuit must
be designed to avoid inducing corona or surface partial
discharges. As discussed in the Introduction, PD data analysis
under constant DC voltage requires statistical strategies or
techniques [31]–[33] based on wavelet transformation [34].
The method proposed in the present work facilitates defect
recognition using PRPD pattern analysis and fast Fourier
transforms of PD pulses.
We now present the results of two sets of experimental
measurements, the first set performed on a specimen in which
corona and internal discharges were occurring simultaneously,
and the second set on two specimens connected in parallel in
order to simulate simultaneous internal and surface PDs.
Figure 15 shows the pattern acquired in the first set, with
𝛿 = 0.3 at 8.3 kV. One of the three pink rectangles is
associated with corona discharges, and the other two with
internal discharges. As observed under sinusoidal voltages
Figure 15: Combined PD patterns acquired by applying the DC periodic
waveform (f=50 Hz, 𝑉𝑟𝑚𝑠 = 8.3 𝑘𝑉, 𝛿 = 0.3) to a specimen containing corona and internal defects.
[8],[35], corona discharges are clustered around the maximum
value of the applied voltage, while internal discharges are
clustered around the region of maximum 𝑑𝑣 𝑑𝑡⁄ of the applied
voltage, as shown in Sections 4.4 and 4.5.
The results shown in Figure 15 can be plotted as a time-
resolved PD (TRPD) pattern, in order to clarify how the
present approach can simplify the recognition of
superimposed PD phenomena. Figure 16 shows that corona
and internal discharges are mixed along the time line and
cannot be separated using the PD time pattern.
𝛿 = 0 𝛿 = 0.1
𝛿 = 0.2 𝛿 = 0.3
𝛿 = 0.5 𝛿 = 0.4
𝛿 = 0.8
𝛿 = 0.7 𝛿 = 0.6
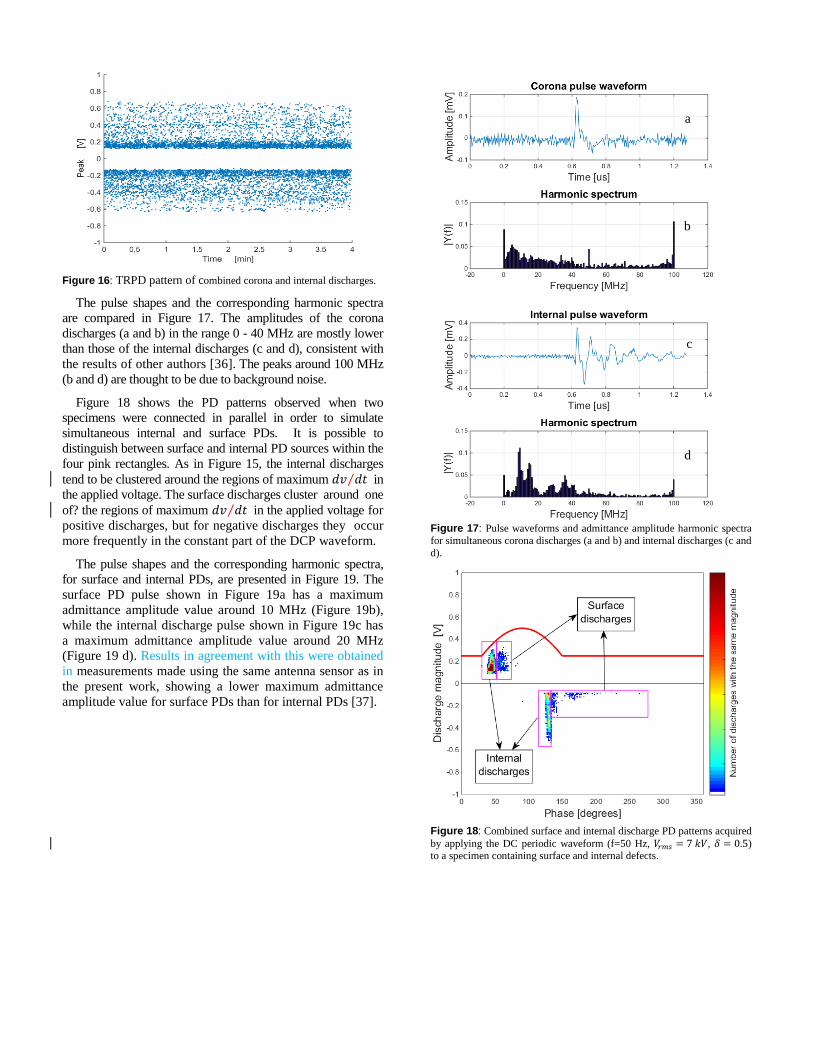
Figure 16: TRPD pattern of combined corona and internal discharges.
The pulse shapes and the corresponding harmonic spectra
are compared in Figure 17. The amplitudes of the corona
discharges (a and b) in the range 0 - 40 MHz are mostly lower
than those of the internal discharges (c and d), consistent with
the results of other authors [36]. The peaks around 100 MHz
(b and d) are thought to be due to background noise.
Figure 18 shows the PD patterns observed when two
specimens were connected in parallel in order to simulate
simultaneous internal and surface PDs. It is possible to
distinguish between surface and internal PD sources within the
four pink rectangles. As in Figure 15, the internal discharges
tend to be clustered around the regions of maximum 𝑑𝑣 𝑑𝑡 ⁄ in
the applied voltage. The surface discharges cluster around one
of? the regions of maximum 𝑑𝑣 𝑑𝑡 ⁄ in the applied voltage for
positive discharges, but for negative discharges they occur
more frequently in the constant part of the DCP waveform.
The pulse shapes and the corresponding harmonic spectra,
for surface and internal PDs, are presented in Figure 19. The
surface PD pulse shown in Figure 19a has a maximum
admittance amplitude value around 10 MHz (Figure 19b),
while the internal discharge pulse shown in Figure 19c has
a maximum admittance amplitude value around 20 MHz
(Figure 19 d). Results in agreement with this were obtained
in measurements made using the same antenna sensor as in
the present work, showing a lower maximum admittance
amplitude value for surface PDs than for internal PDs [37].
Figure 17: Pulse waveforms and admittance amplitude harmonic spectra
for simultaneous corona discharges (a and b) and internal discharges (c and
d).
Figure 18: Combined surface and internal discharge PD patterns acquired
by applying the DC periodic waveform (f=50 Hz, 𝑉𝑟𝑚𝑠 = 7 𝑘𝑉, 𝛿 = 0.5) to a specimen containing surface and internal defects.
a
b
c
d

Figure 19: Pulse waveforms and admittance amplitude harmonic spectra
for simultaneous surface discharges (a and b) and internal discharges (c
and d), observed on two specimens connected in parallel.
5 CONCLUSION
In this article a new test procedure for partial discharge
detection under DC voltage has been proposed. The
experimental results show that the direct current periodic
waveform overcomes some of the measurement problems
associated with "pure" DC. Consequently we suggest that this
procedure could be a suitable starting point for the
development of PD measurements under DC conditions.
Further work is certainly needed, e.g., measurement of
PDIVs and repetition rates in other dielectric materials, and
comparison of space charge profiles obtained under classic
HVDC waveforms and under the continuous periodic DC
waveforms proposed in this work. In addition a test setup
operating over a range of frequencies, and capable of applying
continuous voltage waveforms with magnitudes up to several
hundred kV, needs to be developed.
ACKNOWLEDGMENTS
The authors would like to thank the Electric Power
Engineering Division of the Chalmers University of
Technology, Goteborg, Sweden, and in particular Amir
Parastar, for their contribution to the design of the converter
required to generate the voltage waveform shown in the
paper. They also thank Professor Robert Fleming for
editorial assistance.
REFERENCES
[1] U. Astrom, L. Weimers, V. Lescale, and G. Asplund,
“Power transmission with HVDC at voltages above 600
kV,” in 2005 IEEE/PES Transmission & Distribution
Conference & Exposition:Asia and Pacific, 2005, pp.1–7.
[2] G. Mazzanti; M. Marzinotto, "Improved Design of
HVDC Extruded Cable Systems," in Extruded Cables
for High-Voltage Direct-Current Transmission:
Advances in Research and Development, 1, Wiley-IEEE
Press, 2013, pp.384-doi: 10.1002/9781118590423.ch05.
[3] M. Mammeri and B. Dhuicq, “Challenges of extruded
cable for HVAC and HVDC power transmission,” in
PowerTech (POWERTECH), 2013 IEEE Grenoble,
2013, pp. 1–8.
[4] J. C. Fothergill, “The coming of Age of HVDC extruded
power cables,” in 2014 IEEE Electrical Insulation
Conference (EIC), 2014, pp. 124–137.
[5] P. Morshuis, A. Cavallini, D. Fabiani, G. C. Montanari,
and C. Azcarraga, “Stress conditions in HVDC
equipment and routes to in service failure,” IEEE
Transactions on Dielectrics and Electrical Insulation,
vol. 22, no. 1, pp. 81–91, 2015.
[6] IEC 60270:2000+AMD1:2015 CSV, High-voltage test
techniques - Partial discharge measurements.
[7] P. H. Morshuis and J. J. Smit, “Partial discharges at DC
voltage: their mechanism, detection and analysis,” IEEE
Transactions on Dielectrics and Electrical Insulation,
vol. 12, no. 2, pp. 328–340, 2005.
[8] E. Gulski, "Digital analysis of partial discharges," in
IEEE Transactions on Dielectrics and Electrical
Insulation, vol. 2, no. 5, pp. 822-837, Oct 1995. doi:
10.1109/94.469977.
[9] U. Fromm, “Interpretation of partial discharges at DC
voltages,” IEEE transactions on Dielectrics and
Electrical Insulation, vol. 2, no. 5, pp. 761–770, 1995.
[10] H. Niu, A. Cavallini, and G. Montanari, “Identification
of partial discharge phenomena in HVDC apparatus,” in
Electrical Insulation, 2008. ISEI 2008. Conference
Record of the 2008 IEEE International Symposium on,
2008, pp. 373–376.
[11] A. Cavallini, G. C. Montanari, M. Tozzi and X. Chen,
"Diagnostic of HVDC systems using partial discharges,"
in IEEE Transactions on Dielectrics and Electrical
Insulation, vol. 18, no. 1, pp. 275-284, February 2011.
[12] M. Rahimi, R. Javadinezhad, and M. Vakilian, “DC
partial discharge characteristics for corona, surface and
void discharges,” in 2015 IEEE 11th International
Conference on the Properties and Applications of
Dielectric Materials (ICPADM), 2015, pp. 260–263.
[13]I. J. Seo, U. A. Khan, J. S. Hwang, J. G. Lee and J. Y.
Koo, "Identification of Insulation Defects Based on
Chaotic Analysis of Partial Discharge in HVDC
Superconducting Cable," in IEEE Transactions on
Applied Superconductivity, vol. 25, no. 3, pp. 1-5, June
2015.doi: 10.1109/TASC.2015.2394245.
a
b
c
d

[14]A. Pirker and U. Schichler, "Partial discharges at DC
voltage - measurement and pattern recognition," 2016
International Conference on Condition Monitoring and
Diagnosis (CMD), Xi'an, China, 25-28 Sept. 2016, pp.
287-290, doi: 10.1109/CMD.2016.7757811
[15]H. Niu, A. Cavallini, G. Montanari, and Y. Zhang,
“Noise rejection strategy and experimental research on
partial discharge at DC voltage,” in 2009 IEEE 9th
International Conference on the Properties and
Applications of Dielectric Materials, 2009, pp. 489–
492.
[16]E. Corr, W. Siew, and W. Zhao, “PD Activity in Void
Type Dielectric Samples for Varied DC Polarity.” 2016
IEEE Conference on Electrical Insulation and
Dielectric Phenomena (CEIDP), Toronto, ON, 2016,
pp. 510-513. doi: 10.1109/CEIDP.2016.7785616
[17] R. Aldrian, G. C. Montanari, A. Cavallini and
Suwarno, "Signal separation and identification of partial
discharge in XLPE insulation under DC voltage," 2017
1st International Conference on Electrical Materials
and Power Equipment (ICEMPE), Xi'an, 2017, pp. 53-
56. doi: 10.1109/ICEMPE.2017.7982098
[18] CIGRE TB 496 Brochure CIGR_E 496.
Recommendations for Testing DC Extruded Cable
Systems for Power Transmission at a Rated Voltage up
to 500 kV. Prepared by CIGR_E Working Group B1–
32, April 2012.
[19] IEC IEC 62067. “Power Cables with Extruded
Insulation and Their Accessories for Rated Voltages
above 150 kV (Um 1/4 170 kV) up to 500 kV (Um 1/4
550 kV)—Test Method and Requirements.” Second
edition, November 2011.
[20] Electra n. 189. “Recommendations for Tests of Power
Transmission DC Cables for a Rated Voltage up to 800
kV (ELECTRA 72, 1980—Revision). 2000.
[21]Candela R., Di Stefano A., Fiscelli G., Giaconia G.C.,
“Portable Partial Discharge Detection Device”, Patent
EP2297589/ WO2009150627, 11 June 2009.
[22]Candela R., Contin A., “A portable instrument for the
location and identification of defects generating PD”, In
Electrical Insulation Conference (EIC), Annapolis,
Maryland, 5-8 June 2011, IEEE, pp. 469-473.
[23]Z. Lei, J. Song, M. Tian, X. Cui, C. Li and M. Wen,
"Partial discharges of cavities in ethylene propylene
rubber insulation," in IEEE Transactions on Dielectrics
and Electrical Insulation, vol. 21, no. 4, pp. 1647-1659,
August 2014.
[24]S. Whitehead, Dielectric Breakdown of Solids,
Clarendon Press Oxford, 1951.
[25]C. Zhou and G. Chen, "Space charge behaviours in
polyethylene under combined AC and DC electric
fields," 2014 IEEE Conference on Electrical Insulation
and Dielectric Phenomena (CEIDP), Des Moines, IA,
2014, pp. 848-851. doi: 10.1109/CEIDP.2014.6995787
[26]R. Bartnikas, "Partial discharges. Their mechanism,
detection and measurement," IEEE Transactions on
Dielectrics and Electrical Insulation, vol. 9, no. 5, pp.
763-808, Oct 2002. doi: 10.1109/TDEI.2002.1038663
[27]M. Florkowski, B. Florkowska and P. Zydron, "Partial
discharge echo obtained by chopped sequence," in IEEE
Transactions on Dielectrics and Electrical Insulation,
vol. 23, no. 3, pp. 1294-1302, June 2016. doi:
10.1109/TDEI.2015.005487.
[28] R. Schifani, R. Candela and P. Romano, "On PD
mechanisms at high temperature in voids included in an
epoxy resin," in IEEE Transactions on Dielectrics and
Electrical Insulation, vol. 8, no. 4, pp. 589-597, Aug
2001. doi: 10.1109/94.946711.
[29]P. Romano, R. Candela, A. Imburgia, G. Presti, E. R.
Sanseverino and F. Viola, "A new technique for partial
discharges measurement under DC periodic stress,"2017
IEEE Conference on Electrical Insulation and
Dielectric Phenomenon (CEIDP), Fort Worth, TX,
2017, pp. 303-306.
[30]N. Haque, S. Dalai, B. Chatterjee and S. Chakravorti,
"Investigations on charge trapping and de-trapping
properties of polymeric insulators through discharge
current measurements," in IEEE Transactions on
Dielectrics and Electrical Insulation, vol. 24, no. 1, pp.
583-591, Feb. 2017.
[31]R. Candela, G. Mirelli, and R. Schifani, “PD
recognition by means of statistical and fractal
parameters and a neural network,” IEEE Transactions
on Dielectrics and electrical Insulation, vol. 7, no. 1,
pp. 87–94, 2000.
[32]R. Schifani and R. Candela, “A new algorithm for
mixed Weibull analysis of partial discharge amplitude
distributions,” IEEE transactions on dielectrics and
electrical insulation, vol. 6, no. 2, pp. 242–249, 1999.
[33]R. Candela, R. Schifani, B. Cerutti, and F. Guastavino,
“Identification and separation of multiple and
concurrent partial discharge phenomena,” in Electrical
Insulation and Dielectric Phenomena, 2000 Annual
Report Conference on, 2000, vol. 2, pp. 665–669.
[34]R. Candela and P. Romano, “An improved MSD-based
method for PD pattern recognition,” in 2007 Annual
Report-Conference on Electrical Insulation and
Dielectric Phenomena, 2007, pp. 204–207.
[35] A. Krivda, "Automated recognition of partial
discharges," in IEEE Transactions on Dielectrics and
Electrical Insulation, vol. 2, no. 5, pp. 796-821, Oct
1995. doi: 10.1109/94.469976.
[36] Xiaohua Li, Guangning Wu, Xueqin Zhang and
Shanshan Bian, "Partial discharge pulse shape detection
and analysis under DC condition in typical defect
models," 2007 Annual Report - Conference on
Electrical Insulation and Dielectric Phenomena,
Vancouver, BC, 2007, pp. 188-191. doi:
10.1109/CEIDP.2007.4451593.
[37] P. Romano, T. Hammarström, T. Bengtsson, A.
Imburgia, A. Madonia, F. Viola, S. M. Gubanski,
“Partial Discharges at Different Voltage Waveshapes:
Comparison between two different acquisition systems”
IEEE Transactions on Dielectrics and electrical
Insulation, vol. 26, no. 2, pp.584-593, April 2018. doi:
10.1109/TDEI.2018.006782

Pietro Romano (M'14-SM’17) received the MSc.
and Ph.D. degrees in Electrical Engineering from
University of Palermo, Italy, in 1993 and 1998
respectively. From 1998 to 2001 he worked at CRES
Centre of Electronic Research in Sicily on partial discharge measurement research. Since 2001 he has
been a researcher in the DEIM Department of the
University of Palermo, and teaches Basic Electrical Engineering, Electrotechnics and insulating materials. His research activity
is mainly in the field of insulating systems diagnosis, partial discharge
measurements, HV Systems, multifactor stress effects and electric field simulations, and partially-shaded PV Systems. He is the head of the
L.E.PR.E. HV laboratory of Palermo University.
Antonino Imburgia was born in Palermo, Italy, on 28 April 1987. He received the M.Sc. degree in electrical
engineering from the University of Palermo in 2014.
Since 2015 he has been a Ph.D. student in the DEIM Department of the University of Palermo. His current
research is in the field of HVDC, distribution of space
charge in solid dielectrics and its behavior, dielectrics and electrical insulating systems diagnosis, space
charge and partial discharge measurements.
Giuseppe Presti was born in Palermo, Italy, on 14 May 1988. He received the M.Sc. degree in Electrical
Engineering from the University of Palermo in 2016.
During his academic career he analyzed problems related to insulating materials, and partial discharge
physics and measurements. His thesis research was concerned with partial discharge detection in solid
dielectrics diagnostic under DC voltage.
Roberto Candela has conducted research in the dielectric laboratory of the University of Palermo since
1995, in the partial discharge field, with particular
reference to the development of equipment and software aimed at the analysis and measurement of partial
discharge in solid insulation. From 2001 he has been a
researcher in the DEIM Department of the University of Palermo, and teaches electrotechnics and insulating materials. Since 2012
he has been CEO of Prysmian Electronics, part of Prysmian Group.