Embed Size (px)
Citation preview

A&A 385, 67–86 (2002)DOI: 10.1051/0004-6361:20011771c© ESO 2002
Astronomy&
Astrophysics
A new, cleaner colour-magnitude diagram for the metal-richglobular cluster NGC 6528?,??
Velocity dispersion in the Bulge, age and proper motion of NGC 6528
S. Feltzing1 and R. A. Johnson2,???
1 Lund Observatory, Box 43, 221 00 Lund, Sweden2 Institute of Astronomy, Madingley Road, CB3 0HA Cambridge, UK
e-mail: [email protected]
Received 20 July 2001 / Accepted 11 December 2001
Abstract. Using two epochs of HST/WFPC2 images of the metal-rich globular cluster NGC 6528 we derivethe proper motions of the stars and use them to separate the stars belonging to NGC 6528 from those of theGalactic bulge. The stellar sequences in the resulting colour-magnitude diagram for the cluster are significantlybetter determined than in previously published data. From comparison of the colour-magnitude diagram with thefiducial line for NGC 6553 from Zoccali et al. (2001) we conclude that the two globular clusters have the sameage. Further, using α-enhanced stellar isochrones, NGC 6528 is found to have an age of 11 ± 2 Gyr. This fittingof isochrones also give that the cluster is 7.2 kpc away from us. From the measured velocities both the propermotion of the cluster and the velocity dispersion in the Galactic bulge are found. NGC 6528 is found to have aproper motion relative to the Galactic bulge of < µl > = 0.006 and < µb > = 0.044 arcsec per century. Usingstars with ∼14 < V555 < 19 (i.e. the red giant branch and horizontal branch) we find, for the Galactic bulge,σl = 0.33 ± 0.03 and σb = 0.25 ± 0.02 arcsec per century. This give σl/σb = 1.32 ± 0.16, consistent both withprevious proper motion studies of K giants in the Galactic bulge as well as with predictions by models of thekinematics of bulge stars.
Key words. Galaxy: globular clusters: individual: NGC 6528 – Galaxy: bulge – Galaxy: kinematics and dynamics
1. Introduction
NGC 6528 is perhaps the most metal-rich globular clus-ter known and several studies have therefore targeted thiscluster, e.g. Ortolani et al. (1992), Ortolani et al. (1995),Richtler et al. (1998), Cohen & Sleeper (1995), Heitch &Richtler (1999), Carretta et al. (2001). It has also beenused as a reference in studies of other clusters, e.g. Davidge(2000). We summarize important literature measurementsof NGC 6528 in Table 1.
Send offprint requests to: S. Feltzing,e-mail: [email protected]? Based on observations with the NASA/ESA Hubble Space
Telescope, obtained at the Space Telescope Science Institute,which is operated by the Association of Universities forResearch in Astronomy, Inc. under NASA contract No. NAS5-26555.?? Tables A1, A2 and A3 are only available in electronicform at the CDS via anonymous ftp to cdsarc.u-strasbg.fr
(130.79.128.5) or viahttp://cdsweb.u-strasbg.fr/cgi-bin/qcat?J/A+A/385/67??? Present adress: ESO, Alonso de Cordova, Vitacura 3107,Santiago, Chile
NGC 6528 is at (l, b) = (1.14,−4.12), i.e. in the planeof the Galactic disk and towards the Galactic bulge. Thefirst effect of this is that it is heavily reddened by fore-ground dust, Ortolani et al. (1992), Richtler et al. (1998),Heitsch & Richtler (1999). Most recent distance estimatesput the cluster within less than 1 kpc from the Galacticcentre (e.g. Richtler et al. 1998 and references therein).The close proximity to bulge stars further complicates theinterpretation of the colour-magnitude diagram. Since thebulge stars and the cluster stars have roughly the samedistance modulus they are superimposed in the colour-magnitude diagram. This effect has been noted to be par-ticularly pronounced in the red giant branch (Richtleret al. 1998).
In a pre-study we noted in particular that the colour-magnitude diagram of the globular cluster NGC 6528closely resembled that of NGC 5927 if the latter was su-perimposed on the colour-magnitude diagram of Baade’swindow (for a set of representative colour-magnitude di-agrams see Feltzing & Gilmore 2000). This is consistentwith the cluster being virtually inside the Galactic bulgeand thus having a large contribution of bulge stars in itscolour-magnitude diagram. Moreover, if the cluster is as
Article published by EDP Sciences and available at http://www.aanda.org or http://dx.doi.org/10.1051/0004-6361:20011771

68 S. Feltzing and R. A. Johnson: A new colour-magnitude diagram for NGC 6528
Table 1. Data for NGC 6528 compiled from the literature.
Value Ref. Comment
Core radius 0.′09 Harris (1996)
Distance 7.5 kpc Ortolani et al. (1992)
∆(m−M) 16.4 Zinn (1980) 19.1 kpc
14.35 Ferraro et al. (1999)
15.15 ± 0.24 Heitsch & Richtler (1999) isochrone fitting
[Fe/H] +0.01 Zinn (1980)
+0.29 Bica & Patoriza (1983)
+0.12 Zinn & West (1984)
−0.23 Armandroff & Zinn (1988) Integrated spectra IR Ca ii
high, sim to NGC 6553 Ortolani et al. (1992)
−0.23 Origlia et al. (1997) IR abs. at 1.6 µm
+0.07 ± 0.1? Carretta et al. (2001)
[M/H] +0.1/−0.4 Richtler et al. (1998) Trippico isochrone/Bertelli isochrone
−0.31 Ferraro et al. (1999)
0.00 Heitsch & Richtler (1999)
Z Z� Bruzual et al. (1997)
Age 14 Gyr Ortolani et al. (1992) metallicity comparable to solar
12± 2 Gyr Bruzual et al. (1997)
E(B − V ) 0.56 Zinn (1980)
0.55 Ortolani et al. (1992) NGC 6553 as reference and ∆(m−M)V = 14.39
0.62 Bruzual et al. (1997)
0.62 Ferraro et al. (1999)
E(V − I) 0.8/0.6 Richtler et al. (1998) Trippico isochrone/Bertelli isochrone
0.46 ± 0.03 Heitsch & Richtler (1999) isochrone fitting
metal-rich as indicated in previous studies (and now con-firmed by Carretta et al. 2001) then the red-giant branchas well as both the turn-off and the horizontal branchof the bulge and globular cluster will appear at virtuallythe same magnitudes and colours. The bulge stars will bemore spread out in the colour-magnitude diagram thanthose in the cluster, due to the large range of metallici-ties and ages present in the bulge (e.g. McWilliam & Rich1994; Feltzing & Gilmore 2000). Thus the only way to ob-tain a clean colour-magnitude diagram for the cluster is toobtain proper motions of the cluster stars relative to thebulge stars and separate the two populations using theirproper motions.
This conclusion prompted us to apply for HST time toobtain a second epoch of observations of NGC 6528 withWFPC2 in order to derive the relative proper motion ofthe cluster as compared to that of the Galactic bulge.
We report here on the results from this proper motionstudy. The article is organized as follows; Sect. 2 presentsthe data, derivation of photometry and proper motionsare discussed in Sects. 3 and 4, Sects. 5 and 6 contain anextensive discussion of mean proper motions and velocitydispersions for NGC 6528 relative to the Galactic bulge aswell as the velocity dispersion in the bulge itself, in Sect. 7we use the proper motion information to obtain a cleancolour-magnitude diagram for NGC 6528, Sect. 8 contains
Table 2. NGC 6528 HST/WFPC2 observations used in thisstudy.
GO Filter Exp. time (s)
5436 F555W 2× 100 1× 55436 F814W 2× 50 1× 148696 F555W 8× 100 1× 58696 F814W 2× 50
a discussion of the age for the cluster, and finally Sect. 9provides a brief discussion and conclusions.
2. The data
The data consist of two sets of observations, one fromthe HST archive and observed in 1994 (GO 5436) andthe other our new data for the same field (GO 8696, PIFeltzing). We detail the number of exposures in each filterand epoch as well as integration times in Table 2. The firstdata set was taken on the 27 February 1994 and the newone (GO 8696) on the 1 April 2000. This gives a time spanof 6.093 years between the two set of observations.
The first epoch of observations provided a long anda short set of exposures in F555W and F814W with the

S. Feltzing and R. A. Johnson: A new colour-magnitude diagram for NGC 6528 69
cluster centre on WF3. Our new observations were ob-served with the same WFPC2 orientation, but with fourtimes as long total exposure time in F555W. The increasedexposure times enable us to reliably detect all the possiblestellar sources in the first epoch data.
A new pair of F814W images were also taken in or-der to improve the accuracy of the F814W magnitudes.Finally, one short exposure in F555W was also obtainedin order to find the proper motions of the brightest starsin the field which are saturated in the longest exposures.
The images for each filter/epoch combination werecombined using the drizzle and crrej tasks in thestsdas environment within iraf
1. Drizzling removes theWFPC2 geometric distortion from the images.
For the first epoch data we combined the F555W andF814W images into one single image to obtain as deep animage as possible for object centering.
3. Stellar photometry
Stellar photometry was done inside thedigiphot.daophot package in iraf. In particularwe found the stars using daofind on the deep, newF555W images, then aperture and psf-photometry wereobtained using phot and allstar on the same images.For the aperture photometry we used an aperture of2 pixels. For the psf-photometry psfs variable over thechips, constructed from the images themselves, were usedand the output statistics, i.e. χ and sharpness, were usedto weed out non-stellar sources.
This created a list of stars that were then used for ob-taining aperture photometry from the new F814W images,which together with the F555W data gave a first colour-magnitude diagram. The positions of the stars making upthe colour-magnitude diagram provided our source list ofobjects to find proper motions for.
For the images with short exposures we performedaperture photometry on the first epoch images for eachfilter and then merged the F555W and F814W data intoa colour-magnitude diagram. Keeping only stars detectedin both F555W and F814W this provided a master list forbright objects to find the proper motions for in the shortexposures.
The final colour-magnitude diagrams are all based onthe aperture photometry.
3.1. Calibration
We obtained instrumental (−2.5 log(counts/s),) magni-tudes from both the old, short and new, long ex-posure data. These magnitudes were corrected to theHST/WFPC2 magnitude system, and merged to form afinal single photometry set as described below.
1 IRAF is distributed by National Optical AstronomyObservatories, operated by the Association of Universities forResearch in Astronomy, Inc., under contract with the NationalScience Foundation, USA.
Table 3. Values of constants found for aperture correction ineach image, see Sect. 3.1.
F555W F814Wa b a b
Short
WF2 0.17 1.70e-4 0.21 1.78e-4WF3 0.21 1.47e-4 0.23 1.90e-4WF4 0.27 2.21e-4 0.23 1.59e-4
Long
WF2 0.24 5.42e-5 0.27 4.35e-5WF3 0.24 2.16e-4 0.28 1.84e-4WF4 0.24 1.17e-4 0.23 1.07e-4
The final stellar magnitudes within the HST/WFPC2system i.e. V555 and I814, were obtained by applying anumber of corrections to the instrumental magnitudes, es-sentially following Holtzmann et al. (1995b).
The photometry was obtained from drizzled images.The drizzling procedure removes the geometric distortionfrom the images, therefore no geometric distortion correc-tion was required for the photometry.
Aperture corrections to a 0.5 arcsec aperture were ob-tained from our own images. These corrections were al-lowed to vary with distance from the centre of the chipi.e. correction = a + b×distance The values of the con-stants a and b are given in Table 3. For the WF4 longdata there were not enough stars to obtain both a and bfrom our data. In this case we used the value of b fromGonzaga et al. (1999) and only fit the value of a from ourdata. Corrections for the charge transfer (in)efficiency(CTE) were applied. The short data were obtained beforethe WFPC2 cool-down on 23/4/1994. The CTE problemis worse for the pre-cool-down data, but the correctionsare not well modeled. For these data the CTE problemwas corrected by assuming that the star counts lost werea linear function of the y-position on the chip, with stars atthe top of the chip losing the maximum 10% (Holtzmann1995b). For our new long data we used the equations inWhitmore et al. (1999) to correct for CTE.
The zero-points used to transform to HST/WFPC2magnitudes are from Baggett et al. (1997).
3.2. Merging long and short photometry
To make the final colour magnitude diagrams we havemerged the photometry from the long and short exposures.We compared the magnitudes of the same stars from theshort and long exposure data, and found no evidence forany offsets. Further, we found that the long exposure datawere saturated for V555 < 16.8 and I814 < 15.

70 S. Feltzing and R. A. Johnson: A new colour-magnitude diagram for NGC 6528
Fig. 1. Colour-magnitude diagram for all three WF. All stars measured in both the new and old images and which satisfiedthe cuts imposed in χ and sharpness variables (see Sect. 3) on the individual WFs are included. Stars with fitting errors areexcluded.
The two sets of long and short photometry were thenmerged according to the following rules
– if the star has both long and short photometry thenuse long if V555 > 16.8 and I814 > 15, otherwise useshort;
– if the star just has short photometry then use it ifV555 ≤ 16.8 or I814 ≤ 15;
– if the star just has long photometry then use it ifV555 > 16.8 and I814 > 15.
Our final colour-magnitude diagram is shown in Fig. 1.This includes all stars selected according to our selectioncriteria for χ and sharpness. We also require the stars to allhave good positions according to the photometric routinesin daophot. No corrections for differential reddening havebeen applied.
4. Proper motions
The heart of this investigation is to use the measuredproper motions to separate out the bulge and cluster stars.
Our chosen method to find the proper motion for each starconsists of the following steps:
1. find the transformation, x- and y-shifts as well as ro-tation (small in our case), between the two epochs ofobservations using a small number of bright stars;
2. transform the positions on the new images (the deepdrizzled F555W images in our case) to the referenceframe of the old images;
3. re-center the transformed positions on the old image(in our case we used the deep image combined fromboth filters for this);
4. inspect the x- and y-shifts found in the re-centering,select only stars that have small shifts relative to thecentre of the distribution of shifts;
5. using only those stars selected in the previous item finda new, improved transformation between the epochs;
6. apply the new solution and re-center the stars on theold image;
7. if deemed necessary iterate.
S. Feltzing and R. A. Johnson: A new colour-magnitude diagram for NGC 6528 71
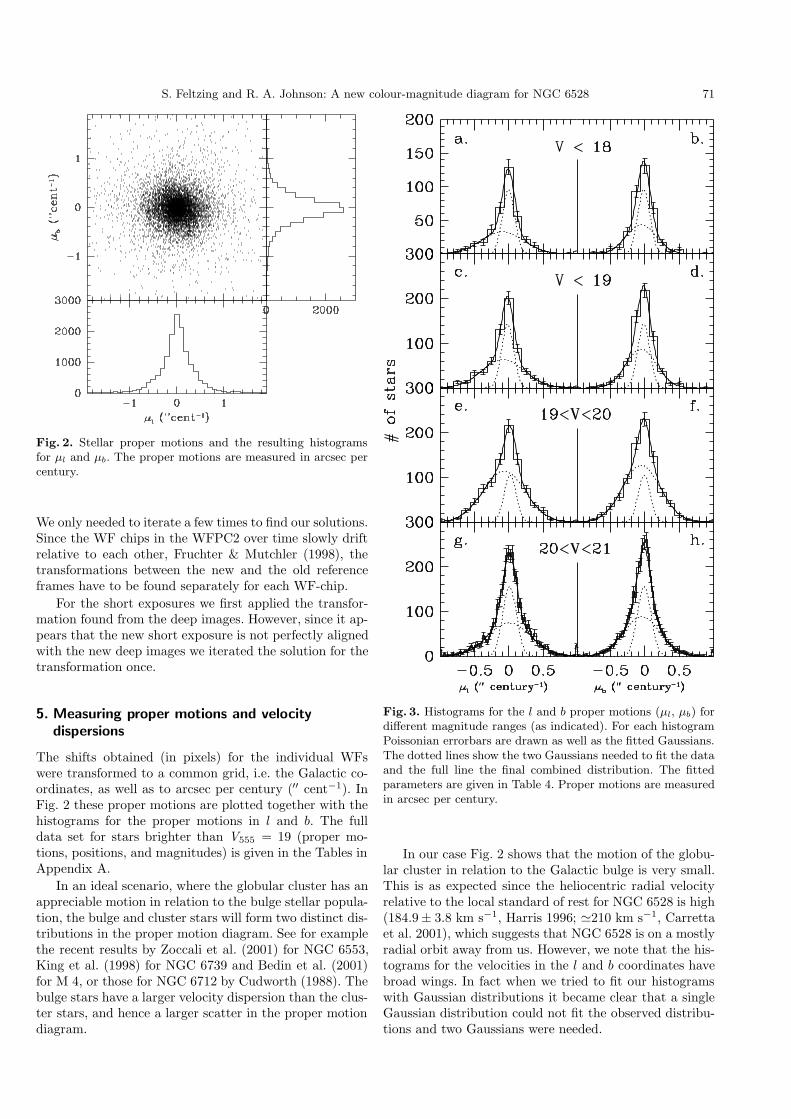
Fig. 2. Stellar proper motions and the resulting histogramsfor µl and µb. The proper motions are measured in arcsec percentury.
We only needed to iterate a few times to find our solutions.Since the WF chips in the WFPC2 over time slowly driftrelative to each other, Fruchter & Mutchler (1998), thetransformations between the new and the old referenceframes have to be found separately for each WF-chip.
For the short exposures we first applied the transfor-mation found from the deep images. However, since it ap-pears that the new short exposure is not perfectly alignedwith the new deep images we iterated the solution for thetransformation once.
5. Measuring proper motions and velocitydispersions
The shifts obtained (in pixels) for the individual WFswere transformed to a common grid, i.e. the Galactic co-ordinates, as well as to arcsec per century (′′ cent−1). InFig. 2 these proper motions are plotted together with thehistograms for the proper motions in l and b. The fulldata set for stars brighter than V555 = 19 (proper mo-tions, positions, and magnitudes) is given in the Tables inAppendix A.
In an ideal scenario, where the globular cluster has anappreciable motion in relation to the bulge stellar popula-tion, the bulge and cluster stars will form two distinct dis-tributions in the proper motion diagram. See for examplethe recent results by Zoccali et al. (2001) for NGC 6553,King et al. (1998) for NGC 6739 and Bedin et al. (2001)for M 4, or those for NGC 6712 by Cudworth (1988). Thebulge stars have a larger velocity dispersion than the clus-ter stars, and hence a larger scatter in the proper motiondiagram.
Fig. 3. Histograms for the l and b proper motions (µl, µb) fordifferent magnitude ranges (as indicated). For each histogramPoissonian errorbars are drawn as well as the fitted Gaussians.The dotted lines show the two Gaussians needed to fit the dataand the full line the final combined distribution. The fittedparameters are given in Table 4. Proper motions are measuredin arcsec per century.
In our case Fig. 2 shows that the motion of the globu-lar cluster in relation to the Galactic bulge is very small.This is as expected since the heliocentric radial velocityrelative to the local standard of rest for NGC 6528 is high(184.9± 3.8 km s−1, Harris 1996; '210 km s−1, Carrettaet al. 2001), which suggests that NGC 6528 is on a mostlyradial orbit away from us. However, we note that the his-tograms for the velocities in the l and b coordinates havebroad wings. In fact when we tried to fit our histogramswith Gaussian distributions it became clear that a singleGaussian distribution could not fit the observed distribu-tions and two Gaussians were needed.

72 S. Feltzing and R. A. Johnson: A new colour-magnitude diagram for NGC 6528
Table 4. Gaussian fits to proper motion distributions in Fig. 3. An error of 0. indicates that that particular parameter waskept fixed during the fitting procedure. We give the amplitude, the center (< µ >), and the σ for two Gaussians (shown withdotted lines in Fig. 3). Both are in arcsec per century. The first fours rows give the results for the l-coordinate and the last forfor the b-coordinate.
Galactic l Field Cluster
mag. range Amp1 < µ1 > σ1 Amp2 < µ2 > σ2
(arcsec century−1) (arcsec century −1)
V < 18 32.783 ± 5.990 –0.097 ± 0.027 0.305 ± 0.025 95.539 ± 11.934 –0.005 ± 0.010 0.088 ± 0.011
V < 19 63.362 ± 7.231 –0.084 ± 0.017 0.306 ± 0.012 142.831 ± 14.992 –0.018 ± 0.009 0.088 ± 0.009
19 ≤ V < 20 114.083 ± 9.793 –0.072 ± 0.013 0.305 ± 0.009 105.318 ± 16.496 0.017 ± 0.014 0.087 ± 0.015
20 ≤ V < 21 74.461 ± 4.957 0.004 ± 0.008 0.309 ± 0.007 155.211 ± 7.769 0.010 ± 0.005 0.099 ± 0.006
Galactic b Field Cluster
V < 18 43.627 ± 5.509 –0.052 ± 0.018 0.214 ± 0.014 95.539 ± 0. –0.014 ± 0.012 0.088 ± 0.
V < 19 86.681 ± 7.088 –0.051 ± 0.013 0.221 ± 0.009 142.831 ± 0. –0.015 ± 0.010 0.088 ± 0.
19 ≤ V < 20 126.907 ± 6.433 –0.050 ± 0.011 0.273 ± 0.007 105.318 ± 0. –0.009 ± 0.015 0.088 ± 0.
20 ≤ V < 21 87.990 ± 3.073 –0.044 ± 0.007 0.265 ± 0.004 155.211 ± 0. –0.010 ± 0.005 0.099 ± 0.
To separate the bulge and cluster stars using the mea-sured proper motions, we divide the stars into differentmagnitude ranges and find the best fitting Gaussians, asshown in Fig. 3. We found that two Gaussians were re-quired to fit the data well, indicating that, as expected, wehave two stellar populations with different velocity disper-sions. Based on previous measurements of bulge and clus-ter velocity dispersions, we associate the narrow Gaussianwith NGC 6528 and the broad Gaussian with the bulgestars.
We found that the µl-diagram was easily fit by twoGaussians by our routine, however µb proved more dif-ficult. In fact the fitting routine found one badly fittingbroad Gaussian for the data in Fig. 3. However we expectthe cluster stars to have the same velocity dispersion andamplitude in l and b and so we fixed the parameters forthe narrower Gaussian, which represents the cluster stars,from the fitting of the µl-distribution. In particular wefixed the height and the width but left the position free tobe fitted. The second Gaussian had all three parameters(width, height and position) free for fitting. The resultsfor all the fitted Gaussians are given in Table 4.
We find that all four µl-distributions are fit by twoGaussians, one narrow and with a σl ≈ 0.08 arcsec percentury, and one broader with σl ≈ 0.30 arcsec per cen-tury. The centers of these Gaussians vary with magnituderange, see Table 4. For the broad Gaussian in µl the threebrightest magnitude ranges agree very well within the cal-culated errors while for the last bin the center has movedfrom ∼−0.07 to 0 arcsec per century. For the narrowGaussian the centers for the two brightest magnitudesagree within the errors, as do those for the two faintestmagnitudes.
For µb we fixed the fwhm and height for the narrowGaussian before fitting (see discussion above). Thus bydefinition σb = σl and amplitudeb = amplitudel for eachmagnitude range for the narrow Gaussian. For the broadGaussian we find a σb around 0.21. Unlike the µl distribu-tion, the fitted centres for the broad and narrow Gaussiansin µb remain consistent within the errors for all the mag-nitude bins. The centers for the two Gaussians are foundto be −0.05± 0.01 and −0.012± 0.012 arcsec per century.
The different behaviour of the centers of the µl and µbhistograms with magnitude suggests the presence of a stel-lar component in addition to the bulge and cluster starsthat is adding an additional proper motion component toµl. One possibility for this component is disk stars, whichmay be the main component of the blue plume seen in thecolour-magnitude diagram in Fig. 1. We therefore investi-gate below whether we see any difference in Gaussians fitseparately to blue and red samples.
In Figs. 4 and 5 we divide the two bright magnitudesamples, V555 ≤ 19 and 19 < V555 < 20 into red and bluestars and fit Gaussians to them in the same way as before.The fitted parameters are given in Table 5.
For the blue stars (V555 − I814 < 1.6) in the brightestsample, i.e. V555 < 19, it proved impossible to fit twoGaussians both for µl and µb. Since there are few stars inthese two histograms we have carefully checked that thechosen binning did not effect the final result. The resultsare given in Table 5.
The red samples, on the other hand, show a verystrong central peak and broad wings which means thattwo Gaussians are needed to achieve a good fit. As be-fore we first fitted the µl distribution and then fixed the σand amplitude for the narrow Gaussian when fitting theµb distribution. It is interesting to find that indeed the

S. Feltzing and R. A. Johnson: A new colour-magnitude diagram for NGC 6528 73
Fig. 4. Histograms for the b and l proper motions (µl, µb) for blue, V − I < 1.6, and red, V − I > 1.6, stars all with V555 ≤ 19.For each histogram Possonian errorbars are drawn as well as the fitted Gaussians. For the blue samples only one Gaussian isfitted, while for the red two Gaussians are necessary to fit the data (see text for discussion). The fitted parameters are given inTable 5. Proper motions are measured in arcsec per century.
Fig. 5. Histograms for the b and l proper motions (µl, µb) for blue, V −I < 1.6, and red, V −I > 1.6, stars all with 19 < V555 < 20.For each histogram Possonian errorbars are drawn as well as the fitted Gaussians. For the blue samples only one Gaussian isfitted, while for the red two Gaussians are necessary to fit the data (see text for discussion). The fitted parameters are given inTable 5. Proper motions are measured in arcsec per century.
74 S. Feltzing and R. A. Johnson: A new colour-magnitude diagram for NGC 6528
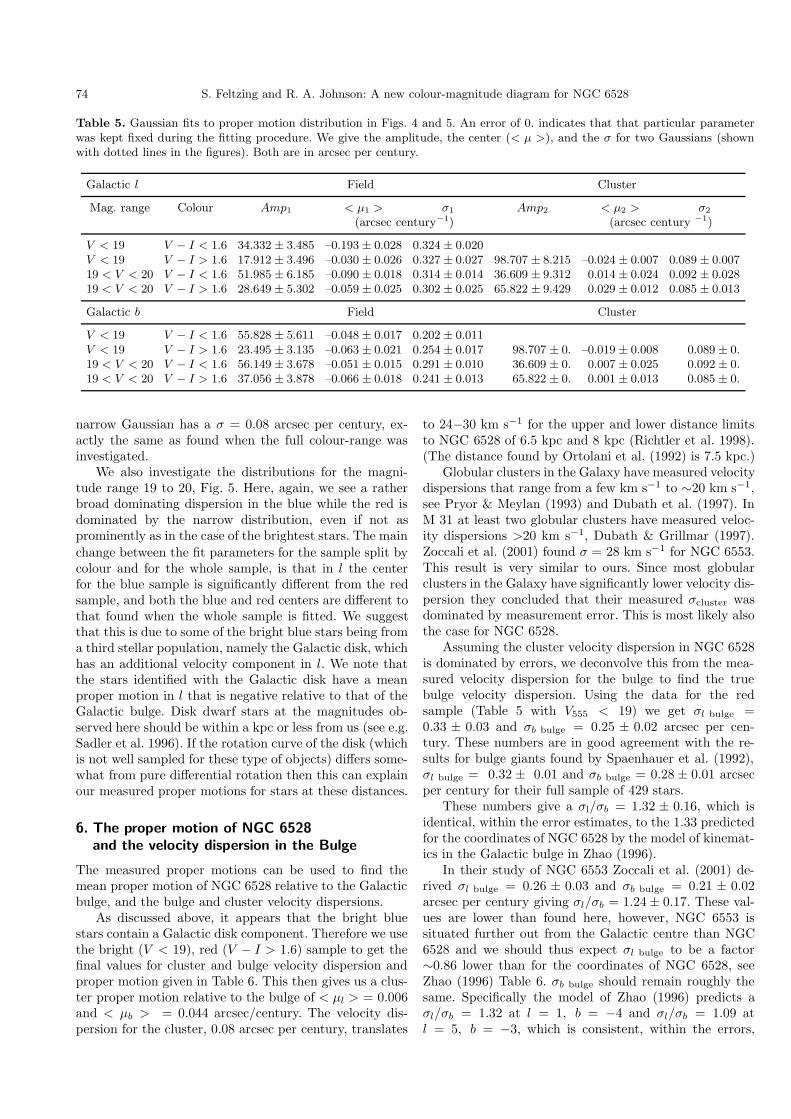
Table 5. Gaussian fits to proper motion distribution in Figs. 4 and 5. An error of 0. indicates that that particular parameterwas kept fixed during the fitting procedure. We give the amplitude, the center (< µ >), and the σ for two Gaussians (shownwith dotted lines in the figures). Both are in arcsec per century.
Galactic l Field Cluster
Mag. range Colour Amp1 < µ1 > σ1 Amp2 < µ2 > σ2
(arcsec century−1) (arcsec century −1)
V < 19 V − I < 1.6 34.332 ± 3.485 –0.193 ± 0.028 0.324 ± 0.020V < 19 V − I > 1.6 17.912 ± 3.496 –0.030 ± 0.026 0.327 ± 0.027 98.707 ± 8.215 –0.024 ± 0.007 0.089 ± 0.00719 < V < 20 V − I < 1.6 51.985 ± 6.185 –0.090 ± 0.018 0.314 ± 0.014 36.609 ± 9.312 0.014 ± 0.024 0.092 ± 0.02819 < V < 20 V − I > 1.6 28.649 ± 5.302 –0.059 ± 0.025 0.302 ± 0.025 65.822 ± 9.429 0.029 ± 0.012 0.085 ± 0.013
Galactic b Field Cluster
V < 19 V − I < 1.6 55.828 ± 5.611 –0.048 ± 0.017 0.202 ± 0.011V < 19 V − I > 1.6 23.495 ± 3.135 –0.063 ± 0.021 0.254 ± 0.017 98.707 ± 0. –0.019 ± 0.008 0.089 ± 0.19 < V < 20 V − I < 1.6 56.149 ± 3.678 –0.051 ± 0.015 0.291 ± 0.010 36.609 ± 0. 0.007 ± 0.025 0.092 ± 0.19 < V < 20 V − I > 1.6 37.056 ± 3.878 –0.066 ± 0.018 0.241 ± 0.013 65.822 ± 0. 0.001 ± 0.013 0.085 ± 0.
narrow Gaussian has a σ = 0.08 arcsec per century, ex-actly the same as found when the full colour-range wasinvestigated.
We also investigate the distributions for the magni-tude range 19 to 20, Fig. 5. Here, again, we see a ratherbroad dominating dispersion in the blue while the red isdominated by the narrow distribution, even if not asprominently as in the case of the brightest stars. The mainchange between the fit parameters for the sample split bycolour and for the whole sample, is that in l the centerfor the blue sample is significantly different from the redsample, and both the blue and red centers are different tothat found when the whole sample is fitted. We suggestthat this is due to some of the bright blue stars being froma third stellar population, namely the Galactic disk, whichhas an additional velocity component in l. We note thatthe stars identified with the Galactic disk have a meanproper motion in l that is negative relative to that of theGalactic bulge. Disk dwarf stars at the magnitudes ob-served here should be within a kpc or less from us (see e.g.Sadler et al. 1996). If the rotation curve of the disk (whichis not well sampled for these type of objects) differs some-what from pure differential rotation then this can explainour measured proper motions for stars at these distances.
6. The proper motion of NGC 6528and the velocity dispersion in the Bulge
The measured proper motions can be used to find themean proper motion of NGC 6528 relative to the Galacticbulge, and the bulge and cluster velocity dispersions.
As discussed above, it appears that the bright bluestars contain a Galactic disk component. Therefore we usethe bright (V < 19), red (V − I > 1.6) sample to get thefinal values for cluster and bulge velocity dispersion andproper motion given in Table 6. This then gives us a clus-ter proper motion relative to the bulge of < µl > = 0.006and < µb > = 0.044 arcsec/century. The velocity dis-persion for the cluster, 0.08 arcsec per century, translates
to 24−30 km s−1 for the upper and lower distance limitsto NGC 6528 of 6.5 kpc and 8 kpc (Richtler et al. 1998).(The distance found by Ortolani et al. (1992) is 7.5 kpc.)
Globular clusters in the Galaxy have measured velocitydispersions that range from a few km s−1 to ∼20 km s−1,see Pryor & Meylan (1993) and Dubath et al. (1997). InM 31 at least two globular clusters have measured veloc-ity dispersions >20 km s−1, Dubath & Grillmar (1997).Zoccali et al. (2001) found σ = 28 km s−1 for NGC 6553.This result is very similar to ours. Since most globularclusters in the Galaxy have significantly lower velocity dis-persion they concluded that their measured σcluster wasdominated by measurement error. This is most likely alsothe case for NGC 6528.
Assuming the cluster velocity dispersion in NGC 6528is dominated by errors, we deconvolve this from the mea-sured velocity dispersion for the bulge to find the truebulge velocity dispersion. Using the data for the redsample (Table 5 with V555 < 19) we get σl bulge =0.33 ± 0.03 and σb bulge = 0.25 ± 0.02 arcsec per cen-tury. These numbers are in good agreement with the re-sults for bulge giants found by Spaenhauer et al. (1992),σl bulge = 0.32 ± 0.01 and σb bulge = 0.28± 0.01 arcsecper century for their full sample of 429 stars.
These numbers give a σl/σb = 1.32 ± 0.16, which isidentical, within the error estimates, to the 1.33 predictedfor the coordinates of NGC 6528 by the model of kinemat-ics in the Galactic bulge in Zhao (1996).
In their study of NGC 6553 Zoccali et al. (2001) de-rived σl bulge = 0.26 ± 0.03 and σb bulge = 0.21 ± 0.02arcsec per century giving σl/σb = 1.24± 0.17. These val-ues are lower than found here, however, NGC 6553 issituated further out from the Galactic centre than NGC6528 and we should thus expect σl bulge to be a factor∼0.86 lower than for the coordinates of NGC 6528, seeZhao (1996) Table 6. σb bulge should remain roughly thesame. Specifically the model of Zhao (1996) predicts aσl/σb = 1.32 at l = 1, b = −4 and σl/σb = 1.09 atl = 5, b = −3, which is consistent, within the errors,

S. Feltzing and R. A. Johnson: A new colour-magnitude diagram for NGC 6528 75
Table 6. Final values for velocity dispersion and mean proper motion. An error of 0. indicates that that particular parameterwas kept fixed during the fitting procedure. All values are in arcsec century−1.
σl σb < µl > < µb >
Bulge 0.327 ± 0.027 0.254 ± 0.017 –0.030 ± 0.026 –0.063 ± 0.021Cluster 0.089 ± 0.007 0.089 ± 0. –0.024 ± 0.007 –0.019 ± 0.008
to the values found here and in Zoccali et al. (2001) forthe bulge stars observed in the fields of NGC 6528 andNGC 6553 (which are situated close to the coordinates forwhich Zhao’s model makes its predictions).
We may thus conclude that these two new studies ofthe proper motions of Galactic bulge stars confirm thepredictions by models of the kinematics in the Galacticbulge. To our knowledge the current work and that ofZoccali et al. (2001) are the first studies to address thevelocity dispersion, measured by proper motions, of bulgestars below the horizontal branch.
We can use the measured proper motions(< µl >=∼+0.006 and < µb >=∼+0.044 arcsec percentury) of the cluster relative to the Galactic bulgealong with a radial velocity of 210 km s−1 (Carretta et al.2001), cluster distance of 7.5 kpc (Ortolani et al. 1992),solar peculiar velocity relative to the local standard ofrest of (u�, v�, w�) = (10, 5.25, 7.17) km s−1 (Dehnen& Binney 1998) and the rotational velocity of the localstandard of rest of 239 km s−1 (Arp 1986) to calculate theabsolute space velocity components of NGC 6528. Theseare (Π, Θ, W ) = (−220, 17.4, 16.1) km s−1 (Π pointsradially outwards from the Galactic centre towards thecluster, Θ is oriented in the direction of Galactic rotation,and W points towards the north Galactic pole, and wehave made the simplifying assumption that the cluster isat (l, b) = (0, 0)).
In an attempt to estimate the internal errors on thederived velocities we varied the proper motions for thecluster according to the errors derived when fitting thehistograms and we find that the Π velocity is unaffected bythe errors while Θ varies between ∼8 and ∼27 km s−1 andW between ∼8 and ∼23 km s−1. These should representmaximal internal errors in our analysis and thus we canconclude that the velocities derived are fairly robust.
7. The colour-magnitude diagram and the propermotions
Our new colour-magnitude diagram is presented in Fig. 1.It contains all the photometry from both long and shortexposures, as described in Sect. 3.
Clearly visible is the stubby red horizontal branch. Thered giant bump, roughly 0.5 mags below the horizontalbranch is less easily isolated but appears to be present.To the left a “plume” of field stars and/or blue stragglersin the cluster stretches up from the turn-off region. Theturn-off region itself is identifiable but appears confused.The exact position of the sub-giant branch is difficult to es-tablish since it is contaminated with field stars from both
the disk and bulge. The red-giant branch rises rather ver-tically but then appear to turn-over heavily to the red.The red-giant branch itself is very wide. This could bean indication of differential reddening and/or large con-tamination from bulge stars roughly at the same distancemodulus as NGC 6528 but with a spread in both age andmetallicity.
The question now is whether the broad red giantbranch and the fuzzy sub-giant branch are mainly theresult of differential reddening, see e.g. Ortolani et al.(1992), or are primarily caused by contamination of thecolour-magnitude diagram by bulge stars (Richtler et al.1998).
7.1. Applying the proper motions to isolate the cluster
The idea is now to use the proper motions to separatethe cluster and bulge stars. There are at least two inter-esting points here. The first is to know how well we can“decontaminate” the red giant branch of NGC 6528 frombulge stars. Secondly, we want to find out how many of thestars in the “blue” plume above the turn-off realisticallybelong to the bulge, to the cluster, or to the foregrounddisk. Also here we would like to know how well we canclean the turn-off region from contaminating stars. Thequality of the turn-off region is a major limitation in thecase of NGC 6528 for determining a reliable relative orabsolute age.
We use our Gaussian fits to the different regions of thecolour-magnitude diagram to estimate the proper motioncuts which maximize the number of cluster stars relativeto the number of bulge stars, whilst still allowing enoughcluster stars to make a good cluster colour-magnitudediagram. Using different proper motion cuts in differentregions of the colour-magnitude diagram will affect therelative numbers of cluster stars in each region but thisdoes not matter for comparison of the observed colour-magnitude diagram with other globular clusters and withisochrones, where all we use is the position of the clus-ter stars in the colour-magnitude diagram and not theirnumber density.
In Fig. 6, we show the effect of various different propermotion cuts imposed on the WF2 colour-magnitude dia-gram. We have previously found that the cluster has a σ =0.09 arcsec per century. In the following we will use thisσ when defining the cuts to clean the colour-magnitudediagram. In a we show the full colour-magnitude diagramfor WF2. Plot c and d then shows the resulting colour-magnitude diagram when a cut of
√µ2l + µ2
b < 0.09 and

76 S. Feltzing and R. A. Johnson: A new colour-magnitude diagram for NGC 6528
Fig. 6. Illustration for WF2 of the effect on the colour-magnitude diagram from different cuts inpµ2l + µ2
b . All stars aremeasured in both the new and old images and satisfy the cuts imposed in χ and sharpness variables (see Sect. 3). Stars withfitting errors are excluded. a) all stars, d) stars with
pµ2l + µ2
b > 0.18, i.e. the rejected (mainly bulge) stars, b) stars withpµ2l + µ2
b < 0.09, and c)pµ2l + µ2
b < 0.18
√µ2l + µ2
b < 0.18, have been applied respectively. Forthe most conservative cut the turn-off region becomesclean, although the sub-giant branch remains somewhatconfused. The number of stars in the giant branches, how-ever, becomes almost too small for quantitative work.Moreover, as seen in Fig. 4, for the brighter magnitudesthe red part of the colour-magnitude diagram, i.e. the gi-ant branches, is dominated by cluster stars and a moregenerous cut can be allowed when cleaning the colour-
magnitude diagram. This is shown in c. Here though theturn-off region again becomes too confused for good work.
Our cleaned colour-magnitude diagram, Fig. 7,is finally obtained by imposing the following cuts;√µ2l + µ2
b < 0.18, for star with V555 < 19 and√µ2l + µ2
b <0.09 for the fainter stars.
In Fig. 6b, finally, we show the stars that have√µ2l + µ2
b > 0.18. These are mainly bulge stars. Comparealso the various histograms.

S. Feltzing and R. A. Johnson: A new colour-magnitude diagram for NGC 6528 77
Fig. 7. Colour-magnitude diagram from WF234 for the stars withpµ2l + µ2
b < 0.09 for V555 ≥ 19 andpµ2l + µ2
b < 0.18 for thebrighter stars.
Figure 8 shows the colour-magnitude diagram for thestars that have
√µ2l + µ2
b > 0.18, i.e. mainly bulgestars. This diagram is now based on all three WFs. Thiscolour-magnitude diagram has large spreads everywhere.Particularly noteworthy is the plume of stars that em-anates from the turn-off region as well as the extremelyfuzzy appearance of the regions around the horizontalbranches, indeed almost a lack of horizontal branch. Thiscolour-magnitude diagram should be compared to that ofBaade’s window, see e.g. Feltzing & Gilmore (2000) andFig. 2 in Holtzman et al. (1998). We note also that the redgiant stars show a branch that is turning over significantly.
For stars brighter then V555 = 19 Fig. 9 shows how thestars, included and excluded, from the colour-magnitudediagram are distributed on the sky. The first panel showsthe stars that have the highest probability to belong to theglobular cluster, i.e. small proper motions and redwardsof 1.6 in colour. The second shows the stars that are mostlikely to belong to either the bulge or to be foregrounddisks stars. These plots give further support for our def-inition of cuts in proper motion when defining the starsthat belong to the cluster. Figure 9a show a fairly concen-
trated structure, which tapers of at a certain radius. Notethat the detection of stars in the very centre is limitedbecause here we are only using the short exposures sincethe long were too crowded for good positions. Figure 9bon the other hand shows a much more even distributionof stars.
7.2. Differential reddening towards NGC 6528
We quantify how much of the apparent spread in thecolour-magnitude diagram in Fig. 7 is due to differentialreddening by fitting the “straightest” portion of the redgiant branch for each chip using a linear least squares fit.This is shown in Fig. 10. In the final panel the fits for thethree different WFs are compared. From this it is clearthat, in the mean, the reddening differs between the threechips such that WF2 has the smallest reddening and WF3has the largest. These reddening estimates are obtainedonly for stars that most likely belong to the cluster, i.e.the same cuts are imposed in all the following plots as wedid in Fig. 7.

78 S. Feltzing and R. A. Johnson: A new colour-magnitude diagram for NGC 6528
Fig. 8. Colour-magnitude diagram from WF234 for stars rejected as mainly bulge stars due to their proper motions are included,i.e.pµ2l + µ2
b > 0.18.
We also consider below whether differential reddeningis significant within each chip.
WF2 The giant branch in the colour-magnitude diagramderived from WF2 is quite tight and well defined. We takethis as an indication that the differential reddening overthis chip is small and that no correction for differentialreddening within the chip is needed.
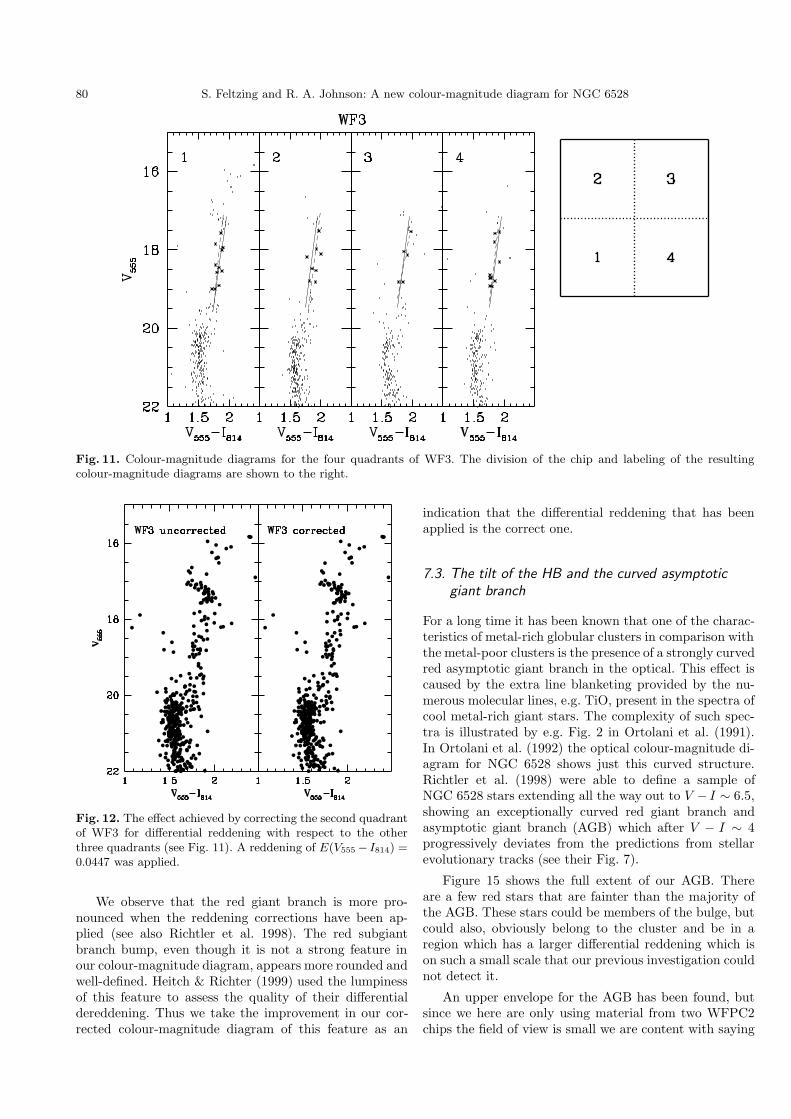
WF3 We divide the image into four sections and constructthe colour-magnitude diagrams for each of them in Fig. 11.Again stars on the cleanest portion of the giant branch
are selected and fitted with a straight line. First we fit it toall the stars on the chip (full line). Then for each quadrantof the image (dashed lines). From this it is clear, althoughthe number statistics are low, that quadrant 1, 3, and 4 allare close to the mean value, while quadrant 2 has a largerreddening than the rest. As the scatter around the fitted
Table 7. Differential reddening corrections for the quadrantsof WF3 to the mean reddening of WF2. In each case the valuesindicate how much the stars were moved in order for theirfiducial line for the red giant branch to coincide with that ofthe bluest one within the WF. We used the extinction laws andvalues in Holtzman et al. (1995b).
Quadrant ∆(V 555 − I814) ∆V555
1, 3, 4 −0.106 −0.2732 −0.151 −0.388
line for that part of the image is small we do not furtherdivide the image into smaller sections but will correct starsin quadrant 2 according to this shift, see Table 7. First wefound the shift in V555 − I814. Then we used Holtzmanet al. (1995b) Table 12 to find the corresponding ∆V555
that should be applied to remove the colour difference.

S. Feltzing and R. A. Johnson: A new colour-magnitude diagram for NGC 6528 79
Fig. 9. Positions on the sky for a) stars with V555 < 19,pµ2l + µ2
b < 0.09, and V555− I814 > 1.6. This should be predominantly
cluster stars. In b) stars with V555 < 19,pµ2l + µ2
b ≥ 0.18 and for all colours. This selection should primarily give us bulge andforeground disk stars. The sizes of the symbols code the magnitude of the stars.
Fig. 10. Colour-magnitude diagrams for WF234 as indicated. Stars used to provide a linear-least square fit to the red giantbranch are shown as ×. The fits are indicated by full lines for the individual chips and in the last panel with full (WF2), dotted(WF3) and, dashed (WF4) lines.
Figure 12 shows the WF3 colour-magnitude diagram cor-rected for differential reddening.
WF4 The colour-magnitude diagram for this chip has thelargest spread on the giant branch. Figure 13 shows theresult for the four subsections.
For quadrant 3 on the chip nothing can be saidsince the number statistics is too low. Quadrant 2 ap-pears to be well lined up with the mean value for thechip and quadrant 4 has somewhat larger reddening thanquadrant 2. The colour-magnitude diagram for the first
quadrant, however, has a remaining large scatter and wefurther subdivide this quadrant into four sub-quadrants,Fig. 14. This shows that the largest scatter emanates fromsub-quadrant 3 and that the three remaining sub-quadrants have a reddening that is less than the meanreddening for the first quadrant. However, because of thecomplexity found for the differential reddening we willomit WF4 from further discussions.
Our full final colour-magnitude diagram, using datafrom WF2 and WF3 corrected for differential reddening,is shown in Fig. 15.
80 S. Feltzing and R. A. Johnson: A new colour-magnitude diagram for NGC 6528
Fig. 11. Colour-magnitude diagrams for the four quadrants of WF3. The division of the chip and labeling of the resultingcolour-magnitude diagrams are shown to the right.
Fig. 12. The effect achieved by correcting the second quadrantof WF3 for differential reddening with respect to the otherthree quadrants (see Fig. 11). A reddening of E(V555− I814) =0.0447 was applied.
We observe that the red giant branch is more pro-nounced when the reddening corrections have been ap-plied (see also Richtler et al. 1998). The red subgiantbranch bump, even though it is not a strong feature inour colour-magnitude diagram, appears more rounded andwell-defined. Heitch & Richter (1999) used the lumpinessof this feature to assess the quality of their differentialdereddening. Thus we take the improvement in our cor-rected colour-magnitude diagram of this feature as an
indication that the differential reddening that has beenapplied is the correct one.
7.3. The tilt of the HB and the curved asymptoticgiant branch
For a long time it has been known that one of the charac-teristics of metal-rich globular clusters in comparison withthe metal-poor clusters is the presence of a strongly curvedred asymptotic giant branch in the optical. This effect iscaused by the extra line blanketing provided by the nu-merous molecular lines, e.g. TiO, present in the spectra ofcool metal-rich giant stars. The complexity of such spec-tra is illustrated by e.g. Fig. 2 in Ortolani et al. (1991).In Ortolani et al. (1992) the optical colour-magnitude di-agram for NGC 6528 shows just this curved structure.Richtler et al. (1998) were able to define a sample ofNGC 6528 stars extending all the way out to V − I ∼ 6.5,showing an exceptionally curved red giant branch andasymptotic giant branch (AGB) which after V − I ∼ 4progressively deviates from the predictions from stellarevolutionary tracks (see their Fig. 7).
Figure 15 shows the full extent of our AGB. Thereare a few red stars that are fainter than the majority ofthe AGB. These stars could be members of the bulge, butcould also, obviously belong to the cluster and be in aregion which has a larger differential reddening which ison such a small scale that our previous investigation couldnot detect it.
An upper envelope for the AGB has been found, butsince we here are only using material from two WFPC2chips the field of view is small we are content with saying

S. Feltzing and R. A. Johnson: A new colour-magnitude diagram for NGC 6528 81
Fig. 13. Colour-magnitude diagrams for the four quadrant of the WF3 image. The division of the chip and labeling of theresulting colour-magnitude diagrams are shown to the right.
Fig. 14. Colour-magnitude diagrams for the four sub-quadrants of the first quadrant of WF4 image. The division of the chipand labeling of the resulting colour-magnitude diagrams are shown to the right.
that our results agree well with those of Richtler et al.(1998) for the upper envelope, see their Fig. 7. They alsofind a number of stars with V − I >∼4. We find no suchstars in our proper motions selected sample. The reasonfor this could either be that the stars are saturated in ourI-band images or that they happen to be outside our fieldof view. We are not in a position to be able to furtherdistinguish between these possibilities.
8. The age of NGC 6528
Armed with the cleanest colour-magnitude diagram so farfor the globular cluster NGC 6528 we are in a position toaddress its age using both stellar isochrones as well as inrelation to other well studied metal-rich globular clusters.

82 S. Feltzing and R. A. Johnson: A new colour-magnitude diagram for NGC 6528
Fig. 15. Final colour-magnitude diagram based on the datafrom WF2 and WF3 corrected for differential reddening. Cutsinpµ2l + µ2
b as in Fig. 7.
8.1. The metallicity of NGC 6528
Since age and metallicity are degenerate in colour-magnitude diagrams it is important to have a good esti-mate of the metallicity if we want to use stellar isochronesto find the absolute age of the cluster. In Table 1, wesummarize the current metallicity and iron abundance es-timates for NGC 6528 available in the literature.
Due to the faintness of metal-rich globular clusters de-tailed stellar abundance studies of individual stars in theseclusters have been few. The results of the first such studywas reported in Barbuy (1999) who obtained spectra ofone, very cool (Teff = 3600 K) giant star in NGC 6528and derived a [Fe/H] of −0.6 dex, [Ca/Fe] = 0.0 dex and[Ti/Fe] = +0.6 dex.
Using the HIRES spectrograph on KECK Carrettaet al. (2001) and Cohen et al. (1999), in two accompanyingpapers, derive iron abundances as well as abundances for alarge number of other elements for four stars in NGC 6528and five stars in NGC 6553. Carretta et al. (2001) foundthat all four stars in NGC 6528 show very similar [Fe/H](+0.05,+0.08,+0.09,+0.04 dex respectively) thus their fi-nal [Fe/H] estimate for the whole cluster appears veryrobust. The accompanying study of NGC 6553 and thediscussion of the [Fe/H] for NGC 6553 appear to indicatethat a total error in [Fe/H] on the order of 0.1 dex appeara reasonable estimate (see detailed discussions in Carrettaet al. 2001).
See also their detailed discussion of the problems withanalysis of cold giants. It appears that the disagreement
Fig. 16. Comparison of our final colour-magnitude diagramwith the ridge line derived for NGC 6553 by Zoccali et al.(2001). Their ridge line is showed as a set of connected × sym-bols. Both the mains-sequence, red giant branch as well as thehorizontal branch coincide well. The ridge line of NGC 6553was moved +0.4 mag in V555 and −0.18 in V555 − I814.
between the two studies could be due to different temper-ature scales having been used. Since the Carretta et al.(2001) study is the larger one and also guided by their dis-cussion on the temperature and errors from other sourceswe here give higher weight to that study for determinationof stellar abundances in NGC 6528. However, further in-dependent studies of the stellar abundances in this clustershould be undertaken to solve this issue.
Further Carretta et al. (2001) found that the α-elements Si and Ca in NGC 6528 show large excesses com-pared to the solar values, while Ti and Mg appear to besolar. This type of abundance pattern is reminiscent ofthat observed for stars in the Galactic bulge (McWilliam& Rich 1994) and might be indicative of a rapid chemicalenrichment process prior to the formation of the stars ob-served. The exact interpretation of these data is, however,pending.
In Carretta et al. (2001) the cluster membership forthe four stars studied was ascertained by observing onlyhorizontal branch stars. The stellar spectra were also usedto derive radial velocities for the program stars and theirvelocities further confirmed the cluster membership for thefour targets.
Having assessed the currently available abundance in-formation for NGC 6528 we find it safe to assume thatthe cluster is probably as metal-rich as the sun and isenhanced, at least in some, α−elements.

S. Feltzing and R. A. Johnson: A new colour-magnitude diagram for NGC 6528 83
Fig. 17. Colour-magnitude diagram with fiducial points indi-cated by large open circles. The horizontal branch stars areindicated by × and the AGB stars with •. Note that no pointsare defined for the lower part of the red giant branch, see textfor a discussion of this. Cuts in
pµ2l + µ2
b as in previous plots.
8.2. Comparison with NGC 6553
In Fig. 16 we compare the ridge line for NGC 6553found by Zoccali et al. (2001) with our colour-magnitudediagram. To fit the colour-magnitude diagram for NGC6528 with the ridge line of NGC 6553 we need to movethe ridge line from Zoccali et al. (2001) by 0.4 in V555 and−0.18 in V555 − I814. If the two clusters have the samemetallicity (as indicated by the recent detailed abundanceanalyses) this nice fit indicates that their ages are veryclose too. We thus find that NGC 6553 has been morereddened than NGC 6528, i.e. the negative shift appliedin V555 − I814. Using Table 12 in Holtzman et al. (1995b)we find that shift in V555 − I814 corresponds to a shift inV555 of −0.46. Thus NGC 6553 appears to be marginallycloser to us that NGC 6528. However, it should be remem-bered that both in Zoccali et al. (2001) and in this workthe colour-magnitude diagrams have been corrected fordifferential reddening so the interpretation of such shiftsis less clear in terms of distance modulus. The ∆E(B−V ),as measured here, between the two clusters is ∼0.15, usingTable 12 in Holtzman et al. (1995b).
The agreement between the NGC 6553 ridge line andour data is very good. At the brightest end the NGC 6553ridge line appears to fall slightly below the NGC 6528data. However, since the NGC 6553 data does not go asbright as the NGC 6528 data one should not draw any
Table 8. Fiducial points for NGC 6528.
V555 − I814 V555
1.5 21.41.45 211.42 20.61.4 20.21.68 18.81.71 18.31.75 17.751.8 17.35
conclusions regarding the relative metallicities of the clus-ters from this.
This comparison does, as has also been reported in e.g.Ortolani et al. (1995), show that these two clusters haveindeed very similar ages.
8.3. Age from fitting stellar isochrones
Since NGC 6528 is found to be enhanced, at least in some,α−elements we compare our fiducial points with that oftheoretical stellar isochrones from Salasnich et al. (2000)in which α-enhancement has been included. To facilitatethe comparison with the stellar isochrones we define a setof fiducial points which are shown in Fig. 17 and tabulatedin Table 8.
The fiducial points are marked with large circles andtrace the upper main-sequence as well as the upper part ofthe red giant branch. We have deliberately not defined anypoint for the lower red giant branch or for the sub-giantbranch as we feel that these regions are less well definedand thus that any fiducial point might be misleading. Wehave also marked those stars that we will explicitly showin the diagrams where we fit isochrones. It is fairer to showall the AGB and horizontal branch stars rather than try torepresent them with a fiducial line since then each readeris able to judge for themselves the goodness of the fit.
Examples of fits are shown in Fig. 18.In the case of Z = 0.019 we moved the isochrones
by ∆(V555) = 15.95 and ∆(V555 − I814) = +0.63. Theturn-off is well represented by the 11 Gyr isochrone andthe horizontal branch is well matched too. However, allthe isochrones are brighter than the AGB. In order forZ = 0.019 isochrones to fit our data on the AGB we wouldneed to increase the distance modulus and the best fit-ting isochrone would then be very young, younger than9 Gyr. The horizontal branch would not be well fitted ei-ther. Thus it appears unlikely that our data could be wellfitted with α-enhanced isochrones with Z = 0.019.
For the Z = 0.040 isochrones we moved them with thefollowing amount ∆(V555) = 15.95 and ∆(V555 − I814) =+0.655. Here the AGB is much better reproduced andboth turn-off and horizontal branch can be well fitted si-multaneously. The 11 Gyr isochrone appears to fit best.

84 S. Feltzing and R. A. Johnson: A new colour-magnitude diagram for NGC 6528
Fig. 18. Fiducial points for NGC 6528 together with stel-lar isochrones from Salasnich et al. (2000). Isochrones are forZ = 0.019 and Z = 0.040. Horizontal branch stars and AGBstars are coded as previously.
However as this fit cannot be rigorous due to the limita-tions in the data the estimated error bar on this must berather large, perhaps up to 2 Gyr.
These ∆V555 and ∆(V555 − I814) correspond to (usingTable 12 in Holtzman et al. 1995a) anE(B−V ) of 0.54 andthus a distance modulus of 14.29 which corresponds to aphysical distance of 7.2 kpc. The derived distance, is com-patible with that found by Richtler et al. (1998) who usedthe magnitude of the horizontal branch to determine thedistance to NGC 65628. With mv(HB) = 17.21±0.05 theyfound that the distance to NGC 6528 is between 6.0 and8.9 kpc depending on the exact value for reddening andmetallicity as well as the relation between magnitude forthe horizontal branch and metallicity (see their Table 10).Since we have a better handle on the metallicity we areable to be more sure about the distance and reddening.
Note that the reddening that we derive here is a “min-imum” reddening in the sense that we have dereddenedthe stars on WF3 relative to those on WF2 according tothe differential reddenings found.
9. Discussion and summary
Colour-magnitude diagrams of the metal-rich globularcluster NGC 6528 are notoriously difficult to analyze. Thisis due to the fact the cluster is situated in the Galacticbulge and thus the fields stars belonging to the bulge havethe same magnitudes as the stars in NGC 6528.
Using two epochs of observations with HST/WFPC2we obtain the stellar proper motions for all stars in thefield. The proper motions are used to separate the bulgefrom the cluster stars. The stellar sequences in the result-ing colour-magnitude diagram are better defined than inany previously published colour-magnitude diagram.
Using α-enhanced stellar isochrones we find NGC 6528to have a probable age of 11± 2 Gyrs, this is the first at-tempt to establish the absolute age of NGC 6528. Previousstudies have only compared the fiducial ridge line for thecluster to that of other globular clusters of similar metal-licities. Mainly the comparisons have been with regardsto NGC 6553 and 47 Tuc. With the new metallicity de-terminations for individual stars in both NGC 6553 andNGC 6528 it is now clear that 47 Tuc (at −0.71 dex)has a significantly lower metallicity than NGC 6528 andNGC 6553 and is thus not a suitable comparison clusteras regards differential age determinations (see e.g. Stetsonet al. 1996 and references therein).
The distance modulus obtained when fitting the stellarisochrones yields a distance to NGC 6528 of 7.2 kpc, fullycompatible with previous derivations.
A comparison with the fiducial line for NGC 6553 con-firms results in earlier studies, e.g. Ortolani et al. (1995),that the two clusters indeed have very similar ages.
The stellar proper motion also provide velocity dis-persions for both the cluster and field stars. The velocitydispersion of the cluster is most likely dominated by mea-surement errors. The bulge dispersion can thus be foundby deconvolution. The resulting dispersions are consistentwith what has previously (Spaenhauer et al. 1992) beenfound for Bulge giants. Moreover, combining our resultswith those by Zoccali et al. (2001) we are able to con-firm the difference in σl at two positions in the bulge aspredicted by the model in Zhao (1996).
To our knowledge, our and Zoccali et al.’s study arethe first to address the proper motions amongst bulge hor-izontal branch and fainter stars.
Finally we derive the mean proper motion of NGC 6528relative to the Galactic bulge and also the space velocities.We find < µl >=∼+0.006 and < µb >=∼+0.044 arcsecper century and (Π, Θ, W ) = (−142, 303, 4) km s−1.
Acknowledgements. We thank the Royal Swedish Academyof Sciences for a collaborative grant that enabled visits toCambridge, for SF, and to Lund, for RAJ.

S. Feltzing and R. A. Johnson: A new colour-magnitude diagram for NGC 6528 85
Appendix A: Stellar proper motions, coordinates and magnitudes
Table A.1. Stellar proper motions, both in galactic coordinates as well as in position on WF2-chip. The proper motions ingalactic coordinates are given in arcsec per century. Magnitudes and errors on magnitudes are also given. The table containsdata for all stars brighter than V555 = 19 and which did not have fitting errors. The position on the WF chip are for the newimages. The full table (containing 212 entries) is available electronically from CDS.
µl µb l b ∆x ∆y x y V555 σV 555 I814 σI814
–0.134 –0.326 1.142 –4.155 –0.350 –0.038 614.45 42.80 17.18 0.001 15.33 0.003
0.162 0.038 1.139 –4.169 0.082 0.145 120.38 48.03 17.15 0.002 15.41 0.003
–0.265 –0.065 1.140 –4.164 –0.136 –0.237 296.42 48.49 17.35 0.002 16.00 0.004
0.069 0.023 1.139 –4.167 0.041 0.060 179.20 54.49 16.95 0.001 15.30 0.003
... ... ... ... ... ... ... ... ... ... ... ...
... ... ... ... ... ... ... ... ... ... ... ...
... ... ... ... ... ... ... ... ... ... ... ...
Table A.2. Stellar proper motions, both in galactic coordinates as well as in position on WF3-chip. The proper motions ingalactic coordinates are given in arcsec per century. Magnitudes and errors on magnitudes are also given. The table containsdata for all stars brighter than V555 = 19 and which did not have fitting errors. The position on the WF chip are for the newimages. The full table (containing 214 entries) is available electronically from CDS.
µl µb l b ∆x ∆y x y V555 σV 555 I814 σI814
–0.207 –0.077 1.146 –4.173 –0.177 0.132 354.99 61.06 18.64 0.005 17.14 0.009
0.102 –0.039 1.145 –4.173 0.109 0.009 327.54 74.75 18.80 0.004 17.15 0.007
–0.080 –0.076 1.145 –4.173 –0.055 0.095 340.09 76.76 16.99 0.001 15.27 0.003
0.024 –0.101 1.147 –4.175 0.051 0.090 398.59 101.47 17.00 0.001 15.29 0.003
... ... ... ... ... ... ... ... ... ... ... ...
... ... ... ... ... ... ... ... ... ... ... ...
... ... ... ... ... ... ... ... ... ... ... ...
Table A.3. Stellar proper motions, both in galactic coordinates as well as in position on WF4-chip. The proper motions ingalactic coordinates are given in arcsec per century. Magnitudes and errors on magnitudes are also given. The table containsdata for all stars brighter than V555 = 19 and which did not have fitting errors. The position on the WF chip are for the newimages. The full table (containing 227 entries) is available electronically from CDS.
µl µb l b ∆x ∆y x y V555 σV 555 I814 σI814
0.528 0.055 1.136 –4.175 –0.205 –0.490 217.89 51.06 17.29 0.005 15.51 0.006
–0.032 0.045 1.136 –4.175 –0.034 0.044 216.26 55.69 17.23 0.005 15.46 0.005
–0.186 0.115 1.135 –4.177 –0.056 0.211 292.08 55.84 18.81 0.009 17.25 0.017
0.868 –0.076 1.137 –4.172 –0.178 –0.853 88.79 57.58 17.35 0.004 15.52 0.005
... ... ... ... ... ... ... ... ... ... ... ...
... ... ... ... ... ... ... ... ... ... ... ...
... ... ... ... ... ... ... ... ... ... ... ...
References
Armandroff, T. E., & Zinn, R. 1988, AJ, 96, 92
Arp, H. 1986, A&A, 156, 207
Baggett, S., Casertano, S., Gonzaga, S., & Ritchie, C. 1997,WFPC2 Instrument Science Report 97-10
Barbuy, B. 1999, in Galaxy Evolution: Connecting the DistantUniverse with the Local Fossil Record, ed. M. Spite, 319
Bedin, L. R., Anderson, J., King, I. R., & Piotto, G. 2001, ApJ,560, L75
Bica, E. L. D., & Pastoriza, M. G. 1983, Ap&SS, 91, 99Bruzual, G., Barbuy, B., Ortolani, S., Bica, E. Cuisinier, et al.
1997, AJ, 114, 1531
Carretta, E., Cohen, J.G., Gratton, R.F., & Behr, B.B. 2001,AJ, 122, 1469
Cohen, J. G., & Sleeper, C. 1995, AJ, 109, 242

86 S. Feltzing and R. A. Johnson: A new colour-magnitude diagram for NGC 6528
Cohen, J. G., Gratton, R. G., Behr, B. B., & Carretta, E. 1999ApJ, 523, 739
Cudworth, K. M. 1988 AJ, 96, 105Davidge, T. J. 2000, ApJS, 126, 105Dehnen, W., & Binney, J. J. 1998, MNRAS, 298, 387Dubath, P., & Grillmair, C. J. 1997, A&A, 321, 379Dubath, P., Meylan, G., & Mayor, M. 1997, A&A, 324, 505Feltzing, S., & Gilmore, G. 2000, A&A, 355, 949Ferraro, F. R., Messineo, M., Fusi Pecci, F., De Palo, M. A.,
Straniero, O., et al. 1999, AJ, 118, 1738Fruchter, A. S., & Mutchler, M. 1998, STScI preprint (avialable
from www-int.stsci.edu/fruchter/dither/ditherII.ps)
Gonzaga, S., O’Dea C., & Whitmore, B. 1999, WFPC2Technical Instrument Report 99-01
Harris, W. E. 1996, AJ, 112, 1487Heitsch, F., & Richtler, T. 1999, A&A, 347, 455Holtzman, J., Hester, J. J., Casertano, S., & Trauger, J. T.,
Watson, A. M. 1995a, PASP, 107, 156Holtzman, J. A., Burrows, J., Casertano, S., Hester, J. J.,
Trauger, J. T. 1995b, PASP, 107, 1065Holtzman, J. A., Watson, A. M., Baum, W. A., Grillmair, C. J.,
Groth, E. J., et al. 1998, AJ, 115, 1946King, I. R., Anderson, J., Cool, A. M., & Piotto, G. 1998, ApJ,
429, L37McWilliam, A., & Rich, M. 1994, ApJS, 91, 749Origlia, L., Ferraro, F. R., Fusi Pecci, F., & Oliva, E. 1997,
A&A, 321, 859
Ortolani, S., Barbuy, B., & Bica, E. 1991, A&A, 249, 310Ortolani, S., Bica, E., & Barbuy, B. 1992, A&AS, 92, 441Ortolani, S., Renzini, A., Gilmozzi, R., et al. 1995, Nature, 377,
701Pryor, C., & Meylan, G. 1993, in Structure and Dynamics of
Globular Clusters, ed. S. G. Djorgovski & G. Meylan, ASPConf. Ser., 50, 357
Richtler, T., Grebel, E. K., Subramaniam, A., & Sagar, R. 1998A&AS, 127, 167
Sadler, E. M., Rich, R. M., & Terndrup, D. M. 1996, AJ, 112,171
Salasnich, B., Girardi, L., Weiss, A., & Chiosi, C. 2000, A&A,361, 1023
Spaenhauer, A., Jones, B. F., & Whitford, A. E. 1992, AJ, 103,297
Stetson, P. B., VandenBerg, D. A., & Bolte, M. 1996, PASP,108, 560
Whitmore, B., Heyer, I., & Casertano, S. 1999, PASP, 111,1559
Zhao, H. S. 1996, MNRAS, 283, 149Zinn, R. 1980, ApJS, 42, 19Zinn R., & West, M. 1984, ApJS, 55, 45Zoccali, M., Renzini, A., Ortolani, S., Bica, E., & Barbuy, B.
2001, AJ, 121, 2638