Embed Size (px)
Citation preview
2005 Proceedings of the Seventh Annual Forest Inventory and Analysis Symposium 67
A New Flexible Forest Inventory in France
C. Vidal1, T. Bélouard2, J.-C. Hervé3, N. Robert4,
and J. Wolsack5
Abstract.—The French National Forest Inventory
was created in 1958 to assess metropolitan forest
resources. To stick to new national and international
requirements as well as to enhance reactivity, a
new inventory method was implemented in 2004.
This new method is based on a systematic sampling
grid covering the whole territory every year. The
size of the mesh is variable, locally adapted to the
diversity and the fragmentation of French forests.
The sample is defined for 5 years. It is divided into 5
annual systematic subsamples, each of which covers
the whole country. The estimation method uses
poststratification to enhance statistical accuracy.
Introduction
The mission of the French National Forest Inventory (NFI) is
to collect information about forest and natural lands all over
the European part of France. It describes forest, other wooded
land, heathland, and hedges. It draws a precise map of forest
types and heathland. It estimates areas per land cover and land
use, and assesses forest resources including growing stock and
carbon stock with their increment as well as biodiversity.
Data are produced at national, regional, or “département”
(administrative unit covering each nearly 1/90th of the country)
levels to help policymakers in their decisions. It also proposes
results at the scale of “forest regions,” which are small,
continuous ecological areas. Aggregated results are available
for free on the NFI Web site and particular requests can be
asked. The NFI staff also conducts specific studies based on
NFI results for many institutions. For example, it evaluated
wood fuel resources in France (French NFI 2005) or updated
indicators for forest sustainable development (French NFI
2001), as well as international level delivery to the United
Nations Food and Agriculture Organization and the United
Nations Economic Commission for Europe.
The Previous Method
The forest inventory was conducted since 1958 per “départe-
ment” (French NFI 1985). Results were very precise at the scale
of the “département,” but data were updated on these areas
every 12 years only. No intermediate results were available. To
produce results at the regional level (22 units) and more over
at the national level, the aggregation of diachronic results was
used. For field observations, a stratified sampling plan was used.
The stratification variables were ownership, forest regions, for-
est types, land use and cover. It enhanced the quality of the for-
est area evaluation and tree measurement results, but the impact
on ecological variables remained difficult to estimate.
National and International Context
In France, administrative regions become more and more
a level of policy decisionmaking, and data are needed at
this level to prepare political decision. At a different level,
nonadministrative management units (e.g., regional and national
natural parks) need forest mensuration and ecological results
from the NFI to guide their action. As a consequence, a higher
geographical flexibility is required.
Reactivity is also expected. The NFI must be able to evaluate
quickly consequences from important disturbances (storm,
drought, forest fires, or parasite attacks) that have an impact at
the regional or at the national level. The envisaged solution is to
come back on the surveyed plots but the sample must be recent.
1 Director, French Forest Inventory, Château des Barres, 45290 Nogent-sur-Vernisson, France. E-mail: [email protected] Head of the Interregional Unit in Bordeaux, 62 rue de Laseppe, 33000 Bordeaux, France. E-mail: [email protected] Technical Director, French Forest Inventory, Château des Barres, 45290 Nogent-sur-Vernisson, France. E-mail: [email protected] Engineer in Charge of International Affairs, Château des Barres, 45290 Nogent-sur-Vernisson, France. E-mail: [email protected] Chairman of the Information System Council, Minister of Agriculture, 78, rue de Varenne, 75349 Paris 07 SP, France. E-mail: [email protected].
6� 2005 Proceedings of the Seventh Annual Forest Inventory and Analysis Symposium
At the international level, the French government has to provide
data about forest resources every 5 years to the Food and
Agriculture Organization (FAO) and to report on sustainable
forest management indicators for the Ministerial Conference
for the Protection of Forests in Europe. It needs data about
forest carbon stock and sinks to compute the greenhouse
gases balance according to the convention on climate change
of the United Nations and its Kyoto Protocol. To meet these
requirements, regularly updated information at the national
level is necessary.
Flexible Sampling Design
Principle: A Countrywide Systematic Sampling Each Year
To respond to these requirements, the NFI changed its sampling
design. At first, the sample was prepared for 10 years and
was divided into two 5-year systematic subsamples, each of
which covers the whole of France. It finally started with a 5-
year slice. The new sampling is based on a systematic square
grid covering the entire country. The size of the grid-mesh is
2 km2. Plots are georeferenced using the Lambert II extended
projection and New French Triangulation.
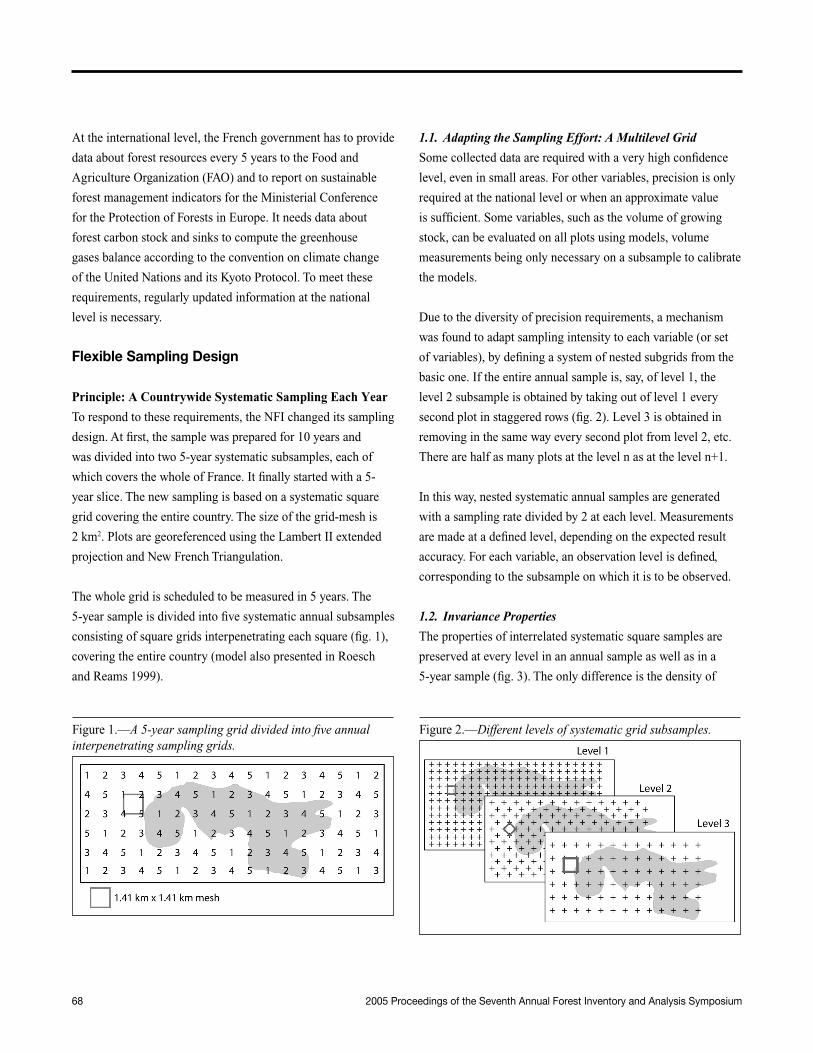
The whole grid is scheduled to be measured in 5 years. The
5-year sample is divided into five systematic annual subsamples
consisting of square grids interpenetrating each square (fig. 1),
covering the entire country (model also presented in Roesch
and Reams 1999).
1.1. Adapting the Sampling Effort: A Multilevel Grid
Some collected data are required with a very high confidence
level, even in small areas. For other variables, precision is only
required at the national level or when an approximate value
is sufficient. Some variables, such as the volume of growing
stock, can be evaluated on all plots using models, volume
measurements being only necessary on a subsample to calibrate
the models.
Due to the diversity of precision requirements, a mechanism
was found to adapt sampling intensity to each variable (or set
of variables), by defining a system of nested subgrids from the
basic one. If the entire annual sample is, say, of level 1, the
level 2 subsample is obtained by taking out of level 1 every
second plot in staggered rows (fig. 2). Level 3 is obtained in
removing in the same way every second plot from level 2, etc.
There are half as many plots at the level n as at the level n+1.
In this way, nested systematic annual samples are generated
with a sampling rate divided by 2 at each level. Measurements
are made at a defined level, depending on the expected result
accuracy. For each variable, an observation level is defined,
corresponding to the subsample on which it is to be observed.
1.2. Invariance Properties
The properties of interrelated systematic square samples are
preserved at every level in an annual sample as well as in a
5-year sample (fig. 3). The only difference is the density of
Figure 1.—A 5-year sampling grid divided into five annual interpenetrating sampling grids.
Figure 2.—Different levels of systematic grid subsamples.

2005 Proceedings of the Seventh Annual Forest Inventory and Analysis Symposium 6�
sample plots. As a consequence, the same computation scheme
can be used every year and for every level.
As years will go by, the density of the observations and
measurements will increase. The use of several consecutive
annual measurements will be interesting to enhance the
precision of the results and to enable local reporting.
Spatial Adaptation of the Sampling Rate to Optimize Field
Work
Delimited Areas With Reduce Sampling Rate
Some areas in France are very homogeneous, for example,
the maritime pine (Pinus pinaster) massif in the Southwest. In
such areas, fewer measurements are necessary to obtain precise
enough results.
In other parts of the country, some forest ecosystems are not
very productive and the economical use of the wood is of a
little importance; e.g., green oak (Quercus ilex) or strawberry
tree (Arbutus unedo) stands in the Mediterranean region or
forests on steep slopes in mountainous areas. No detailed
resource assessment is expected. Fewer measurements can be
made to obtain estimations corresponding to the needs.
In both cases, the concerned areas (called forest zones) are
mapped (fig. 4) and the density of the sample is adapted. Field
operations are then carried out at a higher level subsample than
the usual one, for example at level 3 instead of level 2 (fig. 5).
This geographical adaptation of the sampling rate makes
it possible to go through the whole sample in 1 year with a
constant number of field crews.
A Higher Sampling Rate for Poplar Stands
Poplar trees are economically important in France. Plantations
are usually small and felling cycles are rather short. To make
a precise inventory of these areas, a higher density of plots is
required in the parts of the territory where the poplar stands are
often clustered (valleys especially). Therefore, observations are
conducted on 16-plot square clusters instead of single plots.
These clusters are systematic 1 by 1 km grids. The mesh is
square with 250 m between plots. This process multiplies the
Figure 3.—Invariance of the subsample properties every year and at every level.
Figure 4.—Map of the forest zones with a reduced sampling intensity.
Figure 5.—Example of reduced sampling intensity in the Southwest.
70 2005 Proceedings of the Seventh Annual Forest Inventory and Analysis Symposium
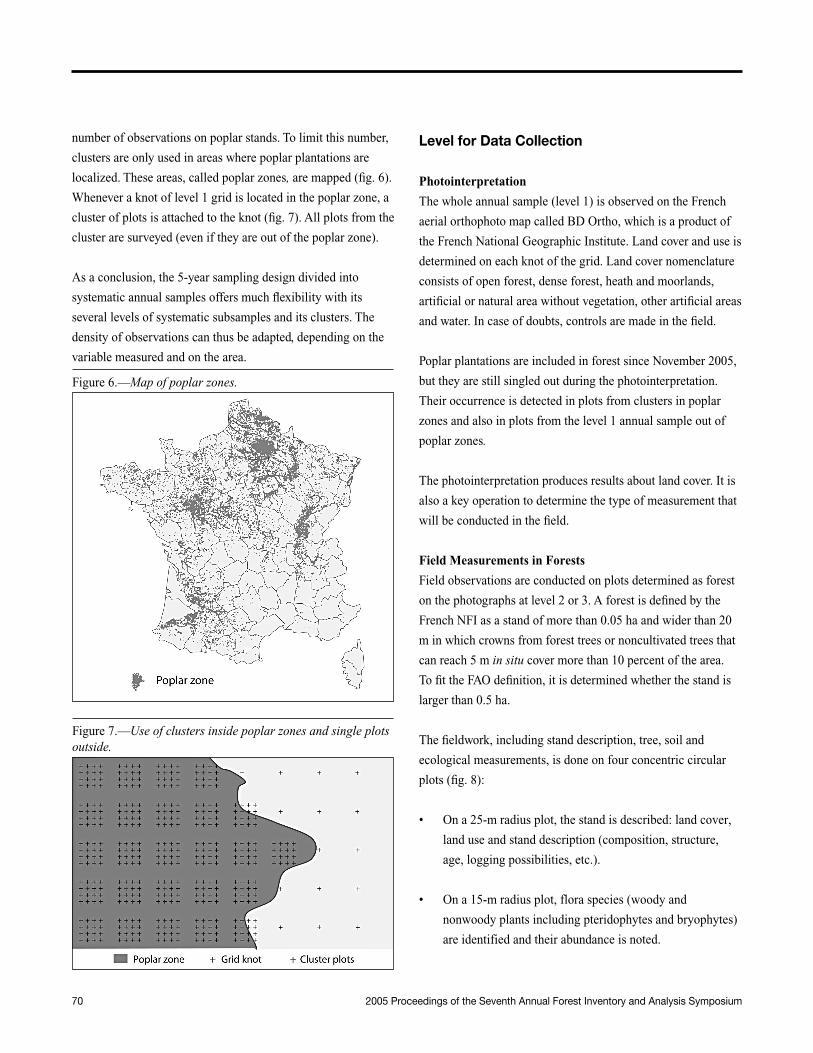
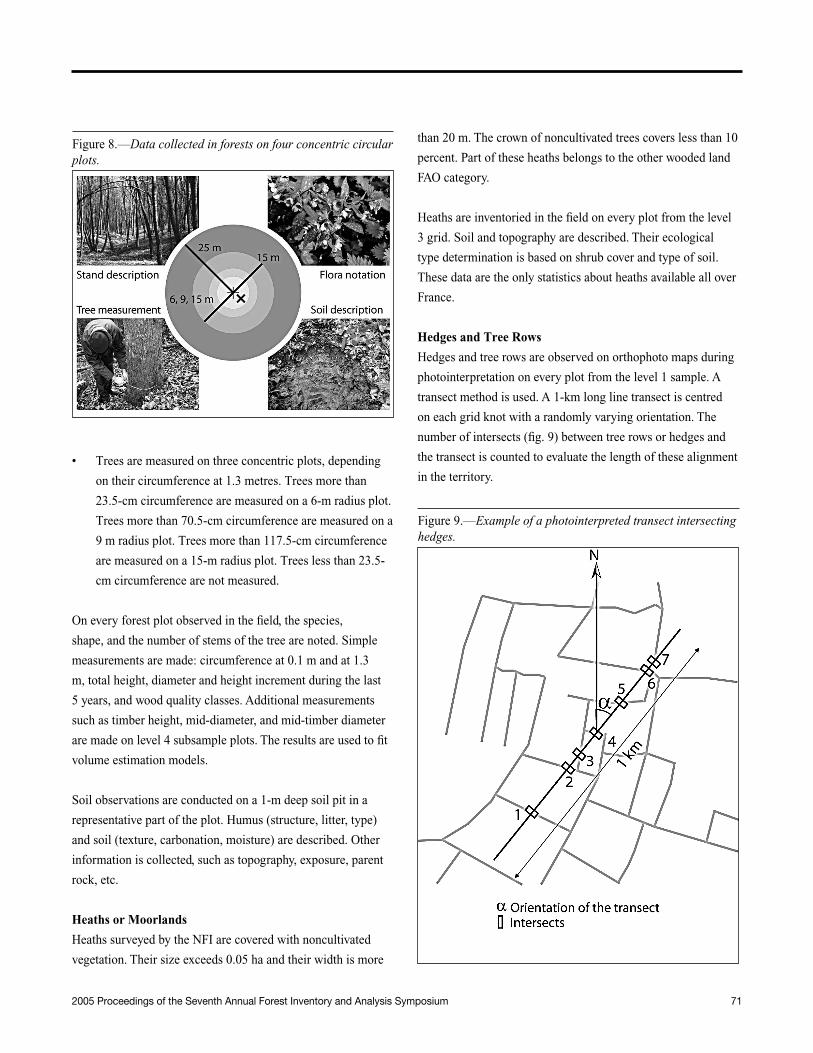
number of observations on poplar stands. To limit this number,
clusters are only used in areas where poplar plantations are
localized. These areas, called poplar zones, are mapped (fig. 6).
Whenever a knot of level 1 grid is located in the poplar zone, a
cluster of plots is attached to the knot (fig. 7). All plots from the
cluster are surveyed (even if they are out of the poplar zone).
As a conclusion, the 5-year sampling design divided into
systematic annual samples offers much flexibility with its
several levels of systematic subsamples and its clusters. The
density of observations can thus be adapted, depending on the
variable measured and on the area.
Level for Data Collection
Photointerpretation
The whole annual sample (level 1) is observed on the French
aerial orthophoto map called BD Ortho, which is a product of
the French National Geographic Institute. Land cover and use is
determined on each knot of the grid. Land cover nomenclature
consists of open forest, dense forest, heath and moorlands,
artificial or natural area without vegetation, other artificial areas
and water. In case of doubts, controls are made in the field.
Poplar plantations are included in forest since November 2005,
but they are still singled out during the photointerpretation.
Their occurrence is detected in plots from clusters in poplar
zones and also in plots from the level 1 annual sample out of
poplar zones.
The photointerpretation produces results about land cover. It is
also a key operation to determine the type of measurement that
will be conducted in the field.
Field Measurements in Forests
Field observations are conducted on plots determined as forest
on the photographs at level 2 or 3. A forest is defined by the
French NFI as a stand of more than 0.05 ha and wider than 20
m in which crowns from forest trees or noncultivated trees that
can reach 5 m in situ cover more than 10 percent of the area.
To fit the FAO definition, it is determined whether the stand is
larger than 0.5 ha.
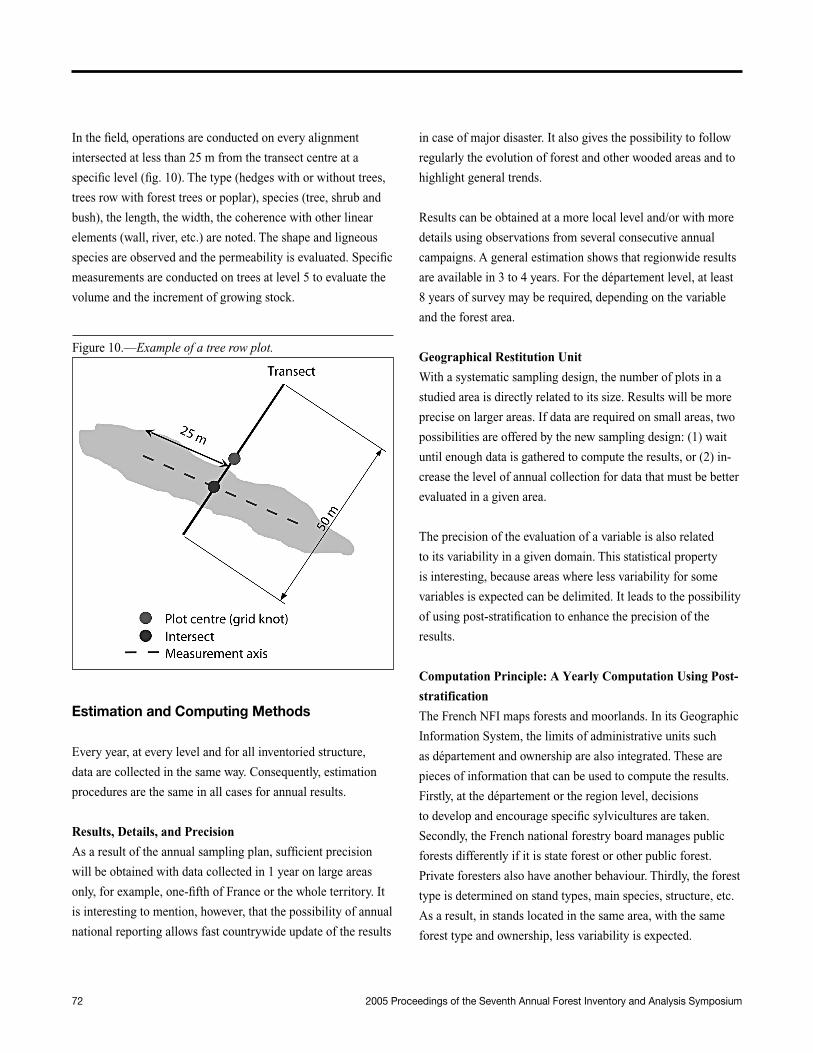
The fieldwork, including stand description, tree, soil and
ecological measurements, is done on four concentric circular
plots (fig. 8):
• On a 25-m radius plot, the stand is described: land cover,
land use and stand description (composition, structure,
age, logging possibilities, etc.).
• On a 15-m radius plot, flora species (woody and
nonwoody plants including pteridophytes and bryophytes)
are identified and their abundance is noted.
Figure 6.—Map of poplar zones.
Figure 7.—Use of clusters inside poplar zones and single plots outside.
2005 Proceedings of the Seventh Annual Forest Inventory and Analysis Symposium 7�
• Trees are measured on three concentric plots, depending
on their circumference at 1.3 metres. Trees more than
23.5-cm circumference are measured on a 6-m radius plot.
Trees more than 70.5-cm circumference are measured on a
9 m radius plot. Trees more than 117.5-cm circumference
are measured on a 15-m radius plot. Trees less than 23.5-
cm circumference are not measured.
On every forest plot observed in the field, the species,
shape, and the number of stems of the tree are noted. Simple
measurements are made: circumference at 0.1 m and at 1.3
m, total height, diameter and height increment during the last
5 years, and wood quality classes. Additional measurements
such as timber height, mid-diameter, and mid-timber diameter
are made on level 4 subsample plots. The results are used to fit
volume estimation models.
Soil observations are conducted on a 1-m deep soil pit in a
representative part of the plot. Humus (structure, litter, type)
and soil (texture, carbonation, moisture) are described. Other
information is collected, such as topography, exposure, parent
rock, etc.
Heaths or Moorlands
Heaths surveyed by the NFI are covered with noncultivated
vegetation. Their size exceeds 0.05 ha and their width is more
than 20 m. The crown of noncultivated trees covers less than 10
percent. Part of these heaths belongs to the other wooded land
FAO category.
Heaths are inventoried in the field on every plot from the level
3 grid. Soil and topography are described. Their ecological
type determination is based on shrub cover and type of soil.
These data are the only statistics about heaths available all over
France.
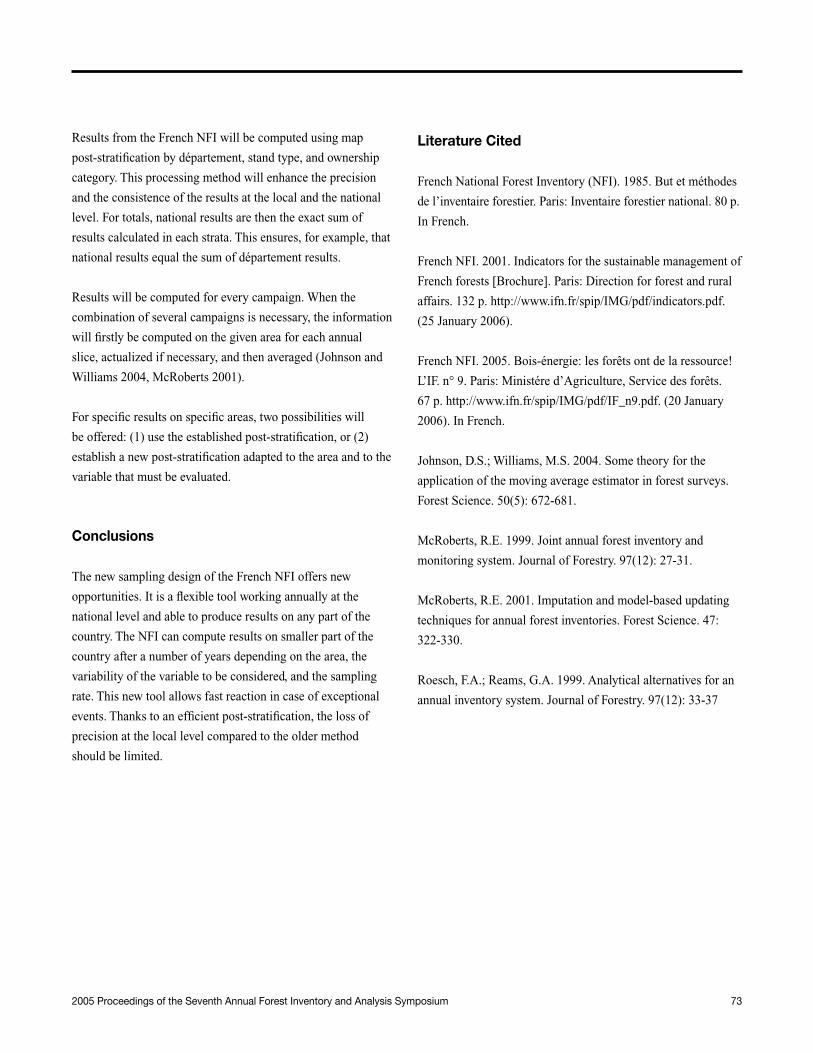
Hedges and Tree Rows
Hedges and tree rows are observed on orthophoto maps during
photointerpretation on every plot from the level 1 sample. A
transect method is used. A 1-km long line transect is centred
on each grid knot with a randomly varying orientation. The
number of intersects (fig. 9) between tree rows or hedges and
the transect is counted to evaluate the length of these alignment
in the territory.
Figure 8.—Data collected in forests on four concentric circular plots.
Figure 9.—Example of a photointerpreted transect intersecting hedges.
72 2005 Proceedings of the Seventh Annual Forest Inventory and Analysis Symposium
In the field, operations are conducted on every alignment
intersected at less than 25 m from the transect centre at a
specific level (fig. 10). The type (hedges with or without trees,
trees row with forest trees or poplar), species (tree, shrub and
bush), the length, the width, the coherence with other linear
elements (wall, river, etc.) are noted. The shape and ligneous
species are observed and the permeability is evaluated. Specific
measurements are conducted on trees at level 5 to evaluate the
volume and the increment of growing stock.
Figure 10.—Example of a tree row plot.
Estimation and Computing Methods
Every year, at every level and for all inventoried structure,
data are collected in the same way. Consequently, estimation
procedures are the same in all cases for annual results.
Results, Details, and Precision
As a result of the annual sampling plan, sufficient precision
will be obtained with data collected in 1 year on large areas
only, for example, one-fifth of France or the whole territory. It
is interesting to mention, however, that the possibility of annual
national reporting allows fast countrywide update of the results
in case of major disaster. It also gives the possibility to follow
regularly the evolution of forest and other wooded areas and to
highlight general trends.
Results can be obtained at a more local level and/or with more
details using observations from several consecutive annual
campaigns. A general estimation shows that regionwide results
are available in 3 to 4 years. For the département level, at least
8 years of survey may be required, depending on the variable
and the forest area.
Geographical Restitution Unit
With a systematic sampling design, the number of plots in a
studied area is directly related to its size. Results will be more
precise on larger areas. If data are required on small areas, two
possibilities are offered by the new sampling design: (1) wait
until enough data is gathered to compute the results, or (2) in-
crease the level of annual collection for data that must be better
evaluated in a given area.
The precision of the evaluation of a variable is also related
to its variability in a given domain. This statistical property
is interesting, because areas where less variability for some
variables is expected can be delimited. It leads to the possibility
of using post-stratification to enhance the precision of the
results.
Computation Principle: A Yearly Computation Using Post-
stratification
The French NFI maps forests and moorlands. In its Geographic
Information System, the limits of administrative units such
as département and ownership are also integrated. These are
pieces of information that can be used to compute the results.
Firstly, at the département or the region level, decisions
to develop and encourage specific sylvicultures are taken.
Secondly, the French national forestry board manages public
forests differently if it is state forest or other public forest.
Private foresters also have another behaviour. Thirdly, the forest
type is determined on stand types, main species, structure, etc.
As a result, in stands located in the same area, with the same
forest type and ownership, less variability is expected.
2005 Proceedings of the Seventh Annual Forest Inventory and Analysis Symposium 73
Results from the French NFI will be computed using map
post-stratification by département, stand type, and ownership
category. This processing method will enhance the precision
and the consistence of the results at the local and the national
level. For totals, national results are then the exact sum of
results calculated in each strata. This ensures, for example, that
national results equal the sum of département results.
Results will be computed for every campaign. When the
combination of several campaigns is necessary, the information
will firstly be computed on the given area for each annual
slice, actualized if necessary, and then averaged (Johnson and
Williams 2004, McRoberts 2001).
For specific results on specific areas, two possibilities will
be offered: (1) use the established post-stratification, or (2)
establish a new post-stratification adapted to the area and to the
variable that must be evaluated.
Conclusions
The new sampling design of the French NFI offers new
opportunities. It is a flexible tool working annually at the
national level and able to produce results on any part of the
country. The NFI can compute results on smaller part of the
country after a number of years depending on the area, the
variability of the variable to be considered, and the sampling
rate. This new tool allows fast reaction in case of exceptional
events. Thanks to an efficient post-stratification, the loss of
precision at the local level compared to the older method
should be limited.
Literature Cited
French National Forest Inventory (NFI). 1985. But et méthodes
de l’inventaire forestier. Paris: Inventaire forestier national. 80 p.
In French.
French NFI. 2001. Indicators for the sustainable management of
French forests [Brochure]. Paris: Direction for forest and rural
affairs. 132 p. http://www.ifn.fr/spip/IMG/pdf/indicators.pdf.
(25 January 2006).
French NFI. 2005. Bois-énergie: les forêts ont de la ressource!
L’IF. n� 9. Paris: Ministére d’Agriculture, Service des forêts.
67 p. http://www.ifn.fr/spip/IMG/pdf/IF_n9.pdf. (20 January
2006). In French.
Johnson, D.S.; Williams, M.S. 2004. Some theory for the
application of the moving average estimator in forest surveys.
Forest Science. 50(5): 672-681.
McRoberts, R.E. 1999. Joint annual forest inventory and
monitoring system. Journal of Forestry. 97(12): 27-31.
McRoberts, R.E. 2001. Imputation and model-based updating
techniques for annual forest inventories. Forest Science. 47:
322-330.
Roesch, F.A.; Reams, G.A. 1999. Analytical alternatives for an
annual inventory system. Journal of Forestry. 97(12): 33-37