Embed Size (px)
Citation preview

DNA Tribes® Global Survey (STR)
All contents © 2006-2013 DNA Tribes. DNA Tribes®. DNA Tribes patented analysis is available exclusively from DNA Tribes. U.S. PAT. NO. 8,285,486. All rights reserved.
DNA Tribes® Global Survey July 1, 2013 Page 1 of 14
Web: www.dnatribes.com; Email: [email protected]; Facebook: facebook.com/DNAtribes
Mail: DNA Tribes, P.O. Box 735, Arlington, VA 22216
A New Genetic Map of Living Humans in Interconnected World Regions
E. Valaitis1 and L. Martin Updated 7/1/2013
Table of Contents
Introduction ....................................................................................................................... 2
About DNA Tribes® .......................................................................................................... 2
What are DNA Tribes® World Regions? ........................................................................ 2
How are DNA Tribes® World Regions Identified? .................................................. 2
How are World Regions Related? ............................................................................. 3
Genetic Affiliations of Individuals within World Regions ............................................ 5
Native American Regions ........................................................................................... 6
West Eurasian (European and Near Eastern) Regions ........................................... 7
Sub-Saharan African and Central and South Asian Regions ................................. 8
East Asian and Pacific Populations ........................................................................... 9
DNA Tribes® Europa: A More Detailed Analysis of Europe ..................................... 10
A Genetic Family Tree of European Sub-Regions ................................................. 11
Individual Genetic Affiliations within European Sub-Regions ............................ 12
Further Discussion: Regions, Not Races ....................................................................... 13
1 Dr. Eduardas Valaitis received his Doctorate in Statistics from Yale University, New Haven, CT.
DNA Tribes® Global Survey (STR)
All contents © 2006-2013 DNA Tribes. DNA Tribes®. DNA Tribes patented analysis is available exclusively from DNA Tribes. U.S. PAT. NO. 8,285,486. All rights reserved.
DNA Tribes® Global Survey July 1, 2013 Page 2 of 14
Web: www.dnatribes.com; Email: [email protected]; Facebook: facebook.com/DNAtribes
Mail: DNA Tribes, P.O. Box 735, Arlington, VA 22216
Introduction DNA Tribes® offers a genetic ancestry analysis that measures the likelihood of an autosomal STR DNA profile of an individual occurring among world genetic regions. These world regions have been identified by Dr. Eduardas Valaitis using proprietary statistical analysis of our global DNA database of over 1,200 world populations. This study provides an overview of these world regions and genetic affiliations for individuals within them.
About DNA Tribes® DNA Tribes® specializes in genetic ancestry analysis, including both geographical analysis of world populations and the comparison of individuals to living populations and world regions. DNA Tribes®’ proprietary analysis incorporates statistical techniques developed by Dr. Eduardas Valaitis, who received his Doctorate in Statistics from Yale University in 2005. Dr. Valaitis’ background includes extensive work in multivariate analysis and classification, which involves identifying mathematical structure present within large and complex datasets. This expertise allows DNA Tribes® to perform a uniquely detailed and comprehensive analysis of world populations to identify genetic structure on an objective mathematical basis. What are DNA Tribes® World Regions? Each world region represents a unique genetic family within the human species shaped by shared history and geography. These regions are characterized by distinctive patterns of allele frequencies across the studied STR loci. Although all humans are connected by ancient common origins, each of these genetic groupings shares a unique relationship due to more intense and persistent contacts within a geographical area. DNA Tribes® offers a detailed analysis that distinguishes these genetic families on an objective mathematical basis without relying on presumed racial or ethnic categories. How are DNA Tribes® World Regions Identified? Instead of relying on socially constructed racial or ethnic divisions, DNA Tribes® defines world regions using objective mathematical criteria. A proprietary statistical method is applied to over 1,200 individual population samples around the world to identify groups of populations with shared genetic characteristics. These genetic groups are then plotted on a map and named according to the geographical regions they occupy.
DNA Tribes® Global Survey (STR)
All contents © 2006-2013 DNA Tribes. DNA Tribes®. DNA Tribes patented analysis is available exclusively from DNA Tribes. U.S. PAT. NO. 8,285,486. All rights reserved.
DNA Tribes® Global Survey July 1, 2013 Page 3 of 14
Web: www.dnatribes.com; Email: [email protected]; Facebook: facebook.com/DNAtribes
Mail: DNA Tribes, P.O. Box 735, Arlington, VA 22216
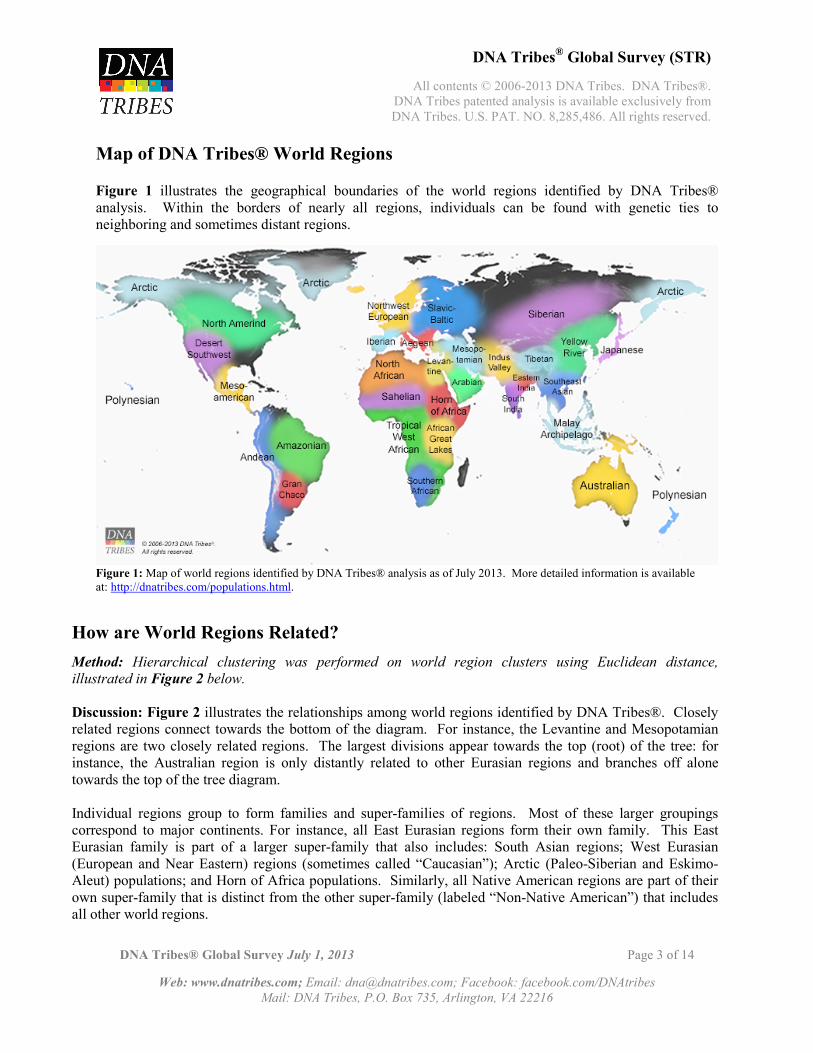
Map of DNA Tribes® World Regions Figure 1 illustrates the geographical boundaries of the world regions identified by DNA Tribes® analysis. Within the borders of nearly all regions, individuals can be found with genetic ties to neighboring and sometimes distant regions.
Figure 1: Map of world regions identified by DNA Tribes® analysis as of July 2013. More detailed information is available at: http://dnatribes.com/populations.html.
How are World Regions Related? Method: Hierarchical clustering was performed on world region clusters using Euclidean distance, illustrated in Figure 2 below. Discussion: Figure 2 illustrates the relationships among world regions identified by DNA Tribes®. Closely related regions connect towards the bottom of the diagram. For instance, the Levantine and Mesopotamian regions are two closely related regions. The largest divisions appear towards the top (root) of the tree: for instance, the Australian region is only distantly related to other Eurasian regions and branches off alone towards the top of the tree diagram. Individual regions group to form families and super-families of regions. Most of these larger groupings correspond to major continents. For instance, all East Eurasian regions form their own family. This East Eurasian family is part of a larger super-family that also includes: South Asian regions; West Eurasian (European and Near Eastern) regions (sometimes called “Caucasian”); Arctic (Paleo-Siberian and Eskimo-Aleut) populations; and Horn of Africa populations. Similarly, all Native American regions are part of their own super-family that is distinct from the other super-family (labeled “Non-Native American”) that includes all other world regions.

DNA Tribes® Global Survey (STR)
All contents © 2006-2013 DNA Tribes. DNA Tribes®. DNA Tribes patented analysis is available exclusively from DNA Tribes. U.S. PAT. NO. 8,285,486. All rights reserved.
DNA Tribes® Global Survey July 1, 2013 Page 4 of 14
Web: www.dnatribes.com; Email: [email protected]; Facebook: facebook.com/DNAtribes
Mail: DNA Tribes, P.O. Box 735, Arlington, VA 22216
Figure 2: Neighbor joining tree illustrating the relationships among world regions based on Euclidean distance. The relationships illustrated in Figure 2 are the cumulative product of (1) genetic contact within each region created by local migration, local intermarriage, and gradual diffusion within regions; and (2) relative isolation from other regions. Natural features that make these contacts easier or more difficult can determine regional genetic relationships: waterways, mountain regions, fertile plains, and continental borders shape the pathways of human interactions that create both cultural areas and genetic regions. For instance, the historical difficulty of travel between Eurasia and the Americas corresponds to the great distance between the Native American super-family and all other world regions.
DNA Tribes® Global Survey (STR)
All contents © 2006-2013 DNA Tribes. DNA Tribes®. DNA Tribes patented analysis is available exclusively from DNA Tribes. U.S. PAT. NO. 8,285,486. All rights reserved.
DNA Tribes® Global Survey July 1, 2013 Page 5 of 14
Web: www.dnatribes.com; Email: [email protected]; Facebook: facebook.com/DNAtribes
Mail: DNA Tribes, P.O. Box 735, Arlington, VA 22216
Genetic Affiliations of Individuals within World Regions Method: Observed allele frequency data was used to simulate 2,000 individual genetic profiles for the studied world regions. Each simulated profile was processed by the DNA Tribes® algorithm, which measured the occurrence frequency of each simulated individual’s 26 marker STR profile in each world region. The highest ranking regional match was then identified for each individual. These primary matches were then tallied for all simulated profiles to produce regional affiliation proportions. Individuals within each genetic region obtain a spectrum of regional genetic affinities. The study on the following pages illustrates the composition of individuals within each genetic world region:
Native American Regions ..................................................................................... 7
West Eurasian (European and Near Eastern) Regions ..................................... 8
Sub-Saharan African and Central and South Asian Regions .......................... 9
East Asian and Pacific Regions .......................................................................... 10

DNA Tribes® Global Survey (STR)
All contents © 2006-2013 DNA Tribes. DNA Tribes®. DNA Tribes patented analysis is available exclusively from DNA Tribes. U.S. PAT. NO. 8,285,486. All rights reserved.
DNA Tribes® Global Survey July 1, 2013 Page 6 of 14
Web: www.dnatribes.com; Email: [email protected]; Facebook: facebook.com/DNAtribes
Mail: DNA Tribes, P.O. Box 735, Arlington, VA 22216
Native American Regions
0.0%
20.0%
40.0%
60.0%
80.0%
100.0%
Arctic
North Amerindian
Desert Southwest
Mesoamerican
Andean
Gran Chaco
Amazonian
Mestizo
Other

DNA Tribes® Global Survey (STR)
All contents © 2006-2013 DNA Tribes. DNA Tribes®. DNA Tribes patented analysis is available exclusively from DNA Tribes. U.S. PAT. NO. 8,285,486. All rights reserved.
DNA Tribes® Global Survey July 1, 2013 Page 7 of 14
Web: www.dnatribes.com; Email: [email protected]; Facebook: facebook.com/DNAtribes
Mail: DNA Tribes, P.O. Box 735, Arlington, VA 22216
West Eurasian (European and Near Eastern) Regions
0.0%
10.0%
20.0%
30.0%
40.0%
50.0%
60.0%
70.0%
80.0%
90.0%
100.0%
North African
Iberian
Northwest European
Slavic-Baltic
Aegean
Levantine
Mesopotamian
Arabian
Horn of Africa
Indus Valley
Mestizo
Other
DNA Tribes® Global Survey (STR)
All contents © 2006-2013 DNA Tribes. DNA Tribes®. DNA Tribes patented analysis is available exclusively from DNA Tribes. U.S. PAT. NO. 8,285,486. All rights reserved.
DNA Tribes® Global Survey July 1, 2013 Page 8 of 14
Web: www.dnatribes.com; Email: [email protected]; Facebook: facebook.com/DNAtribes
Mail: DNA Tribes, P.O. Box 735, Arlington, VA 22216
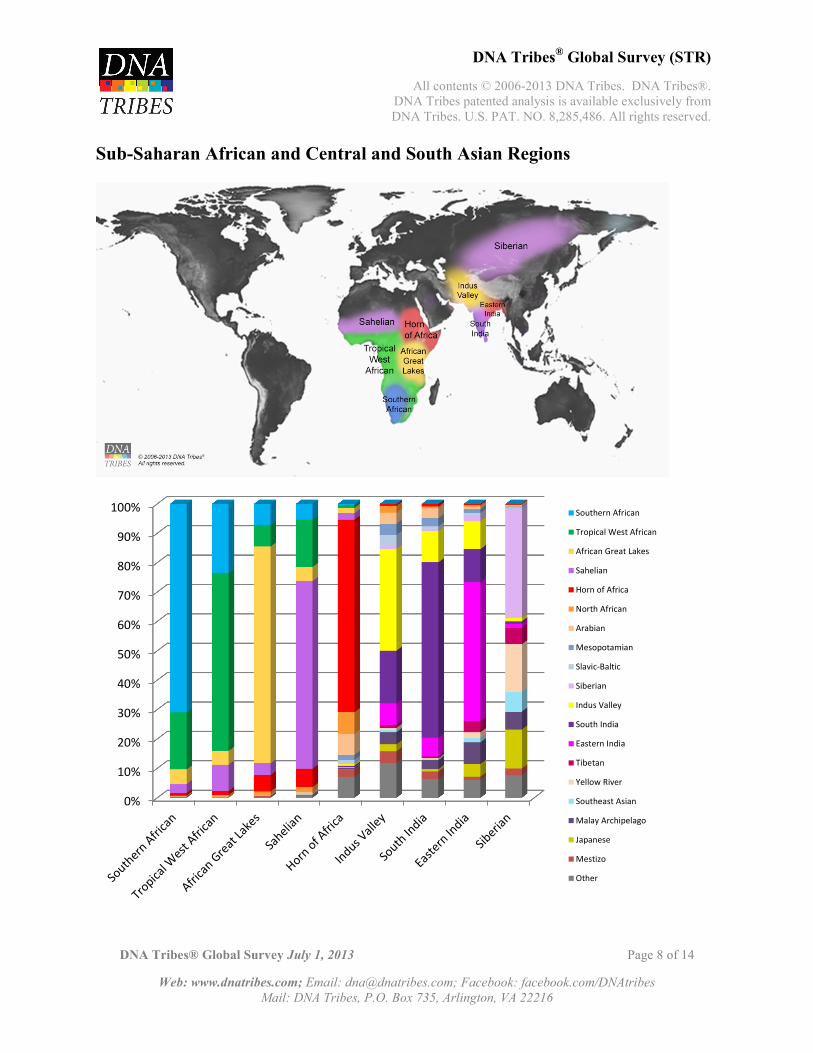
Sub-Saharan African and Central and South Asian Regions
0%
10%
20%
30%
40%
50%
60%
70%
80%
90%
100% Southern African
Tropical West African
African Great Lakes
Sahelian
Horn of Africa
North African
Arabian
Mesopotamian
Slavic-Baltic
Siberian
Indus Valley
South India
Eastern India
Tibetan
Yellow River
Southeast Asian
Malay Archipelago
Japanese
Mestizo
Other
DNA Tribes® Global Survey (STR)
All contents © 2006-2013 DNA Tribes. DNA Tribes®. DNA Tribes patented analysis is available exclusively from DNA Tribes. U.S. PAT. NO. 8,285,486. All rights reserved.
DNA Tribes® Global Survey July 1, 2013 Page 9 of 14
Web: www.dnatribes.com; Email: [email protected]; Facebook: facebook.com/DNAtribes
Mail: DNA Tribes, P.O. Box 735, Arlington, VA 22216
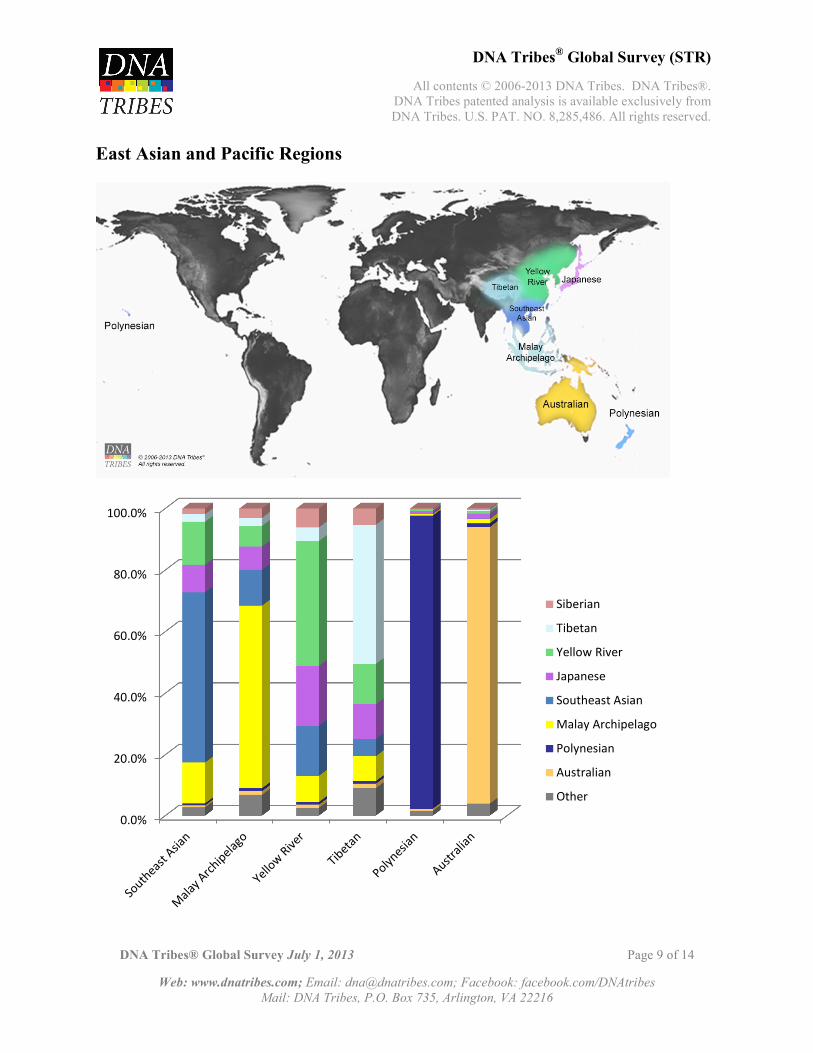
East Asian and Pacific Regions
0.0%
20.0%
40.0%
60.0%
80.0%
100.0%
Siberian
Tibetan
Yellow River
Japanese
Southeast Asian
Malay Archipelago
Polynesian
Australian
Other
DNA Tribes® Global Survey (STR)
All contents © 2006-2013 DNA Tribes. DNA Tribes®. DNA Tribes patented analysis is available exclusively from DNA Tribes. U.S. PAT. NO. 8,285,486. All rights reserved.
DNA Tribes® Global Survey July 1, 2013 Page 10 of 14
Web: www.dnatribes.com; Email: [email protected]; Facebook: facebook.com/DNAtribes
Mail: DNA Tribes, P.O. Box 735, Arlington, VA 22216
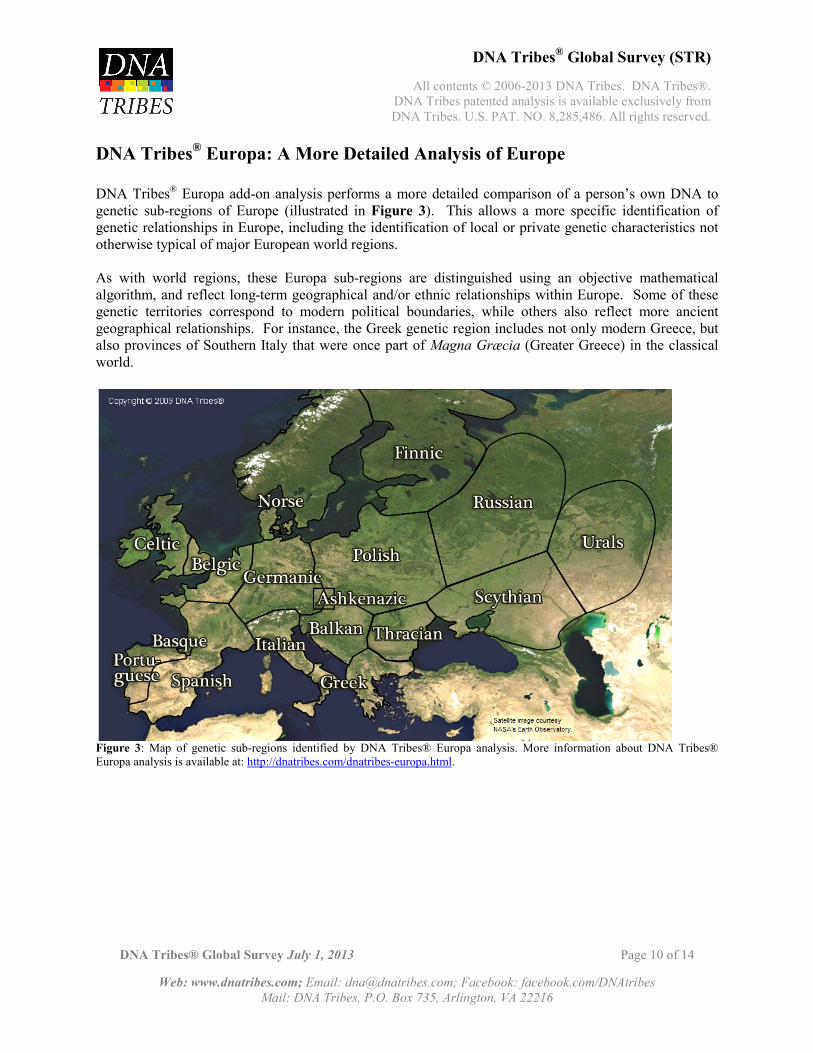
DNA Tribes® Europa: A More Detailed Analysis of Europe DNA Tribes® Europa add-on analysis performs a more detailed comparison of a person’s own DNA to genetic sub-regions of Europe (illustrated in Figure 3). This allows a more specific identification of genetic relationships in Europe, including the identification of local or private genetic characteristics not otherwise typical of major European world regions. As with world regions, these Europa sub-regions are distinguished using an objective mathematical algorithm, and reflect long-term geographical and/or ethnic relationships within Europe. Some of these genetic territories correspond to modern political boundaries, while others also reflect more ancient geographical relationships. For instance, the Greek genetic region includes not only modern Greece, but also provinces of Southern Italy that were once part of Magna Græcia (Greater Greece) in the classical world.
Figure 3: Map of genetic sub-regions identified by DNA Tribes® Europa analysis. More information about DNA Tribes® Europa analysis is available at: http://dnatribes.com/dnatribes-europa.html.
DNA Tribes® Global Survey (STR)
All contents © 2006-2013 DNA Tribes. DNA Tribes®. DNA Tribes patented analysis is available exclusively from DNA Tribes. U.S. PAT. NO. 8,285,486. All rights reserved.
DNA Tribes® Global Survey July 1, 2013 Page 11 of 14
Web: www.dnatribes.com; Email: [email protected]; Facebook: facebook.com/DNAtribes
Mail: DNA Tribes, P.O. Box 735, Arlington, VA 22216
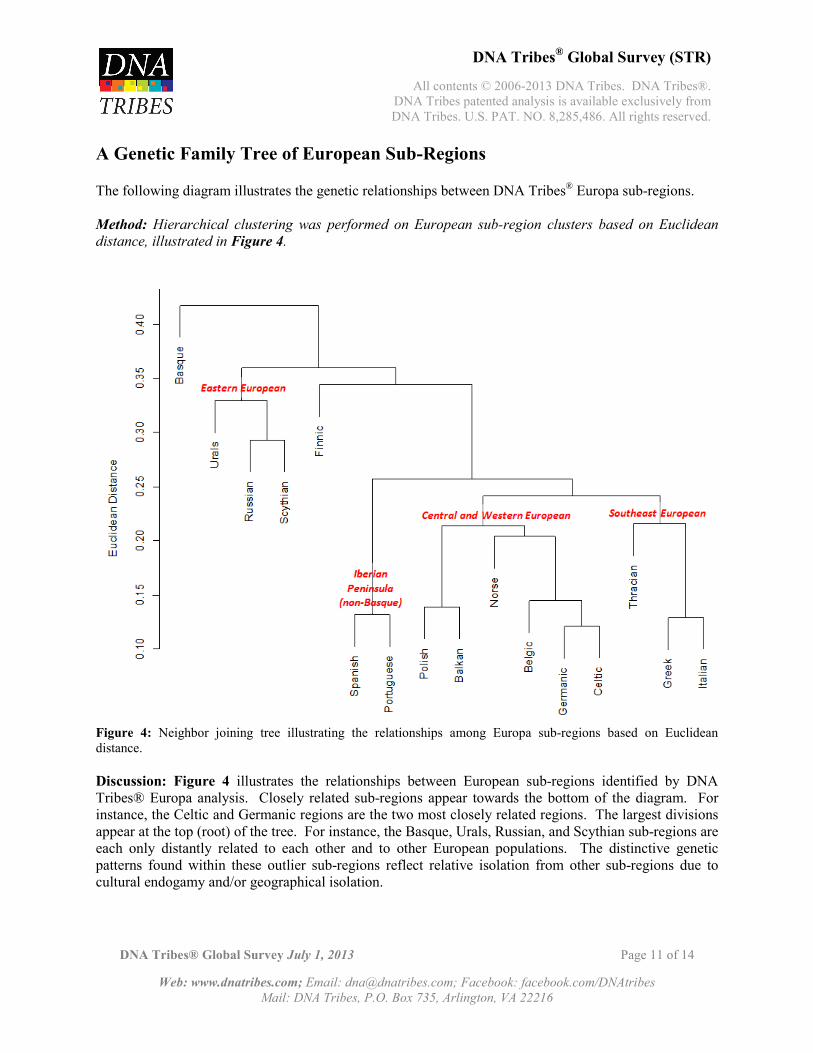
A Genetic Family Tree of European Sub-Regions The following diagram illustrates the genetic relationships between DNA Tribes® Europa sub-regions. Method: Hierarchical clustering was performed on European sub-region clusters based on Euclidean distance, illustrated in Figure 4.
Figure 4: Neighbor joining tree illustrating the relationships among Europa sub-regions based on Euclidean distance. Discussion: Figure 4 illustrates the relationships between European sub-regions identified by DNA Tribes® Europa analysis. Closely related sub-regions appear towards the bottom of the diagram. For instance, the Celtic and Germanic regions are the two most closely related regions. The largest divisions appear at the top (root) of the tree. For instance, the Basque, Urals, Russian, and Scythian sub-regions are each only distantly related to each other and to other European populations. The distinctive genetic patterns found within these outlier sub-regions reflect relative isolation from other sub-regions due to cultural endogamy and/or geographical isolation.
DNA Tribes® Global Survey (STR)
All contents © 2006-2013 DNA Tribes. DNA Tribes®. DNA Tribes patented analysis is available exclusively from DNA Tribes. U.S. PAT. NO. 8,285,486. All rights reserved.
DNA Tribes® Global Survey July 1, 2013 Page 12 of 14
Web: www.dnatribes.com; Email: [email protected]; Facebook: facebook.com/DNAtribes
Mail: DNA Tribes, P.O. Box 735, Arlington, VA 22216
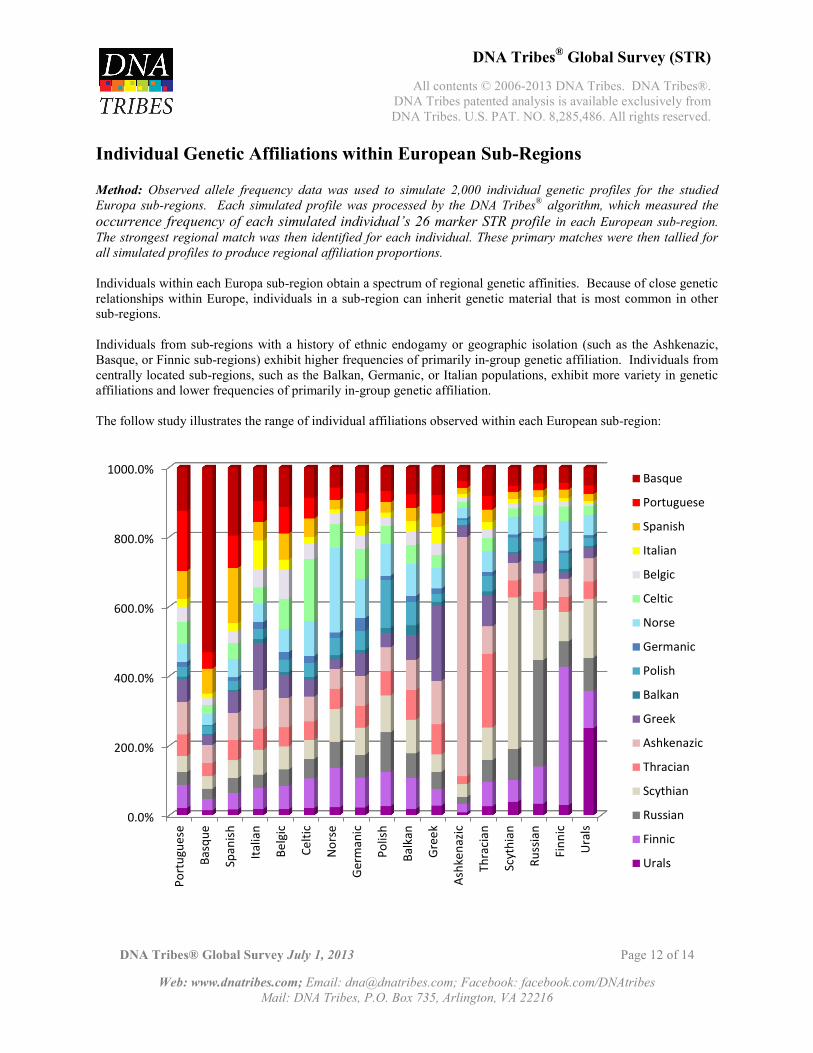
Individual Genetic Affiliations within European Sub-Regions
Method: Observed allele frequency data was used to simulate 2,000 individual genetic profiles for the studied Europa sub-regions. Each simulated profile was processed by the DNA Tribes® algorithm, which measured the occurrence frequency of each simulated individual’s 26 marker STR profile in each European sub-region. The strongest regional match was then identified for each individual. These primary matches were then tallied for all simulated profiles to produce regional affiliation proportions. Individuals within each Europa sub-region obtain a spectrum of regional genetic affinities. Because of close genetic relationships within Europe, individuals in a sub-region can inherit genetic material that is most common in other sub-regions. Individuals from sub-regions with a history of ethnic endogamy or geographic isolation (such as the Ashkenazic, Basque, or Finnic sub-regions) exhibit higher frequencies of primarily in-group genetic affiliation. Individuals from centrally located sub-regions, such as the Balkan, Germanic, or Italian populations, exhibit more variety in genetic affiliations and lower frequencies of primarily in-group genetic affiliation. The follow study illustrates the range of individual affiliations observed within each European sub-region:
0.0%
200.0%
400.0%
600.0%
800.0%
1000.0%
Port
ugue
se
Basq
ue
Span
ish
Italia
n
Belg
ic
Celti
c
Nor
se
Ger
man
ic
Polis
h
Balk
an
Gre
ek
Ashk
enaz
ic
Thra
cian
Scyt
hian
Russ
ian
Finn
ic
Ura
ls
Basque
Portuguese
Spanish
Italian
Belgic
Celtic
Norse
Germanic
Polish
Balkan
Greek
Ashkenazic
Thracian
Scythian
Russian
Finnic
Urals
DNA Tribes® Global Survey (STR)
All contents © 2006-2013 DNA Tribes. DNA Tribes®. DNA Tribes patented analysis is available exclusively from DNA Tribes. U.S. PAT. NO. 8,285,486. All rights reserved.
DNA Tribes® Global Survey July 1, 2013 Page 13 of 14
Web: www.dnatribes.com; Email: [email protected]; Facebook: facebook.com/DNAtribes
Mail: DNA Tribes, P.O. Box 735, Arlington, VA 22216
Further Discussion: Regions, Not Races
For several decades, scientists have known that geographical variation exists within the human species. People around the world share genetic traits with their neighbors that distinguish them from peoples living further away. However, scientists have also known that 3-5 simple racial categories are insufficient to describe the genetic diversity of living human populations. Moreover, scientists have documented that genetic variation within ethnic groups or races exceeds the differences between groups. The complex empirical reality of world populations that are overlapping and yet distinct implies the question: how can the genetic landscape of mankind be described, and how can individuals meaningfully be compared to entire populations? DNA Tribes® provides a novel answer to this question by describing the world not as an over-simplified checkerboard of racial divisions, but as a complex mosaic of overlapping world regions. Traditional anthropology once classified four races corresponding to four major continents: African, European, Asian and American. This simple system of classification dates back to the 18th century taxonomist Carolus Linnaeus and is still commonly used when describing ethnic groups and individuals. Certain areas of each continent are traditionally designated as representatives of each race, and other regions are assumed to be mixed between these presumably pure areas. Since molecular DNA has provided a more objective way of charting human relationships, scientists have known that while inter-population differences do exist, traditionally defined racial groups do not exist as exclusive or pure genetic units. However, interpretations of molecular DNA continue to use a traditional racial scheme in the absence of a more fully descriptive global model. The genetic differences between peoples traditionally identified as Black, White, Asian, and American Indian in North America are great enough to allow a rough estimate of an individual’s “percentage” membership in each racial group. This approach has been used for medical and police applications as well as for individuals interested in learning more about their genetic ancestry. However, this racial scheme creates problems when used outside of the core regions ancestral to modern North Americans. For instance, a Subcontinental Indian or Samoan can be classified as some percentage of American Indian, European, East Asian and Sub-Saharan Africa, but the result would lack meaning. More significantly, technical reliance on a simplified racial admixture model of ancestry potentially misses an opportunity to expand the scientific and popular understanding of human genetic relationships on an empirical basis. In addition, gene flow between human populations has been continuous throughout most of history. Many ethnic crossings now thought of as admixture are reiterating crossings that have taken place in history and prehistory. For instance, gene flow between Sub-Saharan African and Caucasian (European and Near Eastern) populations has taken place in areas in and near the Sahara Desert (including the North African and East African genetic regions) throughout history. The blending of African and European peoples that has taken place since the colonial era in North, Central and South America is usually thought of as a novel crossing, but from a broader perspective is recapitulating an ancient pattern of trans-Saharan gene flow. In contrast, the combination of American Indian and European and/or African populations is a novel type of crossing without a known historical precedent, and characterizes the relatively young Mestizo world region.
DNA Tribes® Global Survey (STR)
All contents © 2006-2013 DNA Tribes. DNA Tribes®. DNA Tribes patented analysis is available exclusively from DNA Tribes. U.S. PAT. NO. 8,285,486. All rights reserved.
DNA Tribes® Global Survey July 1, 2013 Page 14 of 14
Web: www.dnatribes.com; Email: [email protected]; Facebook: facebook.com/DNAtribes
Mail: DNA Tribes, P.O. Box 735, Arlington, VA 22216
As the global survey in the preceding pages illustrates, the four-fold racial division is insufficient to fully describe the diversity of the human species. The world regions identified by DNA Tribes® offer a novel approach to answering the question by objectively identifying groups of populations based on a statistical analysis of neutral genetic markers. The result is a network of world regions each characterized by shared history and genetic patterns. The geographical outlines of these regions echo the borders of countless empires, trade networks and kin groups. Most regions reflect processes that predate all known ethnic, linguistic, or political forms, and do not reflect any single historical event, such as a single empire or migration. Instead, they describe the cumulative outcome of all historical and prehistoric interactions. DNA Tribes® Digest articles discuss DNA Tribes® original empirical analysis of world genetic relationships on an ongoing basis. Past issues of DNA Tribes® Digest are archived online at: http://dnatribes.com/library.html.