Embed Size (px)
Citation preview

Looking Ahead 103
Three Industrial Revolutions and Impact on GDP per Capita Growth(In Average Annual Percent Growth over 25 Year Periods, 1775-2010)
A NEW INDUSTRIAL REVOLUTION…THIS TIME DIGITAL
12
THE GLOBAL ECONOMY IS UNDERGOING A THIRD WAVE OF INVENTION, this one digital, whose effect on living standards is yet to be seen
The world has gained from the recent “digital revolution”, but the innovations have also disrupted traditional growth patterns. Historically, industrial revolutions have produced losers as well as winners, and it has often taken time to see how different stakeholders would fare. Among major economies including the US and the UK, growth in recent decades has slowed compared to the past century averages, a reminder of the harsh nature of industrial revolutions
Sources: Maddison Project; “The third great wave”, Special Report: The World Economy, The Economist, Oct. 2014
1825 1850 18751775 1800 1900 1925 1950 1975 2000-2010
SteamEngine
SteamLocomotive
ElectricalGenerator Automobile
WorldWideWeb
Radio
Mobile Phone
MachineIntelligence
PCLight Bulb
First (1760-1840)
Second(1870-1914)
Third(1970s - Ongoing)
0.0
0.5
1.0
1.5
2.0
2.5
USUK Industrial Revolutions
Post-Industrial Revolution Growth Period
Key Inventions
LA_PublicVersion(Bleed3175)_ENG_V22.indd 103 10/28/15 1:28 PM
Looking Ahead 104
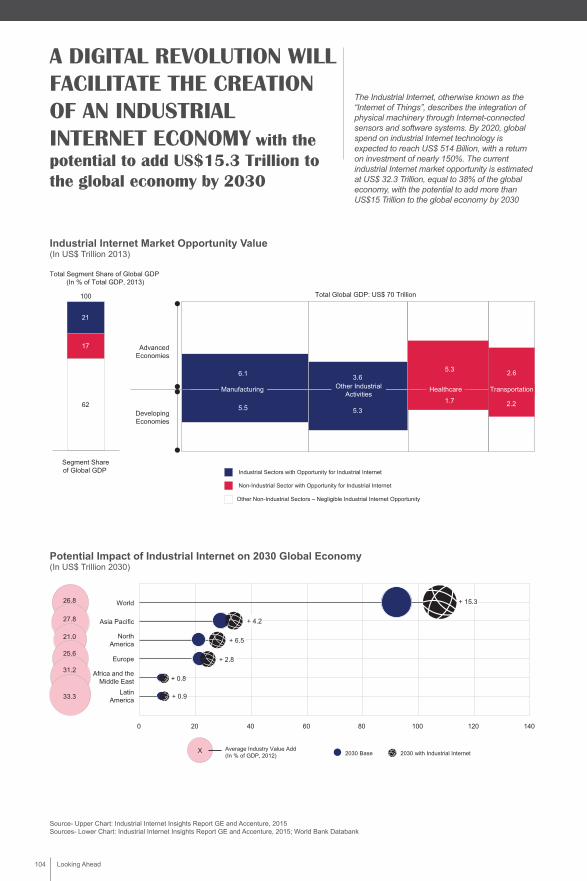
A DIGITAL REVOLUTION WILL FACILITATE THE CREATION OF AN INDUSTRIAL INTERNET ECONOMY with the potential to add US$15.3 Trillion to the global economy by 2030
The Industrial Internet, otherwise known as the “Internet of Things”, describes the integration of physical machinery through Internet-connected sensors and software systems. By 2020, global spend on industrial Internet technology is expected to reach US$ 514 Billion, with a return on investment of nearly 150%. The current industrial Internet market opportunity is estimated at US$ 32.3 Trillion, equal to 38% of the global economy, with the potential to add more than US$15 Trillion to the global economy by 2030
Source- Upper Chart: Industrial Internet Insights Report GE and Accenture, 2015Sources- Lower Chart: Industrial Internet Insights Report GE and Accenture, 2015; World Bank Databank
Industrial Internet Market Opportunity Value (In US$ Trillion 2013)
Potential Impact of Industrial Internet on 2030 Global Economy(In US$ Trillion 2030)
Industrial Sectors with Opportunity for Industrial Internet
Non-Industrial Sector with Opportunity for Industrial Internet
Other Non-Industrial Sectors – Negligible Industrial Internet Opportunity
6.1 3.6 2.65.3
2.21.75.5 5.3Developing
Economies
AdvancedEconomies
Manufacturing Other IndustrialActivities
Healthcare Transportation
Total Global GDP: US$ 70 Trillion
Total Segment Share of Global GDP (In % of Total GDP, 2013)
62
17
21
Segment Shareof Global GDP
100
0 20 40 60 80 100 120 140
+ 15.3
+ 4.2
+ 6.5
+ 2.8
+ 0.8
+ 0.9
World
Asia Pacific
Europe
Africa and theMiddle East
NorthAmerica
LatinAmerica
26.8
33.3
27.8
21.0
25.6
31.2
2030 with Industrial Internet2030 BaseAverage Industry Value Add (In % of GDP, 2012)
X
LA_PublicVersion(Bleed3175)_ENG_V22.indd 104 10/28/15 1:28 PM
Looking Ahead 105
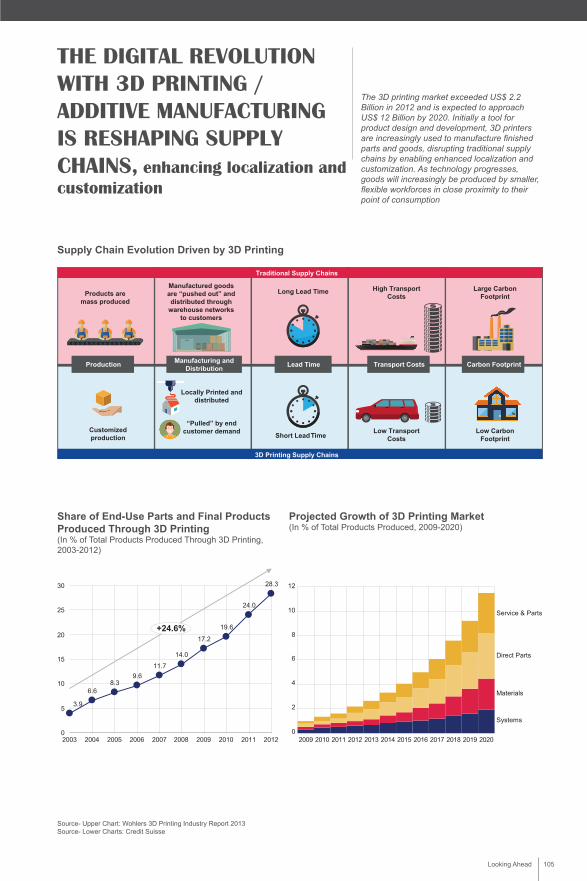
THE DIGITAL REVOLUTION WITH 3D PRINTING / ADDITIVE MANUFACTURING IS RESHAPING SUPPLY CHAINS, enhancing localization and customization
The 3D printing market exceeded US$ 2.2 Billion in 2012 and is expected to approach US$ 12 Billion by 2020. Initially a tool for product design and development, 3D printers are increasingly used to manufacture finished parts and goods, disrupting traditional supply chains by enabling enhanced localization and customization. As technology progresses, goods will increasingly be produced by smaller, flexible workforces in close proximity to their point of consumption
Supply Chain Evolution Driven by 3D Printing
Share of End-Use Parts and Final Products Produced Through 3D Printing(In % of Total Products Produced Through 3D Printing, 2003-2012)
Projected Growth of 3D Printing Market(In % of Total Products Produced, 2009-2020)
Source- Upper Chart: Wohlers 3D Printing Industry Report 2013Source- Lower Charts: Credit Suisse
Long Lead Time
Short Lead Time
Lead Time
High TransportCosts
Low TransportCosts
Transport Costs
Large CarbonFootprint
Low CarbonFootprint
Carbon Footprint
Products aremass produced
Customizedproduction
Production
Manufactured goodsare “pushed out” anddistributed through
warehouse networksto customers
Locally Printed anddistributed
“Pulled” by endcustomer demand
Manufacturing andDistribution
Traditional Supply Chains
3D Printing Supply Chains
0
5
10
15
20
25
30
2003 2004 2005 2006 2007 2008 2009 2010 2011 2012
+24.6%
28.3
24.0
19.6
17.2
14.0
11.79.6
8.36.6
3.9
0
2
4
8
10
6
12
20192018201720162015201420132012201120102009 2020
Service & Parts
Direct Parts
Materials
Systems
LA_PublicVersion(Bleed3175)_ENG_V22.indd 105 10/28/15 1:28 PM
Looking Ahead 106
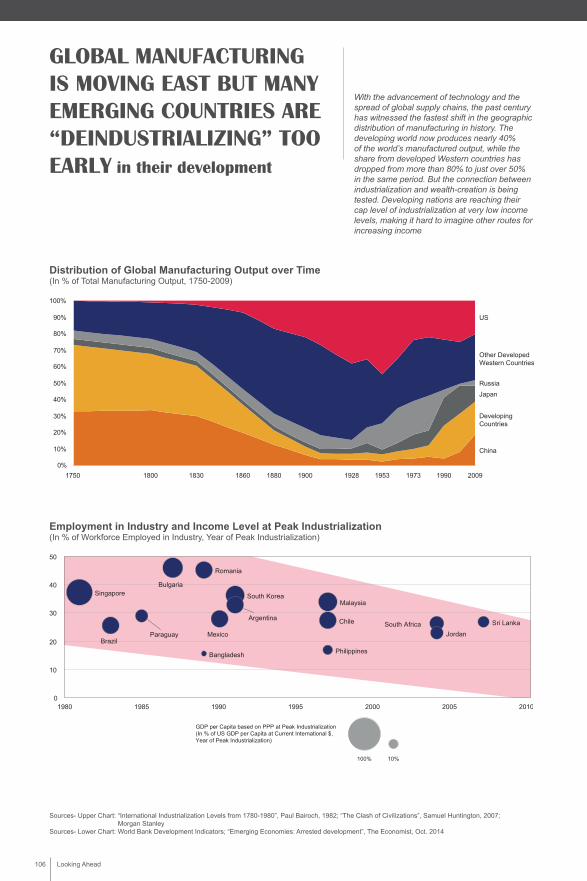
GLOBAL MANUFACTURING IS MOVING EAST BUT MANY EMERGING COUNTRIES ARE “DEINDUSTRIALIZING” TOO EARLY in their development
With the advancement of technology and the spread of global supply chains, the past century has witnessed the fastest shift in the geographic distribution of manufacturing in history. The developing world now produces nearly 40% of the world’s manufactured output, while the share from developed Western countries has dropped from more than 80% to just over 50% in the same period. But the connection between industrialization and wealth-creation is being tested. Developing nations are reaching their cap level of industrialization at very low income levels, making it hard to imagine other routes for increasing income
Distribution of Global Manufacturing Output over Time(In % of Total Manufacturing Output, 1750-2009)
Employment in Industry and Income Level at Peak Industrialization(In % of Workforce Employed in Industry, Year of Peak Industrialization)
Sources- Upper Chart: “International Industrialization Levels from 1780-1980”, Paul Bairoch, 1982; “The Clash of Civilizations”, Samuel Huntington, 2007; Morgan Stanley
Sources- Lower Chart: World Bank Development Indicators; “Emerging Economies: Arrested development”, The Economist, Oct. 2014
1980 1990 20102000 200519951985
100% 10%
GDP per Capita based on PPP at Peak Industrialization(In % of US GDP per Capita at Current International $,Year of Peak Industrialization)
0
10
20
30
40
50
South Africa
Singapore
Romania
Paraguay
Philippines
Malaysia
Mexico
Sri Lanka
South Korea
Jordan
Chile
Brazil
Bulgaria
Bangladesh
Argentina
0%
10%
20%
30%
40%
50%
60%
70%
80%
90%
100%
China
Japan
Russia
US
20091990197319531928190018801860183018001750
Other DevelopedWestern Countries
DevelopingCountries
LA_PublicVersion(Bleed3175)_ENG_V22.indd 106 10/28/15 1:28 PM
Looking Ahead 107
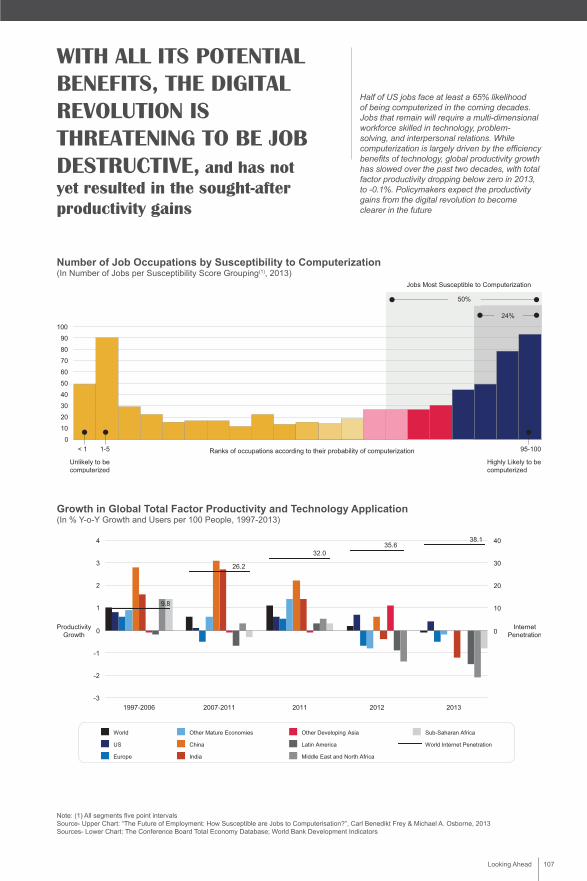
WITH ALL ITS POTENTIAL BENEFITS, THE DIGITAL REVOLUTION IS THREATENING TO BE JOB DESTRUCTIVE, and has not yet resulted in the sought-after productivity gains
Half of US jobs face at least a 65% likelihood of being computerized in the coming decades. Jobs that remain will require a multi-dimensional workforce skilled in technology, problem-solving, and interpersonal relations. While computerization is largely driven by the efficiency benefits of technology, global productivity growth has slowed over the past two decades, with total factor productivity dropping below zero in 2013, to -0.1%. Policymakers expect the productivity gains from the digital revolution to become clearer in the future
Number of Job Occupations by Susceptibility to Computerization(In Number of Jobs per Susceptibility Score Grouping(1), 2013)
Growth in Global Total Factor Productivity and Technology Application(In % Y-o-Y Growth and Users per 100 People, 1997-2013)
Note: (1) All segments five point intervalsSource- Upper Chart: “The Future of Employment: How Susceptible are Jobs to Computerisation?”, Carl Benedikt Frey & Michael A. Osborne, 2013Sources- Lower Chart: The Conference Board Total Economy Database; World Bank Development Indicators
0
10
20
30
40
50
60
70
80
90
100
50%
24%
Jobs Most Susceptible to Computerization
< 1 95-1001-5 Ranks of occupations according to their probability of computerization
Unlikely to becomputerized
Highly Likely to becomputerized
ProductivityGrowth
InternetPenetration
-3
-2
-1
0
1
2
3
4 40
30
20
10
0
2013201220112007-20111997-2006
9.8
26.2
32.035.6
38.1
World Internet Penetration
Sub-Saharan Africa
Middle East and North Africa
Latin America
Other Developing Asia
India
China
Other Mature Economies
Europe
US
World
LA_PublicVersion(Bleed3175)_ENG_V22.indd 107 10/28/15 1:28 PM


![From Industrial Revolution to Digital Innovation [Poster]](https://img.pdfslide.net/doc/110x75/61e4e41f2e642854c5653fe3/from-industrial-revolution-to-digital-innovation-poster.jpg)