Embed Size (px)
Citation preview
Corporate Leadership Council
A New MeasurementMandateLeveraging HR and Organizational Metricsto Enhance Corporate Performance
� Aligning Metrics with Business Goals
� Building for Flexibility
� Assigning Ownership of Metrics
� Creating Performance Incentives
� Educating the Organization About Metrics
� Leveraging IT Infrastructure
� Ensuring Metrics Deployment
© 2001 Corporate Executive Board
ii
Corporate Leadership Council
2000 Pennsylvania Avenue NW
Washington, DC 20006
Telephone: 202-777-5000
Facsimile: 202-777-5100
166 PiccadillyLondon, W1J 9EFUnited Kingdom
Telephone: +44-(0)20-7499-8700Facsimile: +44-(0)20-7499-9700
www.corporateleadershipcouncil.com
Note to Members on Confidentiality of Findings
This document has been prepared by the Corporate Executive Board for the exclusive use of its members. It contains valuable proprietaryinformation belonging to the Corporate Executive Board, and each member should make it available only to those employees and agentswho require such access in order to learn from the material provided herein and who undertake not to disclose it to third parties. In theevent that you are unwilling to assume this confidentiality obligation, please return this document and all copies in your possessionpromptly to the Corporate Executive Board.
© 2001 Corporate Executive Board Catalog no.: CLC13HJ7P
Council Staff
Project ManagerNicole Klippert
Contributing ConsultantsJulie Houghton
Piers HudsonTodd M. Safferstone
Managing DirectorMike Klein
Executive DirectorPeter Freire
Creative Solutions Group
Project LeadJessie Ann Dalrymple
Publications SpecialistsJill CampbellLisa Goffredi
Senior DirectorRobert G. Headrick
© 2001 Corporate Executive Board
iii
Table of Contents
Letter to the Membership • v
With Sincere Appreciation • vi
Introduction • 1
Chapter I: Metrics Design • 7
Step #1: Aligning Metrics with Business Goals • 9
Benchmark Practice #1: Strategic Metrics Cascade Process • 10
The strategic metrics cascade process aligns HR metrics with overall business goals bybreaking business strategy into successive layers of HR objectives and actions until it ispossible to identify detailed and specific measurement items.
Benchmark Practice #2: Six Sigma–Based KPI Template • 23
A measurement template configured at the corporate level incorporates a set of sixsigma–based business performance indicators. The HR function translates this templateinto high-level HR indicators and creates drill-down options for access to charts withinformation regarding specific metrics items.
Step #2: Building for Flexibility • 35
Benchmark Practice #3: Ongoing Metrics Alignment Protocol • 36
Designed to enable rapid adjustments of key HR metrics to changing organizationalpriorities, the ongoing metrics alignment protocol captures activities for recognizing andassessing the need for alignment as well as procedural steps for adjusting the HR system tothe changed requirements.
Chapter II: Metrics Rollout • 47
Step #3: Assigning Ownership of Metrics • 49
Benchmark Practice #4: Line-Led Workforce Measurement • 52
Business leaders jointly identify pertinent workforce indicators in line with overall HRstrategic priorities and are responsible for stewarding their unit’s performance towardachieving specific metrics targets assigned to their portfolios of responsibilities.
Step #4: Creating Performance Incentives • 61
Benchmark Practice #5: Metrics-Linked Bonus Payouts • 62
The size of bonus payouts for executives is directly linked to the performance of theirbusiness units against a portfolio of key metrics, including employee turnover and employeesatisfaction. The exact composition of the metrics portfolio varies by business unit accordingto that unit’s strategic priorities, and executives have some leeway in determining theweighting and targets associated with each metric.
* Pseudonym.
Grandis*
© 2001 Corporate Executive Board
iv
Table of Contents (continued)
Step #5: Educating the Organization About Metrics • 73
Benchmark Practice #6: Metrics E-Learning Program • 74
A multimedia, Web-based e-learning tool educates all managers and executives about theresult of the company’s annual employee survey and provides guidance for managers on howto communicate and act on those results.
Chapter III: Metrics Decision Support • 83
Step #6: Leveraging IT Infrastructure • 87
Benchmark Practice #7: HR Dashboard • 88
An online dashboard displays key HR indicators in the context of the overall businessscorecard. The dashboard offers drill-down and report-generation functionality. Users canconfigure scorecard screens according to their preferences and can run individualized reportsas desired.
Benchmark Practice #8: Transitional HR Dashboard • 96
The HR dashboard displays key HR indicators through a series of predefined, online reports.This first iteration is explicitly transitional in nature and is designed to get HR started with itsmeasurement initiative while working toward a more optimal solution.
Step #7: Ensuring Metrics Deployment • 105
Benchmark Practice #9: “Code Red” Performance Management System • 107
“Code Red” is a simple yet effective protocol for monitoring performance in HR areas criticalto the success of the business. Once a Code Red tag is assigned to a business unitunderperforming against key measures, the business unit must take action to improveperformance over a one-year period.
Benchmark Practice #10: Strategic Metrics Reporting • 114
Strategic metrics reporting involves a range of services from comprehensive monthlyinformation packs to standard reports for individual metrics and ad hoc responses to lineinformation needs. This process is conducted by a metrics analysis team that acts as adedicated information center for the business regarding all matters relating to HRmeasurement.
Metrics Showcase • 123
The metrics showcase presents a series of company scorecards and metrics reports. The showcase islocated at the Council’s Web site, http://www.corporateleadershipcouncil.com.
© 2001 Corporate Executive Board
v
Letter to the Membership
Across the past eight months, the Corporate Leadership Council has conducted an in-depthinquiry into one of the most daunting challenges facing human resources departments inorganizations around the world: how to identify and leverage metrics that will augment thecorporation’s performance.
Increasingly, many HR functions are under pressure from their CEOs to provide the businesswith accurate and pertinent workforce measures to enhance the acuity of business decisionsand to strengthen the capabilities of the entire organization.
This study comes at a time when many HR functions are just beginning to realize the fullpotential of the metrics they track, whether as a matter of routine or in response to specificinitiatives. In order to assist HR functions in configuring their metrics efforts to respondto the new, strategic measurement mandate, the Council has prepared this document,A New Measurement Mandate: Leveraging HR and Organizational Metrics to EnhanceCorporate Performance.
The Council’s effort has focused on identifying strategies for perfecting the end-to-endmeasurement process, from designing HR’s measurement system to rolling metrics out to thebusiness to embedding metrics firmly in organizational decision making. The research yields10 case studies, which, taken in their entirety, can serve as a blueprint for HR functions seekingto act on the new measurement mandate.
While the best practices profiled herein represent some of the most innovative and effectivemethods that we found in our research, the Council recognizes that they cannot capture everyobstacle that HR organizations may face in their measurement activities. HR professionalsseeking further guidance or alternative approaches to the practices and tools profiled on thefollowing pages are encouraged to contact the Council’s research team for additional researchand assistance.
The Council’s strategic research team sincerely hopes that this brief will garner further memberinput and interest in this terrain. In this regard, we look forward to receiving your feedback andextend, as always, our continuing appreciation.
Washington, D.C., and LondonJune 2001
© 2001 Corporate Executive Board
vi
With Sincere Appreciation
Special Thanks
The Corporate Leadership Council would like to express its gratitude to the followingindividuals who were especially giving of their time and insight in the development of this study:
Ms. Suzy JonesBrio Technology243 Brooklands RoadWeybridgeSurrey KT13 0RHTelephone: +44-1932-878-300Facsimile: +44-1932-878-301http://www.brio.com
Mr. Richard NeilBusiness Objects (U.K.) LimitedObjects HouseVanwall Business Park, Vanwall RoadMaidenhead, Berkshire, SL6 4UBTelephone: +44-1628-764-600Facsimile: +44-1628-764-601http://www.businessobjects.com
Mr. Nigel SinclairCognos LimitedWesterly Point, Market StreetBracknell, Berkshire, RG12 1QBUnited KingdomTelephone: +44-1344-486-668Facsimile: +44-1344-485-124http://www.cognos.com
© 2001 Corporate Executive Board
vii
Advisors to Our Work
The Corporate Leadership Council expresses its appreciation to all of the individuals andorganizations who have so generously contributed their time and expertise to our work. Theircontributions have been invaluable, and we extend our sincere thanks to all of these advisors.A partial list of participants is included below:
AB Electrolux
ADP, Inc.
Aetna Inc.
American Express Company
Avaya Inc.
Best Buy Co., Inc.
BP p.l.c.
British Airways Plc
Cable and Wireless plc
Cadbury Schweppes plc
The Chase Manhattan Corporation
Cisco Systems, Inc.
Citigroup Inc.
Corning Incorporated
Deutsche Bank AG
Enron Corp.
Exxon Mobil Corporation
First Union Corporation
Geest PLC
Genzyme Corporation
Intel Corporation
Jack in the Box Inc.
The LEGO Company
The Longaberger Company
McDonald’s Corporation
Motorola, Inc.
National Institutes of Health
Nationwide Building Society
Norsk Hydro ASA
Office of Personnel Management
Organización Techint
Peoples Energy Corporation
PepsiCo, Inc.
PG&E Corporation
Pirelli S.p.A.
Prudential Financial
The Royal Bank of Scotland Group plc
Royal Dutch/Shell Group of Companies
Royal Philips Electronics N.V.
Sabre Inc.
SAP AG
Skandia Insurance Company Ltd.
SmithKline Beecham
Telenor ASA
TRW Inc.
USAA
US Airways Group, Inc.
Verizon Communications Inc.

© 2001 Corporate Executive Board
viii
© 2001 Corporate Executive Board
1
IntroductionA New Measurement Mandate:
Leveraging HR and Organizational Metricsto Enhance Corporate Performance
� Aligning Metrics with Business Goals
� Building for Flexibility
� Assigning Ownership of Metrics
� Creating Performance Incentives
� Educating the Organization About Metrics
� Leveraging IT Infrastructure
� Ensuring Metrics Deployment

A New Measurement Mandate
© 2001 Corporate Executive Board
2
Introduction
© 2001 Corporate Executive Board
3
Council Essay
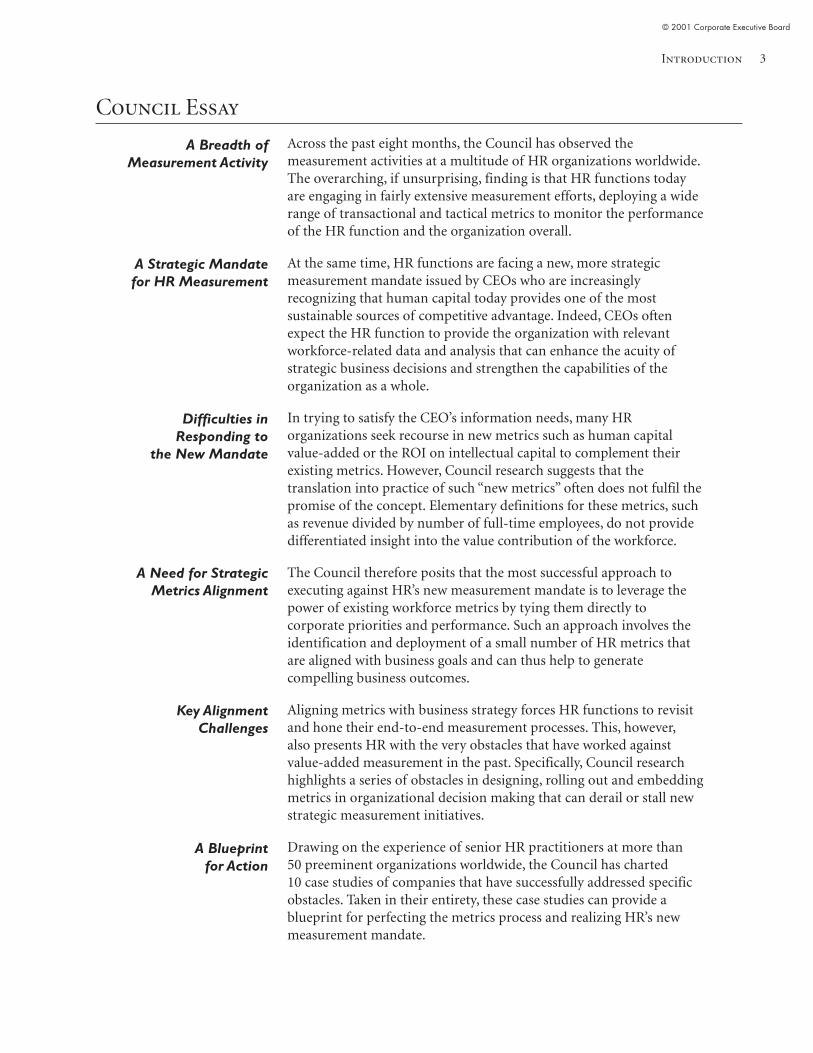
Across the past eight months, the Council has observed themeasurement activities at a multitude of HR organizations worldwide.The overarching, if unsurprising, finding is that HR functions todayare engaging in fairly extensive measurement efforts, deploying a widerange of transactional and tactical metrics to monitor the performanceof the HR function and the organization overall.
At the same time, HR functions are facing a new, more strategicmeasurement mandate issued by CEOs who are increasinglyrecognizing that human capital today provides one of the mostsustainable sources of competitive advantage. Indeed, CEOs oftenexpect the HR function to provide the organization with relevantworkforce-related data and analysis that can enhance the acuity ofstrategic business decisions and strengthen the capabilities of theorganization as a whole.
In trying to satisfy the CEO’s information needs, many HRorganizations seek recourse in new metrics such as human capitalvalue-added or the ROI on intellectual capital to complement theirexisting metrics. However, Council research suggests that thetranslation into practice of such “new metrics” often does not fulfil thepromise of the concept. Elementary definitions for these metrics, suchas revenue divided by number of full-time employees, do not providedifferentiated insight into the value contribution of the workforce.
The Council therefore posits that the most successful approach toexecuting against HR’s new measurement mandate is to leverage thepower of existing workforce metrics by tying them directly tocorporate priorities and performance. Such an approach involves theidentification and deployment of a small number of HR metrics thatare aligned with business goals and can thus help to generatecompelling business outcomes.
Aligning metrics with business strategy forces HR functions to revisitand hone their end-to-end measurement processes. This, however,also presents HR with the very obstacles that have worked againstvalue-added measurement in the past. Specifically, Council researchhighlights a series of obstacles in designing, rolling out and embeddingmetrics in organizational decision making that can derail or stall newstrategic measurement initiatives.
Drawing on the experience of senior HR practitioners at more than50 preeminent organizations worldwide, the Council has charted10 case studies of companies that have successfully addressed specificobstacles. Taken in their entirety, these case studies can provide ablueprint for perfecting the metrics process and realizing HR’s newmeasurement mandate.
A Breadth ofMeasurement Activity
A Strategic Mandatefor HR Measurement
Difficulties inResponding to
the New Mandate
A Need for StrategicMetrics Alignment
Key AlignmentChallenges
A Blueprintfor Action
A New Measurement Mandate
© 2001 Corporate Executive Board
4
A New Measurement Mandate
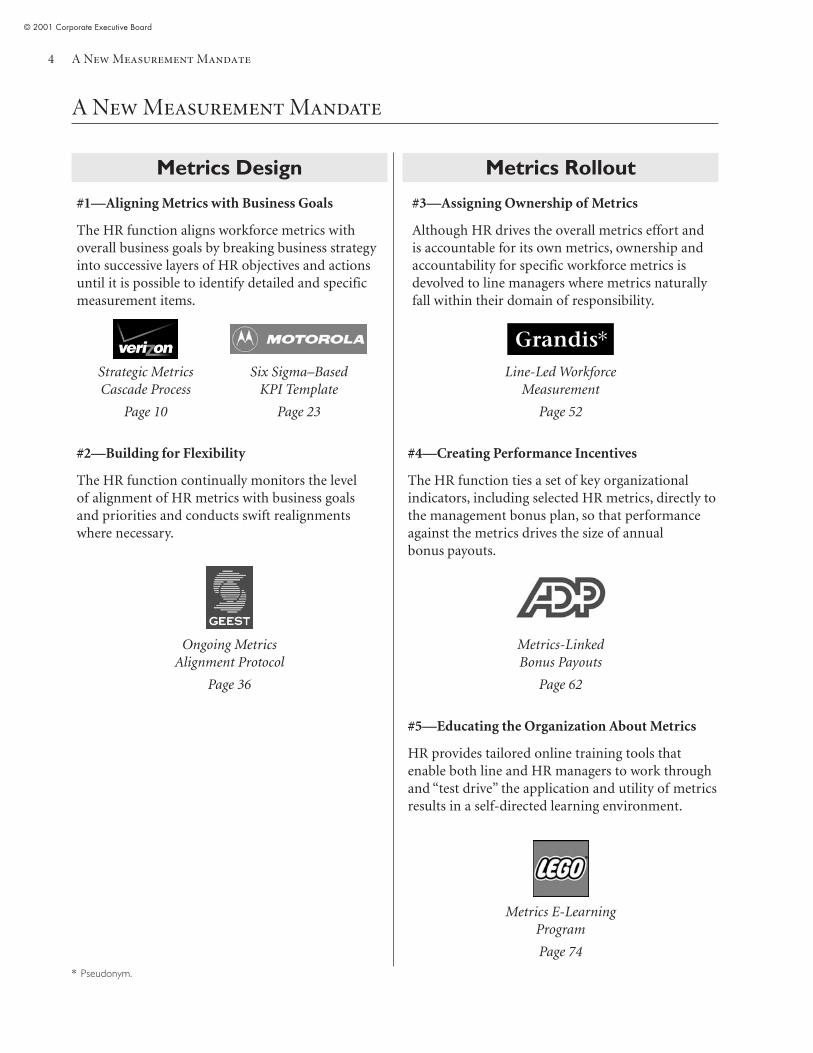
#1—Aligning Metrics with Business Goals
The HR function aligns workforce metrics withoverall business goals by breaking business strategyinto successive layers of HR objectives and actionsuntil it is possible to identify detailed and specificmeasurement items.
Metrics Design Metrics Rollout
#3—Assigning Ownership of Metrics
Although HR drives the overall metrics effort andis accountable for its own metrics, ownership andaccountability for specific workforce metrics isdevolved to line managers where metrics naturallyfall within their domain of responsibility.
#2—Building for Flexibility
The HR function continually monitors the levelof alignment of HR metrics with business goalsand priorities and conducts swift realignmentswhere necessary.
#4—Creating Performance Incentives
The HR function ties a set of key organizationalindicators, including selected HR metrics, directly tothe management bonus plan, so that performanceagainst the metrics drives the size of annualbonus payouts.
#5—Educating the Organization About Metrics
HR provides tailored online training tools thatenable both line and HR managers to work throughand “test drive” the application and utility of metricsresults in a self-directed learning environment.
* Pseudonym.
Grandis*Strategic MetricsCascade Process
Page 10
Six Sigma–BasedKPI Template
Page 23
Line-Led WorkforceMeasurement
Page 52
Ongoing MetricsAlignment Protocol
Page 36
Metrics-LinkedBonus Payouts
Page 62
Metrics E-LearningProgram
Page 74
Introduction
© 2001 Corporate Executive Board
5
#6—Leveraging IT Infrastructure
The HR function automates the reporting ofmetrics to the organization by posting metricsreports online. The software used allows for graphicrepresentation of numbers and trends and providesbasic analytic capabilities.
Metrics Decision Support Metrics Showcase
The metrics showcase contains a selection ofcompany metrics reports and dashboards,which you can view at the Council’s Web site,http://www.corporateleadershipcouncil.com.
#7—Ensuring Metrics Deployment
HR complements metrics reports withsophisticated analyses of the impact of specifictrends. HR is also able to offer ad hoc metricsinformation and analysis services to the lineas required.
* All information in these reports has been edited. Although thereports provide an accurate reflection of the organizations’metrics and reporting formats, any data presented is hypothetical.
HRDashboard
Page 88
TransitionalHR Dashboard
Page 96
“Code Red” PerformanceManagement System
Page 107
Strategic MetricsReporting
Page 114
Quarterly PeopleMeasurement Results*
OrganizationalMovements Reports*
Quartet
(Top-line metrics reviewsupplement to annual report)
ManagementInformation Pack*
HR DashboardPresentation*
Navigator
HR OperatingStatement*

A New Measurement Mandate
© 2001 Corporate Executive Board
6
© 2001 Corporate Executive Board
7
Chapter I:Metrics Design
� Step #1: Aligning Metrics with Business Goals
• Benchmark Practice #1: Strategic Metrics Cascade Process
• Benchmark Practice #2: Six Sigma–Based KPI Template
� Step #2: Building for Flexibility
• Benchmark Practice #3: Ongoing Metrics Alignment Protocol

A New Measurement Mandate
© 2001 Corporate Executive Board
8
© 2001 Corporate Executive Board
9
Step #1: Aligning Metrics with Business Goals
Benchmark Practice #1
Strategic Metrics Cascade Process
Description
The strategic metrics cascade process aligns HR metrics with overall business goals by breakingbusiness strategy into successive layers of HR objectives and actions until it is possible to identifydetailed and specific measurement items.
Goal
The goal is twofold. The first goal is to identify the right metrics to measure HR’s performanceand contribution to the bottom line. The second goal is to provide a line-of-sight betweenbusiness strategy, HR strategy and HR metrics.
Key Differentiating Feature
Rigorous cascading is the most robust approach to identifying HR metrics in alignment withbusiness strategy. Although many organizations are aware of cascading in principle, few havedeveloped a similarly replicable and documented protocol for operationalizing this strategy.
Benchmark Practice #2
Six Sigma–Based KPI* Template
Description
A measurement template configured at the corporate level incorporates a set of six sigma–basedbusiness performance indicators. The HR function translates this template into high-level HRperformance indicators and creates drill-down options for access to charts with informationregarding specific metrics items.
Goal
The goal is to ensure that all corporate functions monitor performance by using the same kindsof processes relating directly to key company success factors.
Key Differentiating Feature
A measurement approach explicitly designed around the six sigma performance managementframework provides for alignment of HR metrics with business priorities and places HRmeasurement directly in the context of improving process quality and efficiency.
* Key Performance Indicators.
A New Measurement Mandate
© 2001 Corporate Executive Board
10
Practice Background:Strategic Metrics Cascade ProcessVerizon Communications is a leading provider of local, wireless and othertelecommunications services in the United States. The company employs approximately260,000 individuals and generates revenues of approximately $64 billion.
Situation
• The 2000 merger between GTE and Bell Atlantic brings together two HR departments withindependent approaches to operationalizing the balanced scorecard in an HR setting.
• The challenge for the merged HR function is that the two measurement systems must notonly be amalgamated but must also be recalibrated to align with the corporate goals andpriorities of the new company, Verizon.
• The need for recalibration presents the HR function with the most fundamental ofproblems of HR measurement, namely determining what are value-added metrics from abusiness perspective and then operationalizing these metrics by identifying suitable itemsof “raw data” to measure.
Action
• The HR function decides that it must repeat the set of exercises that had previously led tothe identification of pertinent HR metrics at GTE and Bell Atlantic. To this end, Verizon’sHR function forms a core team in charge of adjusting and implementing the balancedscorecard to the requirements and strategy of the new organization.
• Drawing on a rigorous process pioneered during the balanced scorecard effort at GTE, thecore team reiterates the metrics cascade process for Verizon.
• The strategic metrics cascade process involves a series of steps to break down overarchingbusiness priorities into successive smaller sets of goals for HR that eventually lendthemselves to quantitative measurement.
Result
• Owing to its leverage of the pre-existing protocol, the core team can implement thebalanced scorecard for Verizon within six months, a very compacted time frame for such acomplex process at a large organization.
• Following the creation of a joint scorecard, HR can explain and defend project and staffingdecisions that may be out of the ordinary or counter to perceived strategic necessities.
• Verizon anticipates that HR will be able to conduct sophisticated impact modeling andanalyze performance trends as soon as the company’s transition to a new HRIS is complete.
Strategic Metrics Cascade Process
© 2001 Corporate Executive Board
11
Overview
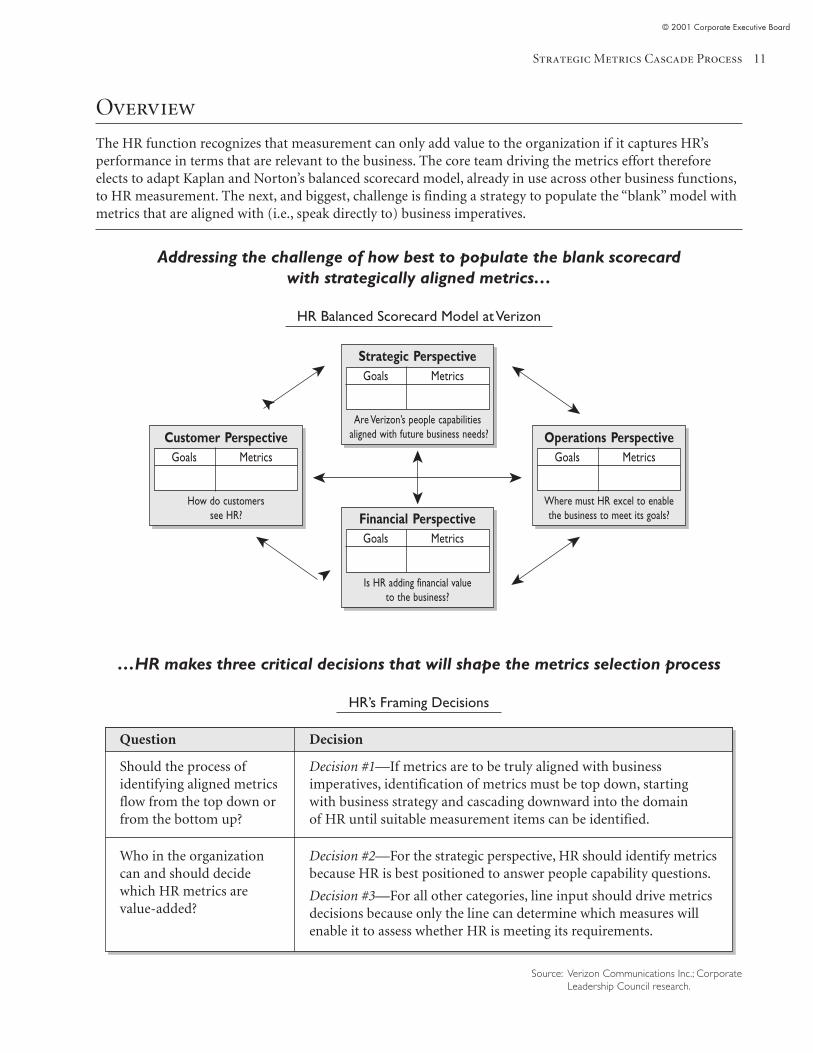
The HR function recognizes that measurement can only add value to the organization if it captures HR’sperformance in terms that are relevant to the business. The core team driving the metrics effort thereforeelects to adapt Kaplan and Norton’s balanced scorecard model, already in use across other business functions,to HR measurement. The next, and biggest, challenge is finding a strategy to populate the “blank” model withmetrics that are aligned with (i.e., speak directly to) business imperatives.
Addressing the challenge of how best to populate the blank scorecardwith strategically aligned metrics…
HR Balanced Scorecard Model at Verizon
…HR makes three critical decisions that will shape the metrics selection process
HR’s Framing Decisions
Question
Should the process ofidentifying aligned metricsflow from the top down orfrom the bottom up?
Who in the organizationcan and should decidewhich HR metrics arevalue-added?
Decision
Decision #1—If metrics are to be truly aligned with businessimperatives, identification of metrics must be top down, startingwith business strategy and cascading downward into the domainof HR until suitable measurement items can be identified.
Decision #2—For the strategic perspective, HR should identify metricsbecause HR is best positioned to answer people capability questions.
Decision #3—For all other categories, line input should drive metricsdecisions because only the line can determine which measures willenable it to assess whether HR is meeting its requirements.
Strategic Perspective
Customer Perspective Operations Perspective
Financial Perspective
Goals Metrics Goals Metrics
Goals Metrics
Goals Metrics
Are Verizon’s people capabilities aligned with future business needs?
Is HR adding financial valueto the business?
Where must HR excel to enablethe business to meet its goals?
How do customerssee HR?
➤➤
➤
➤
➤
➤
➤
➤
➤
➤
➤
➤
Source: Verizon Communications Inc.; CorporateLeadership Council research.
A New Measurement Mandate
© 2001 Corporate Executive Board
12
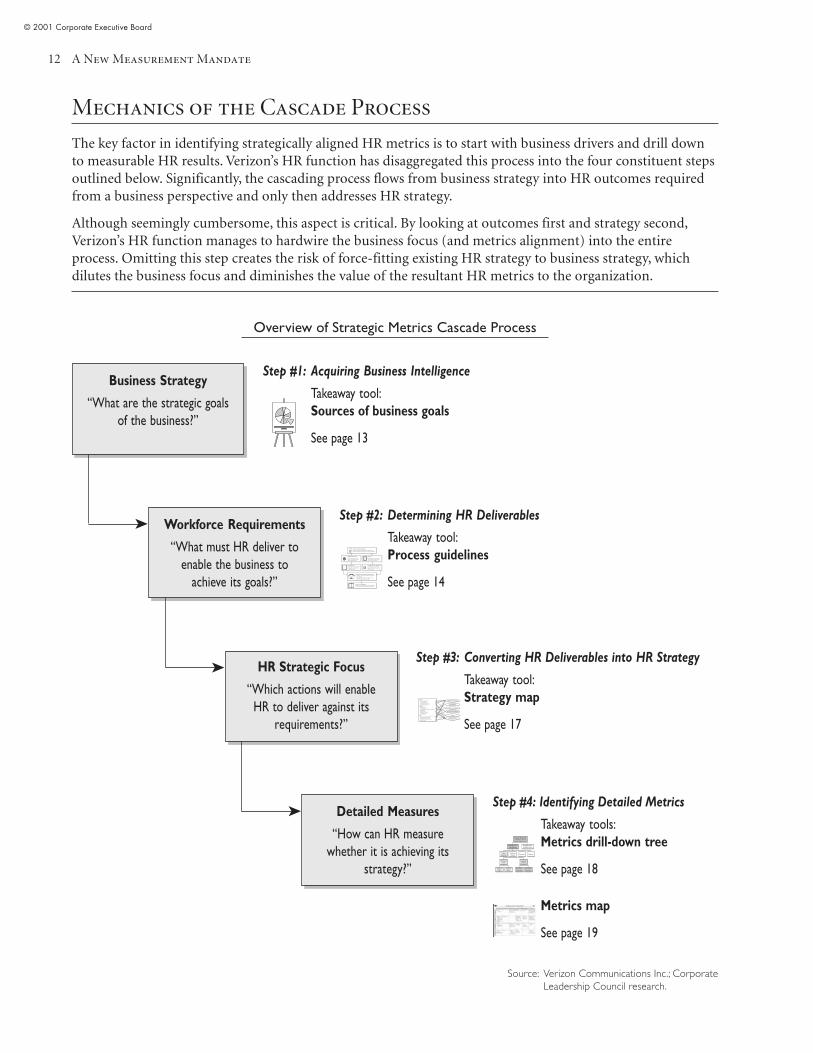
Mechanics of the Cascade Process
The key factor in identifying strategically aligned HR metrics is to start with business drivers and drill downto measurable HR results. Verizon’s HR function has disaggregated this process into the four constituent stepsoutlined below. Significantly, the cascading process flows from business strategy into HR outcomes requiredfrom a business perspective and only then addresses HR strategy.
Although seemingly cumbersome, this aspect is critical. By looking at outcomes first and strategy second,Verizon’s HR function manages to hardwire the business focus (and metrics alignment) into the entireprocess. Omitting this step creates the risk of force-fitting existing HR strategy to business strategy, whichdilutes the business focus and diminishes the value of the resultant HR metrics to the organization.
Overview of Strategic Metrics Cascade Process
Business Strategy
“What are the strategic goalsof the business?”
Workforce Requirements
“What must HR deliver toenable the business to
achieve its goals?”
HR Strategic Focus
“Which actions will enableHR to deliver against its
requirements?”
Detailed Measures
“How can HR measurewhether it is achieving its
strategy?”
Step #1: Acquiring Business Intelligence
Takeaway tool:Sources of business goals
See page 13
Step #2: Determining HR Deliverables
Takeaway tool:Process guidelines
See page 14
Step #3: Converting HR Deliverables into HR Strategy
Takeaway tool:Strategy map
See page 17
Step #4: Identifying Detailed Metrics
Takeaway tools:Metrics drill-down tree
See page 18
Metrics map
See page 19
➤
➤
➤
Consolidation of Business Intelligence
HR puts together a business strategy document capturing the majorinsights and points gathered during the acquisition of business intelligence
HR Brainstorming Sessions
“What people outcomes must weproduce to help the business deliveragainst its strategy and goals?”
Result: List of HR Deliverables
HR draws up list of total people and service requirements thatprovides the basis for HR strategy making and measurement
Line Survey
HR conducts a survey of line executives,asking “What kind of people, skills andservices do you need from HR?”
List of HR Outcomes
HR draws up a list of the skills needed inthe organization now and in future(See next page for sample)
List of HR Performance Requirements
Line provides a series of questions thatcaptures how the line will assess whetherHR is delivering value
Comparison and Consolidation of HR and Line Input
• HR checks for overlaps and contradictions between its ownand the line’s input
• HR conducts “reality check”: do the required outcomes/deliverables map back to business strategy?
➤ ➤
➤
➤➤
➤➤
✓✓✓✓✓
Current• Network management skills •• Customer support skills •• Voice product expertise •• Leverageable international skill base •• Financial/operational control •
Enhanced• Leadership capabilities •• Partnering with unions •• Customer support, service expertise and relationship
management skills •• Global capabilities •• Business savvy at all levels •• Learning and innovation focus •• Teaming capabilities •
New• Shared mindset toward achieving overall business results •• Marketing and distribution capabilities •• Data skills: technical and functional •• Partnering/alliance management capability •• Integration capability •
Workforce Development
Labor Relations
Customer Service
Compensation and Benefits
Diversity
Staffing/Leadership
Strategic Perspectiveof the Balance Scorecard
Strategic Focus:Staff/Leadership
Strategic Focus:Customer Service
Promotions RetentionTalent
AcquisitionWorkforceDiversity
New RecruitYield
Right Fit
Hourly Short-Term Churn
Salaried Short-Term Churn
AcceptedOffers
ExtendedOffers
Source: Verizon Communications Inc.; CorporateLeadership Council research.
Strategic Metrics Cascade Process
© 2001 Corporate Executive Board
13
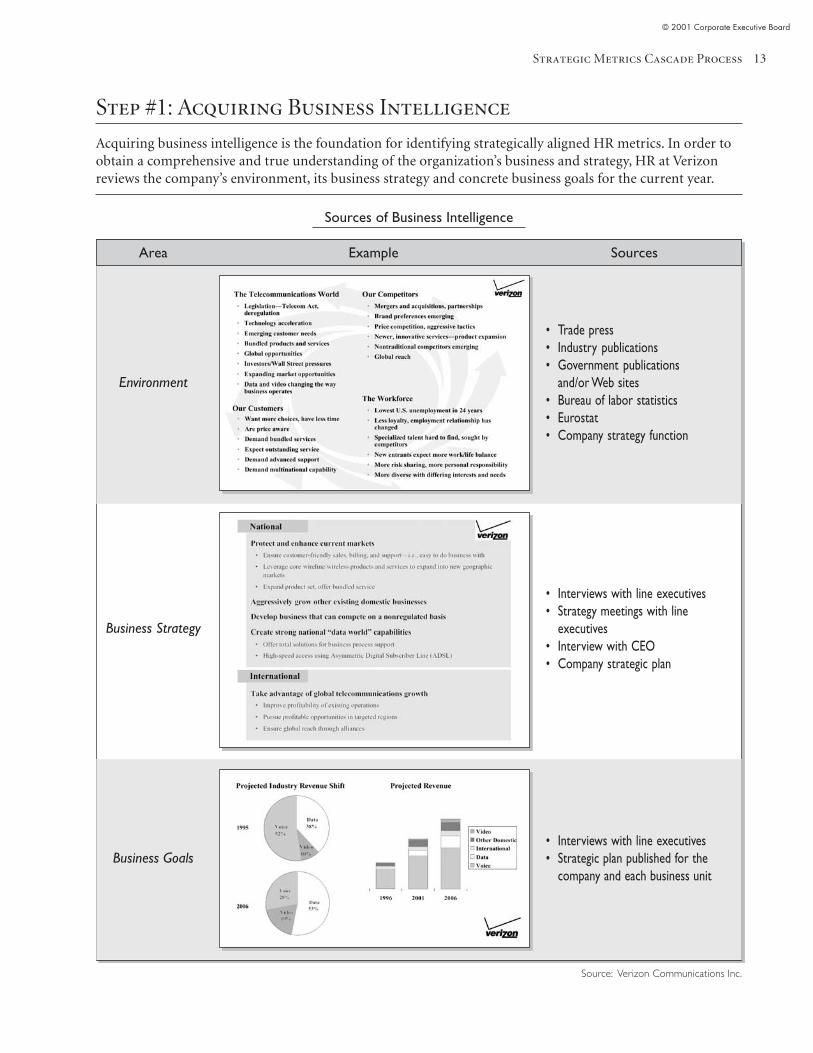
Step #1: Acquiring Business Intelligence
Acquiring business intelligence is the foundation for identifying strategically aligned HR metrics. In order toobtain a comprehensive and true understanding of the organization’s business and strategy, HR at Verizonreviews the company’s environment, its business strategy and concrete business goals for the current year.
Sources of Business Intelligence
Environment
• Trade press• Industry publications• Government publications
and/or Web sites• Bureau of labor statistics• Eurostat• Company strategy function
• Interviews with line executives• Strategy meetings with line
executives• Interview with CEO• Company strategic plan
• Interviews with line executives• Strategic plan published for the
company and each business unit
Business Strategy
Business Goals
Area Example Sources
Source: Verizon Communications Inc.
A New Measurement Mandate
© 2001 Corporate Executive Board
14
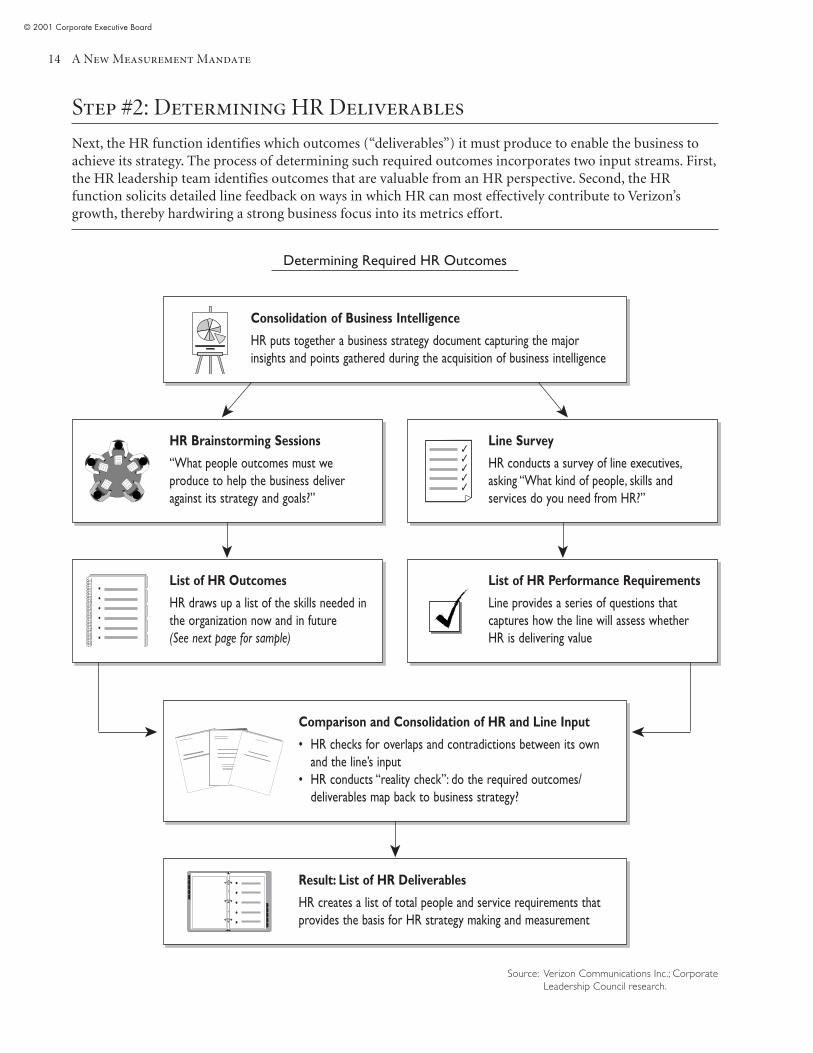
Step #2: Determining HR Deliverables
Next, the HR function identifies which outcomes (“deliverables”) it must produce to enable the business toachieve its strategy. The process of determining such required outcomes incorporates two input streams. First,the HR leadership team identifies outcomes that are valuable from an HR perspective. Second, the HRfunction solicits detailed line feedback on ways in which HR can most effectively contribute to Verizon’sgrowth, thereby hardwiring a strong business focus into its metrics effort.
Determining Required HR Outcomes
Consolidation of Business Intelligence
HR puts together a business strategy document capturing the majorinsights and points gathered during the acquisition of business intelligence
HR Brainstorming Sessions
“What people outcomes must weproduce to help the business deliveragainst its strategy and goals?”
Result: List of HR Deliverables
HR creates a list of total people and service requirements thatprovides the basis for HR strategy making and measurement
Line Survey
HR conducts a survey of line executives,asking “What kind of people, skills andservices do you need from HR?”
List of HR Outcomes
HR draws up a list of the skills needed inthe organization now and in future(See next page for sample)
List of HR Performance Requirements
Line provides a series of questions thatcaptures how the line will assess whetherHR is delivering value
Comparison and Consolidation of HR and Line Input
• HR checks for overlaps and contradictions between its ownand the line’s input
• HR conducts “reality check”: do the required outcomes/deliverables map back to business strategy?
➤ ➤
➤
➤➤
➤➤
✓✓✓✓✓
••••••
•••••
Source: Verizon Communications Inc.; CorporateLeadership Council research.
Strategic Metrics Cascade Process
© 2001 Corporate Executive Board
15
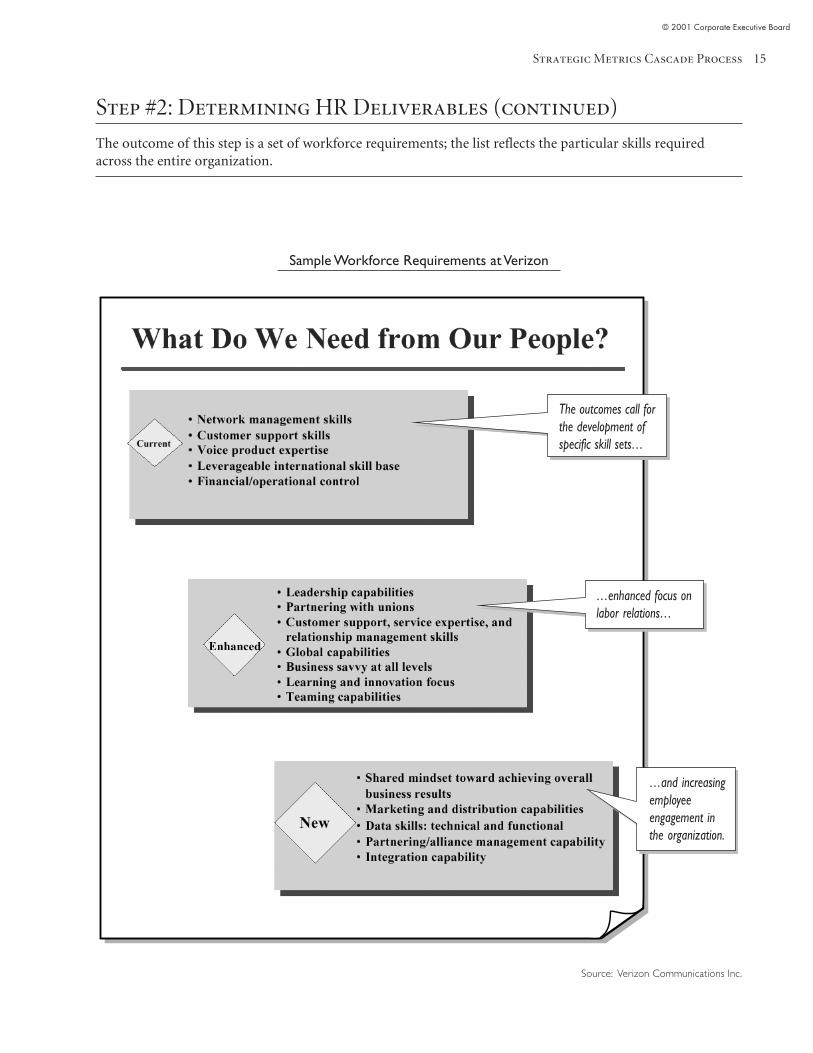
Step #2: Determining HR Deliverables (continued)
The outcome of this step is a set of workforce requirements; the list reflects the particular skills requiredacross the entire organization.
Sample Workforce Requirements at Verizon
Source: Verizon Communications Inc.
…enhanced focus onlabor relations…
…and increasingemployeeengagement inthe organization.
The outcomes call forthe development ofspecific skill sets…

A New Measurement Mandate
© 2001 Corporate Executive Board
16
Strategic Metrics Cascade Process
© 2001 Corporate Executive Board
17
Business Challenge
Position Verizon to become a leadingglobal player in telecommunications
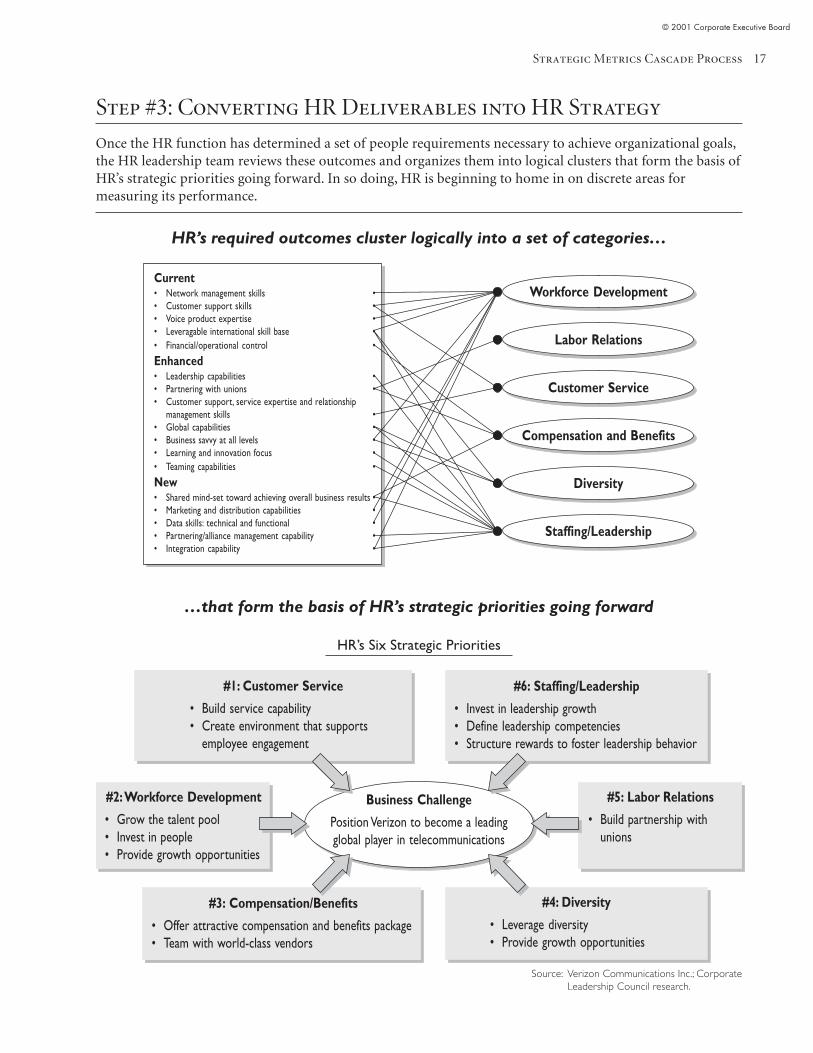
Step #3: Converting HR Deliverables into HR Strategy
Once the HR function has determined a set of people requirements necessary to achieve organizational goals,the HR leadership team reviews these outcomes and organizes them into logical clusters that form the basis ofHR’s strategic priorities going forward. In so doing, HR is beginning to home in on discrete areas formeasuring its performance.
HR’s required outcomes cluster logically into a set of categories…
…that form the basis of HR’s strategic priorities going forward
HR’s Six Strategic Priorities
Current• Network management skills •• Customer support skills •• Voice product expertise •• Leveragable international skill base •• Financial/operational control •
Enhanced• Leadership capabilities •• Partnering with unions •• Customer support, service expertise and relationship
management skills •• Global capabilities •• Business savvy at all levels •• Learning and innovation focus •• Teaming capabilities •
New• Shared mind-set toward achieving overall business results •• Marketing and distribution capabilities •• Data skills: technical and functional •• Partnering/alliance management capability •• Integration capability •
#1: Customer Service
• Build service capability• Create environment that supports
employee engagement
#6: Staffing/Leadership
• Invest in leadership growth• Define leadership competencies• Structure rewards to foster leadership behavior
#2: Workforce Development
• Grow the talent pool• Invest in people• Provide growth opportunities
#5: Labor Relations
• Build partnership withunions
#4: Diversity
• Leverage diversity• Provide growth opportunities
#3: Compensation/Benefits
• Offer attractive compensation and benefits package• Team with world-class vendors
Workforce Development
Labor Relations
Customer Service
Compensation and Benefits
Diversity
Staffing/Leadership
Source: Verizon Communications Inc.; CorporateLeadership Council research.
A New Measurement Mandate
© 2001 Corporate Executive Board
18
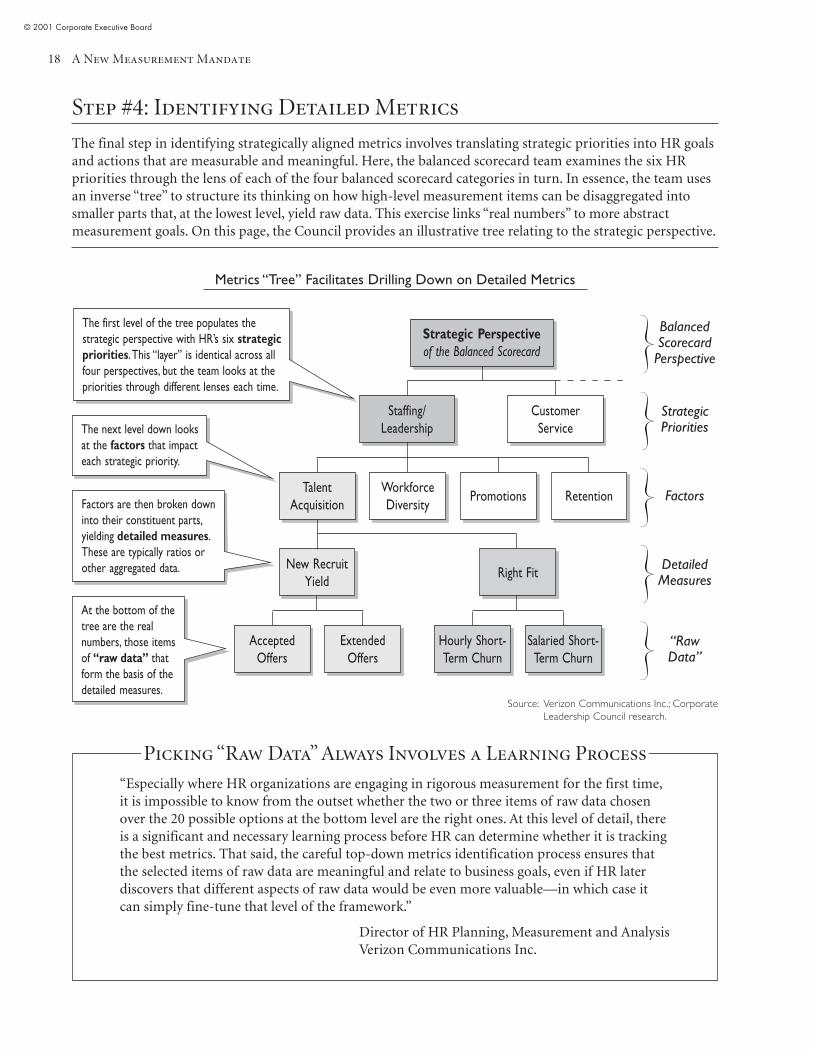
Step #4: Identifying Detailed Metrics
The final step in identifying strategically aligned metrics involves translating strategic priorities into HR goalsand actions that are measurable and meaningful. Here, the balanced scorecard team examines the six HRpriorities through the lens of each of the four balanced scorecard categories in turn. In essence, the team usesan inverse “tree” to structure its thinking on how high-level measurement items can be disaggregated intosmaller parts that, at the lowest level, yield raw data. This exercise links “real numbers” to more abstractmeasurement goals. On this page, the Council provides an illustrative tree relating to the strategic perspective.
Metrics “Tree” Facilitates Drilling Down on Detailed Metrics
The next level down looksat the factors that impacteach strategic priority.
Picking “Raw Data” Always Involves a Learning Process
“Especially where HR organizations are engaging in rigorous measurement for the first time,it is impossible to know from the outset whether the two or three items of raw data chosenover the 20 possible options at the bottom level are the right ones. At this level of detail, thereis a significant and necessary learning process before HR can determine whether it is trackingthe best metrics. That said, the careful top-down metrics identification process ensures thatthe selected items of raw data are meaningful and relate to business goals, even if HR laterdiscovers that different aspects of raw data would be even more valuable—in which case itcan simply fine-tune that level of the framework.”
Director of HR Planning, Measurement and AnalysisVerizon Communications Inc.
At the bottom of thetree are the realnumbers, those itemsof “raw data” thatform the basis of thedetailed measures.
The first level of the tree populates thestrategic perspective with HR’s six strategicpriorities. This “layer” is identical across allfour perspectives, but the team looks at thepriorities through different lenses each time.
Factors are then broken downinto their constituent parts,yielding detailed measures.These are typically ratios orother aggregated data.
BalancedScorecardPerspective
StrategicPriorities
Factors
DetailedMeasures
“RawData”
Strategic Perspectiveof the Balanced Scorecard
CustomerService
Promotions RetentionTalent
AcquisitionWorkforceDiversity
New RecruitYield
Right Fit
Hourly Short-Term Churn
Salaried Short-Term Churn
AcceptedOffers
ExtendedOffers
Staffing/Leadership
Source: Verizon Communications Inc.; CorporateLeadership Council research.
Strategic Metrics Cascade Process
© 2001 Corporate Executive Board
19
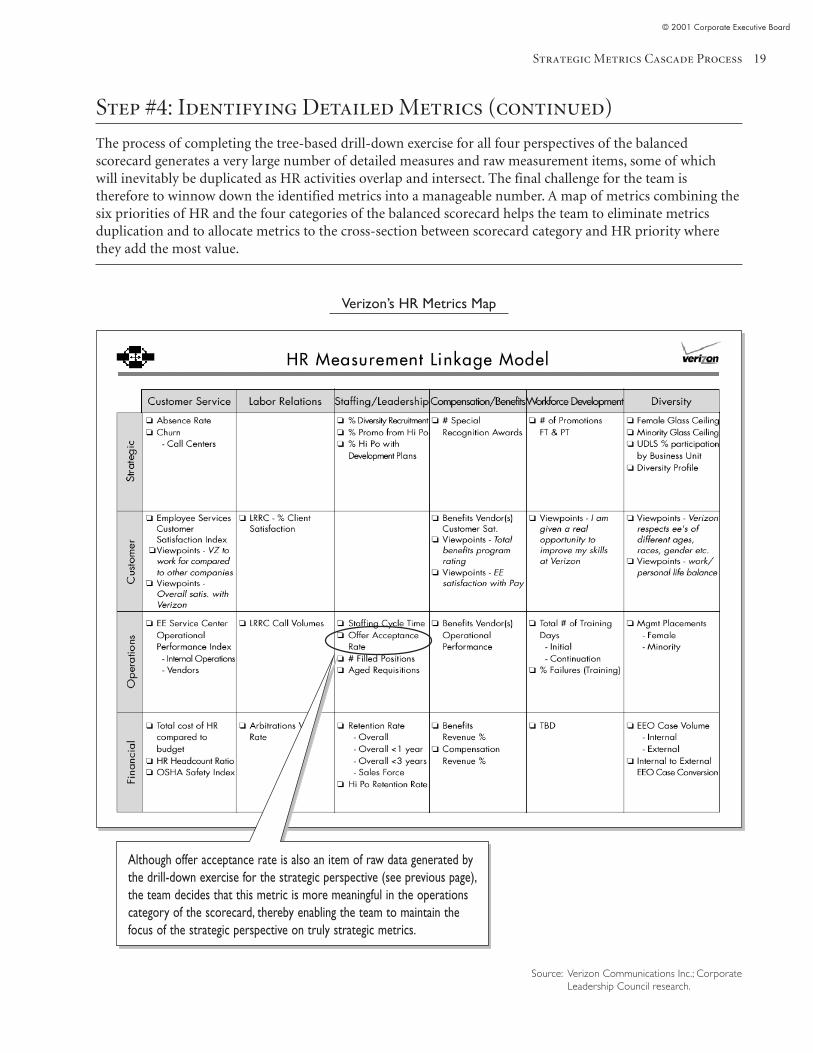
Step #4: Identifying Detailed Metrics (continued)
The process of completing the tree-based drill-down exercise for all four perspectives of the balancedscorecard generates a very large number of detailed measures and raw measurement items, some of whichwill inevitably be duplicated as HR activities overlap and intersect. The final challenge for the team istherefore to winnow down the identified metrics into a manageable number. A map of metrics combining thesix priorities of HR and the four categories of the balanced scorecard helps the team to eliminate metricsduplication and to allocate metrics to the cross-section between scorecard category and HR priority wherethey add the most value.
Verizon’s HR Metrics Map
Although offer acceptance rate is also an item of raw data generated bythe drill-down exercise for the strategic perspective (see previous page),the team decides that this metric is more meaningful in the operationscategory of the scorecard, thereby enabling the team to maintain thefocus of the strategic perspective on truly strategic metrics.
Source: Verizon Communications Inc.; CorporateLeadership Council research.
A New Measurement Mandate
© 2001 Corporate Executive Board
20
Outcome: HR Balanced Scorecard
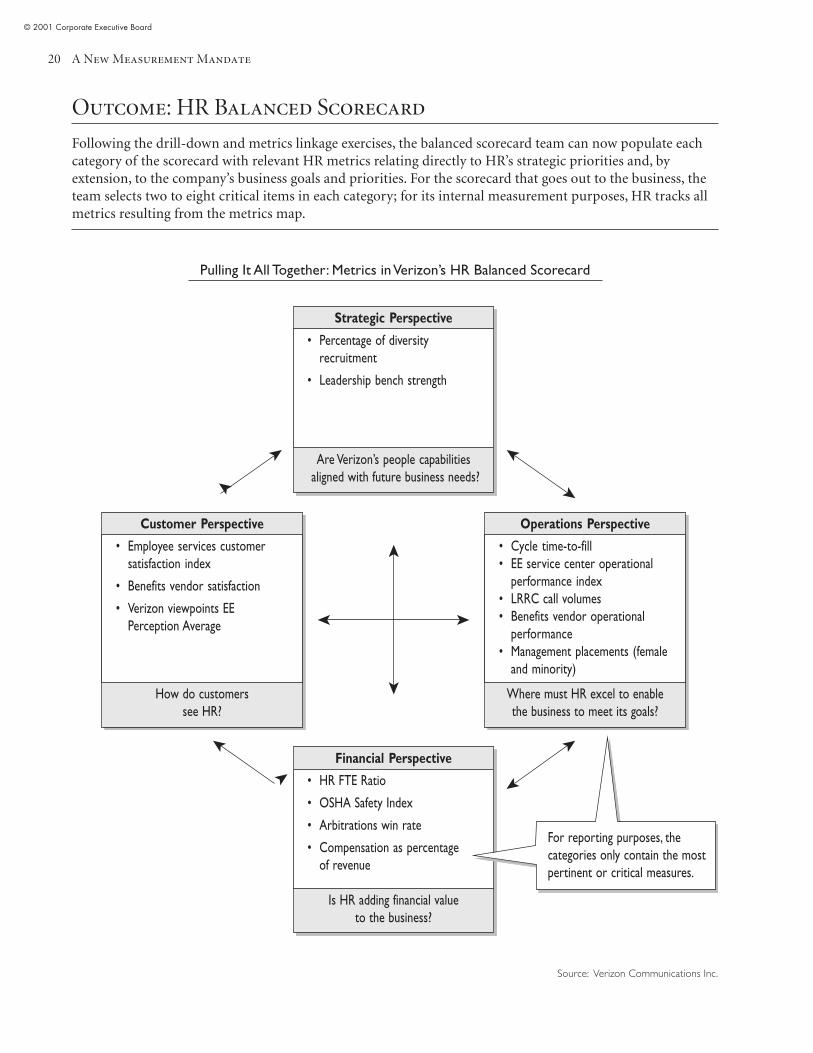
Following the drill-down and metrics linkage exercises, the balanced scorecard team can now populate eachcategory of the scorecard with relevant HR metrics relating directly to HR’s strategic priorities and, byextension, to the company’s business goals and priorities. For the scorecard that goes out to the business, theteam selects two to eight critical items in each category; for its internal measurement purposes, HR tracks allmetrics resulting from the metrics map.
Pulling It All Together: Metrics in Verizon’s HR Balanced Scorecard
Strategic Perspective
Customer Perspective Operations Perspective
Financial Perspective
• Employee services customersatisfaction index
• Benefits vendor satisfaction
• Verizon viewpoints EEPerception Average
• Cycle time-to-fill• EE service center operational
performance index• LRRC call volumes• Benefits vendor operational
performance• Management placements (female
and minority)
• Percentage of diversityrecruitment
• Leadership bench strength
• HR FTE Ratio
• OSHA Safety Index
• Arbitrations win rate
• Compensation as percentageof revenue
Are Verizon’s people capabilities aligned with future business needs?
Is HR adding financial valueto the business?
Where must HR excel to enablethe business to meet its goals?
How do customerssee HR?
➤➤
➤
➤
➤
➤
➤
➤
➤
➤
➤
➤
Source: Verizon Communications Inc.
For reporting purposes, thecategories only contain the mostpertinent or critical measures.
Strategic Metrics Cascade Process
© 2001 Corporate Executive Board
21
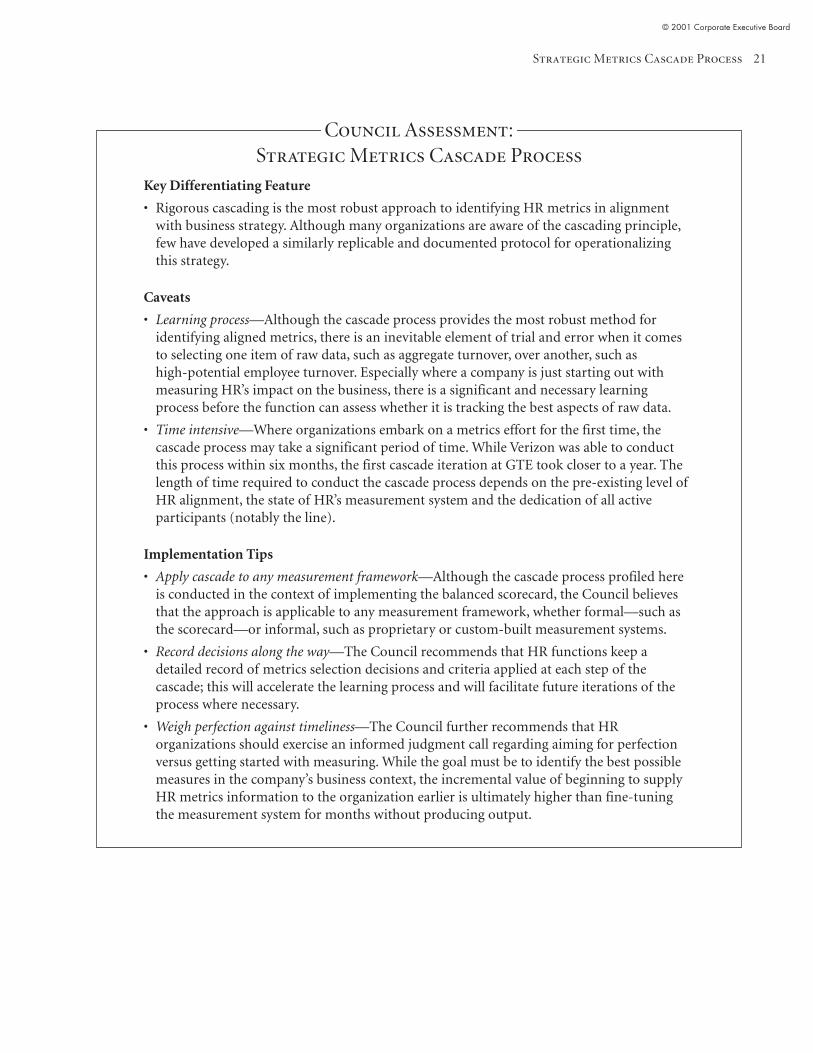
Council Assessment:Strategic Metrics Cascade Process
Key Differentiating Feature
• Rigorous cascading is the most robust approach to identifying HR metrics in alignmentwith business strategy. Although many organizations are aware of the cascading principle,few have developed a similarly replicable and documented protocol for operationalizingthis strategy.
Caveats
• Learning process—Although the cascade process provides the most robust method foridentifying aligned metrics, there is an inevitable element of trial and error when it comesto selecting one item of raw data, such as aggregate turnover, over another, such ashigh-potential employee turnover. Especially where a company is just starting out withmeasuring HR’s impact on the business, there is a significant and necessary learningprocess before the function can assess whether it is tracking the best aspects of raw data.
• Time intensive—Where organizations embark on a metrics effort for the first time, thecascade process may take a significant period of time. While Verizon was able to conductthis process within six months, the first cascade iteration at GTE took closer to a year. Thelength of time required to conduct the cascade process depends on the pre-existing level ofHR alignment, the state of HR’s measurement system and the dedication of all activeparticipants (notably the line).
Implementation Tips
• Apply cascade to any measurement framework—Although the cascade process profiled hereis conducted in the context of implementing the balanced scorecard, the Council believesthat the approach is applicable to any measurement framework, whether formal—such asthe scorecard—or informal, such as proprietary or custom-built measurement systems.
• Record decisions along the way—The Council recommends that HR functions keep adetailed record of metrics selection decisions and criteria applied at each step of thecascade; this will accelerate the learning process and will facilitate future iterations of theprocess where necessary.
• Weigh perfection against timeliness—The Council further recommends that HRorganizations should exercise an informed judgment call regarding aiming for perfectionversus getting started with measuring. While the goal must be to identify the best possiblemeasures in the company’s business context, the incremental value of beginning to supplyHR metrics information to the organization earlier is ultimately higher than fine-tuningthe measurement system for months without producing output.

A New Measurement Mandate
© 2001 Corporate Executive Board
22
Six Sigma–Based KPI Template
© 2001 Corporate Executive Board
23
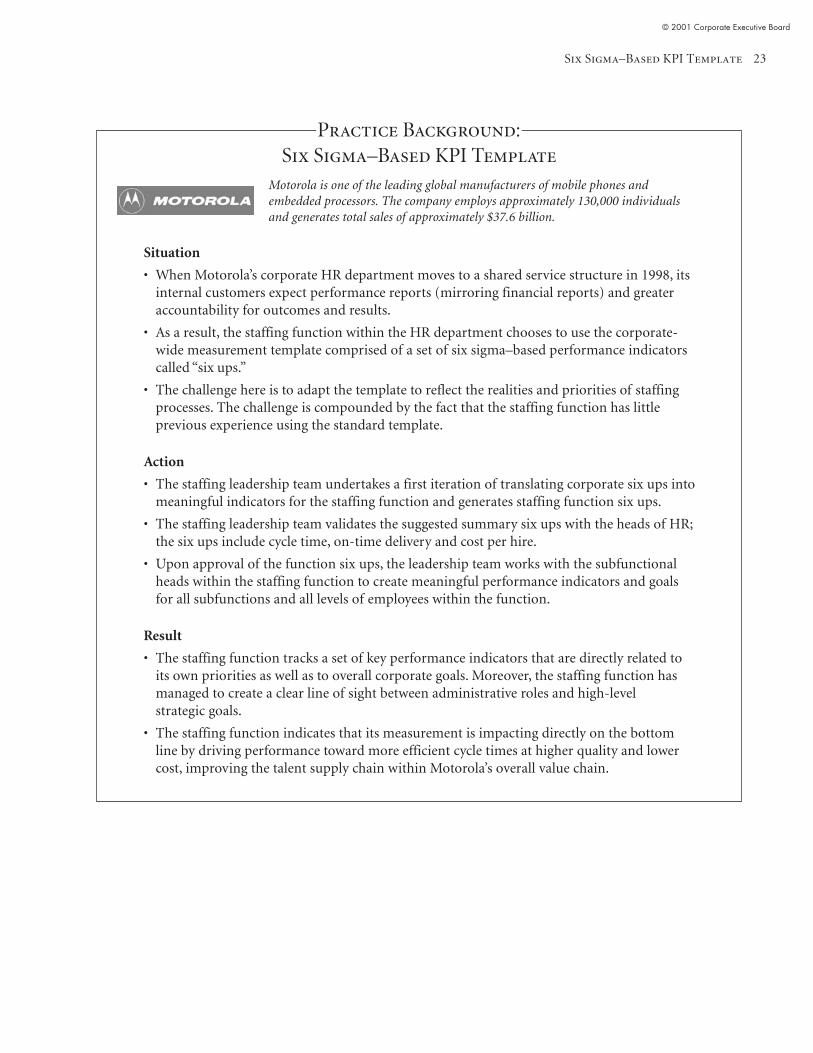
Practice Background:Six Sigma–Based KPI Template
Motorola is one of the leading global manufacturers of mobile phones andembedded processors. The company employs approximately 130,000 individualsand generates total sales of approximately $37.6 billion.
Situation
• When Motorola’s corporate HR department moves to a shared service structure in 1998, itsinternal customers expect performance reports (mirroring financial reports) and greateraccountability for outcomes and results.
• As a result, the staffing function within the HR department chooses to use the corporate-wide measurement template comprised of a set of six sigma–based performance indicatorscalled “six ups.”
• The challenge here is to adapt the template to reflect the realities and priorities of staffingprocesses. The challenge is compounded by the fact that the staffing function has littleprevious experience using the standard template.
Action
• The staffing leadership team undertakes a first iteration of translating corporate six ups intomeaningful indicators for the staffing function and generates staffing function six ups.
• The staffing leadership team validates the suggested summary six ups with the heads of HR;the six ups include cycle time, on-time delivery and cost per hire.
• Upon approval of the function six ups, the leadership team works with the subfunctionalheads within the staffing function to create meaningful performance indicators and goalsfor all subfunctions and all levels of employees within the function.
Result
• The staffing function tracks a set of key performance indicators that are directly related toits own priorities as well as to overall corporate goals. Moreover, the staffing function hasmanaged to create a clear line of sight between administrative roles and high-levelstrategic goals.
• The staffing function indicates that its measurement is impacting directly on the bottomline by driving performance toward more efficient cycle times at higher quality and lowercost, improving the talent supply chain within Motorola’s overall value chain.
A New Measurement Mandate
© 2001 Corporate Executive Board
24
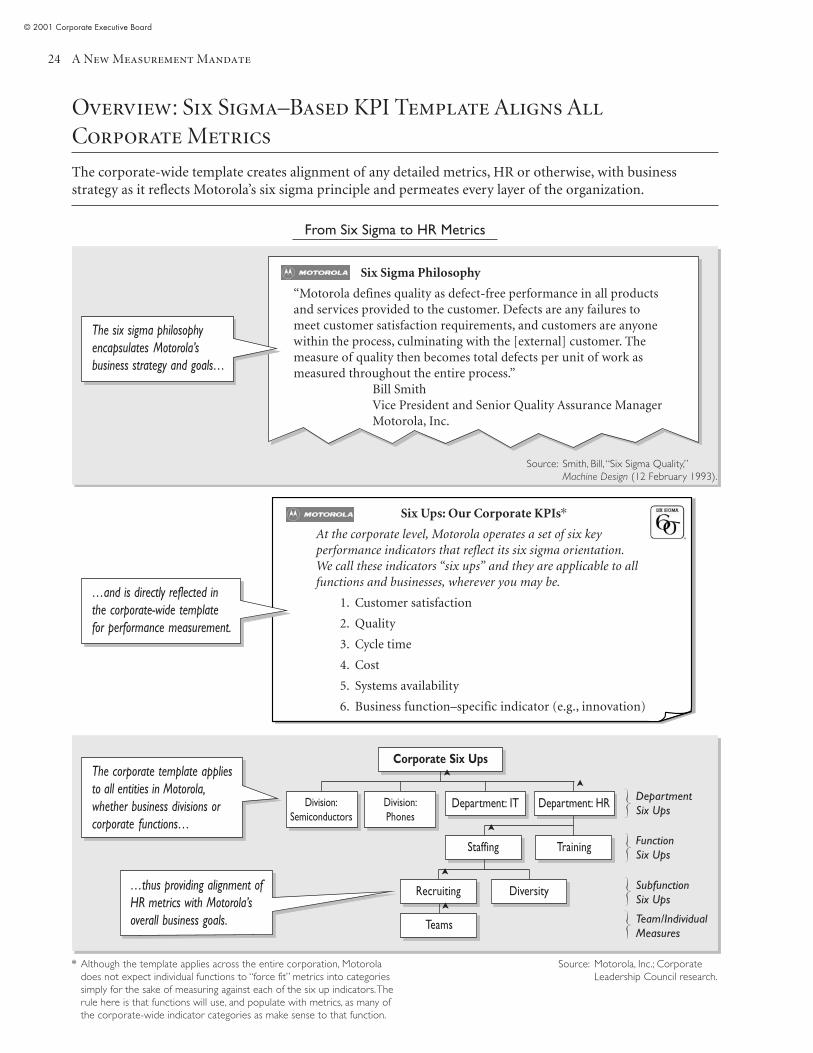
Overview: Six Sigma–Based KPI Template Aligns AllCorporate Metrics
The corporate-wide template creates alignment of any detailed metrics, HR or otherwise, with businessstrategy as it reflects Motorola’s six sigma principle and permeates every layer of the organization.
From Six Sigma to HR Metrics
Source: Motorola, Inc.; CorporateLeadership Council research.
* Although the template applies across the entire corporation, Motoroladoes not expect individual functions to “force fit” metrics into categoriessimply for the sake of measuring against each of the six up indicators. Therule here is that functions will use, and populate with metrics, as many ofthe corporate-wide indicator categories as make sense to that function.
Source: Smith, Bill, “Six Sigma Quality,”Machine Design (12 February 1993).
Six Ups: Our Corporate KPIs*
At the corporate level, Motorola operates a set of six keyperformance indicators that reflect its six sigma orientation.We call these indicators “six ups” and they are applicable to allfunctions and businesses, wherever you may be.
1. Customer satisfaction
2. Quality
3. Cycle time
4. Cost
5. Systems availability
6. Business function–specific indicator (e.g., innovation)
Six Sigma Philosophy
“Motorola defines quality as defect-free performance in all productsand services provided to the customer. Defects are any failures tomeet customer satisfaction requirements, and customers are anyonewithin the process, culminating with the [external] customer. Themeasure of quality then becomes total defects per unit of work asmeasured throughout the entire process.”
Bill SmithVice President and Senior Quality Assurance ManagerMotorola, Inc.
DepartmentSix Ups
FunctionSix Ups
SubfunctionSix Ups
Team/IndividualMeasures
Corporate Six Ups
Staffing Training
Recruiting Diversity
Teams
Division:Phones
Department: IT Department: HR
➤
➤
➤
➤
The six sigma philosophyencapsulates Motorola’sbusiness strategy and goals…
…and is directly reflected inthe corporate-wide templatefor performance measurement.
The corporate template appliesto all entities in Motorola,whether business divisions orcorporate functions…
…thus providing alignment ofHR metrics with Motorola’soverall business goals.
Division:Semiconductors
➤
Six Sigma–Based KPI Template
© 2001 Corporate Executive Board
25
Mechanics of the Six Sigma–Based KPI Template
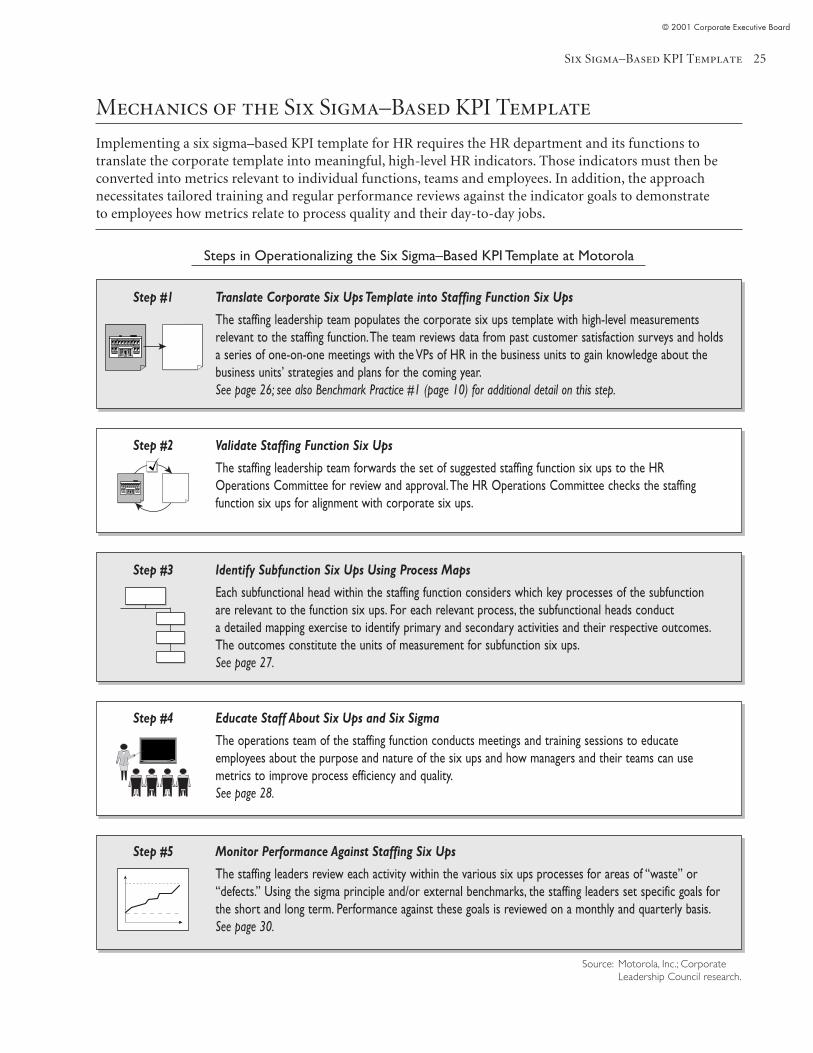
Implementing a six sigma–based KPI template for HR requires the HR department and its functions totranslate the corporate template into meaningful, high-level HR indicators. Those indicators must then beconverted into metrics relevant to individual functions, teams and employees. In addition, the approachnecessitates tailored training and regular performance reviews against the indicator goals to demonstrateto employees how metrics relate to process quality and their day-to-day jobs.
Steps in Operationalizing the Six Sigma–Based KPI Template at Motorola
Step #1 Translate Corporate Six Ups Template into Staffing Function Six Ups
The staffing leadership team populates the corporate six ups template with high-level measurementsrelevant to the staffing function. The team reviews data from past customer satisfaction surveys and holdsa series of one-on-one meetings with the VPs of HR in the business units to gain knowledge about thebusiness units’ strategies and plans for the coming year.See page 26; see also Benchmark Practice #1 (page 10) for additional detail on this step.
Step #2
Step #3
Step #4
Step #5
Validate Staffing Function Six Ups
The staffing leadership team forwards the set of suggested staffing function six ups to the HROperations Committee for review and approval. The HR Operations Committee checks the staffingfunction six ups for alignment with corporate six ups.
Identify Subfunction Six Ups Using Process Maps
Each subfunctional head within the staffing function considers which key processes of the subfunctionare relevant to the function six ups. For each relevant process, the subfunctional heads conducta detailed mapping exercise to identify primary and secondary activities and their respective outcomes.The outcomes constitute the units of measurement for subfunction six ups.See page 27.
Educate Staff About Six Ups and Six Sigma
The operations team of the staffing function conducts meetings and training sessions to educateemployees about the purpose and nature of the six ups and how managers and their teams can usemetrics to improve process efficiency and quality.See page 28.
Monitor Performance Against Staffing Six Ups
The staffing leaders review each activity within the various six ups processes for areas of “waste” or“defects.” Using the sigma principle and/or external benchmarks, the staffing leaders set specific goals forthe short and long term. Performance against these goals is reviewed on a monthly and quarterly basis.See page 30.
➤
➤
➤
Source: Motorola, Inc.; CorporateLeadership Council research.
A New Measurement Mandate
© 2001 Corporate Executive Board
26
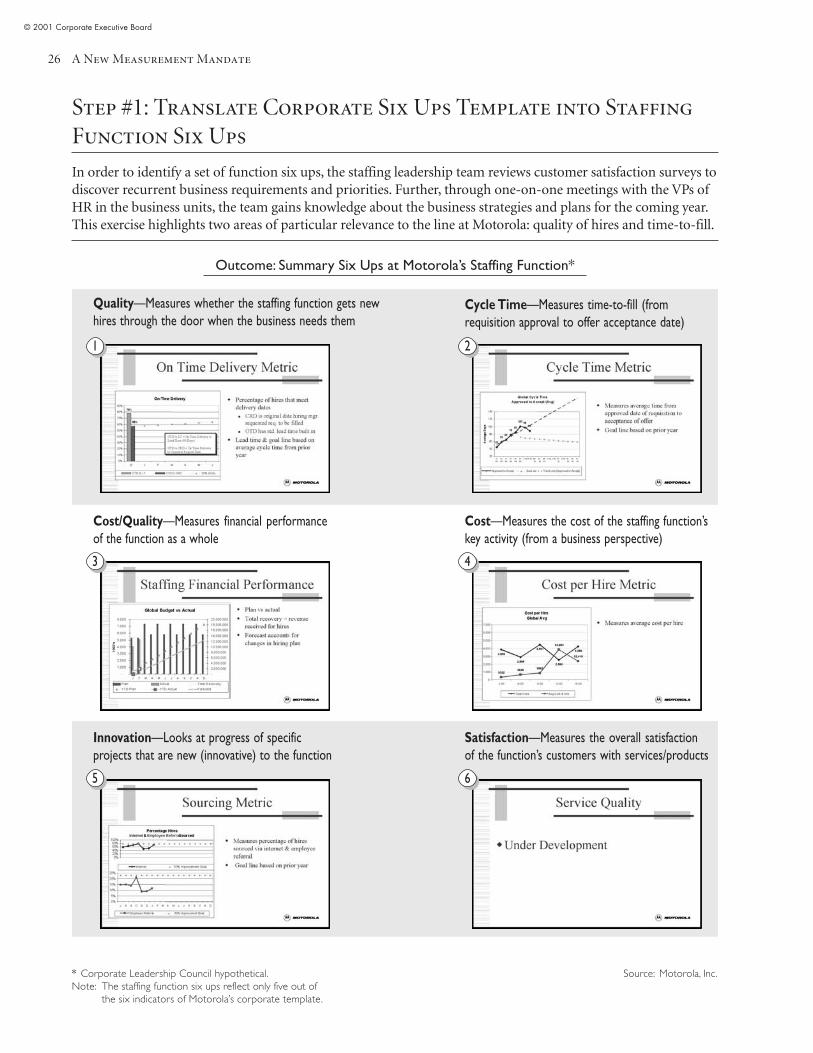
Step #1: Translate Corporate Six Ups Template into StaffingFunction Six Ups
In order to identify a set of function six ups, the staffing leadership team reviews customer satisfaction surveys todiscover recurrent business requirements and priorities. Further, through one-on-one meetings with the VPs ofHR in the business units, the team gains knowledge about the business strategies and plans for the coming year.This exercise highlights two areas of particular relevance to the line at Motorola: quality of hires and time-to-fill.
Outcome: Summary Six Ups at Motorola’s Staffing Function*
Quality—Measures whether the staffing function gets newhires through the door when the business needs them
Source: Motorola, Inc.
Cycle Time—Measures time-to-fill (fromrequisition approval to offer acceptance date)
Cost/Quality—Measures financial performanceof the function as a whole
Cost—Measures the cost of the staffing function’skey activity (from a business perspective)
Innovation—Looks at progress of specificprojects that are new (innovative) to the function
Satisfaction—Measures the overall satisfactionof the function’s customers with services/products
* Corporate Leadership Council hypothetical.Note: The staffing function six ups reflect only five out of
the six indicators of Motorola’s corporate template.
1
3
5
2
4
6
Six Sigma–Based KPI Template
© 2001 Corporate Executive Board
27
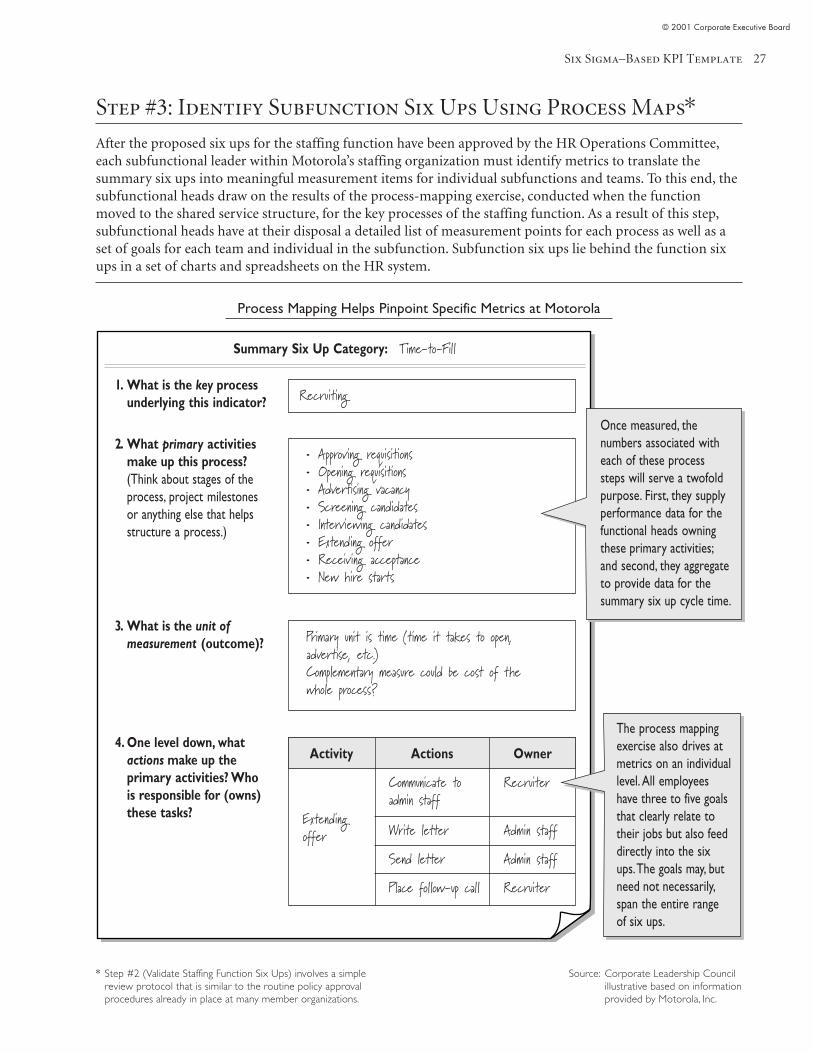
Step #3: Identify Subfunction Six Ups Using Process Maps*After the proposed six ups for the staffing function have been approved by the HR Operations Committee,each subfunctional leader within Motorola’s staffing organization must identify metrics to translate thesummary six ups into meaningful measurement items for individual subfunctions and teams. To this end, thesubfunctional heads draw on the results of the process-mapping exercise, conducted when the functionmoved to the shared service structure, for the key processes of the staffing function. As a result of this step,subfunctional heads have at their disposal a detailed list of measurement points for each process as well as aset of goals for each team and individual in the subfunction. Subfunction six ups lie behind the function sixups in a set of charts and spreadsheets on the HR system.
Process Mapping Helps Pinpoint Specific Metrics at Motorola
Source: Corporate Leadership Councilillustrative based on informationprovided by Motorola, Inc.
* Step #2 (Validate Staffing Function Six Ups) involves a simplereview protocol that is similar to the routine policy approvalprocedures already in place at many member organizations.
1. What is the key processunderlying this indicator?
2. What primary activitiesmake up this process?(Think about stages of theprocess, project milestonesor anything else that helpsstructure a process.)
3. What is the unit ofmeasurement (outcome)?
4. One level down, whatactions make up theprimary activities? Whois responsible for (owns)these tasks?
Summary Six Up Category: Time-to-Fil l
Communicate toadmin staff
Recruiter
Write letter Admin staffExtendingoffer
Recruiting
• Approving requisitions• Opening requisitions• Advertising vacancy• Screening candidates• Interviewing candidates• Extending offer• Receiving acceptance• New hire starts
Primary unit is time (time it takes to open,advertise, etc.)Complementary measure could be cost of thewhole process?
Send letter Admin staff
Place follow-up call Recruiter
Actions OwnerActivity
Once measured, thenumbers associated witheach of these processsteps will serve a twofoldpurpose. First, they supplyperformance data for thefunctional heads owningthese primary activities;and second, they aggregateto provide data for thesummary six up cycle time.
The process mappingexercise also drives atmetrics on an individuallevel. All employeeshave three to five goalsthat clearly relate totheir jobs but also feeddirectly into the sixups. The goals may, butneed not necessarily,span the entire rangeof six ups.
A New Measurement Mandate
© 2001 Corporate Executive Board
28
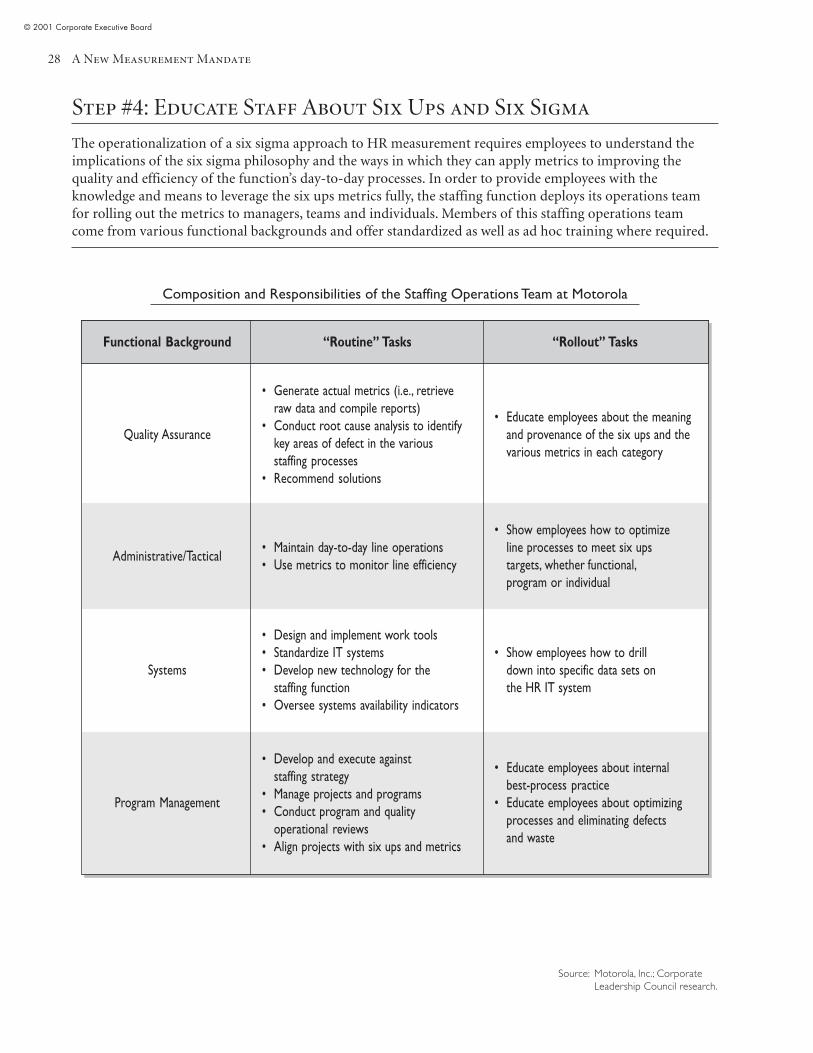
Step #4: Educate Staff About Six Ups and Six Sigma
The operationalization of a six sigma approach to HR measurement requires employees to understand theimplications of the six sigma philosophy and the ways in which they can apply metrics to improving thequality and efficiency of the function’s day-to-day processes. In order to provide employees with theknowledge and means to leverage the six ups metrics fully, the staffing function deploys its operations teamfor rolling out the metrics to managers, teams and individuals. Members of this staffing operations teamcome from various functional backgrounds and offer standardized as well as ad hoc training where required.
Composition and Responsibilities of the Staffing Operations Team at Motorola
Functional Background “Routine” Tasks “Rollout” Tasks
Quality Assurance
• Generate actual metrics (i.e., retrieveraw data and compile reports)
• Conduct root cause analysis to identifykey areas of defect in the variousstaffing processes
• Recommend solutions
• Educate employees about the meaningand provenance of the six ups and thevarious metrics in each category
Administrative/Tactical• Maintain day-to-day line operations• Use metrics to monitor line efficiency
• Show employees how to optimizeline processes to meet six upstargets, whether functional,program or individual
Systems
• Design and implement work tools• Standardize IT systems• Develop new technology for the
staffing function• Oversee systems availability indicators
• Show employees how to drilldown into specific data sets onthe HR IT system
Program Management
• Develop and execute againststaffing strategy
• Manage projects and programs• Conduct program and quality
operational reviews• Align projects with six ups and metrics
• Educate employees about internalbest-process practice
• Educate employees about optimizingprocesses and eliminating defectsand waste
Source: Motorola, Inc.; CorporateLeadership Council research.
Six Sigma–Based KPI Template
© 2001 Corporate Executive Board
29
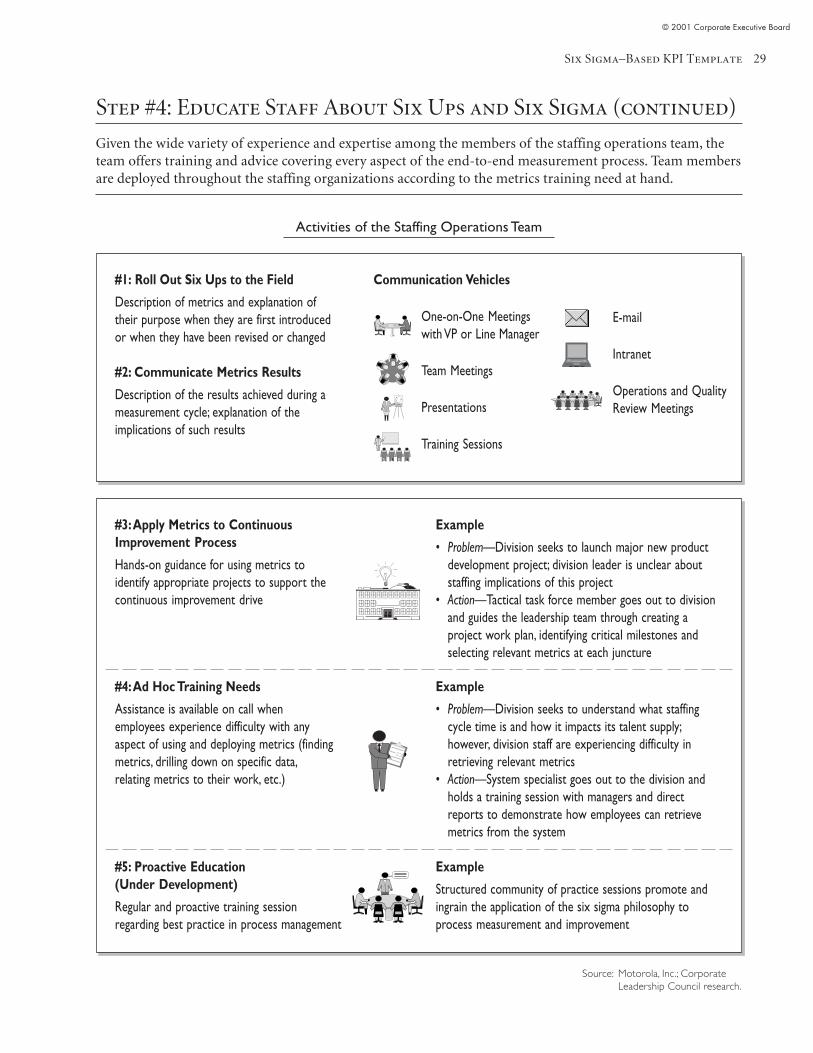
Step #4: Educate Staff About Six Ups and Six Sigma (continued)
Given the wide variety of experience and expertise among the members of the staffing operations team, theteam offers training and advice covering every aspect of the end-to-end measurement process. Team membersare deployed throughout the staffing organizations according to the metrics training need at hand.
Activities of the Staffing Operations Team
Communication Vehicles
One-on-One Meetingswith VP or Line Manager
Team Meetings
Presentations
Training Sessions
#1: Roll Out Six Ups to the Field
Description of metrics and explanation oftheir purpose when they are first introducedor when they have been revised or changed
#2: Communicate Metrics Results
Description of the results achieved during ameasurement cycle; explanation of theimplications of such results
Example
Structured community of practice sessions promote andingrain the application of the six sigma philosophy toprocess measurement and improvement
#3: Apply Metrics to ContinuousImprovement Process
Hands-on guidance for using metrics toidentify appropriate projects to support thecontinuous improvement drive
Example
• Problem—Division seeks to launch major new productdevelopment project; division leader is unclear aboutstaffing implications of this project
• Action—Tactical task force member goes out to divisionand guides the leadership team through creating aproject work plan, identifying critical milestones andselecting relevant metrics at each juncture
#4: Ad Hoc Training Needs
Assistance is available on call whenemployees experience difficulty with anyaspect of using and deploying metrics (findingmetrics, drilling down on specific data,relating metrics to their work, etc.)
Example
• Problem—Division seeks to understand what staffingcycle time is and how it impacts its talent supply;however, division staff are experiencing difficulty inretrieving relevant metrics
• Action—System specialist goes out to the division andholds a training session with managers and directreports to demonstrate how employees can retrievemetrics from the system
#5: Proactive Education(Under Development)
Regular and proactive training sessionregarding best practice in process management
Source: Motorola, Inc.; CorporateLeadership Council research.
Intranet
Operations and QualityReview Meetings
A New Measurement Mandate
© 2001 Corporate Executive Board
30
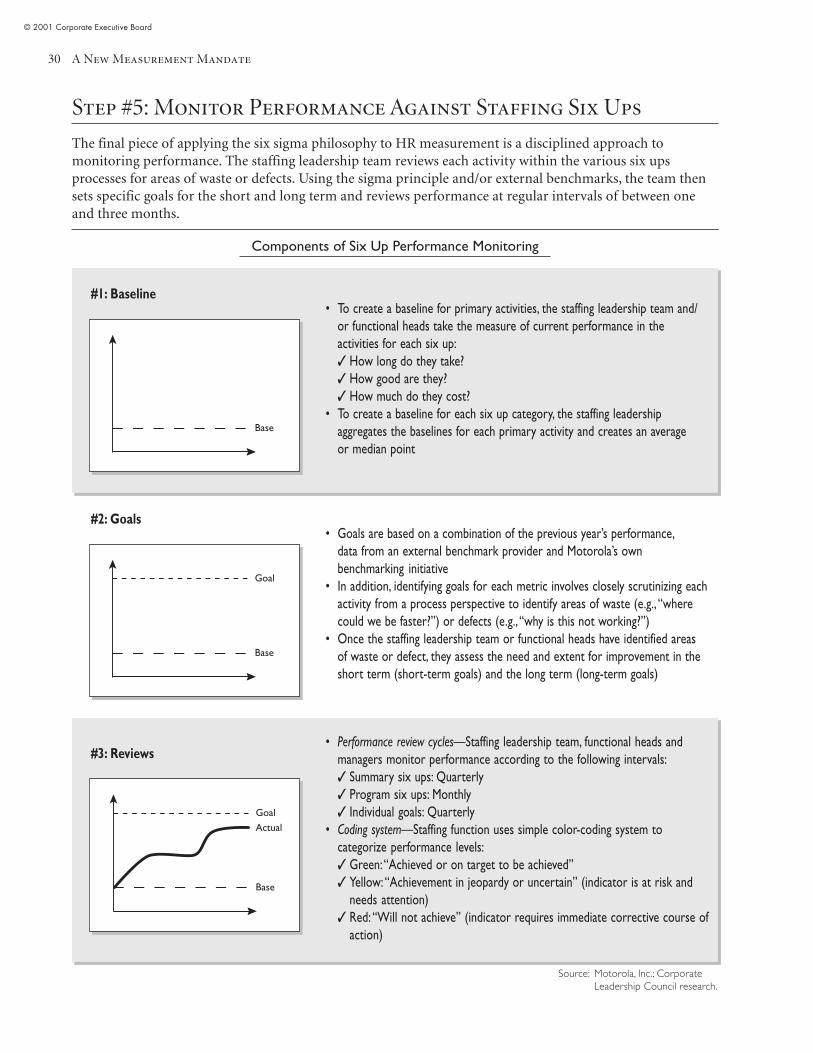
Step #5: Monitor Performance Against Staffing Six Ups
The final piece of applying the six sigma philosophy to HR measurement is a disciplined approach tomonitoring performance. The staffing leadership team reviews each activity within the various six upsprocesses for areas of waste or defects. Using the sigma principle and/or external benchmarks, the team thensets specific goals for the short and long term and reviews performance at regular intervals of between oneand three months.
Components of Six Up Performance Monitoring
• Performance review cycles—Staffing leadership team, functional heads andmanagers monitor performance according to the following intervals:✓ Summary six ups: Quarterly✓ Program six ups: Monthly✓ Individual goals: Quarterly
• Coding system—Staffing function uses simple color-coding system tocategorize performance levels:✓ Green: “Achieved or on target to be achieved”✓ Yellow: “Achievement in jeopardy or uncertain” (indicator is at risk and
needs attention)✓ Red: “Will not achieve” (indicator requires immediate corrective course of
action)
#1: Baseline
#2: Goals
#3: Reviews
• To create a baseline for primary activities, the staffing leadership team and/or functional heads take the measure of current performance in theactivities for each six up:✓ How long do they take?✓ How good are they?✓ How much do they cost?
• To create a baseline for each six up category, the staffing leadershipaggregates the baselines for each primary activity and creates an averageor median point
• Goals are based on a combination of the previous year’s performance,data from an external benchmark provider and Motorola’s ownbenchmarking initiative
• In addition, identifying goals for each metric involves closely scrutinizing eachactivity from a process perspective to identify areas of waste (e.g., “wherecould we be faster?”) or defects (e.g., “why is this not working?”)
• Once the staffing leadership team or functional heads have identified areasof waste or defect, they assess the need and extent for improvement in theshort term (short-term goals) and the long term (long-term goals)
Source: Motorola, Inc.; CorporateLeadership Council research.
Goal
Base
Base
Goal
Actual
Base
Six Sigma–Based KPI Template
© 2001 Corporate Executive Board
31
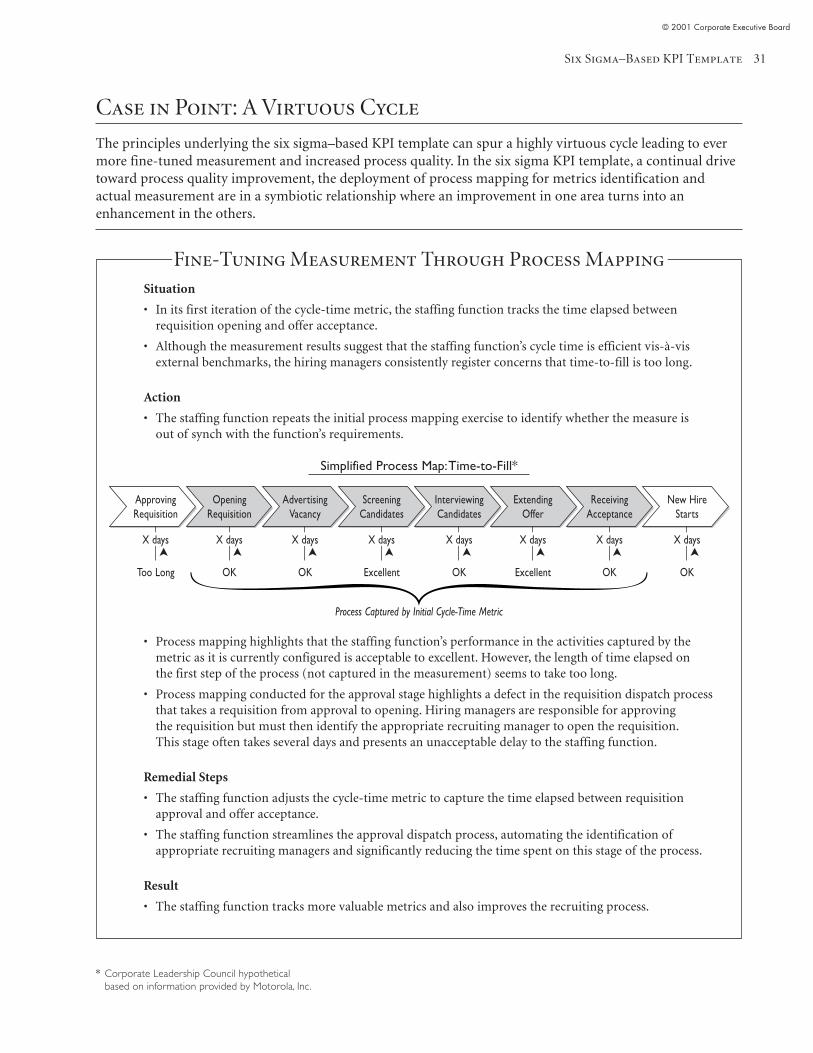
Case in Point: A Virtuous Cycle
The principles underlying the six sigma–based KPI template can spur a highly virtuous cycle leading to evermore fine-tuned measurement and increased process quality. In the six sigma KPI template, a continual drivetoward process quality improvement, the deployment of process mapping for metrics identification andactual measurement are in a symbiotic relationship where an improvement in one area turns into anenhancement in the others.
* Corporate Leadership Council hypotheticalbased on information provided by Motorola, Inc.
ApprovingRequisition
OpeningRequisition
AdvertisingVacancy
ScreeningCandidates
InterviewingCandidates
ExtendingOffer
ReceivingAcceptance
New HireStarts
Process Captured by Initial Cycle-Time Metric
Fine-Tuning Measurement Through Process MappingSituation
• In its first iteration of the cycle-time metric, the staffing function tracks the time elapsed betweenrequisition opening and offer acceptance.
• Although the measurement results suggest that the staffing function’s cycle time is efficient vis-à-visexternal benchmarks, the hiring managers consistently register concerns that time-to-fill is too long.
Action
• The staffing function repeats the initial process mapping exercise to identify whether the measure isout of synch with the function’s requirements.
• Process mapping highlights that the staffing function’s performance in the activities captured by themetric as it is currently configured is acceptable to excellent. However, the length of time elapsed onthe first step of the process (not captured in the measurement) seems to take too long.
• Process mapping conducted for the approval stage highlights a defect in the requisition dispatch processthat takes a requisition from approval to opening. Hiring managers are responsible for approvingthe requisition but must then identify the appropriate recruiting manager to open the requisition.This stage often takes several days and presents an unacceptable delay to the staffing function.
Remedial Steps
• The staffing function adjusts the cycle-time metric to capture the time elapsed between requisitionapproval and offer acceptance.
• The staffing function streamlines the approval dispatch process, automating the identification ofappropriate recruiting managers and significantly reducing the time spent on this stage of the process.
Result
• The staffing function tracks more valuable metrics and also improves the recruiting process.
Too Long OK OK Excellent OK Excellent OK OK
➤X days
➤X days
➤X days
➤X days
➤X days
➤X days
➤ ➤X days X days
Simplified Process Map: Time-to-Fill*

A New Measurement Mandate
© 2001 Corporate Executive Board
32
Six Sigma–Based KPI Template
© 2001 Corporate Executive Board
33
Council Assessment:Six Sigma–Based KPI Template
Key Differentiating Feature
• A measurement approach explicitly designed around the six sigma performance managementframework provides for de facto alignment of HR metrics with business priorities andplaces measurement directly in the context of improving process quality and efficiency.
Caveat
• The practice is most readily applicable in organizations that either use a six sigma approachto performance management or have a strong orientation toward process management andquality improvement in general. HR functions in companies where these factors are notgiven may find it difficult to operationalize the six sigma–based KPI template. That said,even those organizations may take value from this practice, as outlined below.
Implementation Tips: Avenues for Action Where No Six Sigma Template Exists
• Foster receptiveness to a corporate-wide template—Many organizations are deploying sixsigma principles without associating it with a formal, corporate-wide template for keyperformance indicators. This scenario affords HR the opportunity to become a processinnovator by proposing to the leadership team the value of a concerted, templatedmeasurement effort and offering concrete and pertinent pointers regarding the inceptionand operationalization of such an approach.
• Leverage six sigma as an evolving corporate initiative—Although six sigma may not beoperational, the leadership team may be considering endorsing this approach toperformance management in the mid to long term. This is an opportunity for HR tobecome an active participant in such an initiative and to implement six sigma in tandemwith the organization at large. Here, HR will find it valuable to apply the principlesoutlined in this practice to its own measurement effort even before the full-blowncorporate initiative is in place.
• Apply the basic principles even out of the six sigma context—Where HR operates in anenvironment that does not support the six sigma philosophy, the Council believes that thebasic principles outlined in this practice, specifically Step #3, still sharpen HR’smeasurement effort if rigorously applied. A strong focus on process quality and customersatisfaction and a process-oriented approach toward identifying metrics and targets can bevaluable guiding principles of aligning HR metrics with corporate priorities.

A New Measurement Mandate
© 2001 Corporate Executive Board
34
© 2001 Corporate Executive Board
35
Step #2: Building for Flexibility
Benchmark Practice #3
Ongoing Metrics Alignment Protocol
Description
Designed to enable rapid adjustments of key HR metrics to changing organizational priorities, theongoing metrics alignment protocol captures activities for recognizing and assessing the need foralignment as well as procedural steps for adjusting the HR system to the changed requirements.
Goal
The goal is to maintain maximum value of HR’s measurement effort by ensuring that the dataand information provided to the line are in close alignment with business needs and prioritiesat all times.
Key Differentiating Feature
The protocol differs from standard practice in the ease and speed with which metrics can berealigned to address changed corporate requirements. In this manner, the protocol offers atemplate for operationalizing a process that many HR functions consider critical to theirmeasurement efforts but have not yet attempted to implement.
A New Measurement Mandate
© 2001 Corporate Executive Board
36
Practice Background:Ongoing Metrics Alignment Protocol
Geest PLC is a leading distributor of produce and prepared foods in the United Kingdom andcontinental Europe. The company employs approximately 10,000 individuals and generatesannual revenues of approximately $845 million.
Situation
• Beginning early 1995, the HR team at Geest carefully aligns HR strategy and HR KPIs* withorganizational priorities on an annual basis, and the HR system is configured to provide theline with a series of standard, real-time reports on key HR metrics.
• However, because Geest is operating in a dynamic and highly seasonal market, thecompany’s business priorities change across the year. Soon after the first set of metrics isoperative, line managers request that metrics be adjusted to reflect their changed priorities.
• Although Geest’s metrics effort is heavily automated, relying on a fully integrated HR ITsystem, a realignment often requires the retrieval of new data from the system and thecreation of new reporting categories or items. The challenge for HR is to find a strategy forenhancing the HR system’s flexibility without compromising data integrity or the system’sreal-time reporting capability.
Action
• The group HR director reviews the activities and procedures involved in adjusting themeasurement system (both in terms of metrics captured and IT systems) in response tochanged business priorities in order to determine whether and how the process can bestandardized and streamlined.
• The group HR director then establishes a formal protocol designed to transform metricsadjustments from ad hoc efforts into routine procedure. The protocol coordinates actionson the part of the group HR director, the HR systems manager and the IT vendor andinvolves the following steps:
Step #1—Recognize Need for Metrics Realignment See page 40
Step #2—Assess Need for Metrics Realignment See page 41
Step #3—Implement Metrics Realignment See page 42
Result
• The ongoing alignment protocol enables the HR team to respond to adjustment requestsfrom the line within a matter of days. Simple adjustments—fine-tuning existing data sets—may take as little as a half day to implement and roll out; more complex adjustments—adding to or replacing existing data sets—may require up to a week.
• This increased flexibility of Geest’s HR measurement system is positively received and wellleveraged by the line. Across a 12-month period, Geest’s HR function typically conducts16 minor and four major realignments, averaging one every two weeks.
* Key Performance Indicators.
Ongoing Metrics Alignment Protocol
© 2001 Corporate Executive Board
37
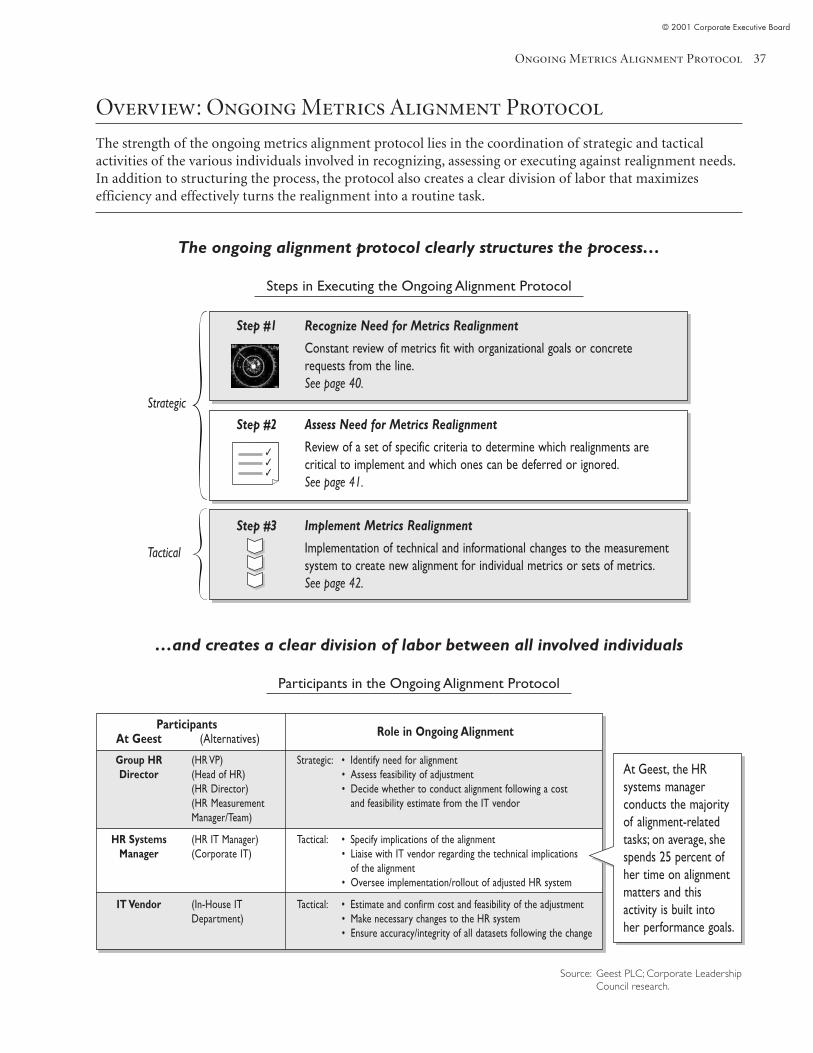
Overview: Ongoing Metrics Alignment Protocol
The strength of the ongoing metrics alignment protocol lies in the coordination of strategic and tacticalactivities of the various individuals involved in recognizing, assessing or executing against realignment needs.In addition to structuring the process, the protocol also creates a clear division of labor that maximizesefficiency and effectively turns the realignment into a routine task.
Source: Geest PLC; Corporate LeadershipCouncil research.
The ongoing alignment protocol clearly structures the process…
Steps in Executing the Ongoing Alignment Protocol
Strategic
…and creates a clear division of labor between all involved individuals
Participants in the Ongoing Alignment Protocol
Step #1 Recognize Need for Metrics Realignment
Constant review of metrics fit with organizational goals or concreterequests from the line.See page 40.
Step #2
Step #3
Assess Need for Metrics Realignment
Review of a set of specific criteria to determine which realignments arecritical to implement and which ones can be deferred or ignored.See page 41.
Implement Metrics Realignment
Implementation of technical and informational changes to the measurementsystem to create new alignment for individual metrics or sets of metrics.See page 42.
Tactical
Tactical: • Estimate and confirm cost and feasibility of the adjustment• Make necessary changes to the HR system• Ensure accuracy/integrity of all datasets following the change
Tactical: • Specify implications of the alignment• Liaise with IT vendor regarding the technical implications
of the alignment• Oversee implementation/rollout of adjusted HR system
Strategic: • Identify need for alignment• Assess feasibility of adjustment• Decide whether to conduct alignment following a cost
and feasibility estimate from the IT vendor
Participants Role in Ongoing AlignmentAt Geest (Alternatives)
Group HRDirector
(HR VP)(Head of HR)(HR Director)(HR MeasurementManager/Team)
HR SystemsManager
(HR IT Manager)(Corporate IT)
IT Vendor (In-House ITDepartment)
At Geest, the HRsystems managerconducts the majorityof alignment-relatedtasks; on average, shespends 25 percent ofher time on alignmentmatters and thisactivity is built intoher performance goals.
✓✓✓
A New Measurement Mandate
© 2001 Corporate Executive Board
38
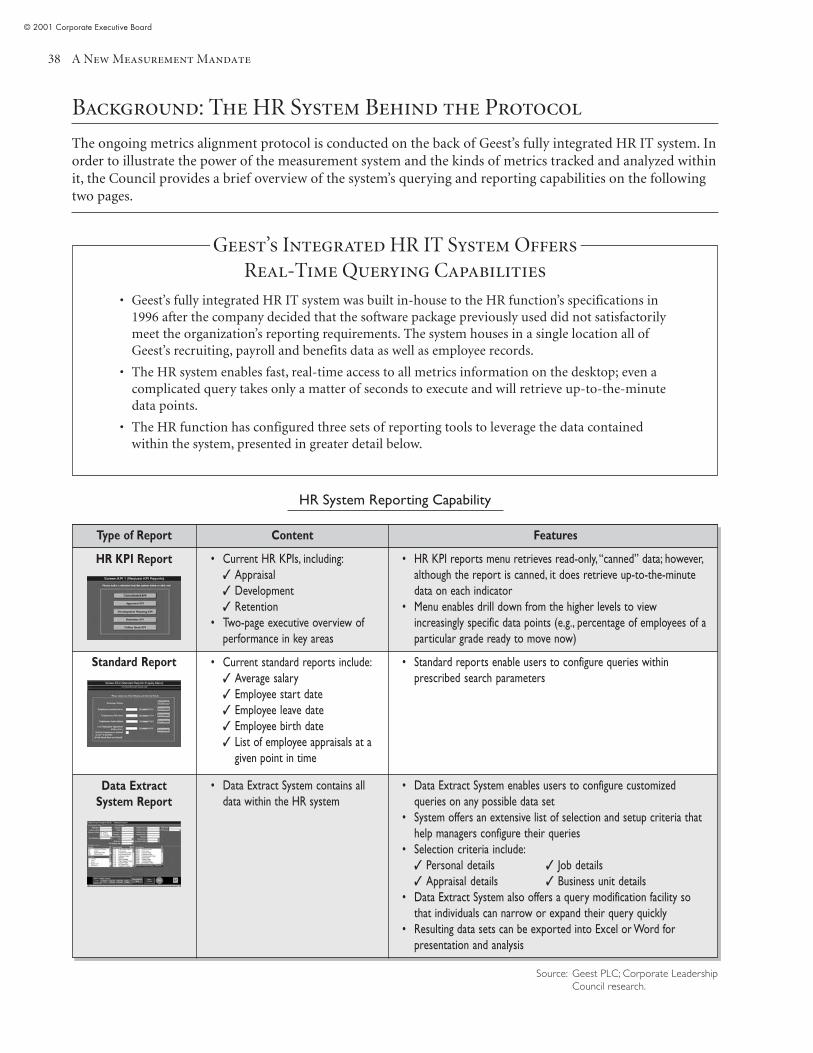
Background: The HR System Behind the Protocol
The ongoing metrics alignment protocol is conducted on the back of Geest’s fully integrated HR IT system. Inorder to illustrate the power of the measurement system and the kinds of metrics tracked and analyzed withinit, the Council provides a brief overview of the system’s querying and reporting capabilities on the followingtwo pages.
Geest’s Integrated HR IT System OffersReal-Time Querying Capabilities
• Geest’s fully integrated HR IT system was built in-house to the HR function’s specifications in1996 after the company decided that the software package previously used did not satisfactorilymeet the organization’s reporting requirements. The system houses in a single location all ofGeest’s recruiting, payroll and benefits data as well as employee records.
• The HR system enables fast, real-time access to all metrics information on the desktop; even acomplicated query takes only a matter of seconds to execute and will retrieve up-to-the-minutedata points.
• The HR function has configured three sets of reporting tools to leverage the data containedwithin the system, presented in greater detail below.
HR System Reporting Capability
• Standard reports enable users to configure queries withinprescribed search parameters
• Current standard reports include:✓ Average salary✓ Employee start date✓ Employee leave date✓ Employee birth date✓ List of employee appraisals at a
given point in time
Standard Report
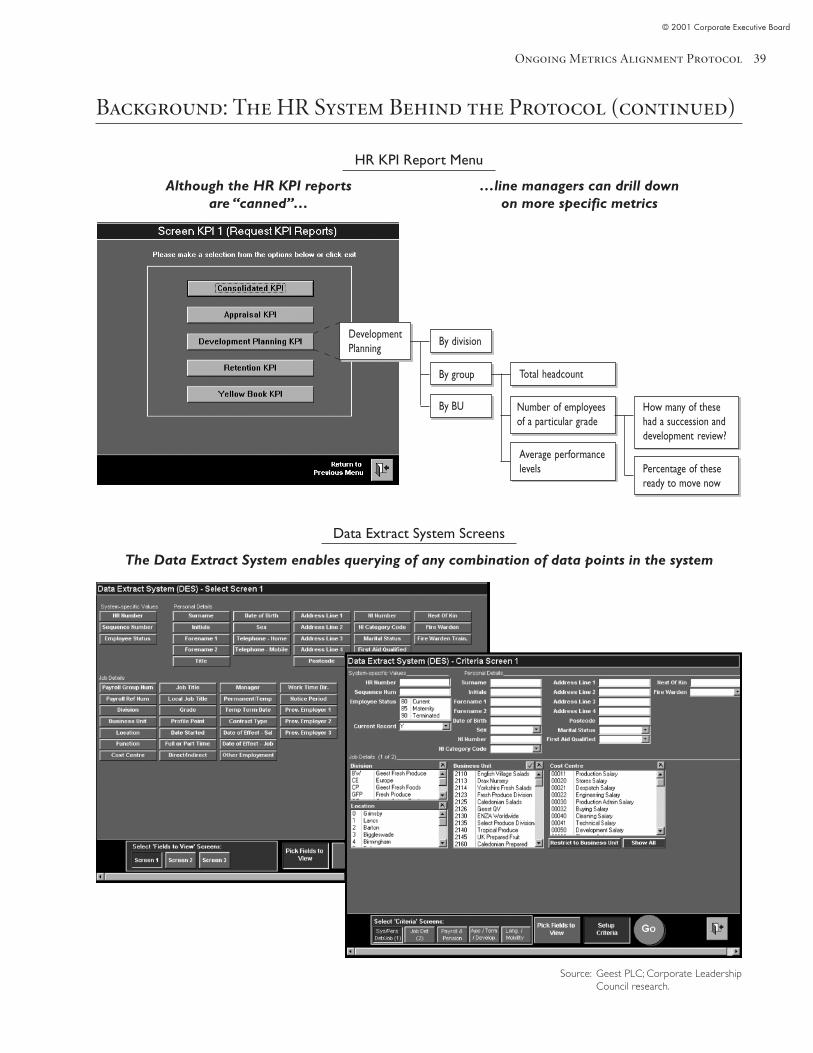
HR KPI Report • HR KPI reports menu retrieves read-only, “canned” data; however,although the report is canned, it does retrieve up-to-the-minutedata on each indicator
• Menu enables drill down from the higher levels to viewincreasingly specific data points (e.g., percentage of employees of aparticular grade ready to move now)
• Current HR KPIs, including:✓ Appraisal✓ Development✓ Retention
• Two-page executive overview ofperformance in key areas
Data ExtractSystem Report
• Data Extract System contains alldata within the HR system
• Data Extract System enables users to configure customizedqueries on any possible data set
• System offers an extensive list of selection and setup criteria thathelp managers configure their queries
• Selection criteria include:✓ Personal details ✓ Job details✓ Appraisal details ✓ Business unit details
• Data Extract System also offers a query modification facility sothat individuals can narrow or expand their query quickly
• Resulting data sets can be exported into Excel or Word forpresentation and analysis
Type of Report Content Features
Source: Geest PLC; Corporate LeadershipCouncil research.
Ongoing Metrics Alignment Protocol
© 2001 Corporate Executive Board
39
Background: The HR System Behind the Protocol (continued)
HR KPI Report Menu
Data Extract System Screens
Although the HR KPI reportsare “canned”…
…line managers can drill downon more specific metrics
DevelopmentPlanning
By division
By group
By BU
Total headcount
Average performancelevels
How many of thesehad a succession anddevelopment review?
Percentage of theseready to move now
Number of employeesof a particular grade
The Data Extract System enables querying of any combination of data points in the system
Source: Geest PLC; Corporate LeadershipCouncil research.
A New Measurement Mandate
© 2001 Corporate Executive Board
40
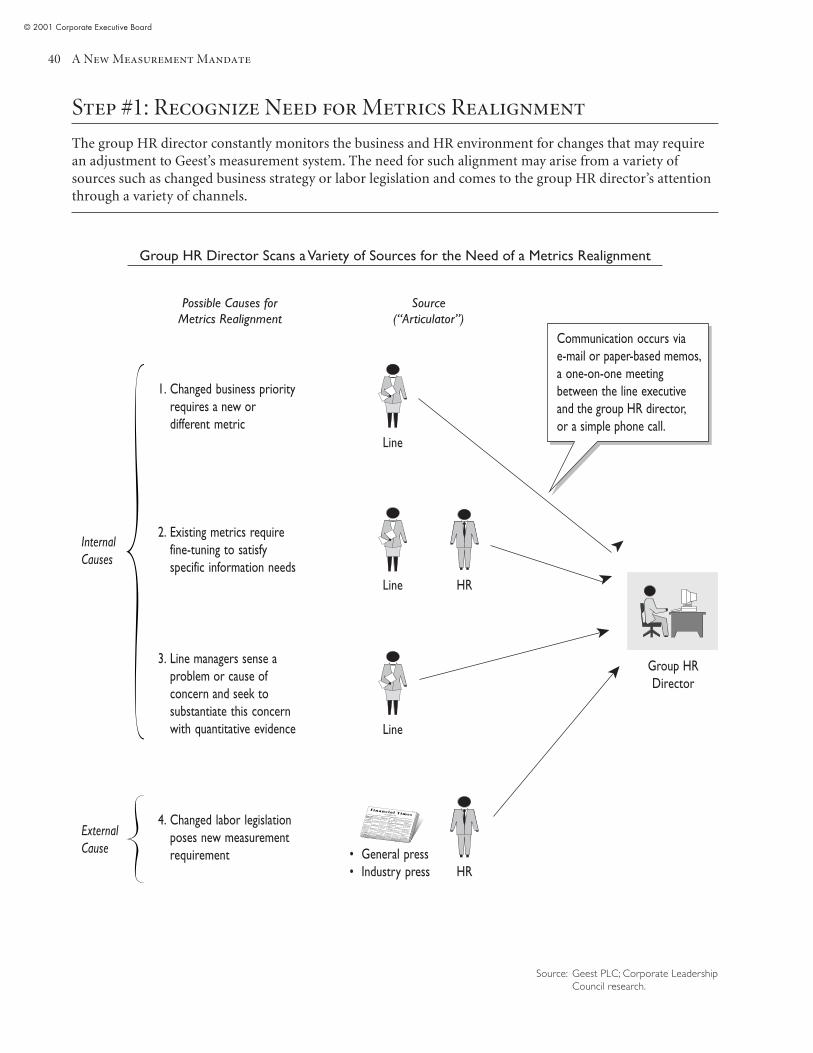
Step #1: Recognize Need for Metrics Realignment
The group HR director constantly monitors the business and HR environment for changes that may requirean adjustment to Geest’s measurement system. The need for such alignment may arise from a variety ofsources such as changed business strategy or labor legislation and comes to the group HR director’s attentionthrough a variety of channels.
Group HR Director Scans a Variety of Sources for the Need of a Metrics Realignment
InternalCauses
ExternalCause
Possible Causes forMetrics Realignment
Source(“Articulator”)
Group HRDirector
Financial TimesDECEMBER 9, 2003Down & Out Bankruptcy at End of
Long Battle for Survival
2. Existing metrics requirefine-tuning to satisfyspecific information needs
1. Changed business priorityrequires a new ordifferent metric
3. Line managers sense aproblem or cause ofconcern and seek tosubstantiate this concernwith quantitative evidence
4. Changed labor legislationposes new measurementrequirement
Communication occurs viae-mail or paper-based memos,a one-on-one meetingbetween the line executiveand the group HR director,or a simple phone call.
• General press• Industry press HR
HRLine
Line
Line
➤
➤
➤
➤
Source: Geest PLC; Corporate LeadershipCouncil research.
Ongoing Metrics Alignment Protocol
© 2001 Corporate Executive Board
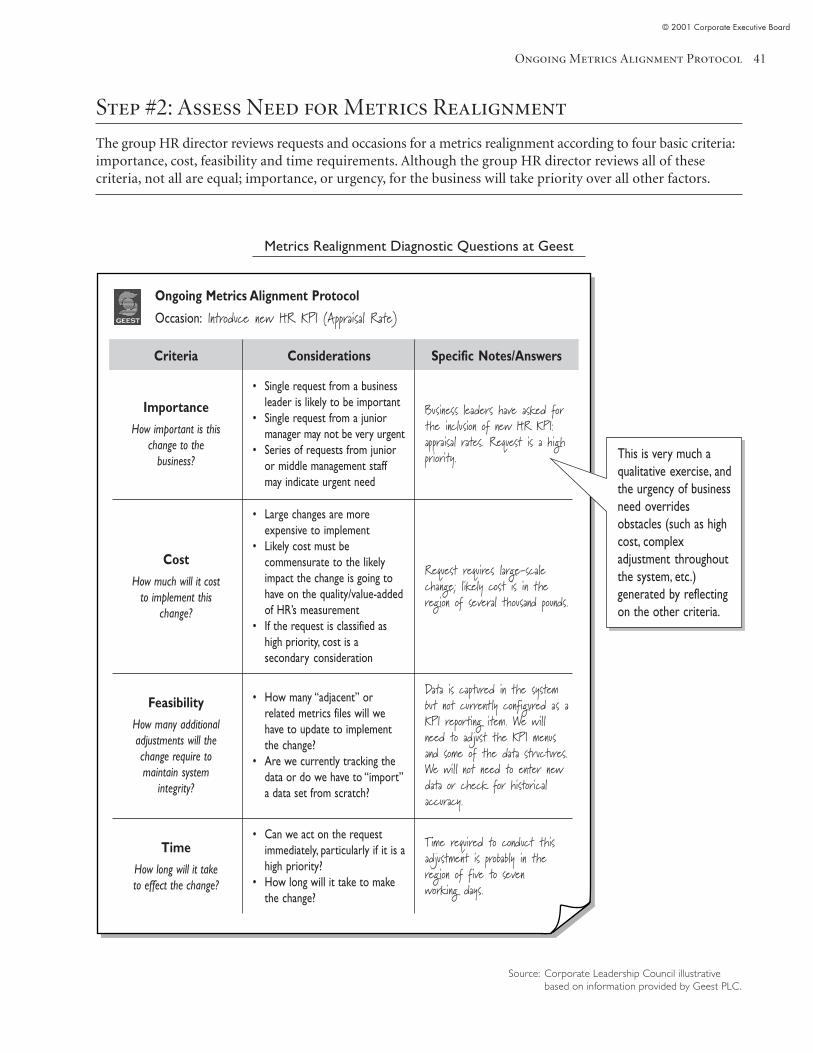
41
Step #2: Assess Need for Metrics Realignment
The group HR director reviews requests and occasions for a metrics realignment according to four basic criteria:importance, cost, feasibility and time requirements. Although the group HR director reviews all of thesecriteria, not all are equal; importance, or urgency, for the business will take priority over all other factors.
Metrics Realignment Diagnostic Questions at Geest
Ongoing Metrics Alignment Protocol
Occasion: Introduce new HR KPI (Appraisal Rate)
Criteria
ImportanceHow important is this
change to thebusiness?
Considerations Specific Notes/Answers
Business leaders have asked forthe inclusion of new HR KPI:appraisal rates. Request is a highpriority.
• Single request from a businessleader is likely to be important
• Single request from a juniormanager may not be very urgent
• Series of requests from junioror middle management staffmay indicate urgent need
Request requires large-scalechange; likely cost is in theregion of several thousand pounds.
Data is captured in the systembut not currently configured as aKPI reporting item. We willneed to adjust the KPI menusand some of the data structures.We will not need to enter newdata or check for historicalaccuracy.
Time required to conduct thisadjustment is probably in theregion of five to sevenworking days.
• Large changes are moreexpensive to implement
• Likely cost must becommensurate to the likelyimpact the change is going tohave on the quality/value-addedof HR’s measurement
• If the request is classified ashigh priority, cost is asecondary consideration
• Can we act on the requestimmediately, particularly if it is ahigh priority?
• How long will it take to makethe change?
• How many “adjacent” orrelated metrics files will wehave to update to implementthe change?
• Are we currently tracking thedata or do we have to “import”a data set from scratch?
CostHow much will it cost
to implement thischange?
FeasibilityHow many additionaladjustments will thechange require tomaintain system
integrity?
TimeHow long will it taketo effect the change?
Source: Corporate Leadership Council illustrativebased on information provided by Geest PLC.
This is very much aqualitative exercise, andthe urgency of businessneed overridesobstacles (such as highcost, complexadjustment throughoutthe system, etc.)generated by reflectingon the other criteria.
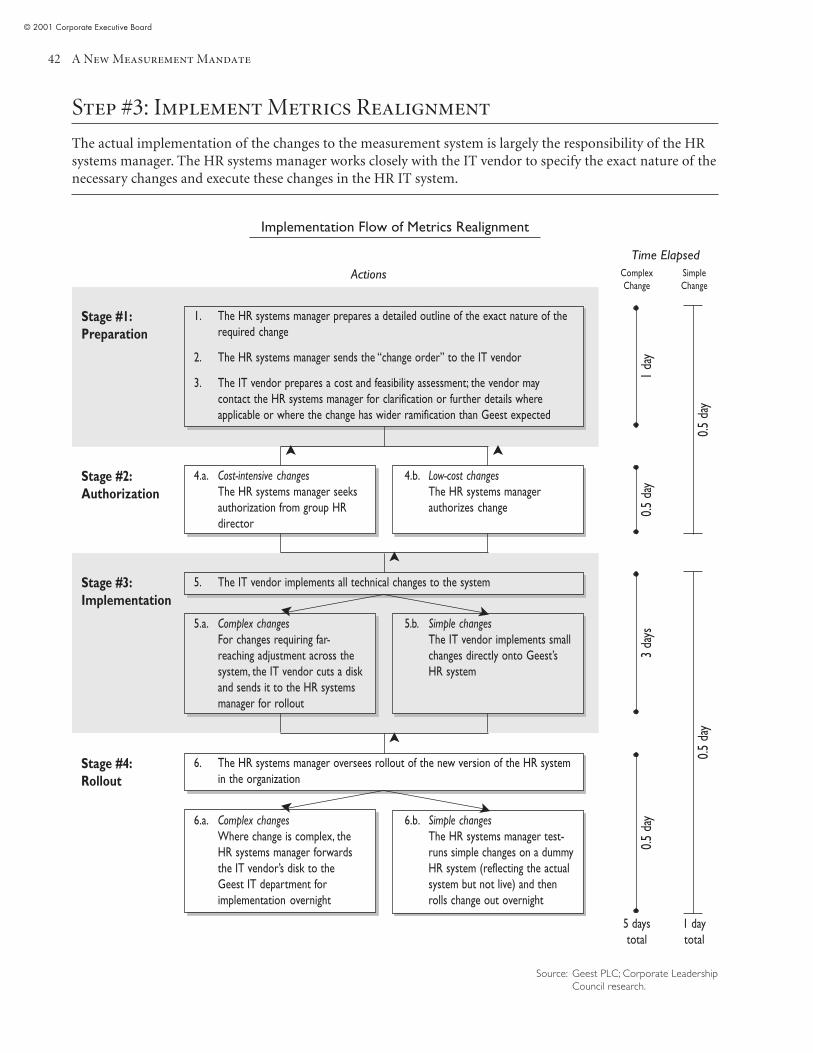
A New Measurement Mandate
© 2001 Corporate Executive Board
42
Step #3: Implement Metrics Realignment
The actual implementation of the changes to the measurement system is largely the responsibility of the HRsystems manager. The HR systems manager works closely with the IT vendor to specify the exact nature of thenecessary changes and execute these changes in the HR IT system.
Implementation Flow of Metrics Realignment
ActionsTime Elapsed
ComplexChange
SimpleChange
Stage #1:Preparation
1. The HR systems manager prepares a detailed outline of the exact nature of therequired change
2. The HR systems manager sends the “change order” to the IT vendor
3. The IT vendor prepares a cost and feasibility assessment; the vendor maycontact the HR systems manager for clarification or further details whereapplicable or where the change has wider ramification than Geest expected
Stage #2:Authorization
4.a. Cost-intensive changesThe HR systems manager seeksauthorization from group HRdirector
4.b. Low-cost changesThe HR systems managerauthorizes change
Stage #3:Implementation
5. The IT vendor implements all technical changes to the system
5.a. Complex changesFor changes requiring far-reaching adjustment across thesystem, the IT vendor cuts a diskand sends it to the HR systemsmanager for rollout
5.b. Simple changesThe IT vendor implements smallchanges directly onto Geest’sHR system
Stage #4:Rollout
6. The HR systems manager oversees rollout of the new version of the HR systemin the organization
6.a. Complex changesWhere change is complex, theHR systems manager forwardsthe IT vendor’s disk to theGeest IT department forimplementation overnight
6.b. Simple changesThe HR systems manager test-runs simple changes on a dummyHR system (reflecting the actualsystem but not live) and thenrolls change out overnight
5 daystotal
1 daytotal
0.5 d
ay0.5
day
0.5 d
ay3
days
0.5 d
ay1
day
➤ ➤
➤
➤
➤ ➤
➤ ➤
Source: Geest PLC; Corporate LeadershipCouncil research.
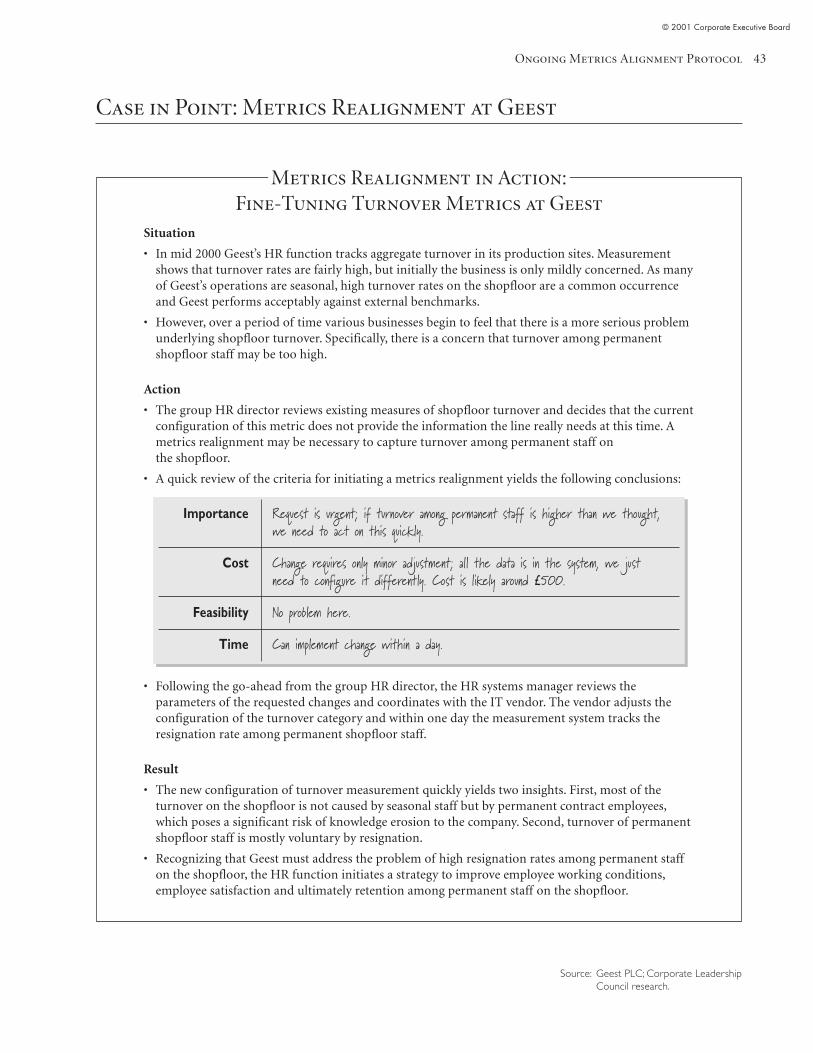
Ongoing Metrics Alignment Protocol
© 2001 Corporate Executive Board
43
Case in Point: Metrics Realignment at Geest
Metrics Realignment in Action:Fine-Tuning Turnover Metrics at Geest
Situation
• In mid 2000 Geest’s HR function tracks aggregate turnover in its production sites. Measurementshows that turnover rates are fairly high, but initially the business is only mildly concerned. As manyof Geest’s operations are seasonal, high turnover rates on the shopfloor are a common occurrenceand Geest performs acceptably against external benchmarks.
• However, over a period of time various businesses begin to feel that there is a more serious problemunderlying shopfloor turnover. Specifically, there is a concern that turnover among permanentshopfloor staff may be too high.
Action
• The group HR director reviews existing measures of shopfloor turnover and decides that the currentconfiguration of this metric does not provide the information the line really needs at this time. Ametrics realignment may be necessary to capture turnover among permanent staff onthe shopfloor.
• A quick review of the criteria for initiating a metrics realignment yields the following conclusions:
• Following the go-ahead from the group HR director, the HR systems manager reviews theparameters of the requested changes and coordinates with the IT vendor. The vendor adjusts theconfiguration of the turnover category and within one day the measurement system tracks theresignation rate among permanent shopfloor staff.
Result
• The new configuration of turnover measurement quickly yields two insights. First, most of theturnover on the shopfloor is not caused by seasonal staff but by permanent contract employees,which poses a significant risk of knowledge erosion to the company. Second, turnover of permanentshopfloor staff is mostly voluntary by resignation.
• Recognizing that Geest must address the problem of high resignation rates among permanent staffon the shopfloor, the HR function initiates a strategy to improve employee working conditions,employee satisfaction and ultimately retention among permanent staff on the shopfloor.
Request is urgent; if turnover among permanent staff is higher than we thought,we need to act on this quickly.
Change requires only minor adjustment; all the data is in the system, we justneed to configure it differently. Cost is likely around £500.
No problem here.
Can implement change within a day.
Importance
Cost
Feasibility
Time
Source: Geest PLC; Corporate LeadershipCouncil research.
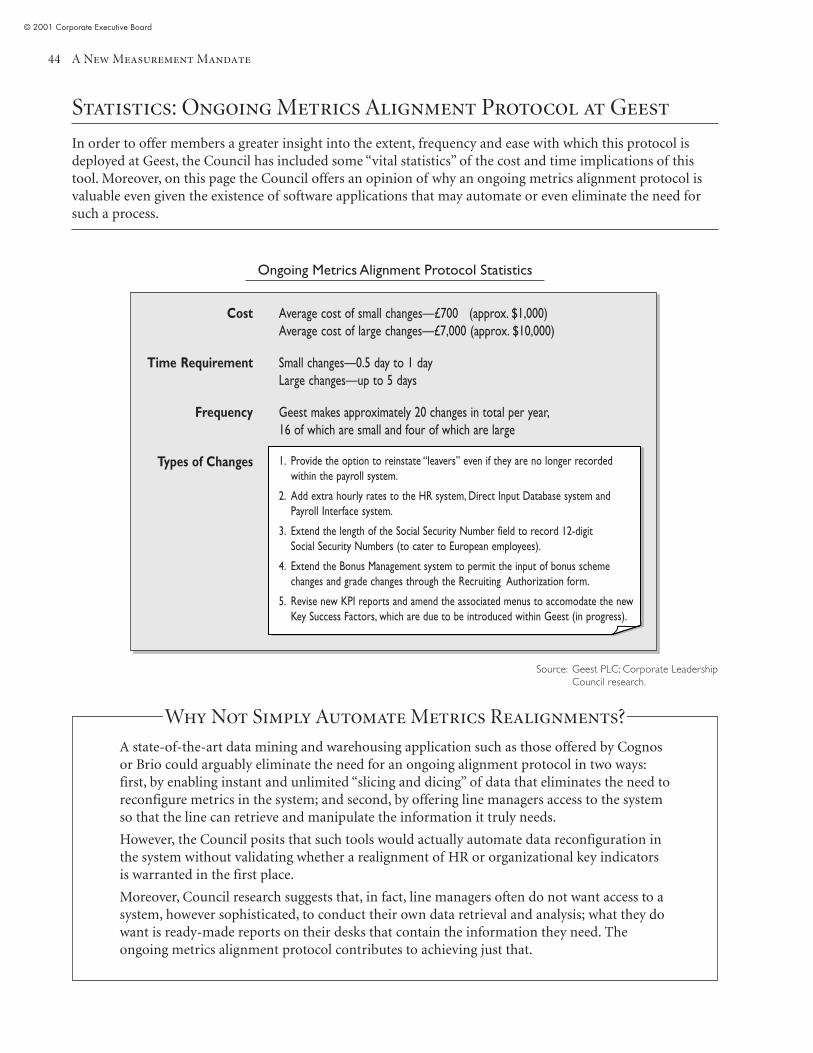
A New Measurement Mandate
© 2001 Corporate Executive Board
44
Why Not Simply Automate Metrics Realignments?
A state-of-the-art data mining and warehousing application such as those offered by Cognosor Brio could arguably eliminate the need for an ongoing alignment protocol in two ways:first, by enabling instant and unlimited “slicing and dicing” of data that eliminates the need toreconfigure metrics in the system; and second, by offering line managers access to the systemso that the line can retrieve and manipulate the information it truly needs.
However, the Council posits that such tools would actually automate data reconfiguration inthe system without validating whether a realignment of HR or organizational key indicatorsis warranted in the first place.
Moreover, Council research suggests that, in fact, line managers often do not want access to asystem, however sophisticated, to conduct their own data retrieval and analysis; what they dowant is ready-made reports on their desks that contain the information they need. Theongoing metrics alignment protocol contributes to achieving just that.
Statistics: Ongoing Metrics Alignment Protocol at Geest
In order to offer members a greater insight into the extent, frequency and ease with which this protocol isdeployed at Geest, the Council has included some “vital statistics” of the cost and time implications of thistool. Moreover, on this page the Council offers an opinion of why an ongoing metrics alignment protocol isvaluable even given the existence of software applications that may automate or even eliminate the need forsuch a process.
Ongoing Metrics Alignment Protocol Statistics
Cost
Time Requirement
Frequency
Types of Changes
Average cost of small changes—£700 (approx. $1,000)Average cost of large changes—£7,000 (approx. $10,000)
Small changes—0.5 day to 1 dayLarge changes—up to 5 days
Geest makes approximately 20 changes in total per year,16 of which are small and four of which are large
1. Provide the option to reinstate “leavers” even if they are no longer recordedwithin the payroll system.
2. Add extra hourly rates to the HR system, Direct Input Database system andPayroll Interface system.
3. Extend the length of the Social Security Number field to record 12-digitSocial Security Numbers (to cater to European employees).
4. Extend the Bonus Management system to permit the input of bonus schemechanges and grade changes through the Recruiting Authorization form.
5. Revise new KPI reports and amend the associated menus to accomodate the newKey Success Factors, which are due to be introduced within Geest (in progress).
Source: Geest PLC; Corporate LeadershipCouncil research.
Ongoing Metrics Alignment Protocol
© 2001 Corporate Executive Board
45
Council Assessment:Ongoing Metrics Alignment Protocol
Key Differentiating Features
• The ongoing metrics alignment protocol differs from standard practice in the ease andspeed with which metrics can be realigned to address changed corporate requirements. Inthis manner, the protocol offers a template for operationalizing a process that many HRfunctions consider critical to their measurement efforts but have not yet attempted toimplement.
• The protocol also offers a strategy for quick realignment of individual metrics while themeasurement and reporting systems remain fully operational at all times; users will notexperience system downtime or data conflicts.
Caveats
• The implementation of this protocol may be cost intensive where companies have noexisting relationships with IT vendors or where internal IT skills are not suited to executingthe tasks described in this practice. However, as the principles outlined in this protocol canbe easily applied to any organization’s existing metrics reporting structure, the Councilsuggests that the cost of conducting ongoing realignment may be significantly less than thecost of buying and rolling out an entire new software application, at least in the midterm.
Implementation Tips
• Identify locus of technical capability—The approach is not predicated on close relations witha particular external vendor. Companies seeking to implement this infrastructure merelyneed to determine who is responsible for the development and maintenance of their HRsystem—whether that individual be inside or outside HR, or internal or external to theorganization. Once that individual or department is identified, it should take little effort toadd a responsibility for metrics realignment to their day-to-day responsibilities.
• Bring ownership of the protocol into HR—The value of the protocol is maximized where theHR function can create an HR position dedicated, at least in part, to executing against thisprotocol. The cost involved in maintaining measurement flexibility likely decreasessignificantly as HR executes more tasks against this protocol independently from IT.
Secondary Benefits
• In addition to realignment, the ongoing metrics alignment protocol provides much-neededcapabilities for quick corrections where HR functions are implementing a concertedmetrics effort for the first time and are necessarily learning by trial and error.

A New Measurement Mandate
© 2001 Corporate Executive Board
46
© 2001 Corporate Executive Board
47
Chapter II:Metrics Rollout
� Step #3: Assigning Ownership of Metrics
• Benchmark Practice #4: Line-Led Workforce Measurement
� Step #4: Creating Performance Incentives
• Benchmark Practice #5: Metrics-Linked Bonus Payouts
� Step #5: Educating the Organization About Metrics
• Benchmark Practice #6: Metrics E-Learning Program

A New Measurement Mandate
© 2001 Corporate Executive Board
48
© 2001 Corporate Executive Board
49
Step #3: Assigning Ownership of Metrics
Benchmark Practice #4
Grandis* Line-Led Workforce Measurement
Description
Business leaders jointly identify pertinent workforce indicators in line with overall HR strategicpriorities and are responsible for stewarding their unit’s performance toward achieving specificmetrics targets assigned to their portfolios of responsibilities.
Goal
The goal is twofold. The first goal is to ensure alignment of metrics with overall businessneeds. The second goal is to hardwire line engagement and active support of the HRmeasurement process.
Key Differentiating Feature
This approach is unparalleled in its assignment of line ownership for HR strategyand measurement.
Further Best Practice Encountered in the Course of Research
Functional Metrics Ownership
Description
Cisco organizes its metrics efforts by groups (functions) of employees sharing the same role,such as engineering or sales, across all its business units. The rationale is that the functionalgroup provides a more meaningful unit of aggregation for data relating to compensation,retention, etc.
Goal
The goal is to monitor trends in relation to groups of employees that share the samecharacteristics and interests rather than by aggregate business units.
* Pseudonym.

A New Measurement Mandate
© 2001 Corporate Executive Board
50
© 2001 Corporate Executive Board
51
Council Essay: Assigning Ownership for Metrics
Out of the practices profiled in this brief, the approach profiled here likely poses the greatest implementationchallenge for HR functions. On this page, therefore, the Council addresses the key obstacles HR faces whenattempting to introduce line ownership of metrics and suggests a series of avenues for overcoming such obstacles.
Practice Drivers• One of the most frequently cited reasons for the lack of impact or value of HR’s measurement
effort is the fact that the organization at large does not use HR metrics in its decision- orstrategy-making processes.
• The key underlying problem is that line executives have traditionally not considered HRmetrics to be a true source of management intelligence that can enhance their ability to realizebusiness goals by offering valuable, even critical, information.
• Council research highlights that the most effective strategy for ensuring that HR measurementinformation is fully leveraged for business strategy is to place ownership of HR metrics withthose parts of the organization that should be the true beneficiaries: line executives.
Key Obstacles• The key obstacle to implementing such a strategy is that, in focusing on market, revenue and
customer issues, line managers often feel little to no responsibility for workforce managementissues. The common refrain is “that’s HR’s responsibility.”
• This reluctance is compounded when it comes to HR measurement, not least because metricscan quickly carry compensation implications that line executives may consider unacceptable ifthey do not recognize that they conduct HR-like functions in the context of their jobs.
Implementation Tips• Enhance HR’s business outlook—Preparatory action must be to imbue the HR function with a
strong business orientation so that HR staff can be professional and credible when they begin tointeract with line managers on the matter of HR metrics.
• Provide incentives—If the process is properly configured, it is in each executive’s interest tobecome an owner of workforce measurement because metrics will closely tie into business goalsand provide critical information for strategic decisions.
• Enlist key individuals—Once a key decision maker accepts the benefits of line-led workforcemeasurement at least in principle, HR can work with that individual and introduce the conceptto a larger audience, leveraging the key decision maker’s influence and credibility.
• Conduct pilot—If a particular business unit is receptive to a trial of line ownership, HR shouldconduct a pilot and closely record results and obstacles along the way. Not only will a pilotenable HR to improve the proposed process, but it also creates evidence that can be used toconvince other business units of the value of this approach.
• Leverage CEO support—Where the CEO works closely with HR on workforce managementissues, HR can leverage that relationship and, through lines of authority in the organization,exert pressure on the line to accept line ownership of HR metrics.
A New Measurement Mandate
© 2001 Corporate Executive Board
52
Practice Background:Line-Led Workforce Measurement
Grandis Company* is a large multinational corporation operating in the energyindustry. The company employs more than 100,000 individuals and generatesannual revenues in excess of $20 billion.
Situation
• The HR department at Grandis Company strongly espouses a performance-drivenapproach to the management of workforce issues and seeks to align HR strategy andmetrics with business priorities.
• Recognizing that a line-led approach to HR strategy formulation is the most efficientand substantive way of fostering true alignment between business and HR strategy,the HR department must develop a protocol for hardwiring line ownership of the HRstrategy—and measurement—process.
Action
• The HR department develops a common process for formulating workforce managementstrategy that will feed into the overall business planning process. HR professionals receivetraining to promote the use of this process to ensure involvement of business unitexecutives in facilitated planning sessions to establish priorities, action plans andmeasurements for execution against strategic workforce initiatives in their business units.
• From a measurement perspective, the new line-led process helps to transfer responsibility fordefining HR metrics and managing performance toward specific goals from the HR functionto the line, creating a significant element of line ownership of workforce measurement.
• In addition to defining pertinent HR metrics, line ownership of metrics involves managingthe business units’ performance against HR metrics targets and taking remedial actionswhere necessary. Line ownership does not, however, involve responsibility for tracking andcompiling data; such tasks remain within the domain of HR.
Result
• Strategically aligned workforce management metrics become part of a small selectionof overall business performance indicators designed to enhance Grandis Company’scontinued growth.
Grandis*
* Pseudonym.
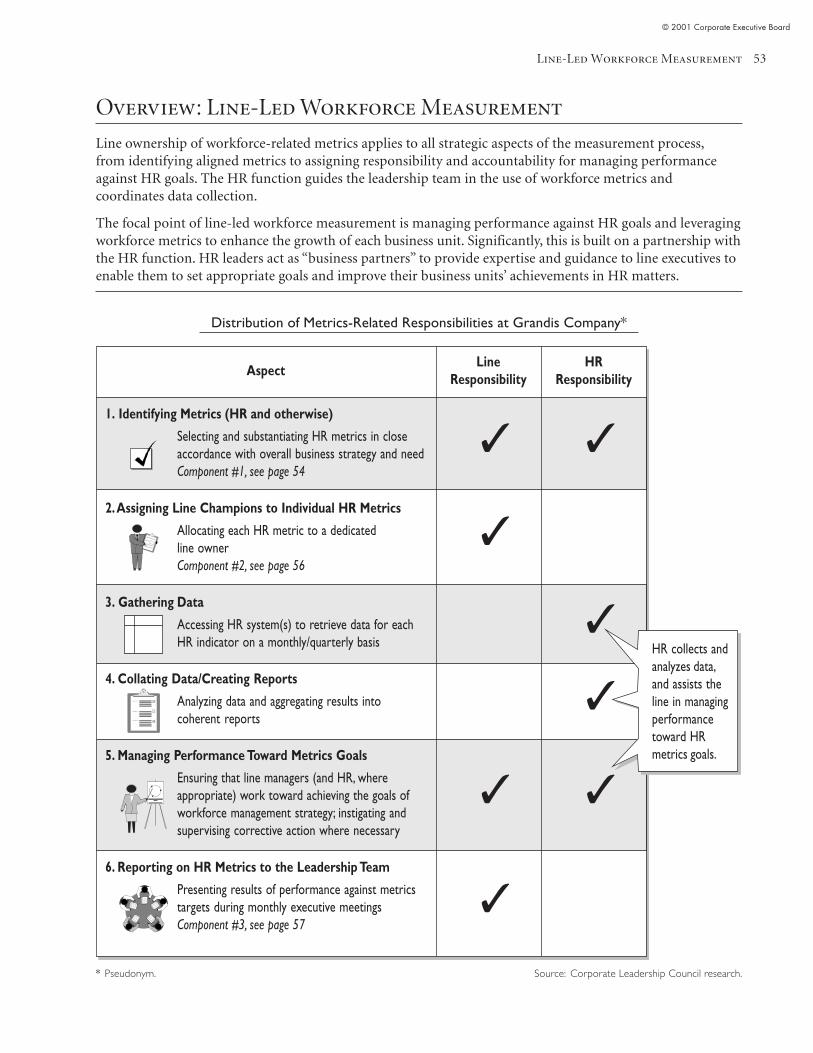
Line-Led Workforce Measurement
© 2001 Corporate Executive Board
53
Overview: Line-Led Workforce Measurement
Line ownership of workforce-related metrics applies to all strategic aspects of the measurement process,from identifying aligned metrics to assigning responsibility and accountability for managing performanceagainst HR goals. The HR function guides the leadership team in the use of workforce metrics andcoordinates data collection.
The focal point of line-led workforce measurement is managing performance against HR goals and leveragingworkforce metrics to enhance the growth of each business unit. Significantly, this is built on a partnership withthe HR function. HR leaders act as “business partners” to provide expertise and guidance to line executives toenable them to set appropriate goals and improve their business units’ achievements in HR matters.
Source: Corporate Leadership Council research.
Distribution of Metrics-Related Responsibilities at Grandis Company*
* Pseudonym.
LineResponsibility
HRResponsibility
Question One:
Question Two:
Question Three:
1. Identifying Metrics (HR and otherwise)
Selecting and substantiating HR metrics in closeaccordance with overall business strategy and needComponent #1, see page 54
2. Assigning Line Champions to Individual HR Metrics
Allocating each HR metric to a dedicatedline ownerComponent #2, see page 56
3. Gathering Data
Accessing HR system(s) to retrieve data for eachHR indicator on a monthly/quarterly basis
4. Collating Data/Creating Reports
Analyzing data and aggregating results intocoherent reports
5. Managing Performance Toward Metrics Goals
Ensuring that line managers (and HR, whereappropriate) work toward achieving the goals ofworkforce management strategy; instigating andsupervising corrective action where necessary
6. Reporting on HR Metrics to the Leadership Team
Presenting results of performance against metricstargets during monthly executive meetingsComponent #3, see page 57
✓ ✓
✓
✓
✓ ✓
✓
✓
HR collects andanalyzes data,and assists theline in managingperformancetoward HRmetrics goals.
Aspect
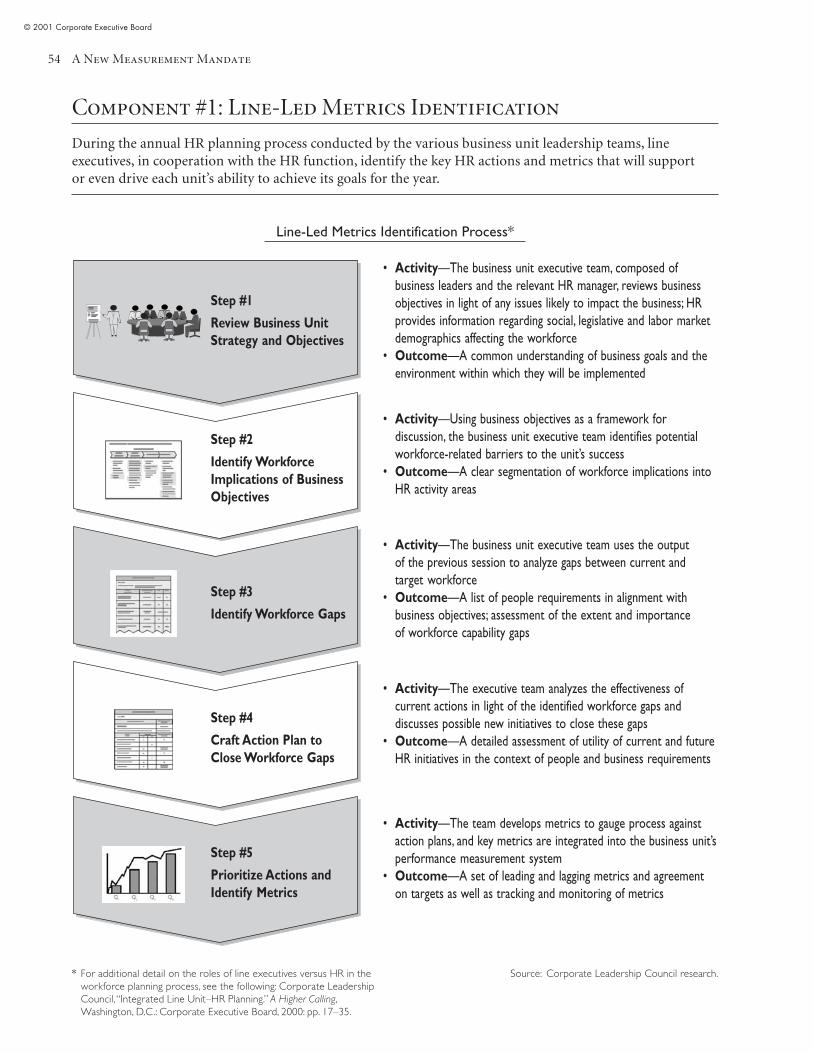
A New Measurement Mandate
© 2001 Corporate Executive Board
54
Component #1: Line-Led Metrics Identification
During the annual HR planning process conducted by the various business unit leadership teams, lineexecutives, in cooperation with the HR function, identify the key HR actions and metrics that will supportor even drive each unit’s ability to achieve its goals for the year.
Line-Led Metrics Identification Process*
* For additional detail on the roles of line executives versus HR in theworkforce planning process, see the following: Corporate LeadershipCouncil, “Integrated Line Unit–HR Planning.” A Higher Calling,Washington, D.C.: Corporate Executive Board, 2000: pp. 17–35.
• Activity—The business unit executive team uses the outputof the previous session to analyze gaps between current andtarget workforce
• Outcome—A list of people requirements in alignment withbusiness objectives; assessment of the extent and importanceof workforce capability gaps
• Activity—The business unit executive team, composed ofbusiness leaders and the relevant HR manager, reviews businessobjectives in light of any issues likely to impact the business; HRprovides information regarding social, legislative and labor marketdemographics affecting the workforce
• Outcome—A common understanding of business goals and theenvironment within which they will be implemented
• Activity—Using business objectives as a framework fordiscussion, the business unit executive team identifies potentialworkforce-related barriers to the unit’s success
• Outcome—A clear segmentation of workforce implications intoHR activity areas
• Activity—The team develops metrics to gauge process againstaction plans, and key metrics are integrated into the business unit’sperformance measurement system
• Outcome—A set of leading and lagging metrics and agreementon targets as well as tracking and monitoring of metrics
• Activity—The executive team analyzes the effectiveness ofcurrent actions in light of the identified workforce gaps anddiscusses possible new initiatives to close these gaps
• Outcome—A detailed assessment of utility of current and futureHR initiatives in the context of people and business requirements
Step #1
Review Business UnitStrategy and Objectives
Step #2
Identify WorkforceImplications of BusinessObjectives
Step #3
Identify Workforce Gaps
Step #4
Craft Action Plan toClose Workforce Gaps
Step #5
Prioritize Actions andIdentify Metrics
Source: Corporate Leadership Council research.
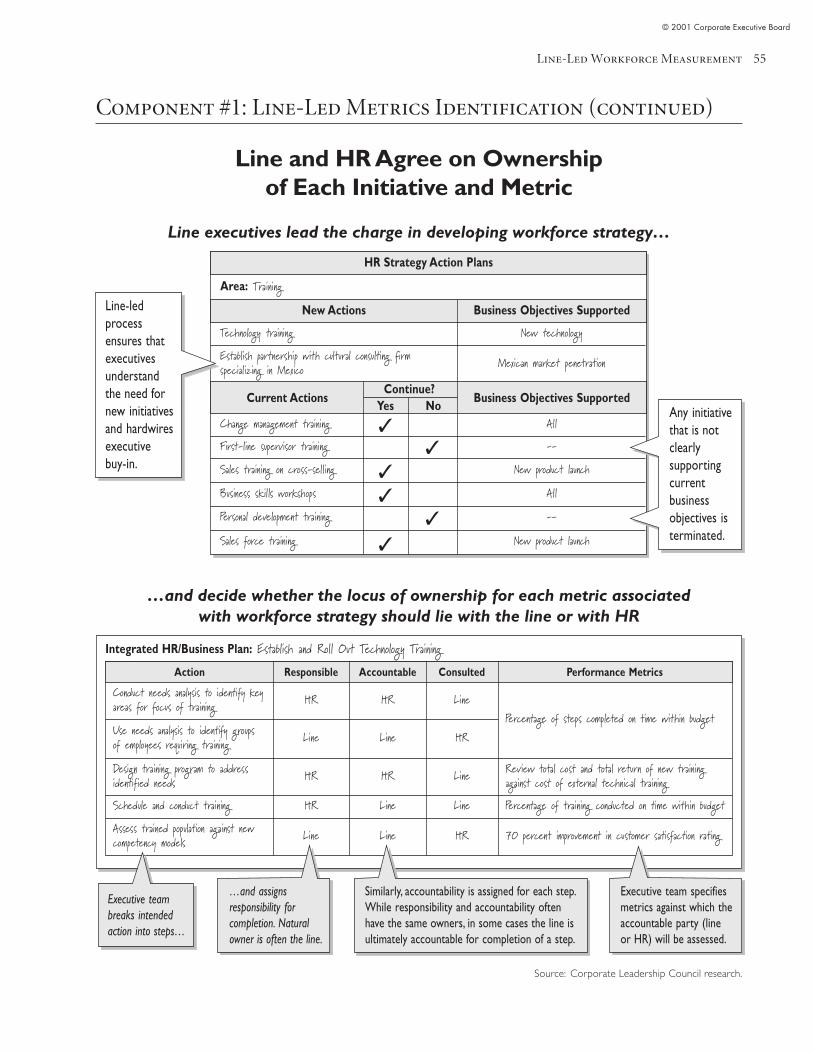
Line-Led Workforce Measurement
© 2001 Corporate Executive Board
55
Component #1: Line-Led Metrics Identification (continued)
Line and HR Agree on Ownershipof Each Initiative and Metric
Line executives lead the charge in developing workforce strategy…
…and decide whether the locus of ownership for each metric associatedwith workforce strategy should lie with the line or with HR
Area: Training
Change management training
Technology training New technology
Establish partnership with cultural consulting firmspecializing in Mexico Mexican market penetration
All
New product launch
First-line supervisor training
Sales training on cross-selling
AllBusiness skil ls workshops
New product launch
Personal development training
Sales force training
Integrated HR/Business Plan: Establish and Roll Out Technology Training
HR Strategy Action Plans
New Actions Business Objectives Supported
Business Objectives SupportedCurrent ActionsContinue?
Yes No
✓
✓
✓
✓
✓
✓
Line-ledprocessensures thatexecutivesunderstandthe need fornew initiativesand hardwiresexecutivebuy-in.
--
--
Action Responsible Accountable Consulted Performance Metrics
Conduct needs analysis to identify keyareas for focus of training HR HR Line
Percentage of steps completed on time within budgetUse needs analysis to identify groupsof employees requiring training Line Line HR
Design training program to addressidentified needs HR HR Line Review total cost and total return of new training
against cost of external technical training
Schedule and conduct training HR Line Line Percentage of training conducted on time within budget
Assess trained population against newcompetency models Line Line HR 70 percent improvement in customer satisfaction rating
Executive teambreaks intendedaction into steps…
…and assignsresponsibility forcompletion. Naturalowner is often the line.
Similarly, accountability is assigned for each step.While responsibility and accountability oftenhave the same owners, in some cases the line isultimately accountable for completion of a step.
Executive team specifiesmetrics against which theaccountable party (lineor HR) will be assessed.
Source: Corporate Leadership Council research.
Any initiativethat is notclearlysupportingcurrentbusinessobjectives isterminated.
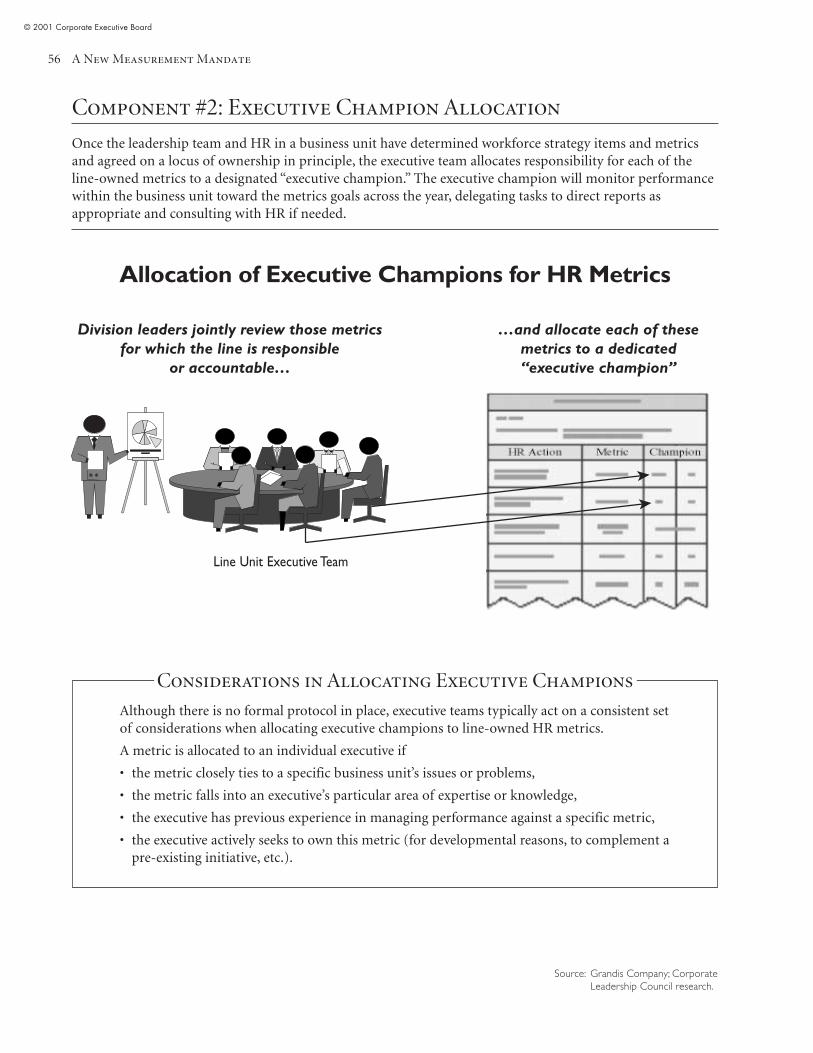
A New Measurement Mandate
© 2001 Corporate Executive Board
56
Component #2: Executive Champion Allocation
Once the leadership team and HR in a business unit have determined workforce strategy items and metricsand agreed on a locus of ownership in principle, the executive team allocates responsibility for each of theline-owned metrics to a designated “executive champion.” The executive champion will monitor performancewithin the business unit toward the metrics goals across the year, delegating tasks to direct reports asappropriate and consulting with HR if needed.
Allocation of Executive Champions for HR Metrics
Considerations in Allocating Executive Champions
Although there is no formal protocol in place, executive teams typically act on a consistent setof considerations when allocating executive champions to line-owned HR metrics.
A metric is allocated to an individual executive if
• the metric closely ties to a specific business unit’s issues or problems,
• the metric falls into an executive’s particular area of expertise or knowledge,
• the executive has previous experience in managing performance against a specific metric,
• the executive actively seeks to own this metric (for developmental reasons, to complement apre-existing initiative, etc.).
Division leaders jointly review those metricsfor which the line is responsible
or accountable…
…and allocate each of thesemetrics to a dedicated“executive champion”
Source: Grandis Company; CorporateLeadership Council research.
Line Unit Executive Team
➤
➤
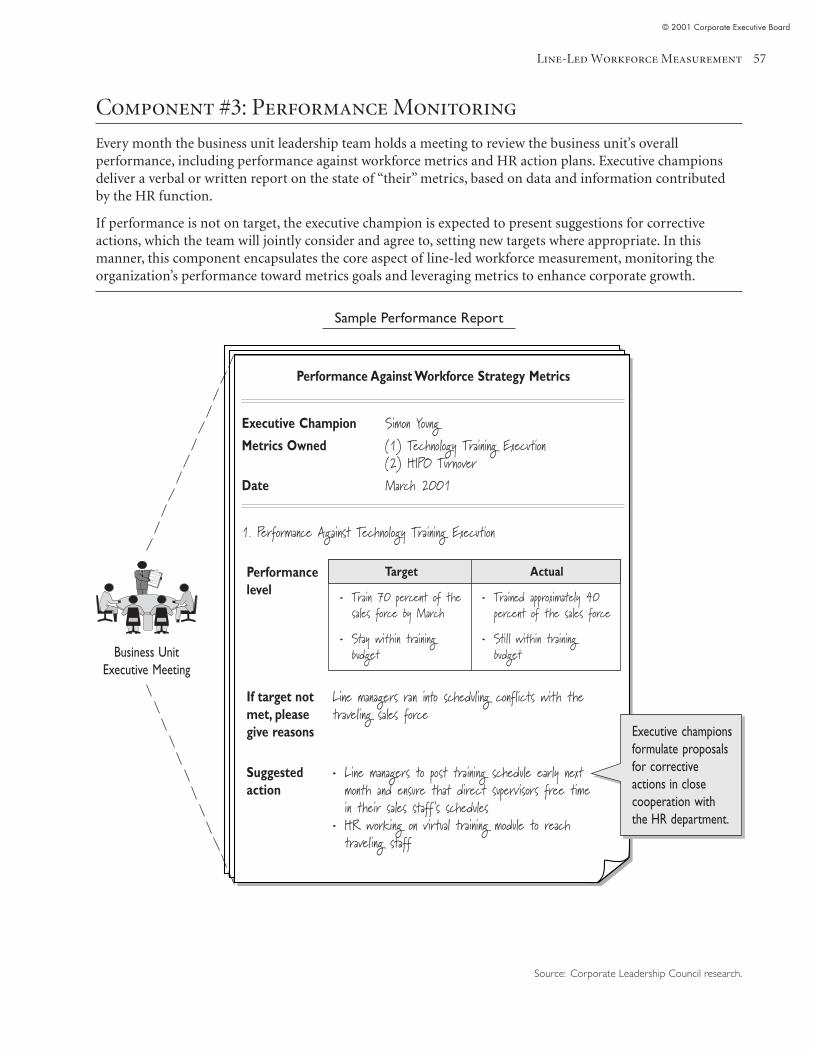
Line-Led Workforce Measurement
© 2001 Corporate Executive Board
57
Component #3: Performance Monitoring
Every month the business unit leadership team holds a meeting to review the business unit’s overallperformance, including performance against workforce metrics and HR action plans. Executive championsdeliver a verbal or written report on the state of “their” metrics, based on data and information contributedby the HR function.
If performance is not on target, the executive champion is expected to present suggestions for correctiveactions, which the team will jointly consider and agree to, setting new targets where appropriate. In thismanner, this component encapsulates the core aspect of line-led workforce measurement, monitoring theorganization’s performance toward metrics goals and leveraging metrics to enhance corporate growth.
Sample Performance Report
Performance Against Workforce Strategy Metrics
Business UnitExecutive Meeting
Executive Champion Simon YoungMetrics Owned (1) Technology Training Execution
(2) HIPO TurnoverDate March 2001
1. Performance Against Technology Training Execution
If target notmet, pleasegive reasons
Suggestedaction
Performancelevel
Line managers ran into scheduling conflicts with thetraveling sales force
• Line managers to post training schedule early nextmonth and ensure that direct supervisors free timein their sales staff 's schedules
• HR working on virtual training module to reachtraveling staff
Target
• Train 70 percent of thesales force by March
• Stay within trainingbudget
Actual
• Trained approximately 40percent of the sales force
• Stil l within trainingbudget
Executive championsformulate proposalsfor correctiveactions in closecooperation withthe HR department.
Source: Corporate Leadership Council research.
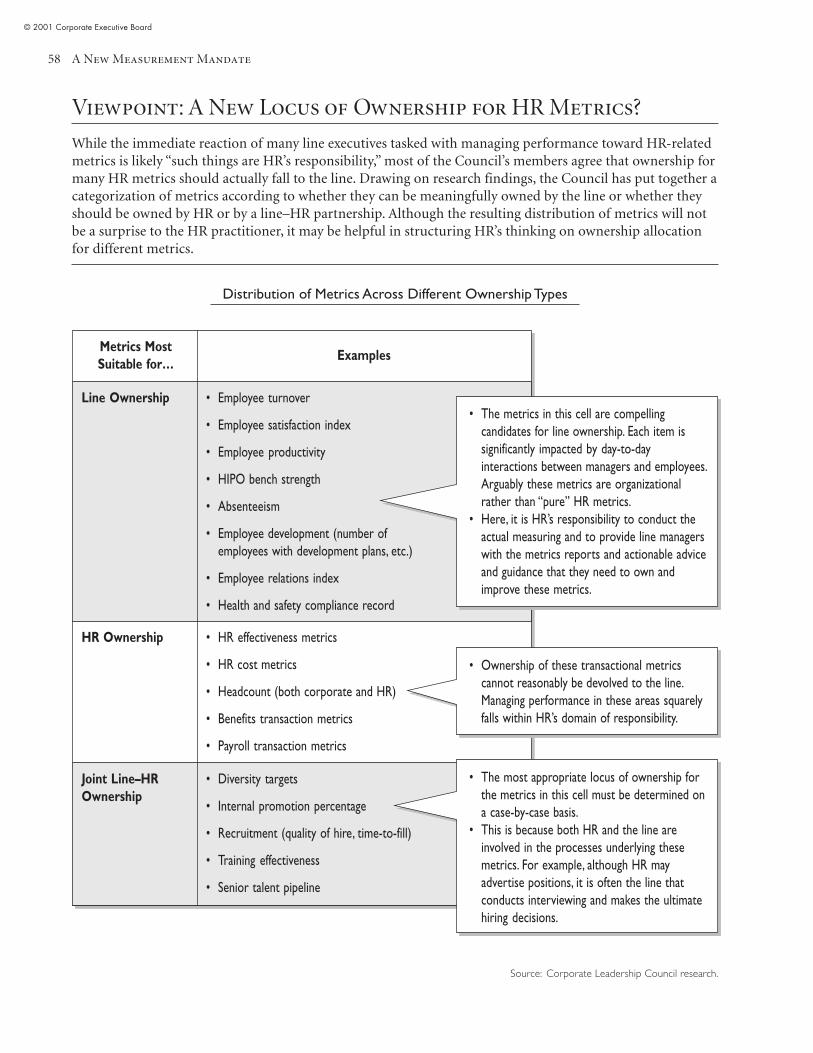
A New Measurement Mandate
© 2001 Corporate Executive Board
58
Viewpoint: A New Locus of Ownership for HR Metrics?
While the immediate reaction of many line executives tasked with managing performance toward HR-relatedmetrics is likely “such things are HR’s responsibility,” most of the Council’s members agree that ownership formany HR metrics should actually fall to the line. Drawing on research findings, the Council has put together acategorization of metrics according to whether they can be meaningfully owned by the line or whether theyshould be owned by HR or by a line–HR partnership. Although the resulting distribution of metrics will notbe a surprise to the HR practitioner, it may be helpful in structuring HR’s thinking on ownership allocationfor different metrics.
Distribution of Metrics Across Different Ownership Types
• Employee turnover
• Employee satisfaction index
• Employee productivity
• HIPO bench strength
• Absenteeism
• Employee development (number ofemployees with development plans, etc.)
• Employee relations index
• Health and safety compliance record
ExamplesMetrics MostSuitable for…
Line Ownership
HR Ownership • HR effectiveness metrics
• HR cost metrics
• Headcount (both corporate and HR)
• Benefits transaction metrics
• Payroll transaction metrics
Joint Line–HROwnership
• Diversity targets
• Internal promotion percentage
• Recruitment (quality of hire, time-to-fill)
• Training effectiveness
• Senior talent pipeline
• The metrics in this cell are compellingcandidates for line ownership. Each item issignificantly impacted by day-to-dayinteractions between managers and employees.Arguably these metrics are organizationalrather than “pure” HR metrics.
• Here, it is HR’s responsibility to conduct theactual measuring and to provide line managerswith the metrics reports and actionable adviceand guidance that they need to own andimprove these metrics.
• Ownership of these transactional metricscannot reasonably be devolved to the line.Managing performance in these areas squarelyfalls within HR’s domain of responsibility.
• The most appropriate locus of ownership forthe metrics in this cell must be determined ona case-by-case basis.
• This is because both HR and the line areinvolved in the processes underlying thesemetrics. For example, although HR mayadvertise positions, it is often the line thatconducts interviewing and makes the ultimatehiring decisions.
Source: Corporate Leadership Council research.
Line-Led Workforce Measurement
© 2001 Corporate Executive Board
59
Council Assessment:Line-Led Workforce Measurement
Key Differentiating Feature
• The approach is unparalleled in its assignment of line ownership for HR strategyand measurement.
Caveat
• The effective use of the practice is predicated on HR’s ability to secure line buy-in to theentire joint workforce planning and measurement process. Where the line does not outrightlead strategy formulation and metrics identification activities, it is improbable that lineexecutives will accept responsibility or accountability for workforce metrics.
Implementation Tips
• Enhance HR’s business outlook—Preparatory action must be to imbue the HR function witha strong business orientation so that HR staff can be professional and credible when theybegin to interact with line managers on the matter of HR metrics.
• Provide incentives—If the process is properly configured, it is in each executive’s interest tobecome an owner of workforce measurement because metrics will closely tie into businessgoals and provide critical information for strategic decisions.
• Enlist key individuals—Once a key decision maker accepts the benefits of line-led workforcemeasurement at least in principle, HR can work with that individual and introduce theconcept to a larger audience, leveraging the key decision maker’s influence and credibility.
• Conduct pilot—If a particular business unit is receptive to a trial of line ownership, HRshould conduct a pilot and closely record results and obstacles along the way. Not only willa pilot enable HR to improve the proposed process, but it also creates evidence that can beused to convince other business units of the value of this approach.
• Leverage CEO support—Where the CEO works closely with HR on workforce managementissues, HR can leverage that relationship and, through lines of authority in theorganization, exert pressure on the line to accept line ownership of HR metrics.

A New Measurement Mandate
© 2001 Corporate Executive Board
60
© 2001 Corporate Executive Board
61
Step #4: Creating Performance Incentives
Benchmark Practice #5
Metrics-Linked Bonus Payouts
Description
The size of bonus payments for executives is directly linked to the performance of their businessunits against a portfolio of key metrics, including employee turnover and employee satisfaction.The exact composition of the metrics portfolio varies by business unit according to that unit’sstrategic priorities, and executives have some leeway in determining the weighting and targetsassociated with each metric.
Goal
The goal is threefold. First, to create accountability for performance against key businessindicators. Second, to align the company’s management bonus plan toward common strategicgoals. And third, to embed the use of metrics in strategic decision making.
Key Differentiating Feature
This approach differs from standard practice in the stringency and rigor applied to linkingHR-related metrics to executive performance bonuses.
A New Measurement Mandate
© 2001 Corporate Executive Board
62
Practice Background:Metrics-Linked Bonus Payouts
Automatic Data Processing (ADP) is one of the largest payroll and tax-filing processorsin the world. The company employs approximately 40,000 individuals and generatesannual revenues of approximately $7 billion.
Situation
• The VP of HR at ADP’s National Accounts Services (NAS) division recognizes that thefunction is ill poised to deliver against ADP’s corporate-wide priorities of providingworld-class service to its customers and becoming an employer of choice. The VP of HRsuspects that the division’s specific obstacles are directly related to high levels of employeeturnover and employee dissatisfaction within the workplace.
• In order to substantiate this assumption and to gather viable data for charting a necessarycourse of improvement, in 1999 the VP of HR introduces a divisionwide system fortracking performance against business and HR priorities.
• Because a concerted approach to measurement is new to the division and performance inkey areas requires quick and drastic improvement, the VP of HR seeks a mechanism forhardwiring accountability while incenting executives to manage performance toward theaggressive goals, especially in the area of employee turnover and satisfaction.
Action
• Based on previous experience in this field, the VP of HR decides that the most powerfulway of encouraging executives to buy into the new measurement system is to link at leastpart of their compensation to the achievement of specific metrics-related targets.
• To this end, the VP of HR empowers the compensation function to create a metrics-linkedbonus plan for the division’s 350 leaders. Spanning ADP NAS’s balanced scorecardcategories, the bonus plan incorporates metrics (called “bonus indicators”) that directlyrelate to HR, e.g., employee turnover and satisfaction, as well as business-specific metricsrelating to customer service, financial and operational excellence.
• Developing the bonus plan involves four components:
Component #1—Identification of Bonus Indicators See page 65
Component #2—Weighting of Bonus Indicators See page 66
Component #3—Setting Targets for Bonus Indicators See page 67
Component #4—Performance Scaling See page 68
Result
• Over the measurement period following the introduction of the metrics-linked bonus plan,turnover in the division declines significantly while employee satisfaction improves byseveral points.
• Overall performance of the division sees an aggressive turnaround, making the division acenter of excellence in the corporation; other divisions are now asking for the measurementand bonus-plan system to be rolled out across the organization to enable them to achievesimilar results.
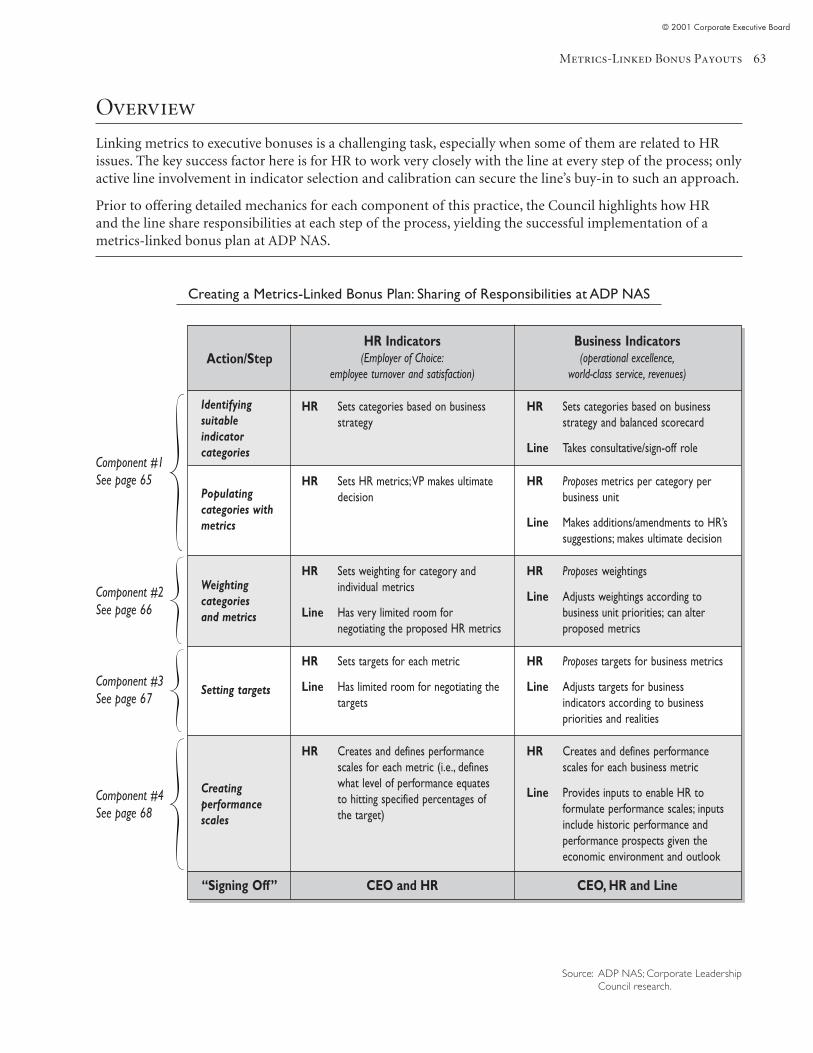
Metrics-Linked Bonus Payouts
© 2001 Corporate Executive Board
63
Overview
Linking metrics to executive bonuses is a challenging task, especially when some of them are related to HRissues. The key success factor here is for HR to work very closely with the line at every step of the process; onlyactive line involvement in indicator selection and calibration can secure the line’s buy-in to such an approach.
Prior to offering detailed mechanics for each component of this practice, the Council highlights how HRand the line share responsibilities at each step of the process, yielding the successful implementation of ametrics-linked bonus plan at ADP NAS.
Source: ADP NAS; Corporate LeadershipCouncil research.
Creating a Metrics-Linked Bonus Plan: Sharing of Responsibilities at ADP NAS
Component #4See page 68
Business Indicators(operational excellence,
world-class service, revenues)Action/Step
HR Indicators(Employer of Choice:
employee turnover and satisfaction)
Populatingcategories withmetrics
HR Sets HR metrics; VP makes ultimatedecision
HR Proposes metrics per category perbusiness unit
Line Makes additions/amendments to HR’ssuggestions; makes ultimate decision
Setting targets
HR Sets targets for each metric
Line Has limited room for negotiating thetargets
HR Proposes targets for business metrics
Line Adjusts targets for businessindicators according to businesspriorities and realities
CEO, HR and Line“Signing Off” CEO and HR
Component #1See page 65
Component #2See page 66
Component #3See page 67
Creatingperformancescales
HR Creates and defines performancescales for each metric (i.e., defineswhat level of performance equatesto hitting specified percentages ofthe target)
HR Creates and defines performancescales for each business metric
Line Provides inputs to enable HR toformulate performance scales; inputsinclude historic performance andperformance prospects given theeconomic environment and outlook
Weightingcategoriesand metrics
HR Sets weighting for category andindividual metrics
Line Has very limited room fornegotiating the proposed HR metrics
HR Proposes weightings
Line Adjusts weightings according tobusiness unit priorities; can alterproposed metrics
Identifyingsuitableindicatorcategories
HR Sets categories based on businessstrategy
HR Sets categories based on businessstrategy and balanced scorecard
Line Takes consultative/sign-off role

A New Measurement Mandate
© 2001 Corporate Executive Board
64
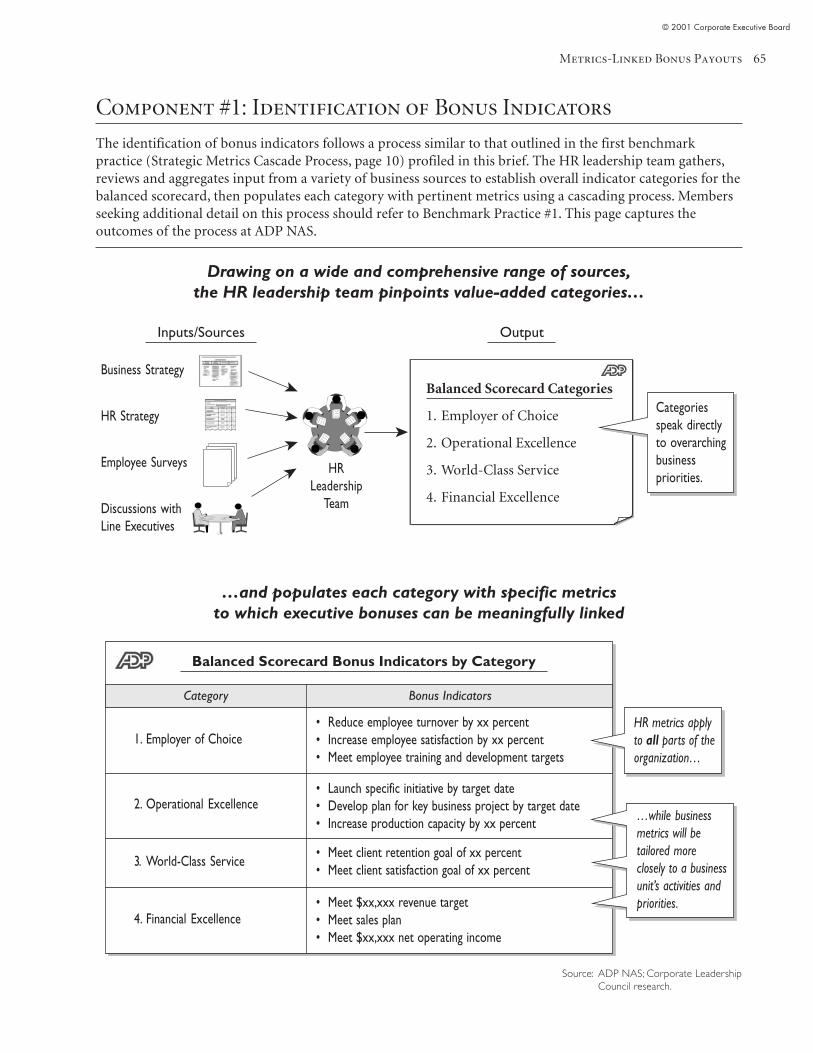
Metrics-Linked Bonus Payouts
© 2001 Corporate Executive Board
65
Component #1: Identification of Bonus Indicators
The identification of bonus indicators follows a process similar to that outlined in the first benchmarkpractice (Strategic Metrics Cascade Process, page 10) profiled in this brief. The HR leadership team gathers,reviews and aggregates input from a variety of business sources to establish overall indicator categories for thebalanced scorecard, then populates each category with pertinent metrics using a cascading process. Membersseeking additional detail on this process should refer to Benchmark Practice #1. This page captures theoutcomes of the process at ADP NAS.
…and populates each category with specific metricsto which executive bonuses can be meaningfully linked
Business Strategy
HR Strategy
Employee Surveys
Discussions withLine Executives
Inputs/Sources Output
HRLeadership
Team
Balanced Scorecard Categories
1. Employer of Choice
2. Operational Excellence
3. World-Class Service
4. Financial Excellence
4. Financial Excellence
Balanced Scorecard Bonus Indicators by Category
1. Employer of Choice• Reduce employee turnover by xx percent• Increase employee satisfaction by xx percent• Meet employee training and development targets
2. Operational Excellence• Launch specific initiative by target date• Develop plan for key business project by target date• Increase production capacity by xx percent
• Meet client retention goal of xx percent• Meet client satisfaction goal of xx percent
3. World-Class Service
• Meet $xx,xxx revenue target• Meet sales plan• Meet $xx,xxx net operating income
Category Bonus Indicators
HR metrics applyto all parts of theorganization…
…while businessmetrics will betailored moreclosely to a businessunit’s activities andpriorities.
Categoriesspeak directlyto overarchingbusinesspriorities.
➤➤
➤
➤
➤
Source: ADP NAS; Corporate LeadershipCouncil research.
Drawing on a wide and comprehensive range of sources,the HR leadership team pinpoints value-added categories…
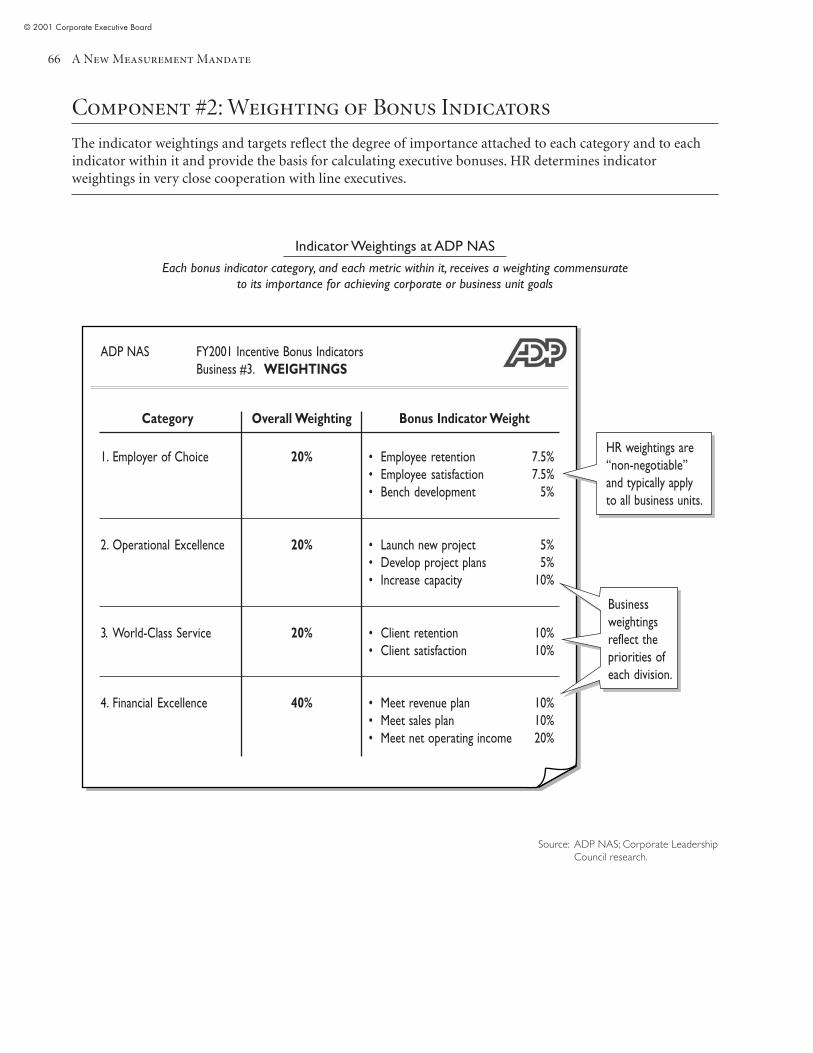
A New Measurement Mandate
© 2001 Corporate Executive Board
66
Component #2: Weighting of Bonus Indicators
The indicator weightings and targets reflect the degree of importance attached to each category and to eachindicator within it and provide the basis for calculating executive bonuses. HR determines indicatorweightings in very close cooperation with line executives.
Indicator Weightings at ADP NAS
Each bonus indicator category, and each metric within it, receives a weighting commensurateto its importance for achieving corporate or business unit goals
ADP NAS FY2001 Incentive Bonus IndicatorsBusiness #3. WEIGHTINGS
Category
1. Employer of Choice
Overall Weighting Bonus Indicator Weight
• Employee retention 7.5%• Employee satisfaction 7.5%• Bench development 5%
20%
• Launch new project 5%• Develop project plans 5%• Increase capacity 10%
• Client retention 10%• Client satisfaction 10%
• Meet revenue plan 10%• Meet sales plan 10%• Meet net operating income 20%
20%
40%
20%
2. Operational Excellence
3. World-Class Service
4. Financial Excellence
HR weightings are“non-negotiable”and typically applyto all business units.
Businessweightingsreflect thepriorities ofeach division.
Source: ADP NAS; Corporate LeadershipCouncil research.
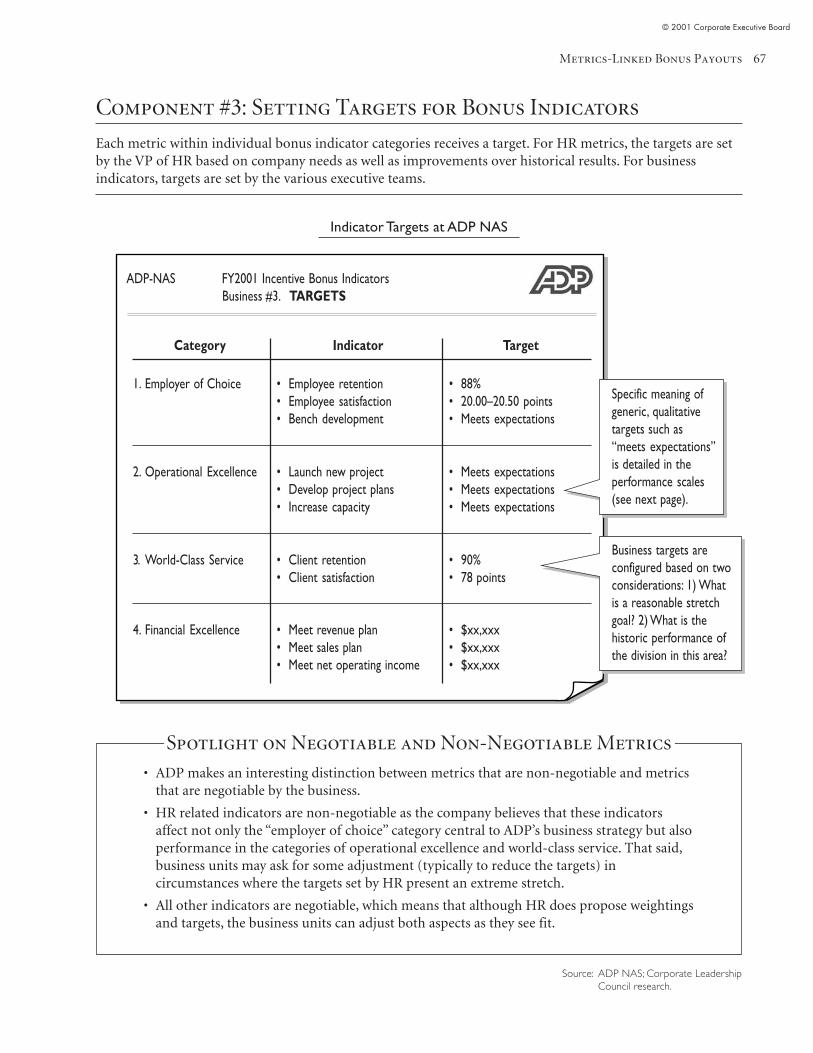
Metrics-Linked Bonus Payouts
© 2001 Corporate Executive Board
67
Component #3: Setting Targets for Bonus Indicators
Each metric within individual bonus indicator categories receives a target. For HR metrics, the targets are setby the VP of HR based on company needs as well as improvements over historical results. For businessindicators, targets are set by the various executive teams.
Indicator Targets at ADP NAS
Spotlight on Negotiable and Non-Negotiable Metrics
• ADP makes an interesting distinction between metrics that are non-negotiable and metricsthat are negotiable by the business.
• HR related indicators are non-negotiable as the company believes that these indicatorsaffect not only the “employer of choice” category central to ADP’s business strategy but alsoperformance in the categories of operational excellence and world-class service. That said,business units may ask for some adjustment (typically to reduce the targets) incircumstances where the targets set by HR present an extreme stretch.
• All other indicators are negotiable, which means that although HR does propose weightingsand targets, the business units can adjust both aspects as they see fit.
ADP-NAS FY2001 Incentive Bonus IndicatorsBusiness #3. TARGETS
Category
1. Employer of Choice
Indicator Target
• 88%• 20.00–20.50 points• Meets expectations
• Employee retention• Employee satisfaction• Bench development
• Meets expectations• Meets expectations• Meets expectations
• 90%• 78 points
• $xx,xxx• $xx,xxx• $xx,xxx
• Launch new project• Develop project plans• Increase capacity
• Meet revenue plan• Meet sales plan• Meet net operating income
• Client retention• Client satisfaction
2. Operational Excellence
3. World-Class Service
4. Financial Excellence
Specific meaning ofgeneric, qualitativetargets such as“meets expectations”is detailed in theperformance scales(see next page).
Business targets areconfigured based on twoconsiderations: 1) Whatis a reasonable stretchgoal? 2) What is thehistoric performance ofthe division in this area?
Source: ADP NAS; Corporate LeadershipCouncil research.
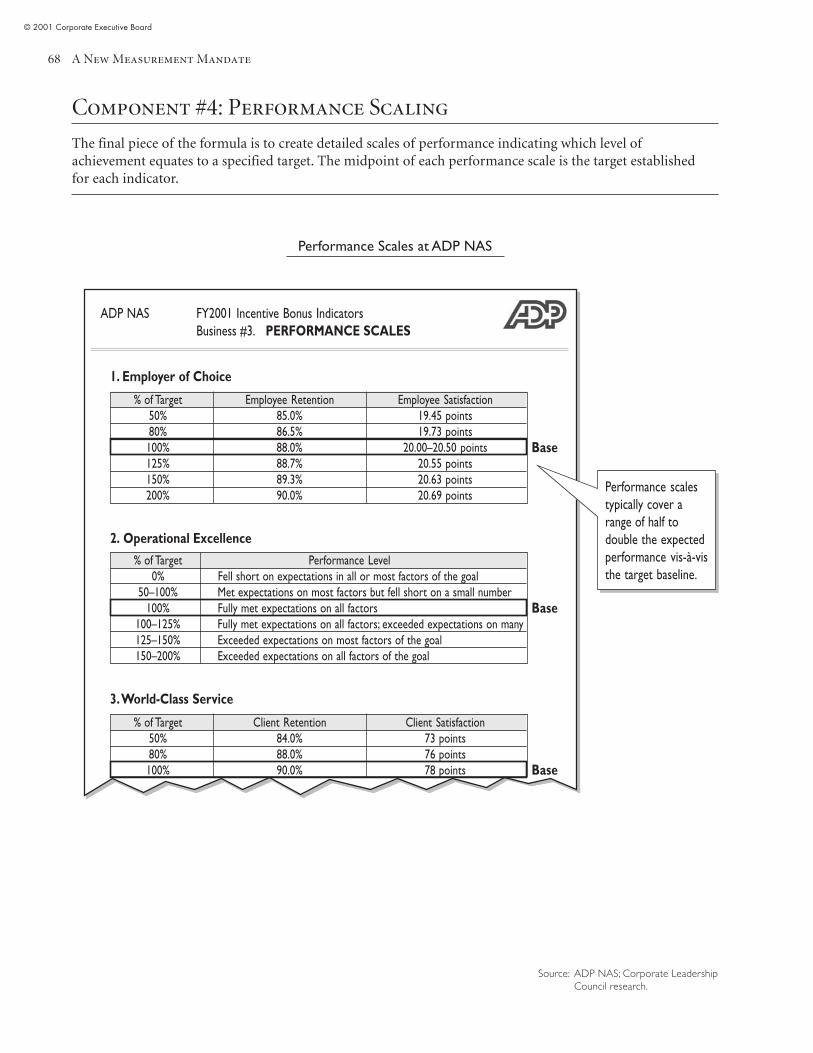
A New Measurement Mandate
© 2001 Corporate Executive Board
68
Component #4: Performance Scaling
The final piece of the formula is to create detailed scales of performance indicating which level ofachievement equates to a specified target. The midpoint of each performance scale is the target establishedfor each indicator.
Performance Scales at ADP NAS
ADP NAS FY2001 Incentive Bonus IndicatorsBusiness #3. PERFORMANCE SCALES
1. Employer of Choice
% of Target Employee Retention Employee Satisfaction50% 85.0% 19.45 points80% 86.5% 19.73 points100% 88.0% 20.00–20.50 points125% 88.7% 20.55 points150% 89.3% 20.63 points200% 90.0% 20.69 points
2. Operational Excellence
3. World-Class Service
Base
% of Target Performance Level0% Fell short on expectations in all or most factors of the goal
50–100% Met expectations on most factors but fell short on a small number100% Fully met expectations on all factors
100–125% Fully met expectations on all factors; exceeded expectations on many125–150% Exceeded expectations on most factors of the goal150–200% Exceeded expectations on all factors of the goal
Base
Base
% of Target Client Retention Client Satisfaction50% 84.0% 73 points80% 88.0% 76 points100% 90.0% 78 points
Performance scalestypically cover arange of half todouble the expectedperformance vis-à-visthe target baseline.
Source: ADP NAS; Corporate LeadershipCouncil research.
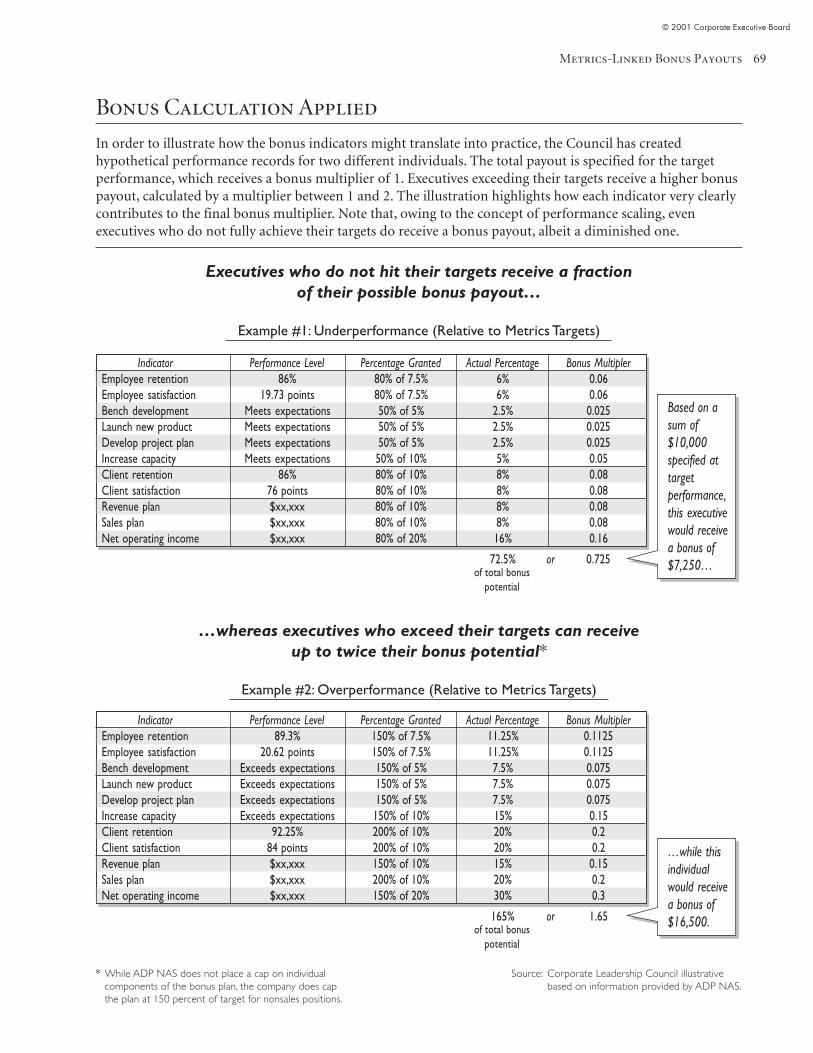
Metrics-Linked Bonus Payouts
© 2001 Corporate Executive Board
69
Bonus Calculation Applied
In order to illustrate how the bonus indicators might translate into practice, the Council has createdhypothetical performance records for two different individuals. The total payout is specified for the targetperformance, which receives a bonus multiplier of 1. Executives exceeding their targets receive a higher bonuspayout, calculated by a multiplier between 1 and 2. The illustration highlights how each indicator very clearlycontributes to the final bonus multiplier. Note that, owing to the concept of performance scaling, evenexecutives who do not fully achieve their targets do receive a bonus payout, albeit a diminished one.
Executives who do not hit their targets receive a fractionof their possible bonus payout…
Example #1: Underperformance (Relative to Metrics Targets)
…whereas executives who exceed their targets can receiveup to twice their bonus potential*
Example #2: Overperformance (Relative to Metrics Targets)
Source: Corporate Leadership Council illustrativebased on information provided by ADP NAS.
* While ADP NAS does not place a cap on individualcomponents of the bonus plan, the company does capthe plan at 150 percent of target for nonsales positions.
Indicator Performance Level Percentage Granted Actual Percentage Bonus MultiplerEmployee retention 86% 80% of 7.5% 6% 0.06Employee satisfaction 19.73 points 80% of 7.5% 6% 0.06Bench development Meets expectations 50% of 5% 2.5% 0.025Launch new product Meets expectations 50% of 5% 2.5% 0.025Develop project plan Meets expectations 50% of 5% 2.5% 0.025Increase capacity Meets expectations 50% of 10% 5% 0.05Client retention 86% 80% of 10% 8% 0.08Client satisfaction 76 points 80% of 10% 8% 0.08Revenue plan $xx,xxx 80% of 10% 8% 0.08Sales plan $xx,xxx 80% of 10% 8% 0.08Net operating income $xx,xxx 80% of 20% 16% 0.16
72.5% or 0.725
Based on asum of$10,000specified attargetperformance,this executivewould receivea bonus of$7,250…of total bonus
potential
Indicator Performance Level Percentage Granted Actual Percentage Bonus MultiplerEmployee retention 89.3% 150% of 7.5% 11.25% 0.1125Employee satisfaction 20.62 points 150% of 7.5% 11.25% 0.1125Bench development Exceeds expectations 150% of 5% 7.5% 0.075Launch new product Exceeds expectations 150% of 5% 7.5% 0.075Develop project plan Exceeds expectations 150% of 5% 7.5% 0.075Increase capacity Exceeds expectations 150% of 10% 15% 0.15Client retention 92.25% 200% of 10% 20% 0.2Client satisfaction 84 points 200% of 10% 20% 0.2Revenue plan $xx,xxx 150% of 10% 15% 0.15Sales plan $xx,xxx 200% of 10% 20% 0.2Net operating income $xx,xxx 150% of 20% 30% 0.3
165% or 1.65
…while thisindividualwould receivea bonus of$16,500.of total bonus
potential
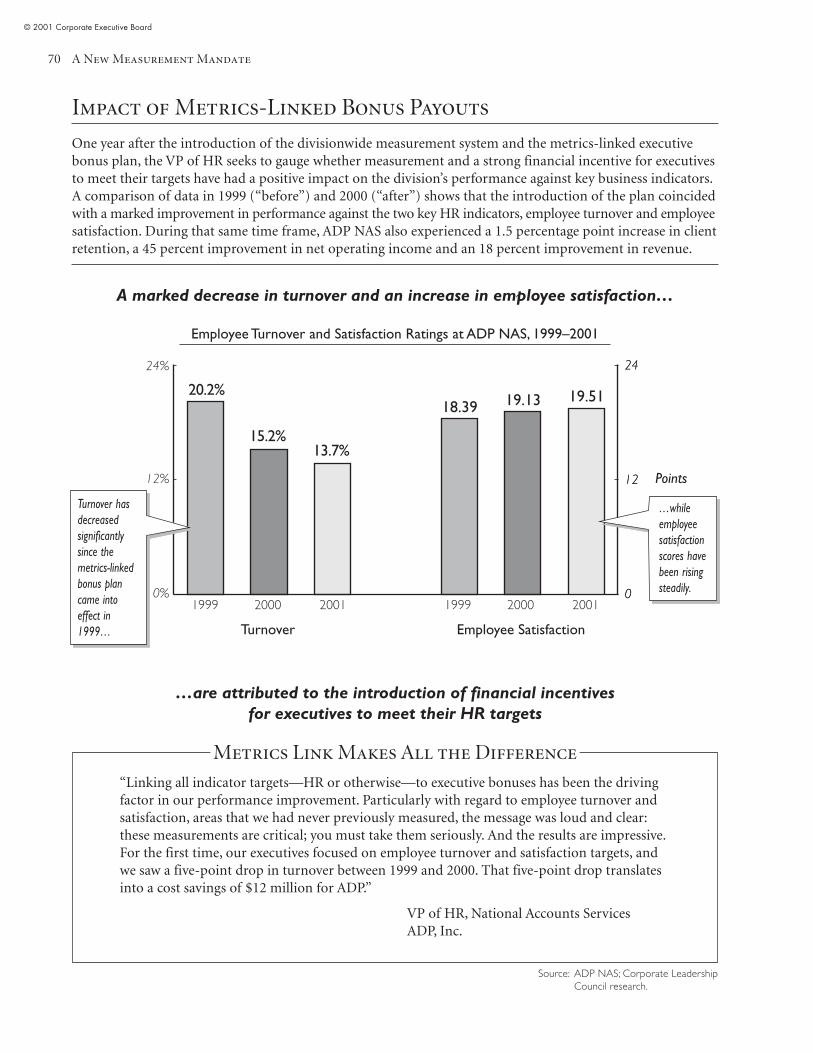
A New Measurement Mandate
© 2001 Corporate Executive Board
70
0
12
24
0
12
24
18.39 19.13 19.51
Metrics Link Makes All the Difference
“Linking all indicator targets—HR or otherwise—to executive bonuses has been the drivingfactor in our performance improvement. Particularly with regard to employee turnover andsatisfaction, areas that we had never previously measured, the message was loud and clear:these measurements are critical; you must take them seriously. And the results are impressive.For the first time, our executives focused on employee turnover and satisfaction targets, andwe saw a five-point drop in turnover between 1999 and 2000. That five-point drop translatesinto a cost savings of $12 million for ADP.”
VP of HR, National Accounts ServicesADP, Inc.
Impact of Metrics-Linked Bonus Payouts
One year after the introduction of the divisionwide measurement system and the metrics-linked executivebonus plan, the VP of HR seeks to gauge whether measurement and a strong financial incentive for executivesto meet their targets have had a positive impact on the division’s performance against key business indicators.A comparison of data in 1999 (“before”) and 2000 (“after”) shows that the introduction of the plan coincidedwith a marked improvement in performance against the two key HR indicators, employee turnover and employeesatisfaction. During that same time frame, ADP NAS also experienced a 1.5 percentage point increase in clientretention, a 45 percent improvement in net operating income and an 18 percent improvement in revenue.
A marked decrease in turnover and an increase in employee satisfaction…
Employee Turnover and Satisfaction Ratings at ADP NAS, 1999–2001
…are attributed to the introduction of financial incentivesfor executives to meet their HR targets
20.2%
15.2%13.7%
24%
12%
0%
Points
1999 2000 2001 1999 2000 2001
Turnover Employee Satisfaction
Turnover hasdecreasedsignificantlysince themetrics-linkedbonus plancame intoeffect in1999…
…whileemployeesatisfactionscores havebeen risingsteadily.
Source: ADP NAS; Corporate LeadershipCouncil research.
Metrics-Linked Bonus Payouts
© 2001 Corporate Executive Board
71
Council Assessment:Metrics-Linked Bonus Payouts
Key Differentiating Features
• This approach differs from standard practice in the stringency and rigor applied to linkingHR-related metrics to executive performance bonuses.
Caveats
• The practice may be more applicable in organizations that have a strong performanceculture where individuals are accustomed to having part or all of their compensation tiedto specific goals.
• The creation of strong financial incentives tied to specific metrics targets may leadexecutives to manage by numbers, i.e., seek to achieve the targets without considering thebroader purpose of the initiative. However, a focus on “getting the numbers right” ratherthan improving performance may, in the long run, undermine the value of measurement inthe organization.
Critical Success Factors
• Line of sight—In order for this practice to be viable, companies must ensure a clear line ofsight between goals and an individual’s role. Especially with regard to HR-related metrics,executives are unlikely to accept high weighting and often aggressive targets for aspects suchas employee turnover and satisfaction unless they can see how these factors relate to overallcorporate goals or to their individual jobs.
• Clear performance criteria—Once line of sight is given, the actual performance criteria, whetherquantitative or qualitative, must be very clearly defined and communicated to individuals.
• Line involvement—As with many strategies that impose an HR-like task on line executives,successful implementation of the metrics-linked bonus plan requires line involvement indeveloping both HR metrics and targets. In addition to giving the line a stake in theprocess, such involvement also significantly reduces the risk of “organ rejection” once theplan is in place: if executives feel they participated in setting HR-related targets, they areunlikely to reject them later.
• Transparency of calculation—The final element is to make available to all executives a clearlydefined breakdown of how each indicator impacts their bonus and how bonuses are calculated.

A New Measurement Mandate
© 2001 Corporate Executive Board
72
© 2001 Corporate Executive Board
73
Further Best Practice Encountered in the Course of Research
Operations Team Rolls Out Metrics to the Organization
A team of functional and operational specialists offers meetings and training sessions toeducate HR and line staff about the purpose and nature of key HR indicators and howmetrics can be used to optimize process quality and efficiency.
See page 28 for additional details.
Step #5: Educating the OrganizationAbout Metrics
Benchmark Practice #6
Metrics E-Learning Program
Description
A multimedia, Web-based e-learning tool educates all managers and executives about the resultsof the company’s annual employee survey and provides guidance for managers on how tocommunicate and act on those results.
Goal
The goal is twofold. The first goal is to maximize organizational understanding of how employeeattitudes impact corporate performance. The second goal is to introduce and build managerunderstanding of a companywide development tool designed to increase the use of survey results.
Key Differentiating Feature
The program incorporates a series of tests that affords individuals an opportunity to assesstheir learning progress and enables HR to monitor the level of training penetration andabsorption. Further, the program also strongly signals the CEO’s endorsement of themeasurement and development exercise while devolving responsibility for following upon survey results to local management.
A New Measurement Mandate
© 2001 Corporate Executive Board
74
Practice Background:Metrics E-Learning Program
The LEGO Company is one of the world’s leading makers of toy building blocks. Thecompany employs approximately 8,300 individuals and generates annual revenues ofapproximately $1 billion.
Situation
• By the end of 2000, the LEGO Company has completed its first-ever global employee survey(“LEGO Pulse”). The goal of the survey exercise is to generate empirical data for the LEGOCompany’s corporate reinvention and global brand strengthening initiative.
• HR recognizes that managers are skeptical about the impact of factors such as employeesatisfaction on firm performance. More specifically, HR is concerned that managers will notknow how to interpret and act on LEGO Pulse results.
• The HR function seeks to find a medium that combines communication and trainingelements and reaches all line managers and executives. Traditional vehicles such as groupmeetings or paper-based documentation do not lend themselves well to this combined goal.One-on-one meetings are too time-intensive and too costly an option to consider.
Action
• The HR function identifies an e-learning tool as the most suitable vehicle for trainingmanagers in sharing and using the results.
• In order to communicate the specific metrics associated with the outcome of, andfollow-up to, the survey, the HR team puts together a Web-based metrics e-learningprogram that comprises five modules outlining the survey and explaining the results aswell as the organizational development effort.
• The modules combine a blend of text-based and video instruction, and some modules alsoincorporate a self-test for managers to gauge whether they have absorbed key content of themodules. Altogether the program takes approximately 45 minutes to complete, butmanagers can complete modules at their own pace.
• Two weeks before publishing the survey results in February 2001, HR communicates to400 managers that in order to receive the survey results and to start the follow-up processthey must complete the tailored metrics e-learning program on the company’s intranet.
Result
• By the end of February 2001, 70 percent of the target audience has completed the e-learningprogram. On average, managers have achieved 90 percent accuracy on the self-tests.
• The e-learning program is very positively received across the organization. A post-trainingevaluation concludes that managers considered the training timely and appropriate, particularlybecause the program eliminates the typical time lag between training and execution.
• Managers also highlight that the metrics e-learning program enables the LEGO Companyto decentralize the survey follow-up effort while ensuring consistency of approach acrossthe organization.
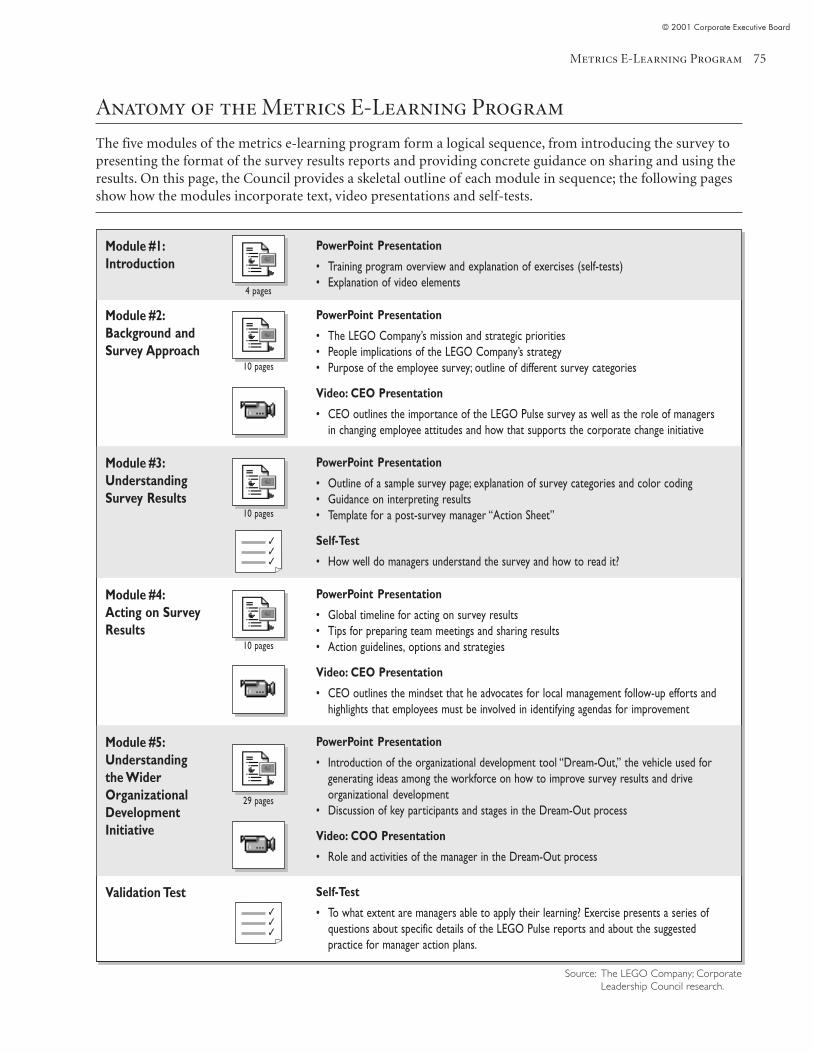
Metrics E-Learning Program
© 2001 Corporate Executive Board
75
Anatomy of the Metrics E-Learning Program
The five modules of the metrics e-learning program form a logical sequence, from introducing the survey topresenting the format of the survey results reports and providing concrete guidance on sharing and using theresults. On this page, the Council provides a skeletal outline of each module in sequence; the following pagesshow how the modules incorporate text, video presentations and self-tests.
Source: The LEGO Company; CorporateLeadership Council research.
Module #1:Introduction
PowerPoint Presentation
• Training program overview and explanation of exercises (self-tests)• Explanation of video elements
Module #2:Background andSurvey Approach
Module #3:UnderstandingSurvey Results
Module #4:Acting on SurveyResults
Validation Test
PowerPoint Presentation
• The LEGO Company’s mission and strategic priorities• People implications of the LEGO Company’s strategy• Purpose of the employee survey; outline of different survey categories
Video: CEO Presentation
• CEO outlines the importance of the LEGO Pulse survey as well as the role of managersin changing employee attitudes and how that supports the corporate change initiative
PowerPoint Presentation
• Outline of a sample survey page; explanation of survey categories and color coding• Guidance on interpreting results• Template for a post-survey manager “Action Sheet”
Self-Test
• How well do managers understand the survey and how to read it?
PowerPoint Presentation
• Global timeline for acting on survey results• Tips for preparing team meetings and sharing results• Action guidelines, options and strategies
Video: CEO Presentation
• CEO outlines the mindset that he advocates for local management follow-up efforts andhighlights that employees must be involved in identifying agendas for improvement
Self-Test
• To what extent are managers able to apply their learning? Exercise presents a series ofquestions about specific details of the LEGO Pulse reports and about the suggestedpractice for manager action plans.
4 pages
10 pages
10 pages
✓✓✓
✓✓✓
Module #5:Understandingthe WiderOrganizationalDevelopmentInitiative
PowerPoint Presentation
• Introduction of the organizational development tool “Dream-Out,” the vehicle used forgenerating ideas among the workforce on how to improve survey results and driveorganizational development
• Discussion of key participants and stages in the Dream-Out process
Video: COO Presentation
• Role and activities of the manager in the Dream-Out process
10 pages
29 pages
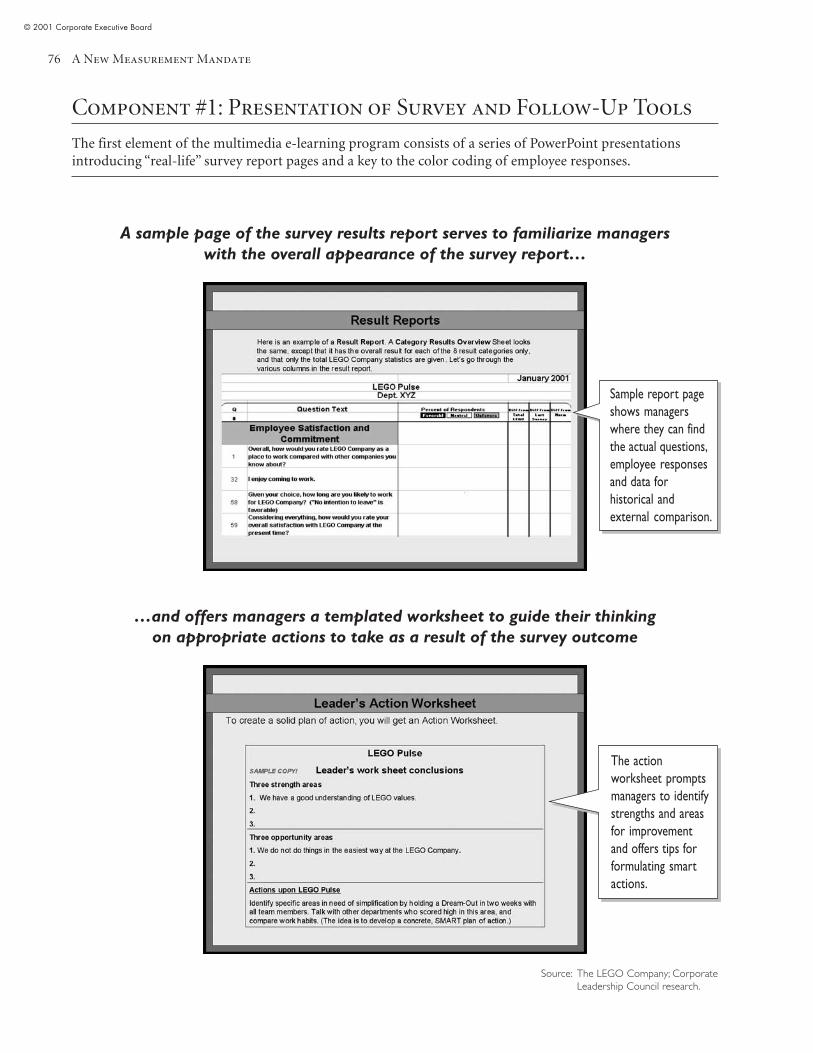
A New Measurement Mandate
© 2001 Corporate Executive Board
76
Component #1: Presentation of Survey and Follow-Up Tools
The first element of the multimedia e-learning program consists of a series of PowerPoint presentationsintroducing “real-life” survey report pages and a key to the color coding of employee responses.
A sample page of the survey results report serves to familiarize managerswith the overall appearance of the survey report…
…and offers managers a templated worksheet to guide their thinkingon appropriate actions to take as a result of the survey outcome
The actionworksheet promptsmanagers to identifystrengths and areasfor improvementand offers tips forformulating smartactions.
Source: The LEGO Company; CorporateLeadership Council research.
Sample report pageshows managerswhere they can findthe actual questions,employee responsesand data forhistorical andexternal comparison.
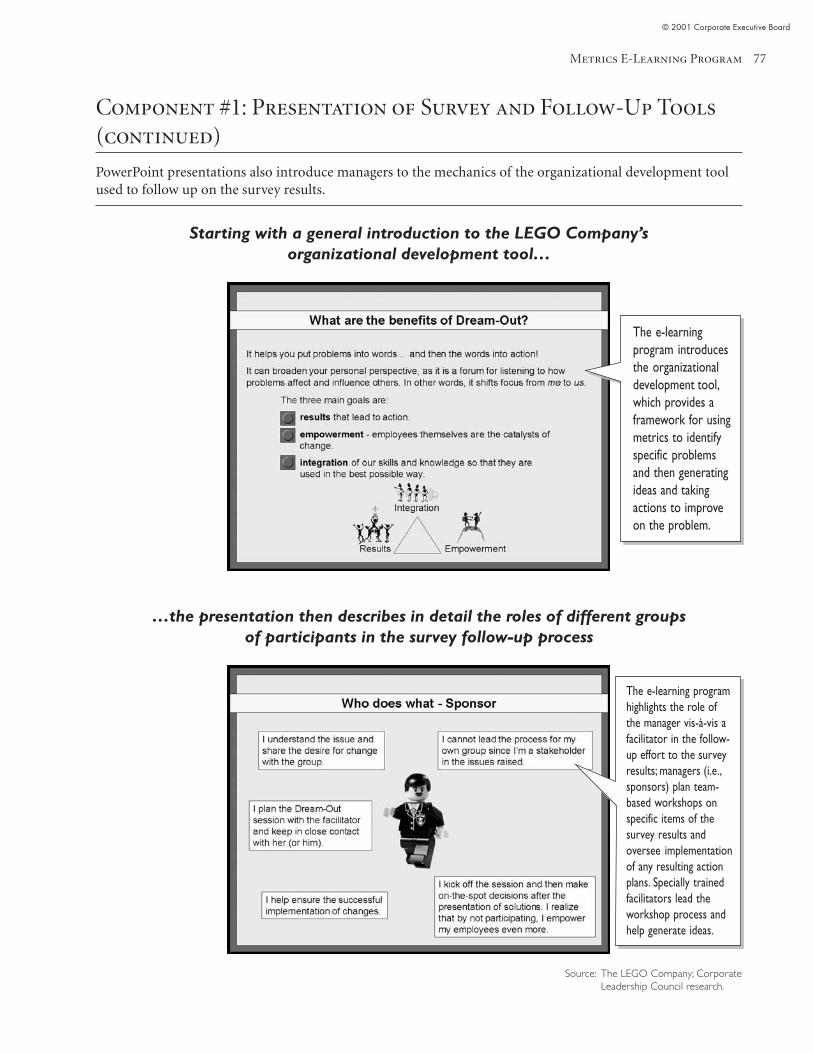
Metrics E-Learning Program
© 2001 Corporate Executive Board
77
Component #1: Presentation of Survey and Follow-Up Tools(continued)
PowerPoint presentations also introduce managers to the mechanics of the organizational development toolused to follow up on the survey results.
Starting with a general introduction to the LEGO Company’sorganizational development tool…
…the presentation then describes in detail the roles of different groupsof participants in the survey follow-up process
The e-learningprogram introducesthe organizationaldevelopment tool,which provides aframework for usingmetrics to identifyspecific problemsand then generatingideas and takingactions to improveon the problem.
The e-learning programhighlights the role ofthe manager vis-à-vis afacilitator in the follow-up effort to the surveyresults; managers (i.e.,sponsors) plan team-based workshops onspecific items of thesurvey results andoversee implementationof any resulting actionplans. Specially trainedfacilitators lead theworkshop process andhelp generate ideas.
Source: The LEGO Company; CorporateLeadership Council research.
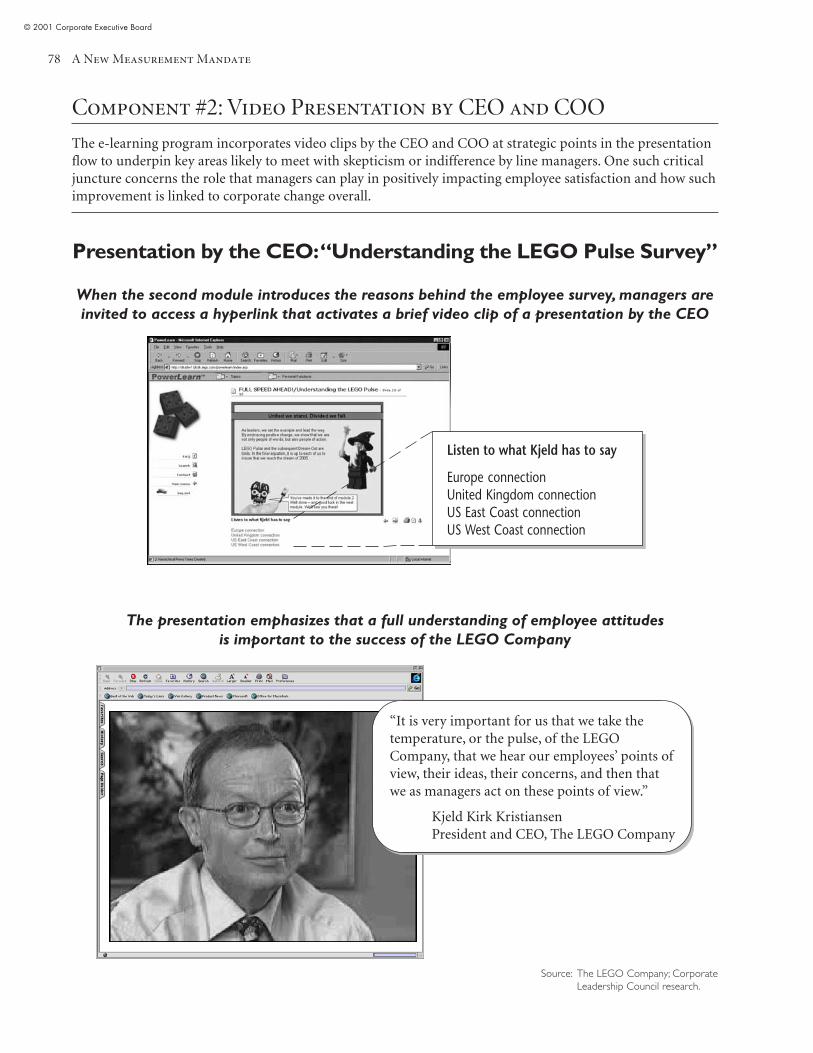
A New Measurement Mandate
© 2001 Corporate Executive Board
78
Component #2: Video Presentation by CEO and COO
The e-learning program incorporates video clips by the CEO and COO at strategic points in the presentationflow to underpin key areas likely to meet with skepticism or indifference by line managers. One such criticaljuncture concerns the role that managers can play in positively impacting employee satisfaction and how suchimprovement is linked to corporate change overall.
Presentation by the CEO: “Understanding the LEGO Pulse Survey”
When the second module introduces the reasons behind the employee survey, managers areinvited to access a hyperlink that activates a brief video clip of a presentation by the CEO
The presentation emphasizes that a full understanding of employee attitudesis important to the success of the LEGO Company
Listen to what Kjeld has to say
Europe connectionUnited Kingdom connectionUS East Coast connectionUS West Coast connection
“It is very important for us that we take thetemperature, or the pulse, of the LEGOCompany, that we hear our employees’ points ofview, their ideas, their concerns, and then thatwe as managers act on these points of view.”
Kjeld Kirk KristiansenPresident and CEO, The LEGO Company
Source: The LEGO Company; CorporateLeadership Council research.
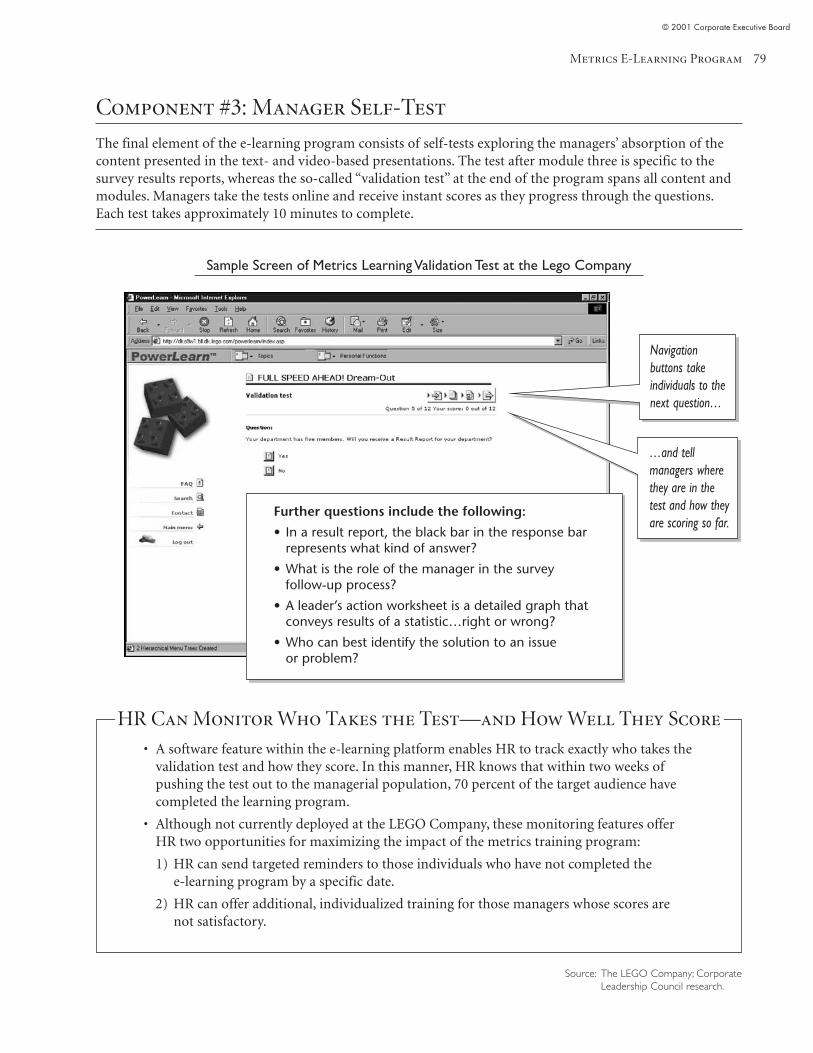
Metrics E-Learning Program
© 2001 Corporate Executive Board
79
HR Can Monitor Who Takes the Test—and How Well They Score
• A software feature within the e-learning platform enables HR to track exactly who takes thevalidation test and how they score. In this manner, HR knows that within two weeks ofpushing the test out to the managerial population, 70 percent of the target audience havecompleted the learning program.
• Although not currently deployed at the LEGO Company, these monitoring features offerHR two opportunities for maximizing the impact of the metrics training program:
1) HR can send targeted reminders to those individuals who have not completed thee-learning program by a specific date.
2) HR can offer additional, individualized training for those managers whose scores arenot satisfactory.
Component #3: Manager Self-Test
The final element of the e-learning program consists of self-tests exploring the managers’ absorption of thecontent presented in the text- and video-based presentations. The test after module three is specific to thesurvey results reports, whereas the so-called “validation test” at the end of the program spans all content andmodules. Managers take the tests online and receive instant scores as they progress through the questions.Each test takes approximately 10 minutes to complete.
Sample Screen of Metrics Learning Validation Test at the Lego Company
Further questions include the following:
• In a result report, the black bar in the response barrepresents what kind of answer?
• What is the role of the manager in the surveyfollow-up process?
• A leader’s action worksheet is a detailed graph thatconveys results of a statistic…right or wrong?
• Who can best identify the solution to an issueor problem?
Navigationbuttons takeindividuals to thenext question…
…and tellmanagers wherethey are in thetest and how theyare scoring so far.
Source: The LEGO Company; CorporateLeadership Council research.

A New Measurement Mandate
© 2001 Corporate Executive Board
80
Metrics E-Learning Program
© 2001 Corporate Executive Board
81
Council Assessment:Metrics E-Learning Program
Key Differentiating Features
• The program incorporates a series of tests that affords individuals an opportunity to assesstheir learning progress and enables HR to monitor the level of training penetration andabsorption. Further, the program also strongly signals the CEO’s endorsement of themeasurement and development exercise while devolving responsibility for following up onsurvey results to local management.
Applicability
• Although deployed here to educate line managers about employee surveys, the Councilbelieves that this tool could be easily adapted to educate the organization about themeaning and purpose of any other HR key performance indicator, perhaps even illustratinghow data on aspects like turnover and absenteeism is analyzed and trended.
• Further, the Council suggests that this or a similar tool would serve equally well to educateHR staff about the quantitative side of measurement and the importance of HRmeasurement in the larger organizational context.
Implementation Tips
• The Council suggests that the program should be compulsory rather than voluntary toensure that every individual in a leadership position is conversant with metrics results andable to apply them in day-to-day decisions.
• The Council recommends that companies complement the tool with other training vehicles(such as paper-based reports or manuals, trainer-based meetings, etc.) to appeal to differentlearning styles and behaviors.

A New Measurement Mandate
© 2001 Corporate Executive Board
82
© 2001 Corporate Executive Board
83
Chapter III:Metrics Decision Support
� Step #6: Leveraging IT Infrastructure
• Benchmark Practice #7: HR Dashboard
• Benchmark Practice #8: Transitional HR Dashboard
� Step #7: Ensuring Metrics Deployment
• Benchmark Practice #9: “Code Red” PerformanceManagement System
• Benchmark Practice #10: Strategic Metrics Reporting

A New Measurement Mandate
© 2001 Corporate Executive Board
84
© 2001 Corporate Executive Board
85
Step #6: Leveraging IT Infrastructure
Benchmark Practice #7
HR Dashboard
Description
An online HR dashboard displays key HR indicators in the context of the overall businessscorecard. The dashboard offers drill-down and report-generation functionality. Users canconfigure scorecard screens according to their preferences and can run individualized reportsas desired.
Goal
The goal is to facilitate the incorporation of HR metrics into strategic and day-to-day decisionsby making key indicator data available to the organization over the desktop. A secondary goal isto offer a “one-stop shop” for human capital metrics.
Key Differentiating Feature
Careful design and targeted data structuring overcomes a suboptimal IT infrastructure at theback end and powers an online dashboard that offers its users sophisticated querying capabilities.
Benchmark Practice #8
Transitional HR Dashboard
Description
The HR dashboard displays key HR indicators through a series of predefined, online reports.This first iteration is explicitly transitional in nature and is designed to get HR started with itsmeasurement initiative while working toward a more optimal solution.
Goal
The goal is to enable the HR function to make more strategic decisions by making availableto every manager metrics information relating to the function as a whole.
Key Differentiating Feature
A rudimentary online dashboard architecture jump-starts HR’s measurement effort in theabsence of an optimal IT infrastructure. The transitional dashboard relies on simple Excel-basedqueries to retrieve metrics information, which is loaded into dedicated files in the front-endapplication, from the company’s different databases.
A New Measurement Mandate
© 2001 Corporate Executive Board
86
Council Essay:Leveraging IT to Enable the Metrics Effort
Presenting practical solutions to the IT conundrum
• While IT is widely considered to be a key “measurement enabler,” many organizations havetold the Council that their HR IT systems are currently hampering rather than supportingtheir metrics initiatives.
• The most commonly cited factor here is a lack of fully integrated IT systems that wouldautomate data collection and analysis. This problem is compounded by the fact that manyHR functions do not have the budget to invest in the kinds of sophisticated softwarepackages that would fully automate their measurement effort and offer comprehensiveonline analytical and querying capabilities to the entire organization, if desired.
• Recognizing this conundrum, the Council has chosen to profile in this part of the brief twocompanies’ approaches to fully leveraging the functionality offered by their existing HR ITsystems and software, however disparate or basic, while they are working toward creating afully optimal IT infrastructure for their metrics efforts.
• The outcome in both cases is an operational, online dashboard that will lend itself toeasy and quick upgrades once the benefits of upgrading to more sophisticated softwarebecome clear.
Understanding degrees of technical sophistication
• Before presenting the two benchmark practices, the Council provides a brief overview onthe next page of the continuum from “gold standard” to “state of the union” as it relates tothe sophistication of front-end interface and reporting capabilities and the sophisticationof the back-end architecture.
• This overview is designed to offer a qualitative context for the two benchmark practices.Members may also find this overview helpful in conceptualizing the IT possibilities open totheir organizations at this time by placing their own organizations along this continuum.
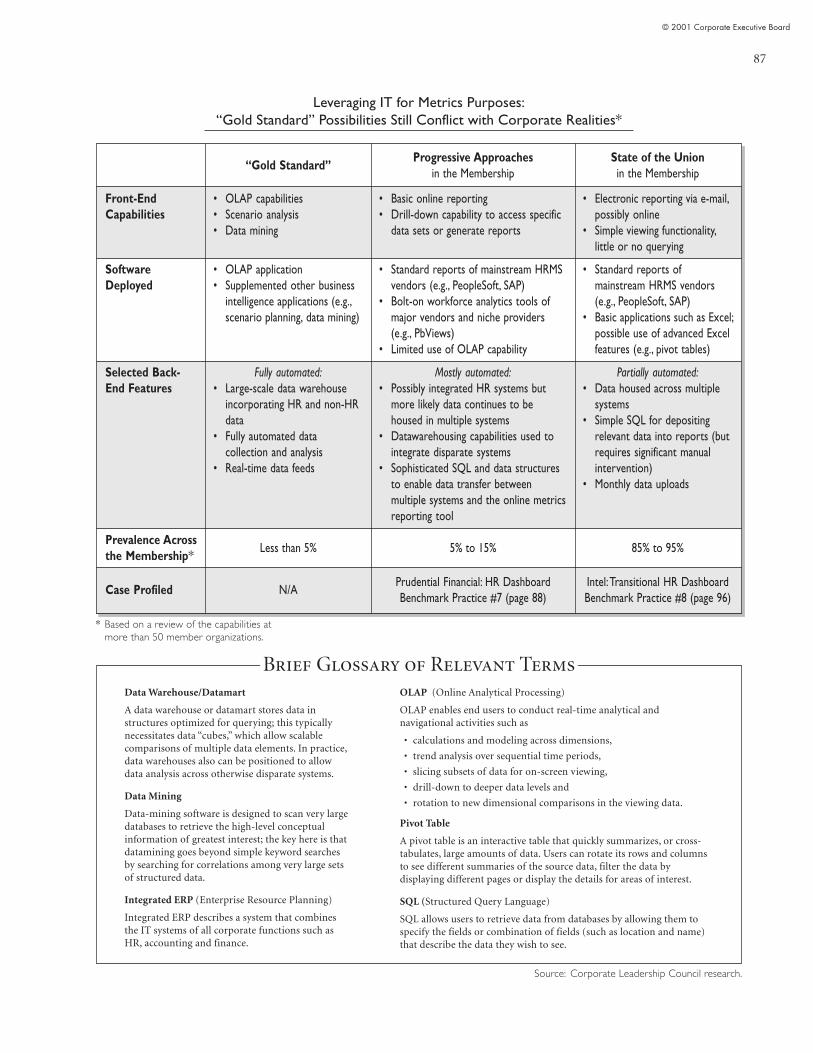
© 2001 Corporate Executive Board
87
Data Warehouse/Datamart
A data warehouse or datamart stores data instructures optimized for querying; this typicallynecessitates data “cubes,” which allow scalablecomparisons of multiple data elements. In practice,data warehouses also can be positioned to allowdata analysis across otherwise disparate systems.
Data Mining
Data-mining software is designed to scan very largedatabases to retrieve the high-level conceptualinformation of greatest interest; the key here is thatdatamining goes beyond simple keyword searchesby searching for correlations among very large setsof structured data.
Integrated ERP (Enterprise Resource Planning)
Integrated ERP describes a system that combinesthe IT systems of all corporate functions such asHR, accounting and finance.
Leveraging IT for Metrics Purposes:“Gold Standard” Possibilities Still Conflict with Corporate Realities*
“Gold Standard”Progressive Approaches
in the MembershipState of the Unionin the Membership
Front-EndCapabilities
• OLAP capabilities• Scenario analysis• Data mining
• Basic online reporting• Drill-down capability to access specific
data sets or generate reports
• Electronic reporting via e-mail,possibly online
• Simple viewing functionality,little or no querying
SoftwareDeployed
• OLAP application• Supplemented other business
intelligence applications (e.g.,scenario planning, data mining)
• Standard reports of mainstream HRMSvendors (e.g., PeopleSoft, SAP)
• Bolt-on workforce analytics tools ofmajor vendors and niche providers(e.g., PbViews)
• Limited use of OLAP capability
• Standard reports ofmainstream HRMS vendors(e.g., PeopleSoft, SAP)
• Basic applications such as Excel;possible use of advanced Excelfeatures (e.g., pivot tables)
Selected Back-End Features
Fully automated:• Large-scale data warehouse
incorporating HR and non-HRdata
• Fully automated datacollection and analysis
• Real-time data feeds
Mostly automated:• Possibly integrated HR systems but
more likely data continues to behoused in multiple systems
• Datawarehousing capabilities used tointegrate disparate systems
• Sophisticated SQL and data structuresto enable data transfer betweenmultiple systems and the online metricsreporting tool
Partially automated:• Data housed across multiple
systems• Simple SQL for depositing
relevant data into reports (butrequires significant manualintervention)
• Monthly data uploads
Prevalence Acrossthe Membership*
Less than 5% 5% to 15% 85% to 95%
Case Profiled N/APrudential Financial: HR DashboardBenchmark Practice #7 (page 88)
Intel: Transitional HR DashboardBenchmark Practice #8 (page 96)
* Based on a review of the capabilities atmore than 50 member organizations.
Source: Corporate Leadership Council research.
OLAP (Online Analytical Processing)
OLAP enables end users to conduct real-time analytical andnavigational activities such as
• calculations and modeling across dimensions,
• trend analysis over sequential time periods,
• slicing subsets of data for on-screen viewing,
• drill-down to deeper data levels and
• rotation to new dimensional comparisons in the viewing data.
Pivot Table
A pivot table is an interactive table that quickly summarizes, or cross-tabulates, large amounts of data. Users can rotate its rows and columnsto see different summaries of the source data, filter the data bydisplaying different pages or display the details for areas of interest.
SQL (Structured Query Language)
SQL allows users to retrieve data from databases by allowing them tospecify the fields or combination of fields (such as location and name)that describe the data they wish to see.
Brief Glossary of Relevant Terms
A New Measurement Mandate
© 2001 Corporate Executive Board
88
Practice Background:HR Dashboard
Prudential Financial is a major life insurer in the United States. Thecompany employs approximately 60,000 individuals and generatesannual revenues of approximately $26 billion.
Situation
• In 1999 the HR function at Prudential Financial launches a performance measurementinitiative to support its strategic priorities and enable the organization to make betterstrategic decisions with the available human capital information.
• This initiative is Prudential Financial’s second attempt at developing and rolling out HRmetrics data through the organization. The previous attempt was hampered by the laborintensity of collecting, analyzing and distributing data.
• The HR function is now looking for a vehicle or tool that will eliminate such pitfalls whileworking with Prudential Financial’s existing, and somewhat fragmented, IT structure at theback end. The tool must also enable HR to push metrics information out to theorganization at large.
Action
• After reviewing the capabilities of various software packages, including both in-house andon-the-market products, the HR function decides to develop in-house an HR metricsdashboard that will be fast, user-friendly and (eventually) available on every manager’s desktop.
• The Dashboard involves five key components:
✓ Dashboard Design—The Dashboard is carefully designed to suit the organization’s strategy,information needs and reporting structure. See Component #1, page 89.
✓ Dashboard Views—The Dashboard offers a variety of different views to suit different informationneeds. See Component #2, page 90.
✓ Dashboard Drill Down—The Dashboard enables users to retrieve very specific data sets. SeeComponent #3, page 92.
✓ Dashboard Help File—The Dashboard offers an online help function to guide users through themethodologies underlying each metric. See Component #4, page 93.
✓ Dashboard Back-End Structure—The Dashboard must work off the existing software package,PeopleSoft Enterprise Performance Management (EPM), for data warehousing and the front-endinterface. Data querying and analysis is conducted via the reporting tool Business Objects thatqueries the database for specific cuts on the data. See Component #5, page 94.
Result
• The first version of The Dashboard is launched within six months. The Dashboard providesa desktop support tool for managers, senior leaders and HR professionals and contains 160metrics reports.
• Although initially limited to 50 “trial users,” within a month direct access to The Dashboardexpands to an additional 100 senior and midlevel HR staff who proactively push relevant(to the individual businesses) metrics information to the line.
• The Dashboard enables the HR function to create, in a matter of seconds, metrics reportsthat previously took several weeks to research and compile. Moreover, the function candedicate more time to data analysis and helping internal customers use the data.
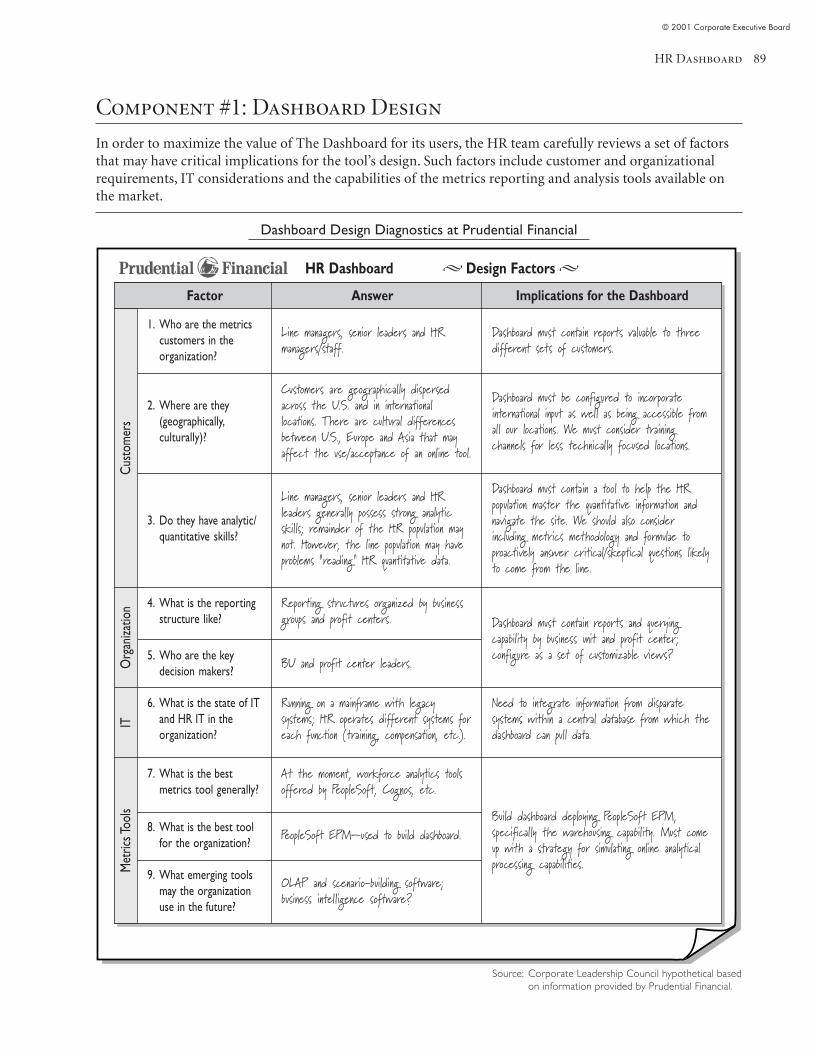
HR Dashboard
© 2001 Corporate Executive Board
89
Component #1: Dashboard Design
In order to maximize the value of The Dashboard for its users, the HR team carefully reviews a set of factorsthat may have critical implications for the tool’s design. Such factors include customer and organizationalrequirements, IT considerations and the capabilities of the metrics reporting and analysis tools available onthe market.
Source: Corporate Leadership Council hypothetical basedon information provided by Prudential Financial.
Dashboard Design Diagnostics at Prudential Financial
HR Dashboard � Design Factors �
Factor
1. Who are the metricscustomers in theorganization?
Answer Implications for the Dashboard
Dashboard must contain reports valuable to threedifferent sets of customers.
Line managers, senior leaders and HRmanagers/staff.
Dashboard must be configured to incorporateinternational input as well as being accessible fromal l our locations. We must consider trainingchannels for less technical ly focused locations.
Dashboard must contain a tool to help the HRpopulation master the quantitative information andnavigate the site. We should also considerincluding metrics methodology and formulae toproactively answer critical/skeptical questions likelyto come from the line.
Dashboard must contain reports and queryingcapability by business unit and profit center;configure as a set of customizable views?
Customers are geographically dispersedacross the U.S. and in internationallocations. There are cultural differencesbetween U.S., Europe and Asia that mayaffect the use/acceptance of an online tool.
Line managers, senior leaders and HRleaders generally possess strong analyticskills; remainder of the HR population maynot. However, the line population may haveproblems “reading” HR quantitative data.
2. Where are they(geographically,culturally)?
3. Do they have analytic/quantitative skills?
4. What is the reportingstructure like?
5. Who are the keydecision makers?
BU and profit center leaders.
Reporting structures organized by businessgroups and profit centers.
Need to integrate information from disparatesystems within a central database from which thedashboard can pull data.
6. What is the state of ITand HR IT in theorganization?
Running on a mainframe with legacysystems; HR operates different systems foreach function (training, compensation, etc.).
Cust
omer
s
Build dashboard deploying PeopleSoft EPM,specifical ly the warehousing capability. Must comeup with a strategy for simulating online analyticalprocessing capabilities.
7. What is the bestmetrics tool generally?
At the moment, workforce analytics toolsoffered by PeopleSoft, Cognos, etc.
8. What is the best toolfor the organization?
PeopleSoft EPM—used to build dashboard.
9. What emerging toolsmay the organizationuse in the future?
OLAP and scenario-building software;business intelligence software?
Org
aniza
tion
ITM
etric
s Too
ls
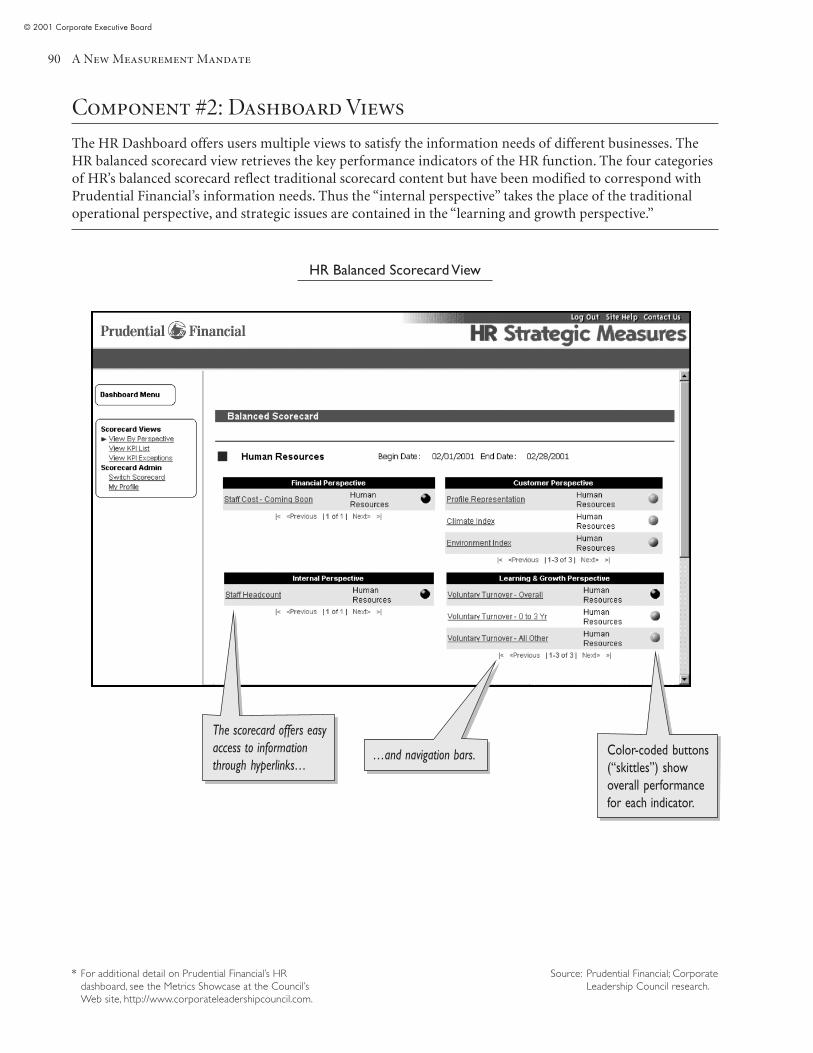
A New Measurement Mandate
© 2001 Corporate Executive Board
90
Component #2: Dashboard Views
The HR Dashboard offers users multiple views to satisfy the information needs of different businesses. TheHR balanced scorecard view retrieves the key performance indicators of the HR function. The four categoriesof HR’s balanced scorecard reflect traditional scorecard content but have been modified to correspond withPrudential Financial’s information needs. Thus the “internal perspective” takes the place of the traditionaloperational perspective, and strategic issues are contained in the “learning and growth perspective.”
Source: Prudential Financial; CorporateLeadership Council research.
HR Balanced Scorecard View
* For additional detail on Prudential Financial’s HRdashboard, see the Metrics Showcase at the Council’sWeb site, http://www.corporateleadershipcouncil.com.
The scorecard offers easyaccess to informationthrough hyperlinks…
…and navigation bars. Color-coded buttons(“skittles”) showoverall performancefor each indicator.
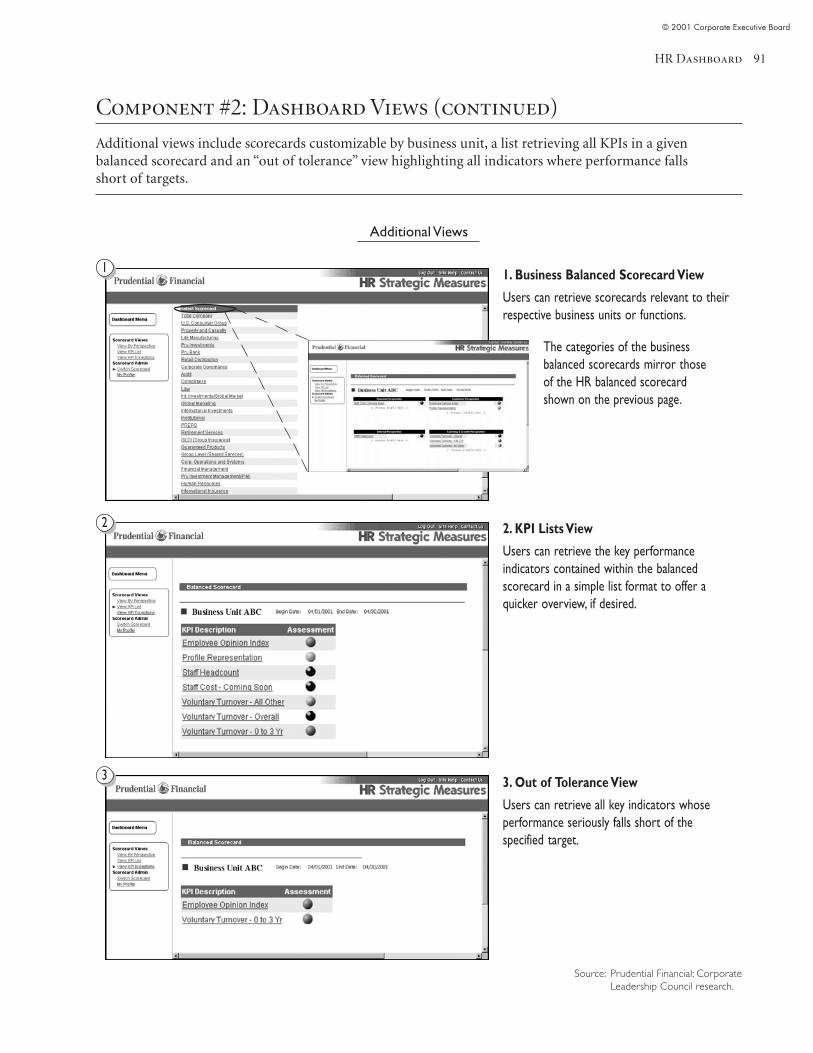
HR Dashboard
© 2001 Corporate Executive Board
91
Component #2: Dashboard Views (continued)
Additional views include scorecards customizable by business unit, a list retrieving all KPIs in a givenbalanced scorecard and an “out of tolerance” view highlighting all indicators where performance fallsshort of targets.
Additional Views
The categories of the businessbalanced scorecards mirror thoseof the HR balanced scorecardshown on the previous page.
1
3. Out of Tolerance View
Users can retrieve all key indicators whoseperformance seriously falls short of thespecified target.
2. KPI Lists View
Users can retrieve the key performanceindicators contained within the balancedscorecard in a simple list format to offer aquicker overview, if desired.
1. Business Balanced Scorecard View
Users can retrieve scorecards relevant to theirrespective business units or functions.
2
3
Source: Prudential Financial; CorporateLeadership Council research.
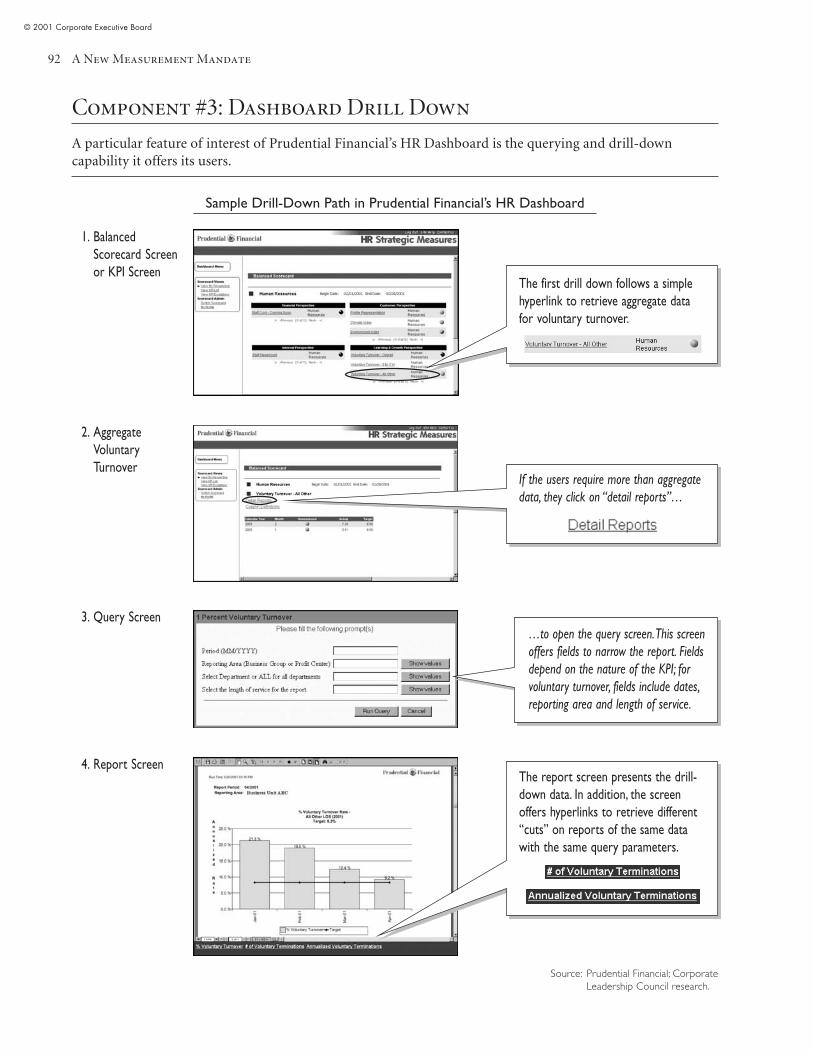
A New Measurement Mandate
© 2001 Corporate Executive Board
92
Component #3: Dashboard Drill Down
A particular feature of interest of Prudential Financial’s HR Dashboard is the querying and drill-downcapability it offers its users.
Sample Drill-Down Path in Prudential Financial’s HR Dashboard
1. BalancedScorecard Screenor KPI Screen
4. Report Screen
3. Query Screen
2. AggregateVoluntaryTurnover
The first drill down follows a simplehyperlink to retrieve aggregate datafor voluntary turnover.
If the users require more than aggregatedata, they click on “detail reports”…
Source: Prudential Financial; CorporateLeadership Council research.
…to open the query screen. This screenoffers fields to narrow the report. Fieldsdepend on the nature of the KPI; forvoluntary turnover, fields include dates,reporting area and length of service.
The report screen presents the drill-down data. In addition, the screenoffers hyperlinks to retrieve different“cuts” on reports of the same datawith the same query parameters.
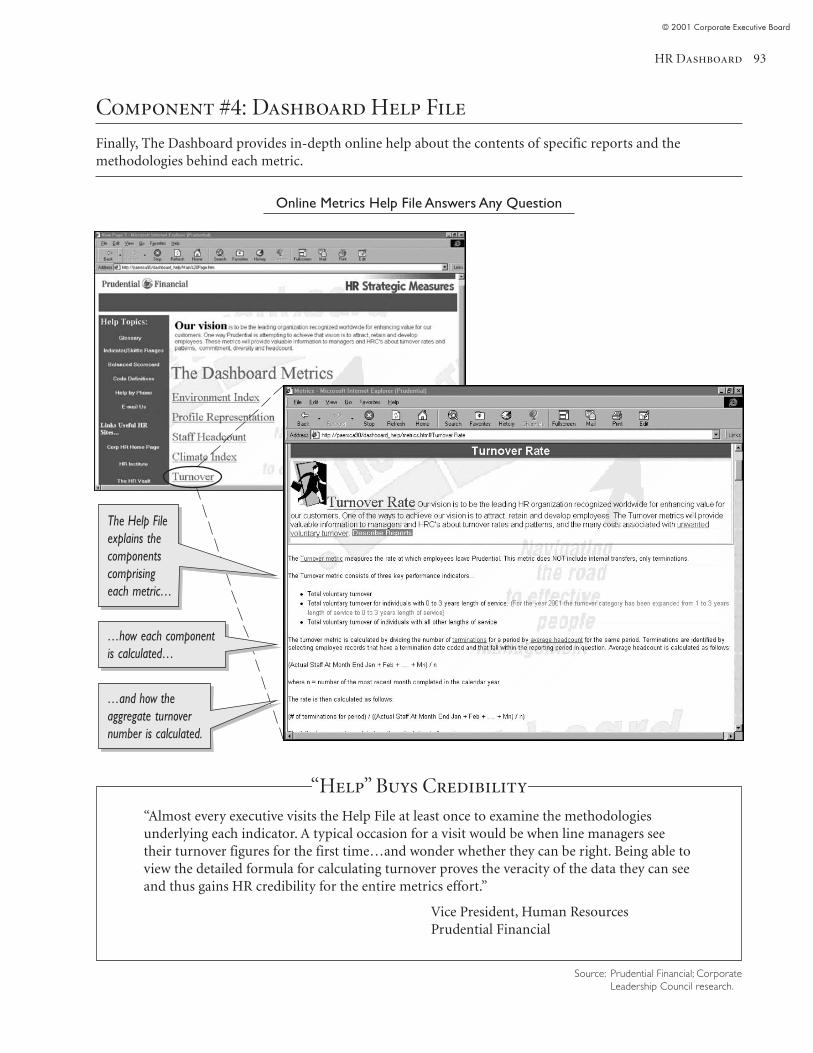
HR Dashboard
© 2001 Corporate Executive Board
93
Component #4: Dashboard Help File
Finally, The Dashboard provides in-depth online help about the contents of specific reports and themethodologies behind each metric.
Online Metrics Help File Answers Any Question
“Help” Buys Credibility
“Almost every executive visits the Help File at least once to examine the methodologiesunderlying each indicator. A typical occasion for a visit would be when line managers seetheir turnover figures for the first time…and wonder whether they can be right. Being able toview the detailed formula for calculating turnover proves the veracity of the data they can seeand thus gains HR credibility for the entire metrics effort.”
Vice President, Human ResourcesPrudential Financial
The Help Fileexplains thecomponentscomprisingeach metric…
…how each componentis calculated…
…and how theaggregate turnovernumber is calculated.
Source: Prudential Financial; CorporateLeadership Council research.
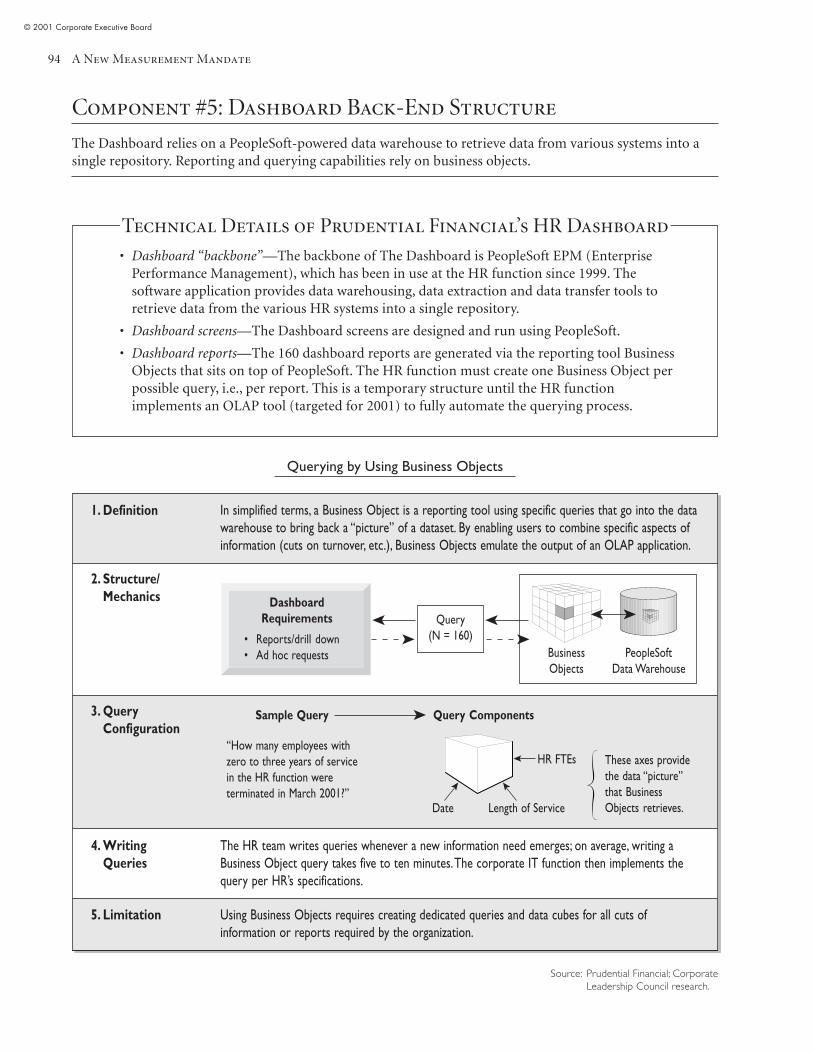
A New Measurement Mandate
© 2001 Corporate Executive Board
94
Component #5: Dashboard Back-End Structure
The Dashboard relies on a PeopleSoft-powered data warehouse to retrieve data from various systems into asingle repository. Reporting and querying capabilities rely on business objects.
Querying by Using Business Objects
Technical Details of Prudential Financial’s HR Dashboard
• Dashboard “backbone”—The backbone of The Dashboard is PeopleSoft EPM (EnterprisePerformance Management), which has been in use at the HR function since 1999. Thesoftware application provides data warehousing, data extraction and data transfer tools toretrieve data from the various HR systems into a single repository.
• Dashboard screens—The Dashboard screens are designed and run using PeopleSoft.
• Dashboard reports—The 160 dashboard reports are generated via the reporting tool BusinessObjects that sits on top of PeopleSoft. The HR function must create one Business Object perpossible query, i.e., per report. This is a temporary structure until the HR functionimplements an OLAP tool (targeted for 2001) to fully automate the querying process.
Length of Service
1. Definition
2. Structure/Mechanics
3. QueryConfiguration
4. WritingQueries
5. Limitation
In simplified terms, a Business Object is a reporting tool using specific queries that go into the datawarehouse to bring back a “picture” of a dataset. By enabling users to combine specific aspects ofinformation (cuts on turnover, etc.), Business Objects emulate the output of an OLAP application.
The HR team writes queries whenever a new information need emerges; on average, writing aBusiness Object query takes five to ten minutes. The corporate IT function then implements thequery per HR’s specifications.
Using Business Objects requires creating dedicated queries and data cubes for all cuts ofinformation or reports required by the organization.
Sample Query
“How many employees withzero to three years of servicein the HR function wereterminated in March 2001?”
HR FTEs
Date
These axes providethe data “picture”that BusinessObjects retrieves.
DashboardRequirements
• Reports/drill down• Ad hoc requests
Query Components
Query(N = 160)
PeopleSoftData Warehouse
BusinessObjects
➤
➤ ➤
➤➤ ➤ ➤
➤
➤➤
Source: Prudential Financial; CorporateLeadership Council research.
HR Dashboard
© 2001 Corporate Executive Board
95
Council Assessment:HR Dashboard
Key Differentiating Feature
• Careful design and targeted data structuring overcomes a suboptimal IT infrastructureat the back end and powers an online dashboard that offers its users sophisticatedquerying capabilities.
Caveats
• Although the design of the HR Dashboard as described in this practice provides a usefulblueprint for getting HR started with online reporting and analysis, the approach cannot,in itself, constitute a long-term solution.
• The major limiting feature is that the Business Objects architecture can very quicklybecome large and unwieldy. Maintaining this architecture requires a very disciplinedapproach to data administration, which may prove time and labor intensive.
Implementation Tips
• Review the organization’s IT offerings—The Council posits that most organizations will beable to set up a structure such as described in this practice fairly easily and at relatively littlecost. The vice president of human resources at Prudential Financial suggests that:
“As soon as HR functions keep data in a spreadsheet of sorts, they can begin tocolocate these spreadsheets in a data warehouse such as ours. Simply by virtue ofhaving client databases, most companies will have data warehouse structures inplace on which HR could draw; it’s just that HR may not be aware of suchstructures or may not know where or what to look for.”
• Carefully consider design criteria—The design considerations highlighted on page 5 arecritical for any HR function seeking to implement this practice because they provide vitalinformation about the level of reporting and technical sophistication required to meet theorganization’s information needs.
• Foster cooperation with IT from the start—The Council recommends that companies involvetheir corporate IT functions closely in any effort of creating an HR Dashboard. In additionto securing the HR function the corporate-level expertise it needs (which may go beyondthe expertise of HR IT specialist), it also ensures that the IT function maintains acomprehensive understanding of HR’s measurement goals and requirements when the timecomes to select and implement a sophisticated data mining and analysis software tool.
• Work with the ultimate end in mind—Finally, the Council strongly advises HR functions tocreate transitional online reporting and analysis tools only where they anticipate thestructures and requirements of the software tool that HR ultimately seeks to deploy. Thevalue of interim solutions diminishes greatly if HR must recreate all data and reportingstructures when a new software application goes live.
A New Measurement Mandate
© 2001 Corporate Executive Board
96
Practice Background:Transitional HR Dashboard
Intel is one of the world’s leading manufacturers of microchips. The company employsapproximately 86,000 individuals and generates annual revenues of approximately$33 billion.
Situation
• In 1999 the HR function at Intel seeks to initiate a concerted metrics effort, and the HRteam considers various measurement frameworks and tools offering Web-based metricsreporting capability.
• After a few months, the HR VP recognizes that the protracted discussions have stalled themeasurement initiative and decides that the HR function must break this deadlock bysimply “getting started.”
• The design challenge for the HR function is to now create an online reporting tool that canleverage Intel’s disparate IT systems while anticipating the structure of the state-of-the-arttool that the HR function is seeking to implement in the long term.
Action
• The HR VP tasks individual HR leaders with identifying key performance indicators intheir respective organizations and areas of responsibility; this exercise establishes an initialset of metrics for Intel’s HR function.
• Further, the HR VP decides that the best vehicle for sharing the newly selected key HRmetrics with the HR function and the organization at large is a metrics dashboard.
• With the help of the IT department, the HR function creates a tool explicitly designed as astopgap measure. This transitional dashboard has three key features:
✓ Component #1: Series of Predefined Reports—The dashboard offers a set of standardreports that can be run at all times. See page 98.
✓ Component #2: Excel-Based Back-End Structure—Each indicator is housed in anindividual Excel file, which serves as a “quasi” data warehouse for each item. See page 99.
✓ Component #3: Indicator Management—A group of data owners is responsible forconducting monthly data updates and transfer, and a dashboard administrator createsthe various reports in the dashboard. See page 100.
Result
• By 2000 Intel’s HR function has created a dashboard with key HR metrics through asix-week “tour de force.” The dashboard captures information from all HR organizationsand is accessible to all HR staff.
• The dashboard overcomes internal siloing in the HR function and greatly enhances HR’soperational efficiency. For example, the first dashboard review reveals that the staffingfunction is significantly ahead of its hiring targets. As a result, the training departmentrecognizes the need to create 10 more onboarding classes than originally planned.
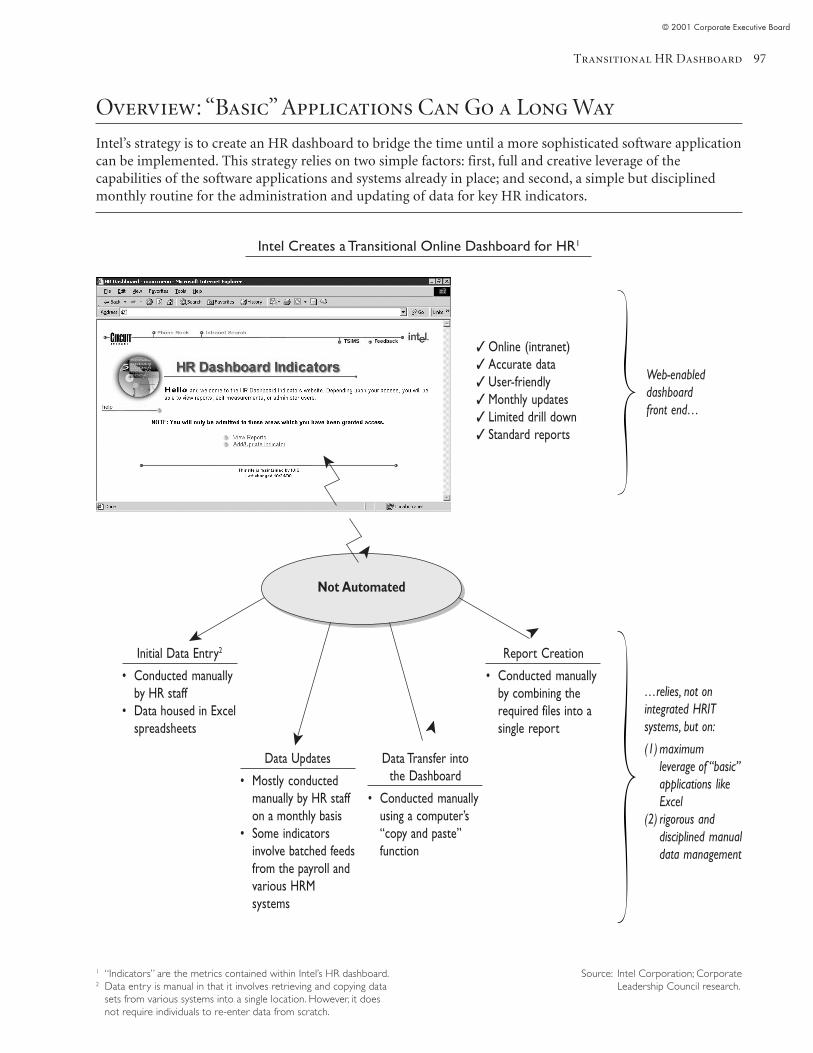
Transitional HR Dashboard
© 2001 Corporate Executive Board
97
Overview: “Basic” Applications Can Go a Long Way
Intel’s strategy is to create an HR dashboard to bridge the time until a more sophisticated software applicationcan be implemented. This strategy relies on two simple factors: first, full and creative leverage of thecapabilities of the software applications and systems already in place; and second, a simple but disciplinedmonthly routine for the administration and updating of data for key HR indicators.
Source: Intel Corporation; CorporateLeadership Council research.
Intel Creates a Transitional Online Dashboard for HR1
Web-enableddashboardfront end…
…relies, not onintegrated HRITsystems, but on:
(1) maximumleverage of “basic”applications likeExcel
(2) rigorous anddisciplined manualdata management
Report Creation
• Conducted manuallyby combining therequired files into asingle report
1 “Indicators” are the metrics contained within Intel’s HR dashboard.2 Data entry is manual in that it involves retrieving and copying data
sets from various systems into a single location. However, it doesnot require individuals to re-enter data from scratch.
✓ Online (intranet)✓ Accurate data✓ User-friendly✓ Monthly updates✓ Limited drill down✓ Standard reports
Not Automated
Initial Data Entry2
• Conducted manuallyby HR staff
• Data housed in Excelspreadsheets
Data Updates
• Mostly conductedmanually by HR staffon a monthly basis
• Some indicatorsinvolve batched feedsfrom the payroll andvarious HRMsystems
Data Transfer intothe Dashboard
• Conducted manuallyusing a computer’s“copy and paste”function
➤
➤ ➤
➤
➤
➤
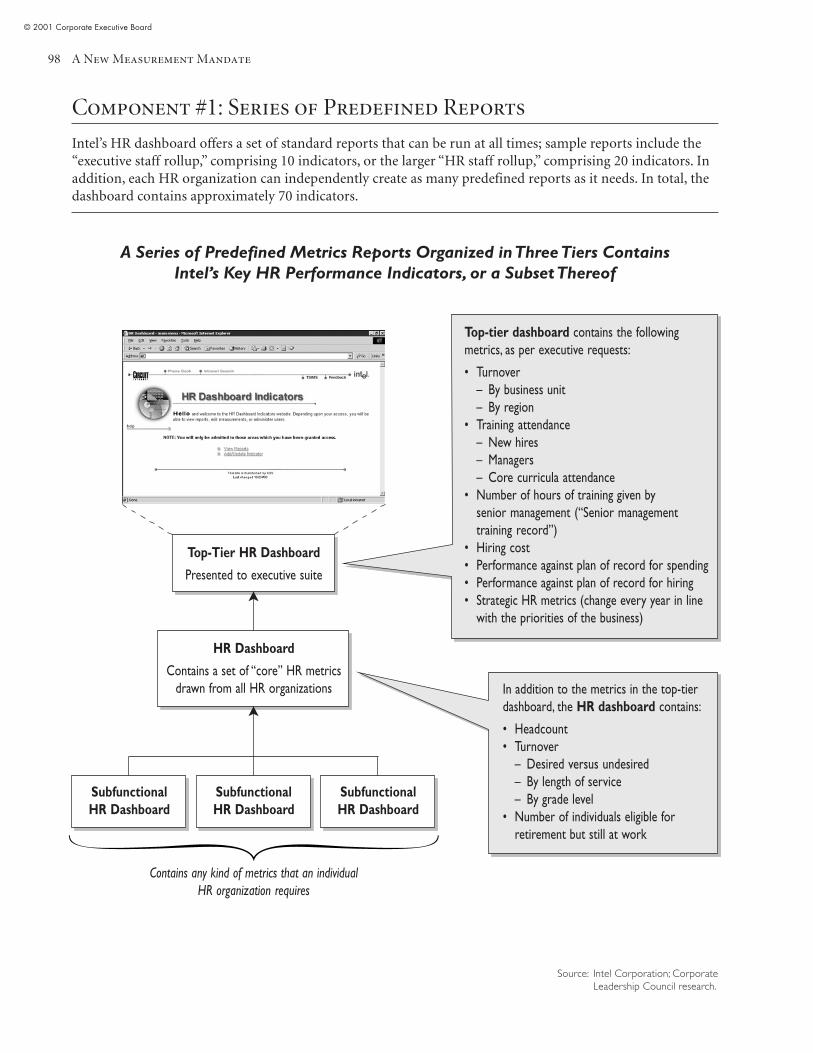
A New Measurement Mandate
© 2001 Corporate Executive Board
98
Component #1: Series of Predefined Reports
Intel’s HR dashboard offers a set of standard reports that can be run at all times; sample reports include the“executive staff rollup,” comprising 10 indicators, or the larger “HR staff rollup,” comprising 20 indicators. Inaddition, each HR organization can independently create as many predefined reports as it needs. In total, thedashboard contains approximately 70 indicators.
A Series of Predefined Metrics Reports Organized in Three Tiers ContainsIntel’s Key HR Performance Indicators, or a Subset Thereof
In addition to the metrics in the top-tierdashboard, the HR dashboard contains:
• Headcount• Turnover
– Desired versus undesired– By length of service– By grade level
• Number of individuals eligible forretirement but still at work
SubfunctionalHR Dashboard
HR Dashboard
Contains a set of “core” HR metricsdrawn from all HR organizations
Top-Tier HR Dashboard
Presented to executive suite
Top-tier dashboard contains the followingmetrics, as per executive requests:
• Turnover– By business unit– By region
• Training attendance– New hires– Managers– Core curricula attendance
• Number of hours of training given bysenior management (“Senior managementtraining record”)
• Hiring cost• Performance against plan of record for spending• Performance against plan of record for hiring• Strategic HR metrics (change every year in line
with the priorities of the business)
SubfunctionalHR Dashboard
SubfunctionalHR Dashboard
➤➤
Contains any kind of metrics that an individualHR organization requires
Source: Intel Corporation; CorporateLeadership Council research.
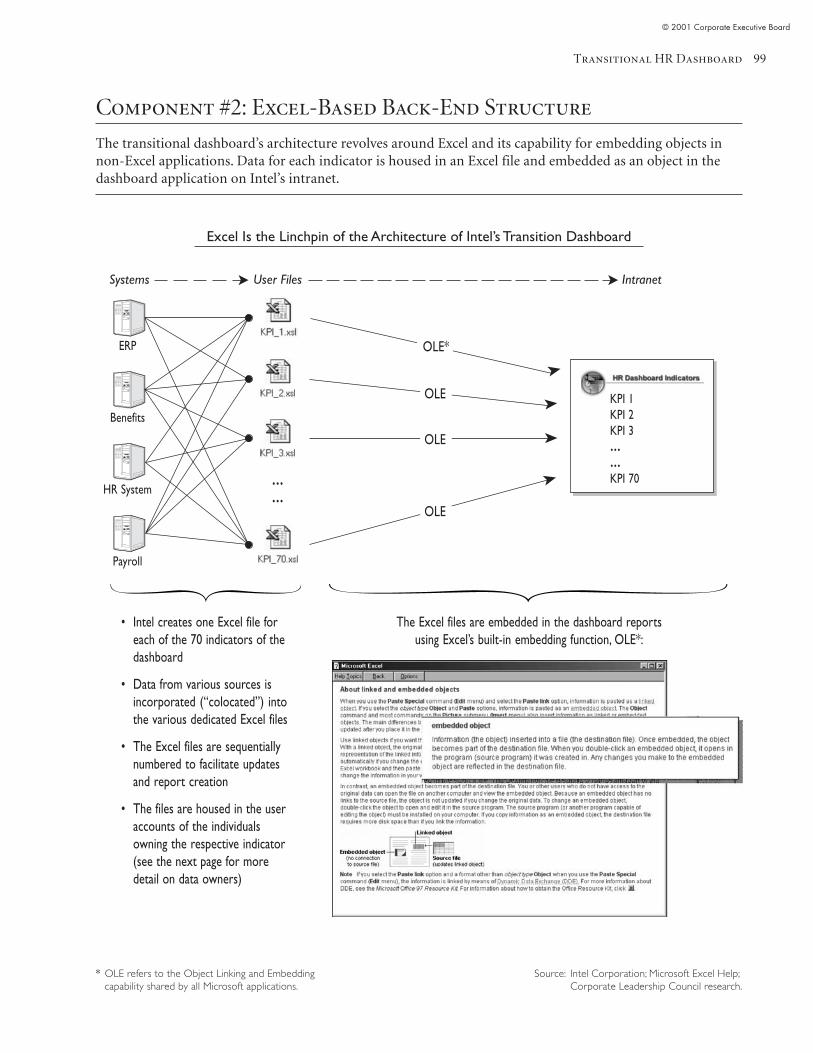
Transitional HR Dashboard
© 2001 Corporate Executive Board
99
Component #2: Excel-Based Back-End Structure
The transitional dashboard’s architecture revolves around Excel and its capability for embedding objects innon-Excel applications. Data for each indicator is housed in an Excel file and embedded as an object in thedashboard application on Intel’s intranet.
Excel Is the Linchpin of the Architecture of Intel’s Transition Dashboard
Source: Intel Corporation; Microsoft Excel Help;Corporate Leadership Council research.
• Intel creates one Excel file foreach of the 70 indicators of thedashboard
• Data from various sources isincorporated (“colocated”) intothe various dedicated Excel files
• The Excel files are sequentiallynumbered to facilitate updatesand report creation
• The files are housed in the useraccounts of the individualsowning the respective indicator(see the next page for moredetail on data owners)
* OLE refers to the Object Linking and Embeddingcapability shared by all Microsoft applications.
The Excel files are embedded in the dashboard reportsusing Excel’s built-in embedding function, OLE*:
Systems User Files Intranet
KPI 1KPI 2KPI 3……KPI 70…
…
ERP
Benefits
HR System
Payroll
➤OLE*
➤OLE
➤OLE
➤
OLE
➤ ➤
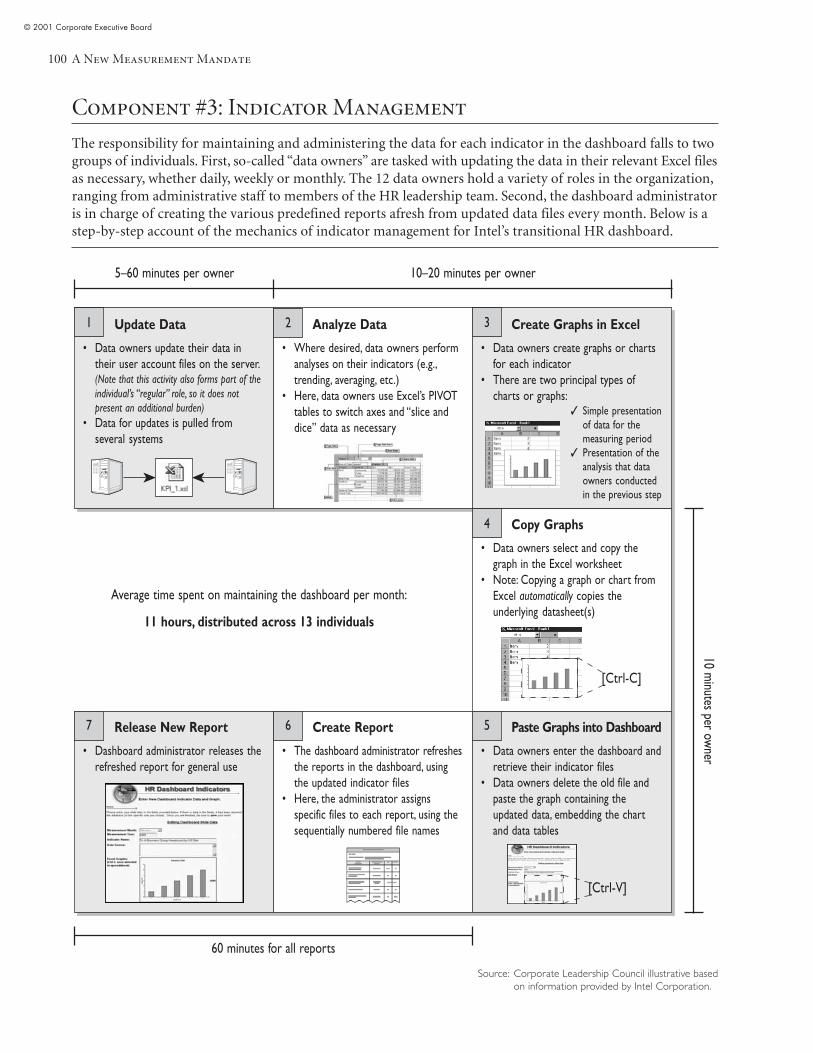
A New Measurement Mandate
© 2001 Corporate Executive Board
100
Component #3: Indicator Management
The responsibility for maintaining and administering the data for each indicator in the dashboard falls to twogroups of individuals. First, so-called “data owners” are tasked with updating the data in their relevant Excel filesas necessary, whether daily, weekly or monthly. The 12 data owners hold a variety of roles in the organization,ranging from administrative staff to members of the HR leadership team. Second, the dashboard administratoris in charge of creating the various predefined reports afresh from updated data files every month. Below is astep-by-step account of the mechanics of indicator management for Intel’s transitional HR dashboard.
Source: Corporate Leadership Council illustrative basedon information provided by Intel Corporation.
1 2 3
4
567
• Data owners create graphs or chartsfor each indicator
• There are two principal types ofcharts or graphs:
✓ Simple presentationof data for themeasuring period
✓ Presentation of theanalysis that dataowners conductedin the previous step
• Data owners select and copy thegraph in the Excel worksheet
• Note: Copying a graph or chart fromExcel automatically copies theunderlying datasheet(s)
• Data owners enter the dashboard andretrieve their indicator files
• Data owners delete the old file andpaste the graph containing theupdated data, embedding the chartand data tables
• Dashboard administrator releases therefreshed report for general use
• The dashboard administrator refreshesthe reports in the dashboard, usingthe updated indicator files
• Here, the administrator assignsspecific files to each report, using thesequentially numbered file names
Average time spent on maintaining the dashboard per month:
11 hours, distributed across 13 individuals
Update Data
• Where desired, data owners performanalyses on their indicators (e.g.,trending, averaging, etc.)
• Here, data owners use Excel’s PIVOTtables to switch axes and “slice anddice” data as necessary
Create Graphs in Excel
Copy Graphs
Paste Graphs into DashboardRelease New Report Create Report
• Data owners update their data intheir user account files on the server.(Note that this activity also forms part of theindividual’s “regular” role, so it does notpresent an additional burden)
• Data for updates is pulled fromseveral systems
Analyze Data
10 minutes per owner
60 minutes for all reports
5–60 minutes per owner 10–20 minutes per owner
➤ ➤
[Ctrl-C]
[Ctrl-V]
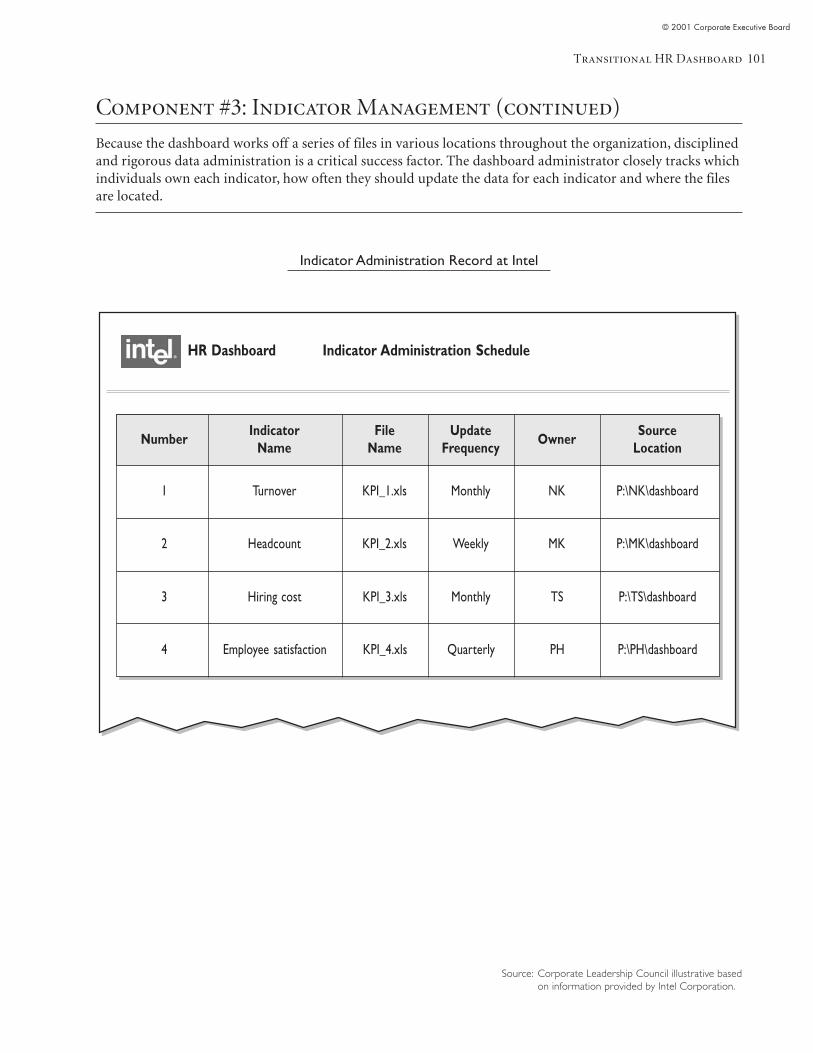
Transitional HR Dashboard
© 2001 Corporate Executive Board
101
HR Dashboard Indicator Administration Schedule
Component #3: Indicator Management (continued)
Because the dashboard works off a series of files in various locations throughout the organization, disciplinedand rigorous data administration is a critical success factor. The dashboard administrator closely tracks whichindividuals own each indicator, how often they should update the data for each indicator and where the filesare located.
Indicator Administration Record at Intel
NumberIndicator
NameFile
NameUpdate
FrequencyOwner
SourceLocation
1 Turnover KPI_1.xls Monthly NK P:\NK\dashboard
2 Headcount KPI_2.xls Weekly MK P:\MK\dashboard
3 Hiring cost KPI_3.xls Monthly TS P:\TS\dashboard
4 Employee satisfaction KPI_4.xls Quarterly PH P:\PH\dashboard
Source: Corporate Leadership Council illustrative basedon information provided by Intel Corporation.

A New Measurement Mandate
© 2001 Corporate Executive Board
102
Transitional HR Dashboard
© 2001 Corporate Executive Board
103
Council Assessment:Transitional HR Dashboard
Key Differentiating Feature
• A rudimentary online dashboard jump-starts HR’s measurement effort in the absence of anoptimal IT infrastructure. The transitional dashboard relies on simple Excel-based queriesto retrieve metrics information, which is loaded into dedicated files in the front-endapplication, from the company’s different databases.
Caveats
• The tool only represents a stopgap measure, even more so than the dashboard profiled inBenchmark Practice #7 (page 88).
• The first major limitation is the comparatively high level of labor and time resourcesrequired to administrate and maintain the Excel-based file structure underlying thedashboard’s architecture.
• A second limitation is that the very nature of the transitional dashboard also restricts thecapacity (i.e., number of reports) of the dashboard. The reason here is that simple setupof one Excel file per indicator can quickly mushroom out of control when HR starts, or isrequired, to include increasingly more detailed cuts on indicator data in the dashboard reports.
• Finally, it is important to recognize that, despite being Web-enabled and offering standardreport viewing capabilities, this transitional tool does not allow users to drill down deeplyinto specific data points or to any other analytic activities that a true OLAP applicationwould provide.
Implementation Tips
• Leverage the learning opportunity offered by the transitional dashboard—The Councilsuggests that the value of the dashboard can be maximized where HR functions train onemember of the metrics team to manage the transitional dashboard. This strategy affordsthe HR function unique insights into the IT mechanisms required for their metrics effort,and the dashboard can truly become a step in the process of implementing the mosteffective HR IT application.
• Foster cooperation with IT—The first implementation step notwithstanding, the Councilalso recommends that HR functions should involve their corporate IT functions closely inthe creation of a transitional HR dashboard. This strategy ensures that the IT function has acomprehensive understanding of HR’s measurement goals and requirements when the timecomes to decide on and implement a sophisticated data mining and analysis software tool.
• Work with the ultimate end in mind—Finally, the Council strongly advises HR functions tocreate transitional online reporting and analysis tools only where they anticipate thestructures and requirements of the software tool that HR ultimately seeks to deploy. Thevalue of interim solutions diminishes greatly when HR has to recreate all data andreporting structures when a new software application goes live.

A New Measurement Mandate
© 2001 Corporate Executive Board
104
© 2001 Corporate Executive Board
105
Step #7: Ensuring Metrics Deployment
Benchmark Practice #9
“Code Red” Performance Management System
Description
“Code Red” is a simple yet effective protocol for monitoring performance in HR areascritical to the success of the business. Once a Code Red tag is assigned to a business unitunderperforming against key metrics, the business unit must take action to improve performanceover a one-year period.
Goal
The goal is to leverage metrics information by instituting a mechanism for enforcing correctiveaction in areas relating to key corporate priorities.
Key Differentiating Feature
This approach combines sets of critical performance indicators into a tool for detectingunderperformance in key areas and taking corrective action before that underperformanceseriously harms the business.
Benchmark Practice #10
Strategic Metrics Reporting
Description
Strategic metrics reporting involves a range of services from comprehensive monthly informationpacks to standard reports for individual metrics and ad hoc responses to line information needs.This process is conducted by a metrics analysis team that acts as a dedicated information centerfor the business regarding all matters relating to HR measurement.
Goal
The goal is to support line managers and executives in their strategic decisions by makingavailable to them pertinent and accurate metrics information bolstered by sophisticated analysison a real-time basis.
Key Differentiating Feature
The approach differs from standard practice in the amount of analysis and contextualinformation that accompany the pure metrics data. Taking a consultative role, thereporting team proactively identifies trends and offers astute assessments of their impacton the organization.

A New Measurement Mandate
© 2001 Corporate Executive Board
106
“Code Red” Performance Management System
© 2001 Corporate Executive Board
107
Practice Background:“Code Red” Performance Management SystemAmerican Express is one of the world’s leading credit card companies and travel agencies.The company employs approximately 89,000 individuals and generates annual revenuesof approximately $23 billion.
Situation
• In 1997 the HR function at American Express recognizes that monitoring a subset of themetrics that it routinely tracks can provide an early warning of underperformance in areascritical to the continued success of the organization.
• The challenge for the HR function is threefold. First, HR must identify the two or three mostpertinent metrics for the organization that will serve as leading indicators of organizationalhot spots. Second, HR must find a vehicle for formalizing and institutionalizing suchmonitoring in the organization. And third, HR must develop a strategy for ensuring thatbusiness units take remedial action to improve on performance in the key areas.
Action
• The HR function creates a systematic procedure for reviewing each business unit’sperformance in the targeted key areas: compliance, employee turnover and employeesatisfaction. Significantly, this procedure involves a cross-comparison of indicators tohighlight those business units that underperform vis-à-vis specific targets in two or moreof the critical areas.
• Known as the “Code Red review,” this process is the responsibility of the employee relationsgroup and the relationship leaders* in each business unit.
• The Code Red review is conducted annually and has two components:
✓ Component #1: Code Red Trigger Mechanism—Two decision rules help the HR function identifybusiness units requiring a Code Red designation. See page 108.
✓ Component #2: Detailed Turnaround Plan—The leaders of affected business units must formulatedetailed action plans for improving their unit’s performance. Failure to eliminate a Code Redwithin a 12-month period may carry significant penalties. See page 110.
Result
• The Code Red process enables the HR function to quickly and reliably identify problemlocations or units and to establish a suitable course of corrective action.
• Business leaders who show sustained underperformance receive targeted coaching fromtheir direct manager and the employee relations team, and they may be relieved of theirresponsibility where appropriate.
• In 2000, 72 percent of all Code Red locations showed a marked improvement in employeesatisfaction scores.
* Relationship leaders are the seniormostHR executives in the business units.
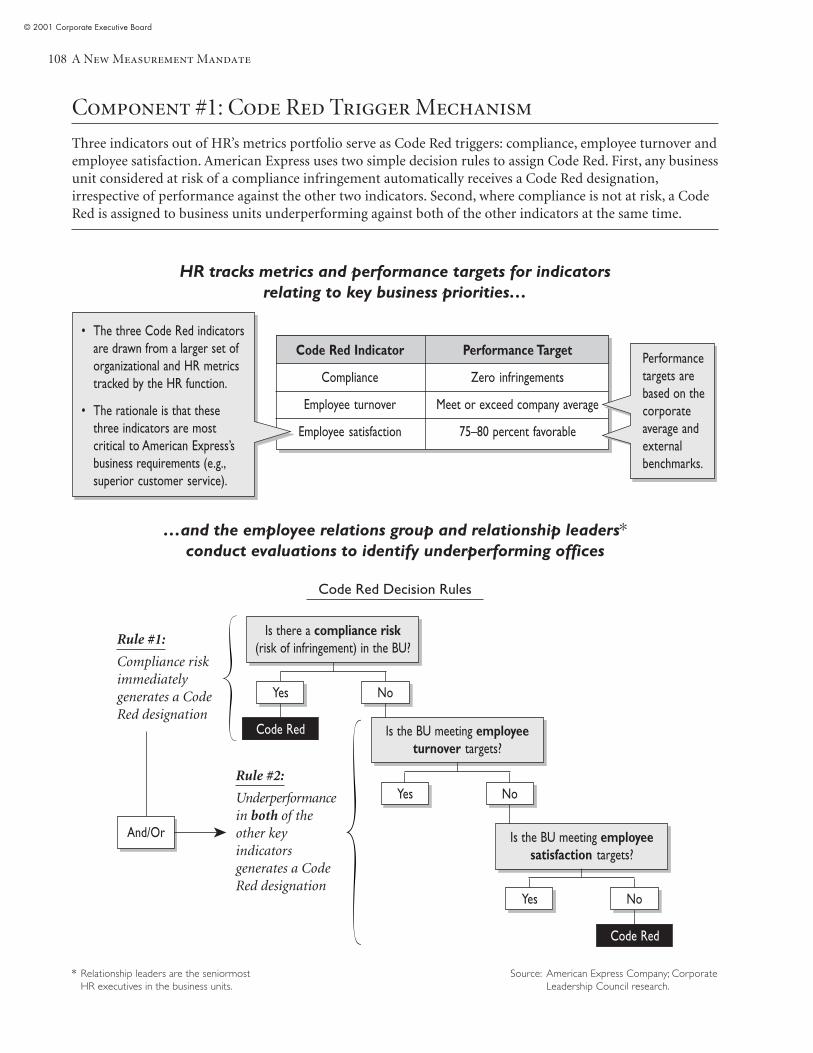
A New Measurement Mandate
© 2001 Corporate Executive Board
108
Code Red Indicator Performance Target
Compliance Zero infringements
Employee turnover Meet or exceed company average
Employee satisfaction 75–80 percent favorable
Component #1: Code Red Trigger Mechanism
Three indicators out of HR’s metrics portfolio serve as Code Red triggers: compliance, employee turnover andemployee satisfaction. American Express uses two simple decision rules to assign Code Red. First, any businessunit considered at risk of a compliance infringement automatically receives a Code Red designation,irrespective of performance against the other two indicators. Second, where compliance is not at risk, a CodeRed is assigned to business units underperforming against both of the other indicators at the same time.
Source: American Express Company; CorporateLeadership Council research.
HR tracks metrics and performance targets for indicatorsrelating to key business priorities…
…and the employee relations group and relationship leaders*conduct evaluations to identify underperforming offices
Code Red Decision Rules
* Relationship leaders are the seniormostHR executives in the business units.
Rule #1:
Compliance riskimmediatelygenerates a CodeRed designation
• The three Code Red indicatorsare drawn from a larger set oforganizational and HR metricstracked by the HR function.
• The rationale is that thesethree indicators are mostcritical to American Express’sbusiness requirements (e.g.,superior customer service).
Performancetargets arebased on thecorporateaverage andexternalbenchmarks.
Rule #2:
Underperformancein both of theother keyindicatorsgenerates a CodeRed designation
Is there a compliance risk(risk of infringement) in the BU?
Is the BU meeting employeeturnover targets?
Yes No
Yes
Code Red
No
Is the BU meeting employeesatisfaction targets?
Yes No
Code Red
And/Or ➤
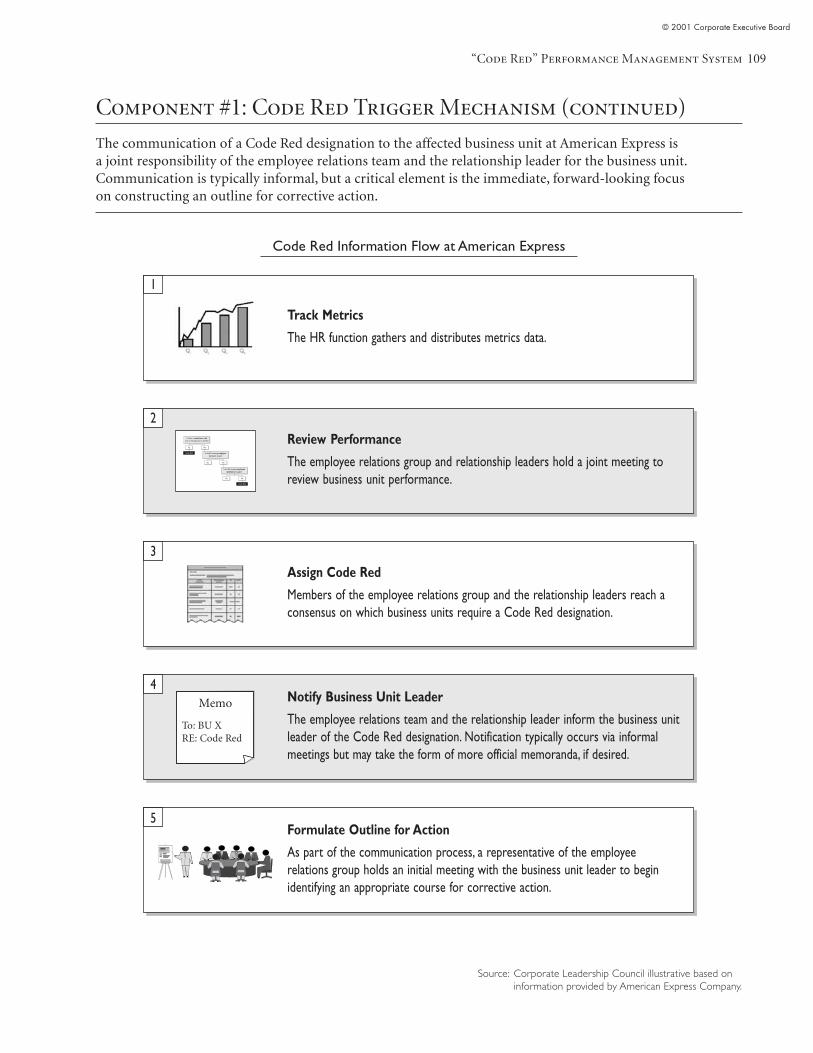
“Code Red” Performance Management System
© 2001 Corporate Executive Board
109
Component #1: Code Red Trigger Mechanism (continued)
The communication of a Code Red designation to the affected business unit at American Express isa joint responsibility of the employee relations team and the relationship leader for the business unit.Communication is typically informal, but a critical element is the immediate, forward-looking focuson constructing an outline for corrective action.
Code Red Information Flow at American Express
Source: Corporate Leadership Council illustrative based oninformation provided by American Express Company.
Track Metrics
The HR function gathers and distributes metrics data.
Review Performance
The employee relations group and relationship leaders hold a joint meeting toreview business unit performance.
Assign Code Red
Members of the employee relations group and the relationship leaders reach aconsensus on which business units require a Code Red designation.
Notify Business Unit Leader
The employee relations team and the relationship leader inform the business unitleader of the Code Red designation. Notification typically occurs via informalmeetings but may take the form of more official memoranda, if desired.
Formulate Outline for Action
As part of the communication process, a representative of the employeerelations group holds an initial meeting with the business unit leader to beginidentifying an appropriate course for corrective action.
1
2
3
4
5
Memo
To: BU XRE: Code Red
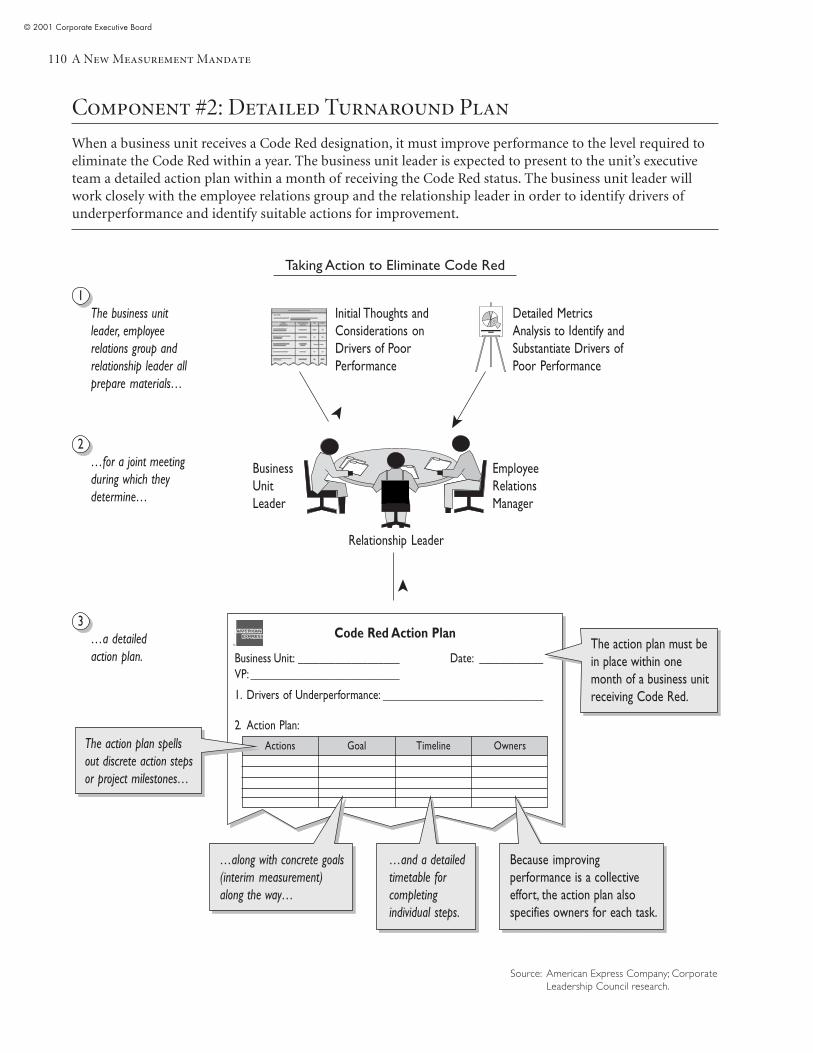
A New Measurement Mandate
© 2001 Corporate Executive Board
110
Component #2: Detailed Turnaround Plan
When a business unit receives a Code Red designation, it must improve performance to the level required toeliminate the Code Red within a year. The business unit leader is expected to present to the unit’s executiveteam a detailed action plan within a month of receiving the Code Red status. The business unit leader willwork closely with the employee relations group and the relationship leader in order to identify drivers ofunderperformance and identify suitable actions for improvement.
Taking Action to Eliminate Code Red
2
1
3
The business unitleader, employeerelations group andrelationship leader allprepare materials…
Initial Thoughts andConsiderations onDrivers of PoorPerformance
Detailed MetricsAnalysis to Identify andSubstantiate Drivers ofPoor Performance
…for a joint meetingduring which theydetermine…
BusinessUnitLeader
Relationship Leader
EmployeeRelationsManager
…a detailedaction plan.
➤ ➤
➤
Code Red Action Plan
Business Unit: ___________________ Date: ____________VP: ____________________________
1. Drivers of Underperformance: ______________________________
2. Action Plan:
Actions Goal Timeline Owners
The action plan must bein place within onemonth of a business unitreceiving Code Red.
…and a detailedtimetable forcompletingindividual steps.
…along with concrete goals(interim measurement)along the way…
The action plan spellsout discrete action stepsor project milestones…
Source: American Express Company; CorporateLeadership Council research.
Because improvingperformance is a collectiveeffort, the action plan alsospecifies owners for each task.
“Code Red” Performance Management System
© 2001 Corporate Executive Board
111
Component #2: Detailed Turnaround Plan (continued)
In order to lend rigor to the Code Red review process, business unit leaders are held personally accountablefor significantly improving performance of their units within 12 months.
A New Slant on Accountability
• If after 12 months a Code Red business unit receives another Code Red designation, thebusiness unit leader will be asked to leave the position in 80 percent of the cases. One seniorrelationship leader comments that “no business leader can run a Code Red office two yearsin a row.”
• Exceptions are granted only where a leader comes into a Code Red unit during thecourse of the review period and thus cannot be reasonably expected to effect a drasticperformance turnaround.
• In 2000 over 50 subunits of business units at American Express received Code Reddesignations. Out of these, 72 percent were able to sufficiently improve performanceby 2001 to avoid receiving another Code Red designations.

A New Measurement Mandate
© 2001 Corporate Executive Board
112
“Code Red” Performance Management System
© 2001 Corporate Executive Board
113
Council Assessment:“Code Red” Performance Management System
Key Differentiating Features
• This approach combines sets of critical performance indicators into a tool for detectingunderperformance in key areas and taking corrective action before that underperformanceseriously harms the business.
• The approach differs from standard practice in the severity of the penalty associated withthe failure to eliminate Code Red, which serves to embed the use of HR metrics into theorganizational performance management process.
Caveat
• This approach can only be value added where companies have a very clear understandingof the top two or three HR-related indicators relevant to organizational growth and success.
Implementation Tips
• Automate monitoring—The value of Code Red reviews can be maximized whereorganizations automate the monitoring of the selected key indicators.
• Conduct midterm reviews—The effectiveness of Code Red reviews can be improved wherecompanies institute a process for regular midterm reviews, for example, three and sixmonths after the Code Red designation. Regular midterm reviews facilitate progressmonitoring and can help to adjust actions or to effect midcourse corrections ifperformance is not improving.
A New Measurement Mandate
© 2001 Corporate Executive Board
114
Practice Background:Strategic Metrics Reporting
Nationwide Building Society is the United Kingdom’s largest mutual building societyand one of the United Kingdom’s largest mortgage providers. The company employsapproximately 15,000 individuals and manages assets of approximately $103 billion.
Situation
• Although in the late 1990s the various departments within Nationwide’s HR function aretracking a large set of HR and organizational metrics, the function is not making aconcerted effort to pull all metrics information together and disseminate it to the business.
• The HR function recognizes that its metrics effort is not contributing to corporate decisionmaking or otherwise adding value and thus faces a twofold challenge.
• The first challenge is to significantly improve the quality and value of metrics reportingitself. The second challenge is to identify a vehicle for disseminating the metricsinformation to the business so that it can be fully used where it is most needed.
Action
• The HR director decides that the disparate metrics pieces must be consolidated in a singlereporting format and must be supplemented by a significant amount of analysis and contextualinformation. Concurrently, the HR director decides that the best approach to producing thenew HR metrics report is to create a dedicated locus of responsibility for this task.
• In 1998, therefore, the HR function launches the metrics analysis team, branded internallyas “Management Information Service,” with the mission to conduct strategic metricsreporting, to publish HR metrics information packs for line executives and managers,and to facilitate the use of these information packs by the target audience.
• Initially the team focuses on creating a valuable template for HR metrics reporting, whichincorporates analysis and impact assessment, but soon adds additional services to itsportfolio. In addition to metrics information packs, the team now also offers a set ofstandard metrics reports for each business and answers ad hoc metrics queries. Soon theteam begins to include external benchmarks to provide context for each metric; the teamreviews each benchmark to identify best-performing organizations to which Nationwidecould turn for learning about best practices, if desired.
• Finally, the team quickly adds two further services to its portfolio: first, a set of standardmetrics reports for each business; second, answers to ad hoc metrics queries from the line.
Result
• Metrics make executive agenda—Executives use HR’s metrics packs and reports to shape thebusiness agenda for their monthly management meetings.
• Strategic metrics reporting generates cost savings—The team’s consultative role in isolatingparticular turnover drivers and recommending actions for improving retention in each of thebusiness areas generated turnover-related cost savings of $11.7 million last year alone.
• Increasing service demand is manifested in team growth—The team is such a popularresource for managers throughout Nationwide that it has grown from two FTEs in 1998 tosix FTEs in 2001 to satisfy levels of information demand.
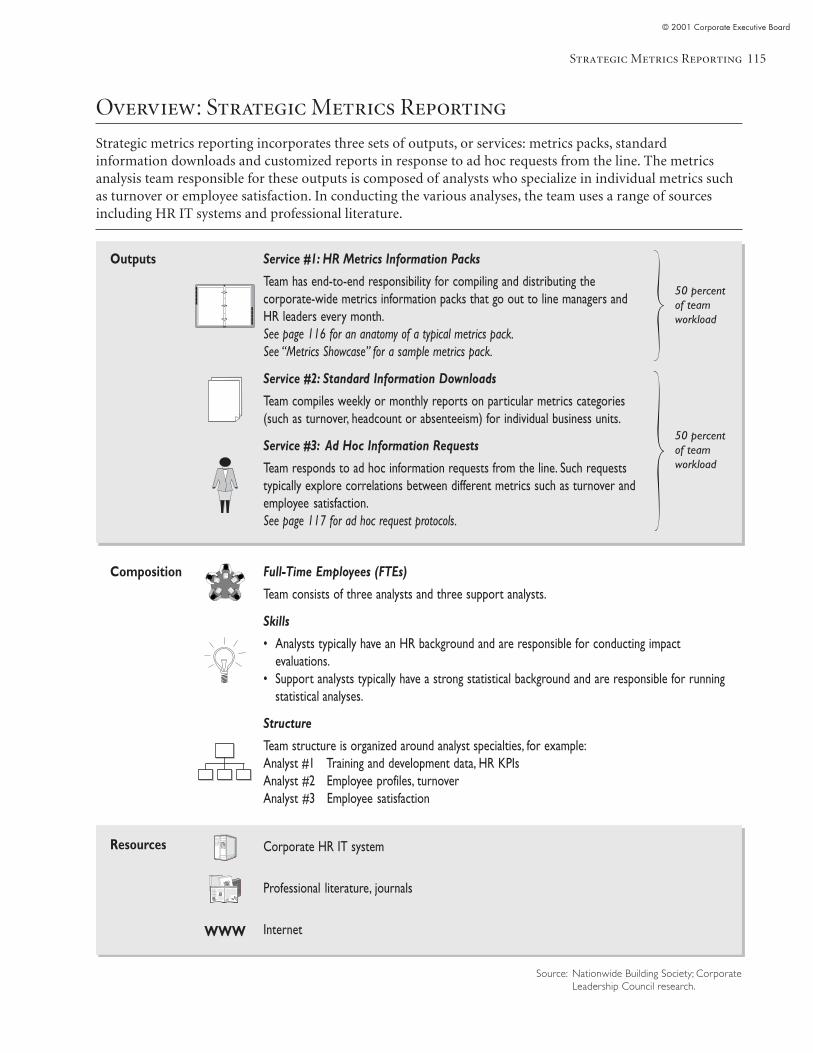
Strategic Metrics Reporting
© 2001 Corporate Executive Board
115
Overview: Strategic Metrics Reporting
Strategic metrics reporting incorporates three sets of outputs, or services: metrics packs, standardinformation downloads and customized reports in response to ad hoc requests from the line. The metricsanalysis team responsible for these outputs is composed of analysts who specialize in individual metrics suchas turnover or employee satisfaction. In conducting the various analyses, the team uses a range of sourcesincluding HR IT systems and professional literature.
50 percentof teamworkload
50 percentof teamworkload
Outputs Service #1: HR Metrics Information Packs
Team has end-to-end responsibility for compiling and distributing thecorporate-wide metrics information packs that go out to line managers andHR leaders every month.See page 116 for an anatomy of a typical metrics pack.See “Metrics Showcase” for a sample metrics pack.
Service #2: Standard Information Downloads
Team compiles weekly or monthly reports on particular metrics categories(such as turnover, headcount or absenteeism) for individual business units.
Service #3: Ad Hoc Information Requests
Team responds to ad hoc information requests from the line. Such requeststypically explore correlations between different metrics such as turnover andemployee satisfaction.See page 117 for ad hoc request protocols.
Composition
Resources
Full-Time Employees (FTEs)
Team consists of three analysts and three support analysts.
Skills
• Analysts typically have an HR background and are responsible for conducting impactevaluations.
• Support analysts typically have a strong statistical background and are responsible for runningstatistical analyses.
Structure
Team structure is organized around analyst specialties, for example:Analyst #1 Training and development data, HR KPIsAnalyst #2 Employee profiles, turnoverAnalyst #3 Employee satisfaction
Corporate HR IT system
Professional literature, journals
Internet
Heart of the
Enterprise
Core Competencies and
the Renaissance of the
Large Corporation
Source: Nationwide Building Society; CorporateLeadership Council research.
WWW
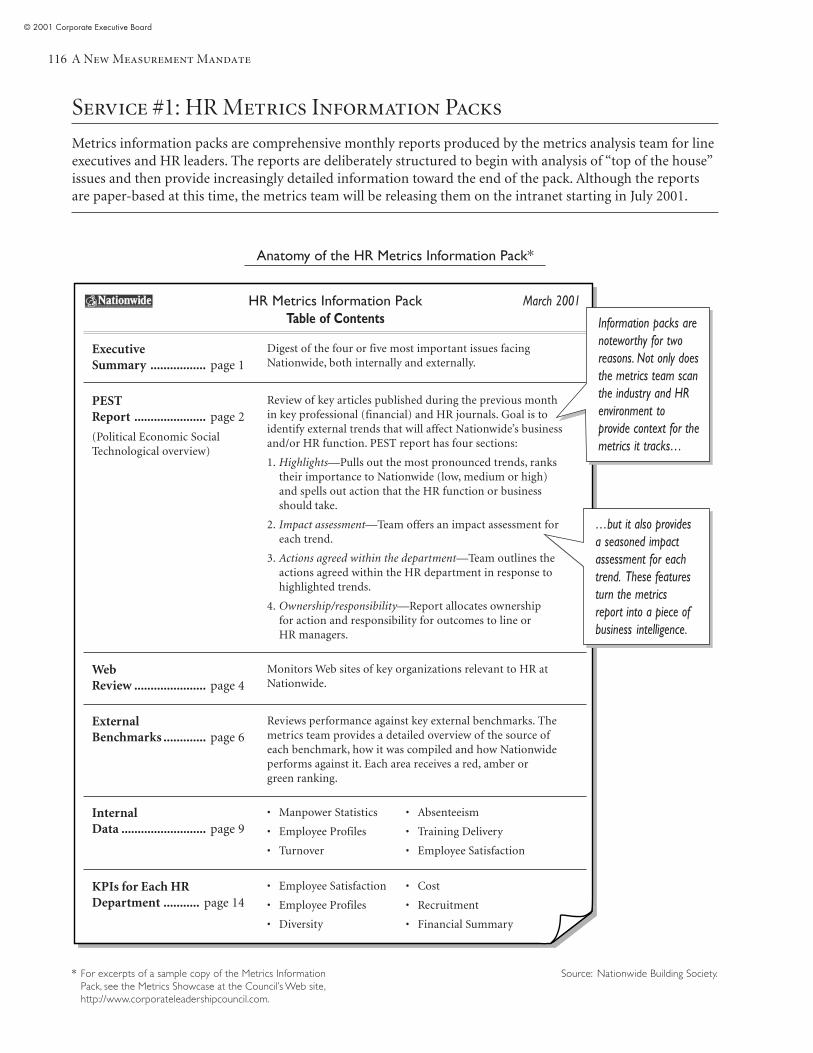
A New Measurement Mandate
© 2001 Corporate Executive Board
116
Service #1: HR Metrics Information Packs
Metrics information packs are comprehensive monthly reports produced by the metrics analysis team for lineexecutives and HR leaders. The reports are deliberately structured to begin with analysis of “top of the house”issues and then provide increasingly detailed information toward the end of the pack. Although the reportsare paper-based at this time, the metrics team will be releasing them on the intranet starting in July 2001.
Anatomy of the HR Metrics Information Pack*
Source: Nationwide Building Society.
ExecutiveSummary ................. page 1
HR Metrics Information PackTable of Contents
Digest of the four or five most important issues facingNationwide, both internally and externally.
PESTReport ...................... page 2
(Political Economic SocialTechnological overview)
Review of key articles published during the previous monthin key professional (financial) and HR journals. Goal is toidentify external trends that will affect Nationwide’s businessand/or HR function. PEST report has four sections:
1. Highlights—Pulls out the most pronounced trends, rankstheir importance to Nationwide (low, medium or high)and spells out action that the HR function or businessshould take.
2. Impact assessment—Team offers an impact assessment foreach trend.
3. Actions agreed within the department—Team outlines theactions agreed within the HR department in response tohighlighted trends.
4. Ownership/responsibility—Report allocates ownershipfor action and responsibility for outcomes to line orHR managers.
WebReview ...................... page 4
Monitors Web sites of key organizations relevant to HR atNationwide.
ExternalBenchmarks ............. page 6
Reviews performance against key external benchmarks. Themetrics team provides a detailed overview of the source ofeach benchmark, how it was compiled and how Nationwideperforms against it. Each area receives a red, amber orgreen ranking.
InternalData .......................... page 9
• Manpower Statistics
• Employee Profiles
• Turnover
• Absenteeism
• Training Delivery
• Employee Satisfaction
KPIs for Each HRDepartment ........... page 14
• Employee Satisfaction
• Employee Profiles
• Diversity
• Cost
• Recruitment
• Financial Summary
March 2001
Information packs arenoteworthy for tworeasons. Not only doesthe metrics team scanthe industry and HRenvironment toprovide context for themetrics it tracks…
…but it also providesa seasoned impactassessment for eachtrend. These featuresturn the metricsreport into a piece ofbusiness intelligence.
* For excerpts of a sample copy of the Metrics InformationPack, see the Metrics Showcase at the Council’s Web site,http://www.corporateleadershipcouncil.com.
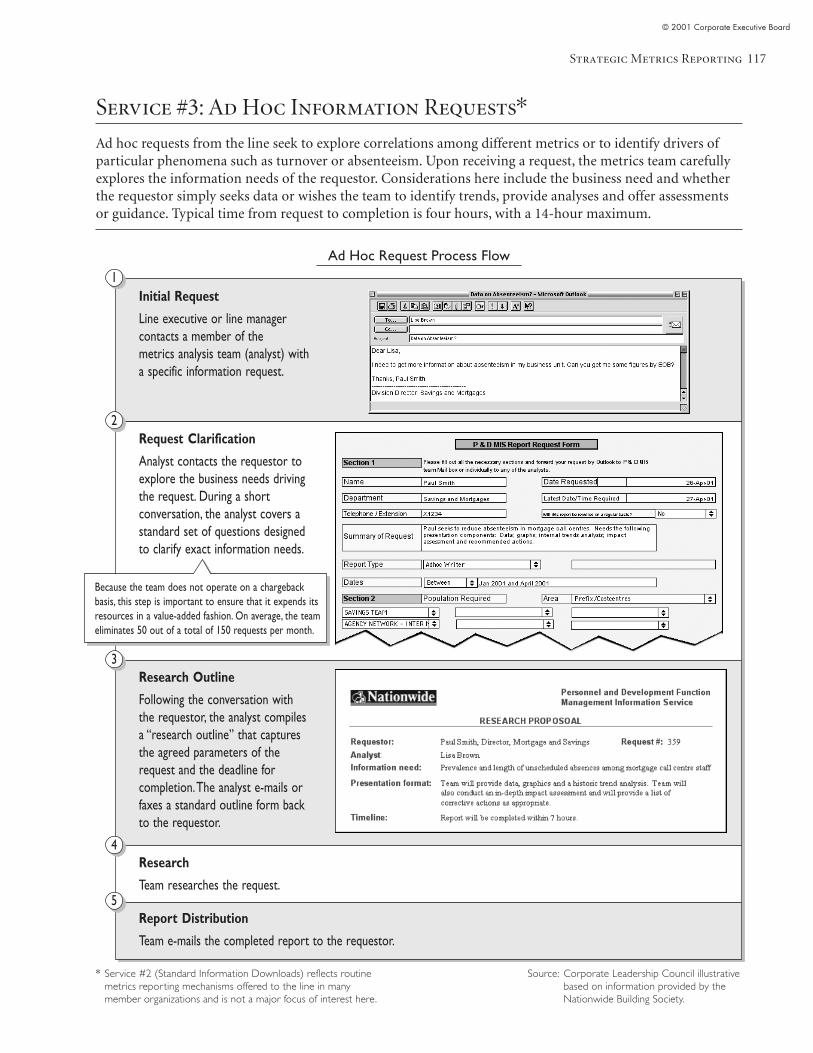
Strategic Metrics Reporting
© 2001 Corporate Executive Board
117
Initial Request
Line executive or line managercontacts a member of themetrics analysis team (analyst) witha specific information request.
1
Request Clarification
Analyst contacts the requestor toexplore the business needs drivingthe request. During a shortconversation, the analyst covers astandard set of questions designedto clarify exact information needs.
2
Research Outline
Following the conversation withthe requestor, the analyst compilesa “research outline” that capturesthe agreed parameters of therequest and the deadline forcompletion. The analyst e-mails orfaxes a standard outline form backto the requestor.
3
Service #3: Ad Hoc Information Requests*Ad hoc requests from the line seek to explore correlations among different metrics or to identify drivers ofparticular phenomena such as turnover or absenteeism. Upon receiving a request, the metrics team carefullyexplores the information needs of the requestor. Considerations here include the business need and whetherthe requestor simply seeks data or wishes the team to identify trends, provide analyses and offer assessmentsor guidance. Typical time from request to completion is four hours, with a 14-hour maximum.
Ad Hoc Request Process Flow
Research
Team researches the request.
Report Distribution
Team e-mails the completed report to the requestor.
* Service #2 (Standard Information Downloads) reflects routinemetrics reporting mechanisms offered to the line in manymember organizations and is not a major focus of interest here.
4
5
Source: Corporate Leadership Council illustrativebased on information provided by theNationwide Building Society.
Because the team does not operate on a chargebackbasis, this step is important to ensure that it expends itsresources in a value-added fashion. On average, the teameliminates 50 out of a total of 150 requests per month.
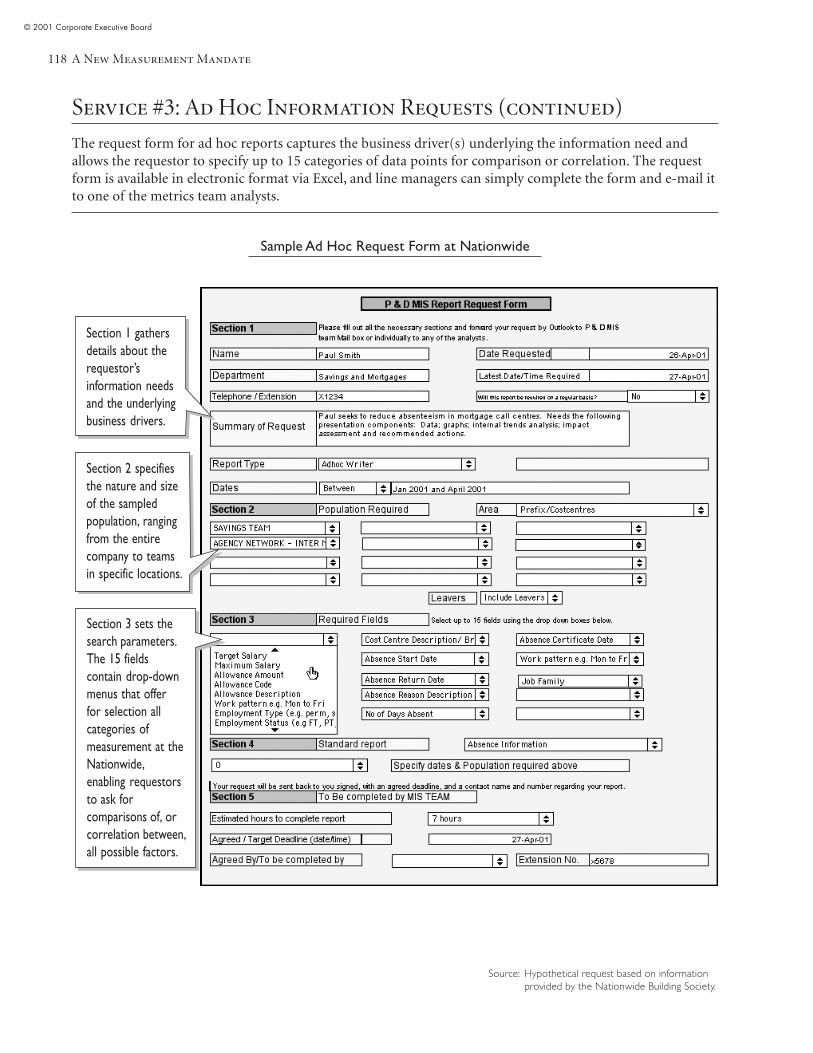
A New Measurement Mandate
© 2001 Corporate Executive Board
118
Service #3: Ad Hoc Information Requests (continued)
The request form for ad hoc reports captures the business driver(s) underlying the information need andallows the requestor to specify up to 15 categories of data points for comparison or correlation. The requestform is available in electronic format via Excel, and line managers can simply complete the form and e-mail itto one of the metrics team analysts.
Sample Ad Hoc Request Form at Nationwide
Source: Hypothetical request based on informationprovided by the Nationwide Building Society.
Section 3 sets thesearch parameters.The 15 fieldscontain drop-downmenus that offerfor selection allcategories ofmeasurement at theNationwide,enabling requestorsto ask forcomparisons of, orcorrelation between,all possible factors.
Section 2 specifiesthe nature and sizeof the sampledpopulation, rangingfrom the entirecompany to teamsin specific locations.
Section 1 gathersdetails about therequestor’sinformation needsand the underlyingbusiness drivers.
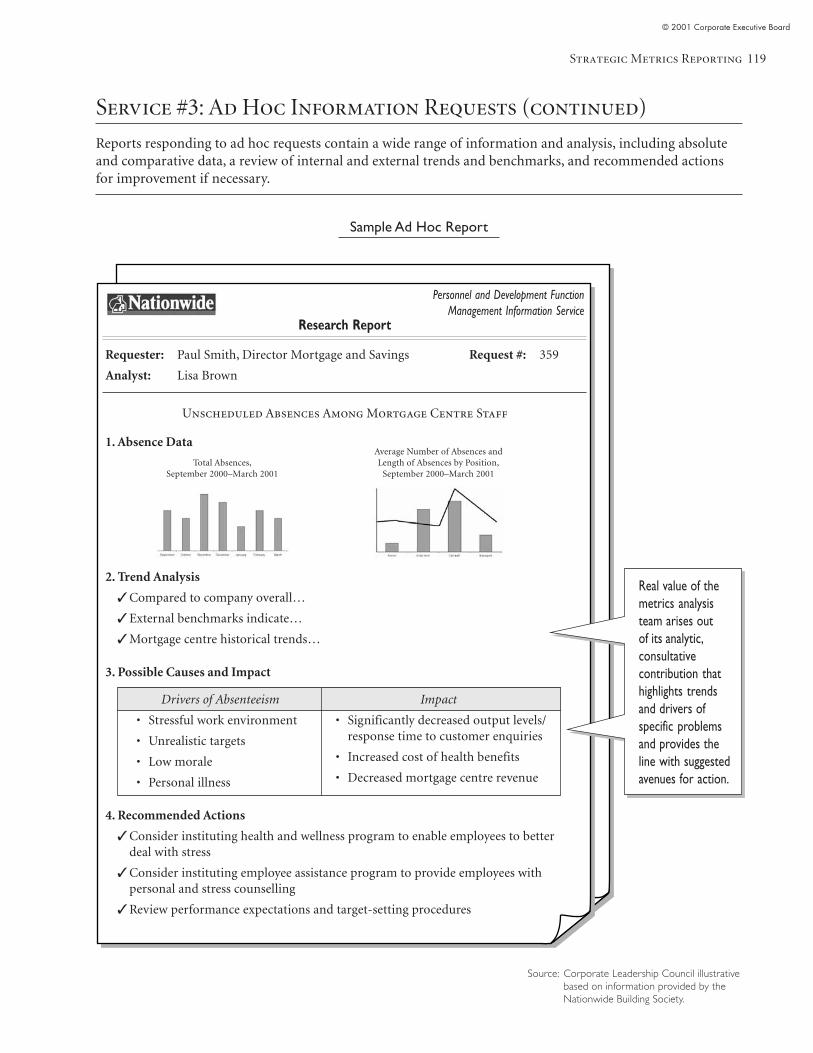
Strategic Metrics Reporting
© 2001 Corporate Executive Board
119
Service #3: Ad Hoc Information Requests (continued)
Reports responding to ad hoc requests contain a wide range of information and analysis, including absoluteand comparative data, a review of internal and external trends and benchmarks, and recommended actionsfor improvement if necessary.
Sample Ad Hoc Report
Source: Corporate Leadership Council illustrativebased on information provided by theNationwide Building Society.
Requester: Paul Smith, Director Mortgage and Savings
Analyst: Lisa Brown
Research Report
Request #: 359
Unscheduled Absences Among Mortgage Centre Staff
Personnel and Development FunctionManagement Information Service
1. Absence Data
2. Trend Analysis
✓ Compared to company overall…
✓ External benchmarks indicate…
✓ Mortgage centre historical trends…
3. Possible Causes and Impact
4. Recommended Actions
✓ Consider instituting health and wellness program to enable employees to betterdeal with stress
✓ Consider instituting employee assistance program to provide employees withpersonal and stress counselling
✓ Review performance expectations and target-setting procedures
Drivers of Absenteeism
• Stressful work environment
• Unrealistic targets
• Low morale
• Personal illness
Impact
• Significantly decreased output levels/response time to customer enquiries
• Increased cost of health benefits
• Decreased mortgage centre revenue
Total Absences,September 2000–March 2001
Average Number of Absences andLength of Absences by Position,
September 2000–March 2001
Real value of themetrics analysisteam arises outof its analytic,consultativecontribution thathighlights trendsand drivers ofspecific problemsand provides theline with suggestedavenues for action.
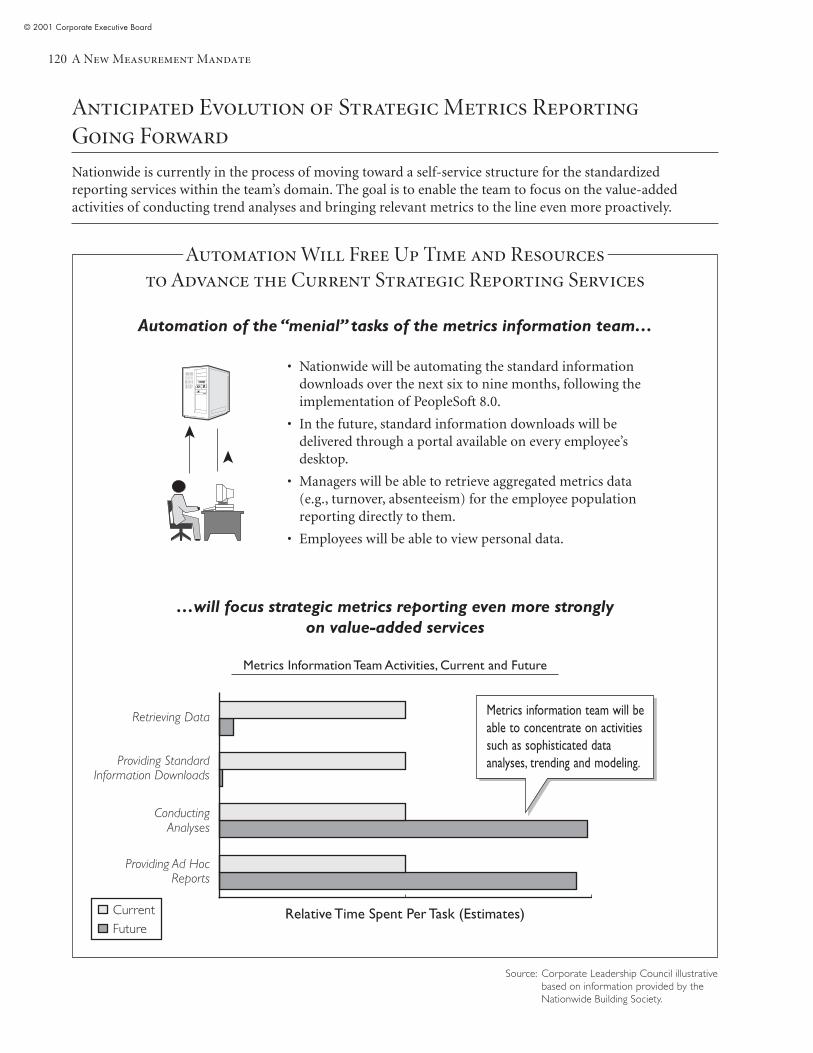
A New Measurement Mandate
© 2001 Corporate Executive Board
120
Anticipated Evolution of Strategic Metrics ReportingGoing Forward
Nationwide is currently in the process of moving toward a self-service structure for the standardizedreporting services within the team’s domain. The goal is to enable the team to focus on the value-addedactivities of conducting trend analyses and bringing relevant metrics to the line even more proactively.
Automation Will Free Up Time and Resourcesto Advance the Current Strategic Reporting Services
Automation of the “menial” tasks of the metrics information team…
…will focus strategic metrics reporting even more stronglyon value-added services
Metrics Information Team Activities, Current and Future
Source: Corporate Leadership Council illustrativebased on information provided by theNationwide Building Society.
Retrieving Data
Providing StandardInformation Downloads
ConductingAnalyses
Providing Ad HocReports
Relative Time Spent Per Task (Estimates)CurrentFuture
Metrics information team will beable to concentrate on activitiessuch as sophisticated dataanalyses, trending and modeling.
• Nationwide will be automating the standard informationdownloads over the next six to nine months, following theimplementation of PeopleSoft 8.0.
• In the future, standard information downloads will bedelivered through a portal available on every employee’sdesktop.
• Managers will be able to retrieve aggregated metrics data(e.g., turnover, absenteeism) for the employee populationreporting directly to them.
• Employees will be able to view personal data.
➤
➤
Strategic Metrics Reporting
© 2001 Corporate Executive Board
121
Council Assessment:Strategic Metrics Reporting
Key Differentiating Features
• The approach differs from standard practice in the amount of analysis and contextualinformation that accompany the pure metrics data. Taking a consultative role,the team proactively identifies trends and offers astute assessments of their impacton the organization.
• The second differentiating feature is the provision of an internal research service wherebythe team combines end-to-end production of corporate-wide metrics reports with theprocessing of ad hoc requests for specific metrics needed by the line.
Caveat
• The introduction of a metrics analysis team may be most viable in large organizationswhere the volume of demand for ad hoc customized metrics information is large enough towarrant the expense associated with maintaining a dedicated staff.
Implementation Tips
• The Council suggests that posting all standard and ad hoc reports on the corporate intranetgreatly expedites information sharing and may enable other business units to proactivelyidentify problems that otherwise would have taken longer to recognize.
• The Council recommends tracking the nature of ad hoc requests received by the metricsanalysis team. Monitoring the requests may enable the organization to pinpoint emergingor unsuspected areas of concern in the business and may enable the team to beginproviding proactive (as opposed to reactive) ad hoc reports.

A New Measurement Mandate
© 2001 Corporate Executive Board
122
© 2001 Corporate Executive Board
123
Metrics Showcase

A New Measurement Mandate
© 2001 Corporate Executive Board
124
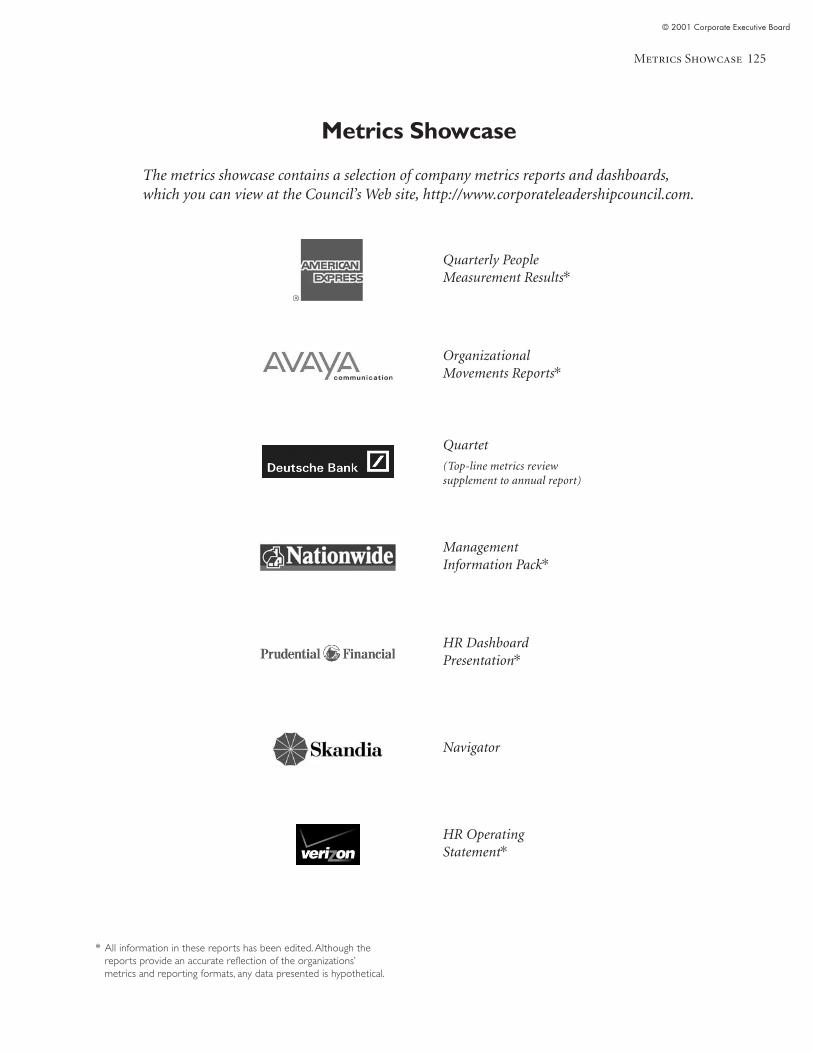
Metrics Showcase
© 2001 Corporate Executive Board
125
Metrics Showcase
The metrics showcase contains a selection of company metrics reports and dashboards,which you can view at the Council’s Web site, http://www.corporateleadershipcouncil.com.
* All information in these reports has been edited. Although thereports provide an accurate reflection of the organizations’metrics and reporting formats, any data presented is hypothetical.
Quarterly PeopleMeasurement Results*
OrganizationalMovements Reports*
Quartet
(Top-line metrics reviewsupplement to annual report)
ManagementInformation Pack*
HR DashboardPresentation*
Navigator
HR OperatingStatement*

A New Measurement Mandate
© 2001 Corporate Executive Board
126
Study Requested Quantity
A New Measurement Mandate:Leveraging HR and Organizational Metricsto Enhance Corporate PerformanceCatalog no.: CLC13HJ7P ________
Name & Title _______________________________________
Institution _______________________________________
Address _______________________________________
_______________________________________
_______________________________________
Telephone ___________________________________________
FAX TO
Corporate Leadership Council202-777-5822
ORDER FORM
The study titled A New Measurement Mandate: Leveraging HR and Organizational Metrics to EnhanceCorporate Performance is intended for broad dissemination among senior executives and management.Members are welcome to unlimited copies without charge. Online ordering is available athttp:// www.corporateleadershipcouncil.com. Alternatively, you can call the Publications Department at202-777-5921, e-mail your order to [email protected] or fax in the order form on this page.
Additionally, members interested in reviewing any of the Council’s past strategic research are encouraged torequest a listing of completed work.
Corporate Leadership Council
You may order an unlimitednumber of copies withoutadditional charge.
Corporate Leadership Council2000 Pennsylvania Avenue NW
Washington, DC 20006Telephone: 202-777-5000
www.corporateleadershipcouncil.com

A New Measurement Mandate
© 2001 Corporate Executive Board
128