Embed Size (px)
Citation preview
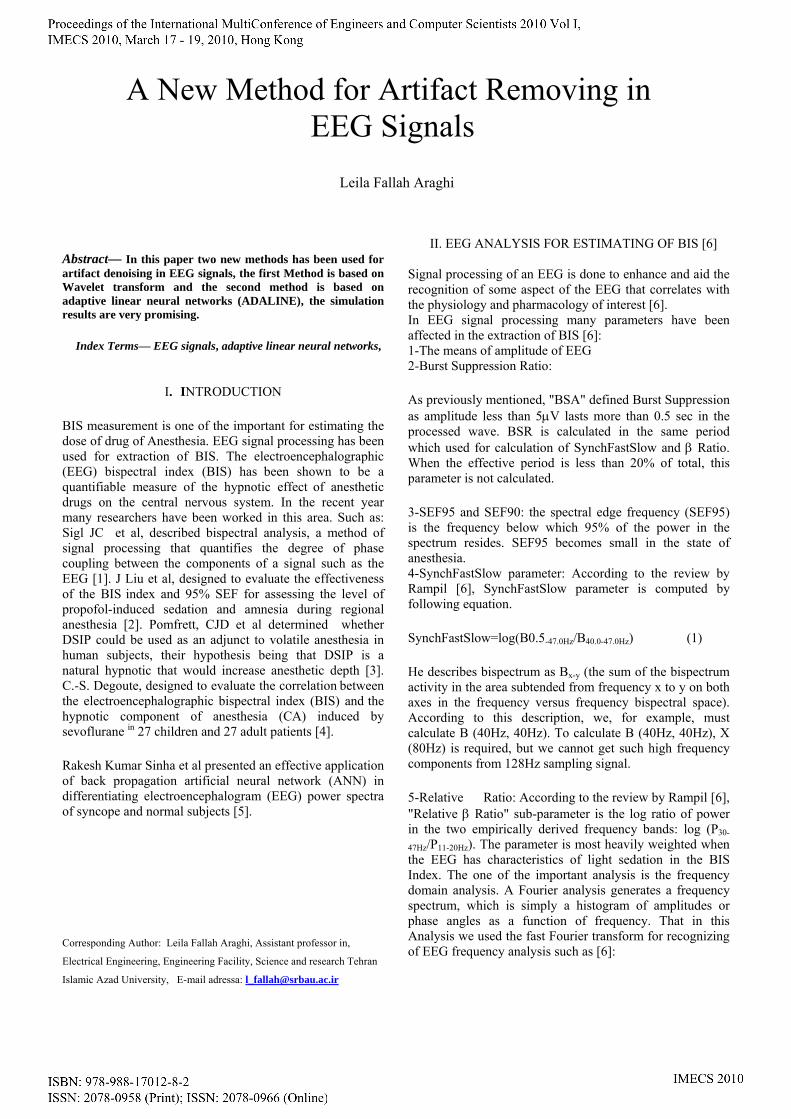
Abstract— In this paper two new methods has been used for artifact denoising in EEG signals, the first Method is based on Wavelet transform and the second method is based on adaptive linear neural networks (ADALINE), the simulation results are very promising.
Index Terms— EEG signals, adaptive linear neural networks,
I. INTRODUCTION
BIS measurement is one of the important for estimating the dose of drug of Anesthesia. EEG signal processing has been used for extraction of BIS. The electroencephalographic (EEG) bispectral index (BIS) has been shown to be a quantifiable measure of the hypnotic effect of anesthetic drugs on the central nervous system. In the recent year many researchers have been worked in this area. Such as: Sigl JC et al, described bispectral analysis, a method of signal processing that quantifies the degree of phase coupling between the components of a signal such as the EEG [1]. J Liu et al, designed to evaluate the effectiveness of the BIS index and 95% SEF for assessing the level of propofol-induced sedation and amnesia during regional anesthesia [2]. Pomfrett, CJD et al determined whether DSIP could be used as an adjunct to volatile anesthesia in human subjects, their hypothesis being that DSIP is a natural hypnotic that would increase anesthetic depth [3]. C.-S. Degoute, designed to evaluate the correlation between the electroencephalographic bispectral index (BIS) and the hypnotic component of anesthesia (CA) induced by sevoflurane in 27 children and 27 adult patients [4].
Rakesh Kumar Sinha et al presented an effective application of back propagation artificial neural network (ANN) in differentiating electroencephalogram (EEG) power spectra of syncope and normal subjects [5].
Corresponding Author: Leila Fallah Araghi, Assistant professor in,
Electrical Engineering, Engineering Facility, Science and research Tehran
Islamic Azad University, E-mail adressa: [email protected]
II. EEG ANALYSIS FOR ESTIMATING OF BIS [6]
Signal processing of an EEG is done to enhance and aid the recognition of some aspect of the EEG that correlates with the physiology and pharmacology of interest [6]. In EEG signal processing many parameters have been affected in the extraction of BIS [6]: 1-The means of amplitude of EEG 2-Burst Suppression Ratio:
As previously mentioned, "BSA" defined Burst Suppression as amplitude less than 5μV lasts more than 0.5 sec in the processed wave. BSR is calculated in the same period which used for calculation of SynchFastSlow and β Ratio. When the effective period is less than 20% of total, this parameter is not calculated.
3-SEF95 and SEF90: the spectral edge frequency (SEF95) is the frequency below which 95% of the power in the spectrum resides. SEF95 becomes small in the state of anesthesia. 4-SynchFastSlow parameter: According to the review by Rampil [6], SynchFastSlow parameter is computed by following equation.
SynchFastSlow=log(B0.5-47.0Hz/B40.0-47.0Hz) (1)
He describes bispectrum as Bx-y (the sum of the bispectrum activity in the area subtended from frequency x to y on both axes in the frequency versus frequency bispectral space). According to this description, we, for example, must calculate B (40Hz, 40Hz). To calculate B (40Hz, 40Hz), X (80Hz) is required, but we cannot get such high frequency components from 128Hz sampling signal.
5-Relative Ratio: According to the review by Rampil [6], "Relative β Ratio" sub-parameter is the log ratio of power in the two empirically derived frequency bands: log (P30-
47Hz/P11-20Hz). The parameter is most heavily weighted when the EEG has characteristics of light sedation in the BIS Index. The one of the important analysis is the frequency domain analysis. A Fourier analysis generates a frequency spectrum, which is simply a histogram of amplitudes or phase angles as a function of frequency. That in this Analysis we used the fast Fourier transform for recognizing of EEG frequency analysis such as [6]:
Leila Fallah Araghi
A New Method for Artifact Removing in EEG Signals
1-SEF90
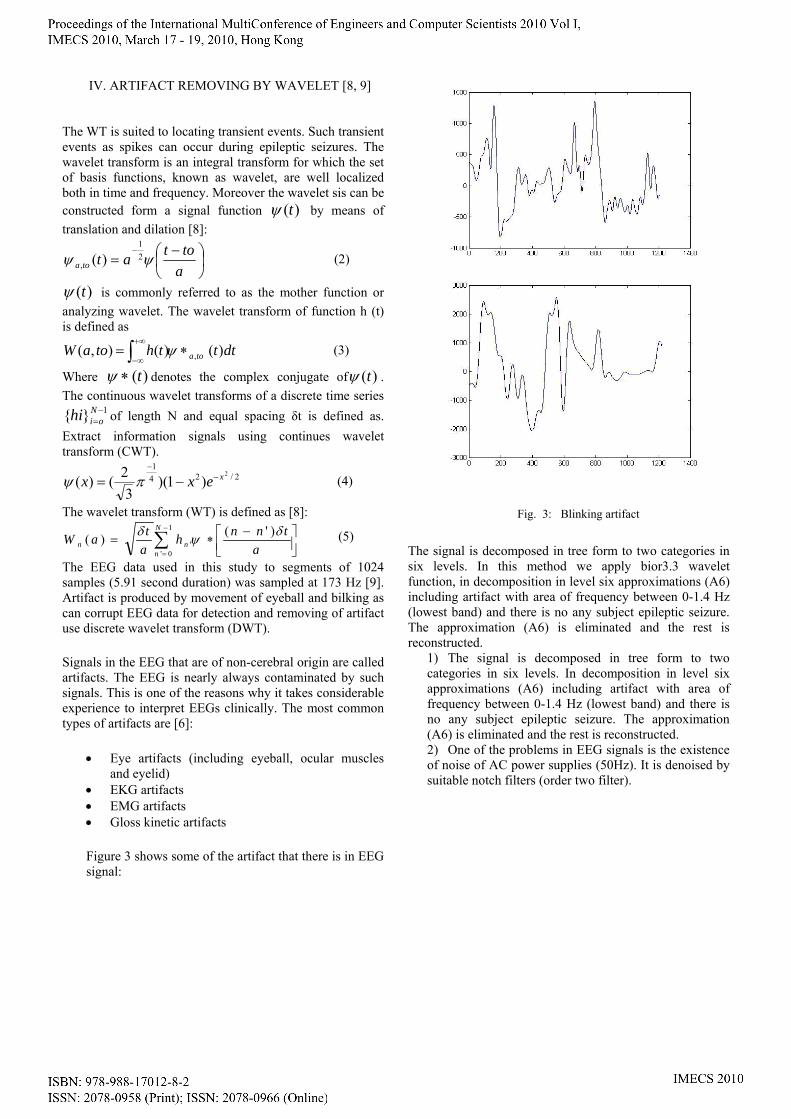
2-the range of frequency: alpha, beta, delta and theta.
Delta is the frequency range up to 4 Hz and is often associated with the very young and certain encephalopathy's and underlying lesions. Theta is the frequency range from 4 Hz to 8 Hz and is associated with drowsiness, childhood, adolescence and young adulthood. Alpha (Berger's wave) is the frequency range from 8 Hz to 12 Hz. It is characteristic of a relaxed, alert state of consciousness. Alpha rhythms are best detected with the eyes closed. Alpha attenuates with drowsiness and open eyes, and is best seen over the occipital (visual) cortex. Beta is the frequency range above 12 Hz. Low amplitude beta with multiple and varying frequencies is often associated with active, busy or anxious thinking and active concentration. Gamma is the frequency range approximately 26–100 Hz. Gamma rhythms appear to be involved in higher mental activity, including perception, problem solving, fear, and consciousness.
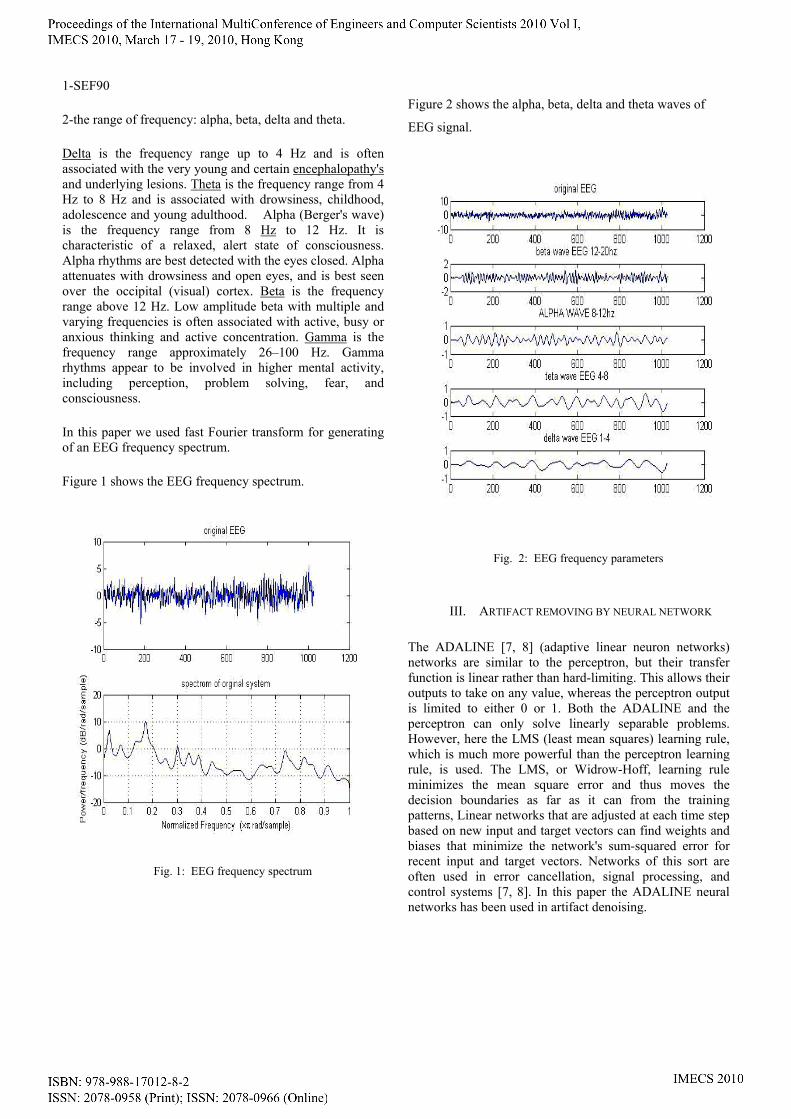
In this paper we used fast Fourier transform for generating of an EEG frequency spectrum.
Figure 1 shows the EEG frequency spectrum.
Fig. 1: EEG frequency spectrum
Figure 2 shows the alpha, beta, delta and theta waves of
EEG signal.
Fig. 2: EEG frequency parameters
III. ARTIFACT REMOVING BY NEURAL NETWORK The ADALINE [7, 8] (adaptive linear neuron networks) networks are similar to the perceptron, but their transfer function is linear rather than hard-limiting. This allows their outputs to take on any value, whereas the perceptron output is limited to either 0 or 1. Both the ADALINE and the perceptron can only solve linearly separable problems. However, here the LMS (least mean squares) learning rule, which is much more powerful than the perceptron learning rule, is used. The LMS, or Widrow-Hoff, learning rule minimizes the mean square error and thus moves the decision boundaries as far as it can from the training patterns, Linear networks that are adjusted at each time step based on new input and target vectors can find weights and biases that minimize the network's sum-squared error for recent input and target vectors. Networks of this sort are often used in error cancellation, signal processing, and control systems [7, 8]. In this paper the ADALINE neural networks has been used in artifact denoising.
IV. ARTIFACT REMOVING BY WAVELET [8, 9]
The WT is suited to locating transient events. Such transient events as spikes can occur during epileptic seizures. The wavelet transform is an integral transform for which the set of basis functions, known as wavelet, are well localized both in time and frequency. Moreover the wavelet sis can be constructed form a signal function )(tψ by means of translation and dilation [8]:
⎟⎠⎞
⎜⎝⎛ −
=−
atotattoa ψψ 2
1
, )( (2)
)(tψ is commonly referred to as the mother function or analyzing wavelet. The wavelet transform of function h (t) is defined as
dttthtoaW toa )()(),( ,∗= ∫+∞
∞−ψ (3)
Where )(t∗ψ denotes the complex conjugate of )(tψ . The continuous wavelet transforms of a discrete time series
1}{ −=
Noihi of length N and equal spacing δt is defined as.
Extract information signals using continues wavelet transform (CWT).
2/241
2
)1)(3
2()( xexx −−
−= πψ (4)
The wavelet transform (WT) is defined as [8]:
⎥⎦⎤
⎢⎣⎡ −
∗= ∑−
= atnnh
ataW
N
nnn
δψδ )'()(1
0''
(5)
The EEG data used in this study to segments of 1024 samples (5.91 second duration) was sampled at 173 Hz [9]. Artifact is produced by movement of eyeball and bilking as can corrupt EEG data for detection and removing of artifact use discrete wavelet transform (DWT).
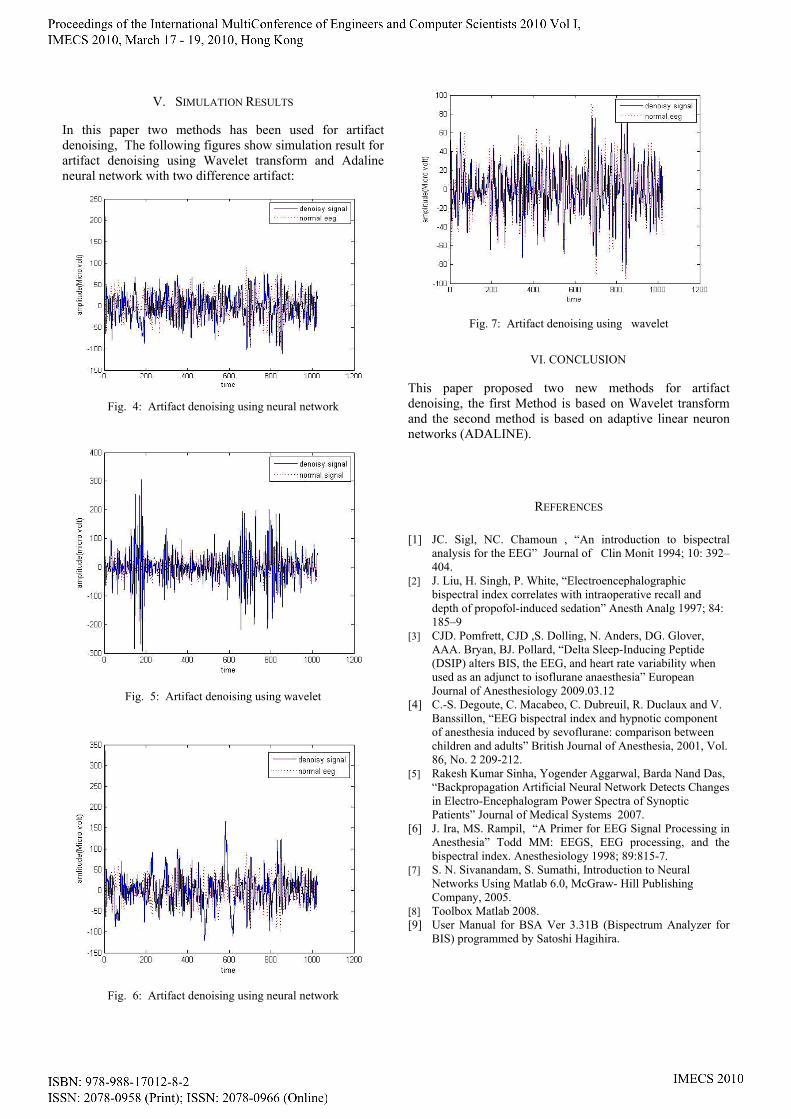
Signals in the EEG that are of non-cerebral origin are called artifacts. The EEG is nearly always contaminated by such signals. This is one of the reasons why it takes considerable experience to interpret EEGs clinically. The most common types of artifacts are [6]:
• Eye artifacts (including eyeball, ocular muscles and eyelid)
• EKG artifacts • EMG artifacts • Gloss kinetic artifacts
Figure 3 shows some of the artifact that there is in EEG signal:
Fig. 3: Blinking artifact
The signal is decomposed in tree form to two categories in six levels. In this method we apply bior3.3 wavelet function, in decomposition in level six approximations (A6) including artifact with area of frequency between 0-1.4 Hz (lowest band) and there is no any subject epileptic seizure. The approximation (A6) is eliminated and the rest is reconstructed.
1) The signal is decomposed in tree form to two categories in six levels. In decomposition in level six approximations (A6) including artifact with area of frequency between 0-1.4 Hz (lowest band) and there is no any subject epileptic seizure. The approximation (A6) is eliminated and the rest is reconstructed. 2) One of the problems in EEG signals is the existence of noise of AC power supplies (50Hz). It is denoised by suitable notch filters (order two filter).
V. SIMULATION RESULTS
In this paper two methods has been used for artifact denoising, The following figures show simulation result for artifact denoising using Wavelet transform and Adaline neural network with two difference artifact:
Fig. 4: Artifact denoising using neural network
Fig. 5: Artifact denoising using wavelet
Fig. 6: Artifact denoising using neural network
Fig. 7: Artifact denoising using wavelet
VI. CONCLUSION
This paper proposed two new methods for artifact denoising, the first Method is based on Wavelet transform and the second method is based on adaptive linear neuron networks (ADALINE).
REFERENCES
[1] JC. Sigl, NC. Chamoun , “An introduction to bispectral analysis for the EEG” Journal of Clin Monit 1994; 10: 392–404.
[2] J. Liu, H. Singh, P. White, “Electroencephalographic bispectral index correlates with intraoperative recall and depth of propofol-induced sedation” Anesth Analg 1997; 84: 185–9
[3] CJD. Pomfrett, CJD ,S. Dolling, N. Anders, DG. Glover, AAA. Bryan, BJ. Pollard, “Delta Sleep-Inducing Peptide (DSIP) alters BIS, the EEG, and heart rate variability when used as an adjunct to isoflurane anaesthesia” European Journal of Anesthesiology 2009.03.12
[4] C.-S. Degoute, C. Macabeo, C. Dubreuil, R. Duclaux and V. Banssillon, “EEG bispectral index and hypnotic component of anesthesia induced by sevoflurane: comparison between children and adults” British Journal of Anesthesia, 2001, Vol. 86, No. 2 209-212.
[5] Rakesh Kumar Sinha, Yogender Aggarwal, Barda Nand Das, “Backpropagation Artificial Neural Network Detects Changes in Electro-Encephalogram Power Spectra of Synoptic Patients” Journal of Medical Systems 2007.
[6] J. Ira, MS. Rampil, “A Primer for EEG Signal Processing in Anesthesia” Todd MM: EEGS, EEG processing, and the bispectral index. Anesthesiology 1998; 89:815-7.
[7] S. N. Sivanandam, S. Sumathi, Introduction to Neural Networks Using Matlab 6.0, McGraw- Hill Publishing Company, 2005.
[8] Toolbox Matlab 2008. [9] User Manual for BSA Ver 3.31B (Bispectrum Analyzer for
BIS) programmed by Satoshi Hagihira.


![· [30]C. Teng, Y. Zhang, and G. Wang, The Removal of EMG Artifact from EEG Signals by the Multivariate Empirical Mode Decomposition, SignalProcessing, Communications and …](https://img.pdfslide.net/doc/110x75/5e157609485ee60370306e4f/30c-teng-y-zhang-and-g-wang-the-removal-of-emg-artifact-from-eeg-signals.jpg)