Embed Size (px)
Citation preview

A new methodology for allocating road space for public transport priority
G. Currie, M. Sarvi & W. Young Institute of Transport Studies, Department of Civil Engineering, Monash University, Melbourne, Australia
Abstract
Transport planners are continually seeking ways in which to balance the conflicting needs for limited road space. There is a trend towards the reallocation of road space to on-road public transport due to its effectiveness in people movement and wider environmental benefits. However, reallocating road space can be a delicate task since it is often at the times of highest demand that space must be taken away from one mode to benefit another. Traditional warrants for provision of facilities such as bus lanes only consider the relative people moving abilities of alternative modes. Yet in practice the benefits of improved reliability and the wider environmental benefits of road space allocation schemes are not a part of traditional approaches to determine if road space reallocation is appropriate. This paper describes a new method for assessing the impact of reallocating road space to public transport. The approach is developed as part of a research project being undertaken in Melbourne, Australia for the local roads management authority, VicRoads. The paper includes a review of previous approaches in this area and identifies a new methodology which evaluates a full range of benefits and costs of public transport priority schemes in order to identify appropriate road space reallocation. The paper reports on recent findings in the application of this approach and how revised warrants, using a more comprehensive approach to valuing the full benefits and costs of priority schemes for reallocation of road space in relation to bus lanes, would look. Keywords: public transport priority, bus priority, road space allocation, road space management, traffic planning, travel reliability.
Urban Transport X, C. A. Brebbia & L. C. Wadhwa (Editors)© 2004 WIT Press, www.witpress.com, ISBN 1-85312-716-7

1 Introduction
This paper presents the development of new methodology for determining the most appropriate allocation of road space in relation to public transport priority initiatives. The approach is developed as part of a research project being undertaken in Melbourne, Australia for the local roads management authority, VicRoads. The paper focuses on a particular part of the project, the allocation of an existing traffic lane for dedicated use by public transport vehicles.
The paper includes a review of previous approaches to this issue, an outline of the proposed methodology, a review of its application to bus lanes and presents a set of conclusions on the analysis.
2 Previous approaches
A range of techniques has been used to determine warrants for bus lanes. Vuchic [1] suggested the basic factor to be considered is the number of persons being carried by transit vehicles compared to those using cars. He suggest a warrant for the volume of transit vehicles, in this case buses, required to justify an exclusive lane as follows:
xNqq A
B 1−≥ (1)
where qB and qA
are the hourly volume of buses and cars respectively, N is the total number of lanes and x is the ratio of average auto to bus occupancies. In effect this warrant states that if a lane was dedicated to buses and those buses carry as many passengers as car traffic in any of the remaining lanes, then the bus lane is warranted. Vuchic [1] suggests that this is a conservative warrant. He suggests that the bus lane may cause diversion of passengers from car to bus and that this should also be considered in the evaluation. He also suggests there are wider benefits with bus use over auto travel and that these should also be included in any evaluation. However no methods for measuring these factors are identified.
The relative person travel time trade offs of bus priority schemes were the basis for road space allocation decisions in a paper by Black et al [2] building on an approach developed by Sparks and May [3]. Black et al [2] use a traffic flow impact model to determine optimum road space allocations, which minimize total travel time for all road users on major traffic corridors. No warrants were explicitly produced from this analysis, which was mainly aimed at evaluating specific projects.
A similar approach developed by Jepson and Ferreira [4] uses a semi-dynamic traffic flow models (using SIDRA and TRANSYT) to assess the impacts of such treatments as active traffic light priority using this approach. A dynamic traffic flow simulation model was also used by Radwan and Benevelli [5]. They used NETSIM to compare the costs and benefits of bus traffic signal preemption systems on traffic flow. A cost benefit approach was adopted
Urban Transport X, C. A. Brebbia & L. C. Wadhwa (Editors)© 2004 WIT Press, www.witpress.com, ISBN 1-85312-716-7
376 Urban Transport X

including the total travel time impacts of bus priority treatments. Resource costs were incorporated in terms of fuel cost impacts. Their evaluation was one of the few methods to include the capital and maintenance costs of bus priority systems as part of the evaluation. They also assessed the impacts of bus priority systems on environmental emissions like carbon monoxide, hydrocarbon and nitrogen oxide emission levels. These were not valued as part of the assessment rather emission rates were monitored outside of the quantitative evaluation.
Oldfield et al [6] applied a theoretical traffic flow model to a road network to examine the economic justification of bus lanes. Their approach included: • the relative travel time impacts on bus and general traffic vehicles including
i) benefits to bus passengers, ii) disbenefits to traffic in non priority lanes, iii) extra travel time for vehicles which divert to alternative routes and iv) extra delays to traffic on roads where traffic is diverted to
• the resource cost savings in terms of changes in vehicle operating costs A similar approach was adopted by Delgoffe [7] and was reported in
Levinson et al [8]. Their work examined the relative degree of saturation of traffic flows and identified that there were substantial benefits for bus lanes particularly in high saturation traffic flows.
Oldfield et al [5] noted that no consideration was given to impacts on service reliability, although this was considered to be a benefit of bus priority schemes.
Table 1: Bus priority scheme appraisal basis.
Research Reference Criteria/ Approach for Scheme Assessment/ Warrant Determination [1] [2] [4] [5] [6] [7] [9] Relative People carriage per lane ✔ - - - - - -
Travel Time Impact ✘ ✔ ✔ ✔ ✔ ✔ ✔
Resource Impact Fuel Costs ✘ ✘ ✘ ✔ ✔ ✔ ✔
Capital Costs ✘ ✘ ✘ ✔ ✘ ✘ ✔ Maintenance Costs ✘ ✘ ✘ ✔ ✘ ✘ ✔
Transit Fleet and Crew Costs ✘ ✘ ✘ ✘ ✘ ✘ ✔ Construction Impacts ✘ ✘ ✘ ✘ ✘ ✘ ✔
Accident Cost Impacts ✘ ✘ ✘ ✘ ✘ ✘ ✔ Environmental Impacts ✘ ✘ ✘ (a) ✘ ✘ (a)
Reliability Impacts ✘ ✘ ✘ ✘ ✘ ✘ ✔ Mode Shift/ Patronage Growth ✘ ✘ ✘ ✘ ✘ ✘ ✔ Route Diversion Considered ✘ ✘ ✘ ✘ ✔ ✔ ✔ Dynamic Traffic Modelling Used ✘ ✘ ✔ ✔ ✘ ✘ -
Note: (a) Environmental impacts considered but not part of the quantitative evaluation.
Urban Transport X, C. A. Brebbia & L. C. Wadhwa (Editors)© 2004 WIT Press, www.witpress.com, ISBN 1-85312-716-7
Urban Transport X 377

A much wider range of criteria for the assessment of bus priority initiatives is outlined by the Department of Environment Transport and the Regions (DOTR-UK) [9]. In addition to all of the measures identified above they suggest that the patronage attracting ability of the priority scheme should be considered in addition to travel time impacts. Traffic accident costs and even delays during construction are also a part of the appraisal. They also suggest that air and noise quality initiatives be considered however, the assessment of these factors again remain outside the quantitative economic evaluation of the schemes (much as in Radwan and Benevelli [5]).
Another element proposed as part of bus priority scheme appraisal is the assessment of improved reliability impacts on bus services. “Improved reliability is often seen as a major benefit of bus priority measures, and an invaluable factor in the attempt to persuade more people to switch from their cars” [9]. However this reference provides no basis for the valuation or measurement of reliability benefits and lacks detail concerning the approach to valuing other evaluation criteria.
In summary, Table 1 shows the major criteria used in the literature above. It suggests that, a wide range of criteria, are possible but only a limited number have been applied. The DOTR-UK [9] has the most comprehensive listing of criteria.
3 Proposed methodology
The proposed methodology expands the previous approaches and aims to identify where road space should be allocated for public transport priority treatments. It aims to be comprehensive in the inclusion of valid criteria for the assessment of the performance of public transport priority schemes and also to ensure impacts are considered for all road users. In summary the full set of benefits and costs of introducing priority measures are assessed and where net benefits are positive, they are considered warranted.
3.1 Modelling approach
A two tiered modeling approach is adopted including use of the Paramics [10] dynamic traffic flow micro-simulation model, to undertake the traffic impact assessment, and a spreadsheet based model to compute the economic appraisal of the schemes benefits and costs.
The dynamic traffic flow modeling enables the impacts of transit priority measures on traffic queues to be explored. It also models the variability of traffic flows over time and is hence a useful tool to approximate the impacts of priority measures on both bus and general traffic travel time reliability.
3.2 Evaluation criteria
Figure 1 shows the criteria used within the general framework of the evaluation model.
Urban Transport X, C. A. Brebbia & L. C. Wadhwa (Editors)© 2004 WIT Press, www.witpress.com, ISBN 1-85312-716-7
378 Urban Transport X

Figure 1: Evaluation model framework and evaluation criteria.
3.2.1 Travel time impacts Travel time impacts are measured for both public transport and auto travelers based on the in-vehicle travel times output from the micro-simulation model. They are valued using a value of travel time of $Aust 8.69 [11]
3.2.2 Reliability impacts Reliability impacts are measured in two ways: • Impacts on in-vehicle travel (IVT) time for auto and public transport users • Impacts on unexpected wait time (WT) at stops for transit users
In both cases it is the late aspect of unreliable service, which is measured as part of the evaluation. This is the element valued more highly in previous research [12]. Also early arrivals of transit vehicles should be avoided through route level management of vehicles at timing points.
For IVT time it is assumed that the average amount of late arrival time experienced on the road network approximated to the 50th percentile of the distribution of arrivals above the mean. Assuming a normal distribution of arrival times this equates to 0.68 of one standard deviation.
A similar approach and assumption are used for WT reliability. The average amount of late running is assumed to be 0.68 of the standard deviation of transit vehicle arrival times. However a range of evidence suggests that these delays should be weighted to reflect passenger perceptions of unexpected delays: • Ryan [13] suggested that unexpected delays affecting waiting time on
London Underground were valued at a factor of 3.0 above actual time. • Kjoerstad and Renolen [14] found passenger valuations of an unexpected
delay of 5 minutes which were equivalent to a factor of 4.8 times equivalent in-vehicle travel time for public transport in Norway
Transit User Impacts• Travel Time Impacts• Reliability Impacts
Road User Impacts• Travel Time Impacts• Reliability Impacts
Transit Operator Impacts• Fleet and Crew
Resource Impacts
Infrastructure Impacts• Capital costs of
priority measures• Operating costs of
priority measures
Mode Shift Impacts
DIRECT IMPACTS
SECONDARY IMPACTS
• New Transit UserTravel Time Benefits
• Road Congestion Impacts- Road User Travel Time
Reduction- Reduced operating costs- Reduced accident costs- Reduced environmental
emissions
• Farebox Revenue Growth Impacts
Urban Transport X, C. A. Brebbia & L. C. Wadhwa (Editors)© 2004 WIT Press, www.witpress.com, ISBN 1-85312-716-7
Urban Transport X 379

• Janssen [15] is quoted by Booz Allen [16] as finding values of delay time relative to scheduled times at a factor of 12.0 of equivalent IVT in Sweden, Based on the above evidence we have assumed that WT delays at transit
stops should be valued at a factor of 5.0 of the measured delay. No IVT reliability perceptual weighting is applied due to lack of good secondary information to support any weighting.
3.2.3 Transit operator impacts Operator impacts are measured in terms of fleet and crew resources and associated operating costs for these resources. A simple route resource costing formulae is used to establish fleet and crew requirements:
HeadwayimeRoundTripTesPeakVehcil = (2)
Round trip time includes adjustments for the impacts of average speeds as a
result of transit priority measures. The result is an estimate of peak operating vehicle (and crew) impacts of priority measures. Fractions of vehicles are accepted since these may be used to make savings over the whole network. Unit costs are applied to value any changes in operating resources. For bus a value of $Aust 51,906p.a. per vehicle applies, based on costing of local services [11].
3.2.4 Infrastructure Impacts The capital and operating costs of any new transit priority infrastructure are estimated and included in the assessment.
3.2.5 Secondary or Mode Shift Impacts A simple weighted total generalized cost model is used to forecast any changes in demand for public transport and how this may impact on road congestion and farebox revenues. The model takes the form:
PTPTPT ityTGCElasticChangeTGCndChangeDema ×= (3) where PT = Public Transport
TGC = Total Generalised Cost TGCElasticity = 1.0 Peak and 1.5 Off Peak
The total generalised cost (TGC) of public transport travel is calculated
using the following formulae:
FareVOTUXIVTUXIVTIVTIVTUXWaitUXWaittime
WaitWaittimewalkwalktimeTGC
WTwtwt
wtwt
++++
+=
*))*()*()*(
)*()*(( (4)
Walktime = Time in minutes walking to and from the transit service Walkwt = Weighting of walk time to and from transit stops
Urban Transport X, C. A. Brebbia & L. C. Wadhwa (Editors)© 2004 WIT Press, www.witpress.com, ISBN 1-85312-716-7
380 Urban Transport X

Waittime = Time waiting for bus to arrive at the bus stop if it is on scheduled time
Waitwt = Weighting of wait time at transit stops UXWaittime = Time waiting for a bus delayed due to unreliable running UXWaitwt = Weighting of unexpected wait time at transit stops due to
unreliability IVT = Expected time travelling in the transit vehicle IVTwt = Weighting of in vehicle travel time in transit vehicles UXIVT = The time spent in the vehicle when the bus is delayed due to
unreliability UXIVTwt = Weighting of unexpected IVT (valued at 1.0 - see text) VOT = Value of Travel Time Fare = Average Fare per Trip Table 2 shows the parameter values and assumptions used in formula (4).
Table 2: Transit demand model parameters.
Parameter Value Source/Basis Perceptual Parameter Weightings Walk time Weight 2.0 [16] Wait Time Weight 2.0 [16] Unexpected Wait Time Weight 5.0 [16] In Vehicle Travel Time Weight 1.0 [16] Parameter Values Walk Time 10m Assumption that 5 minutes access
and egress to stops Wait Time 0.5 Headway Based on service headway inputs Unexpected wait time 0.68 SD 50th percentile of standard
deviation of modelled running time (see text)
In Vehicle Time 19.4mins Based on typical average travel behaviour in Melbourne
Value of Time $8.69/Hour Based on standard values Fare $0.84 Based on bus boardings and
estimated bus revenue for 2002
The TGC model forecasts public transport demand impacts resulting from transit priority initiatives using formulae (3) and (4). These are used to identify a range of benefits as follows: • Transit User Benefits – Using the change in TGC (formula (4)) from the
base to the option or project situation • New Transit User Travel Time Benefits – The economic ‘rule of a half’ is
applied to estimate the scale of benefits to apply to new transit users. In effect the average benefit from existing transit users is halved and applied to any growth in demand in the transit system
• Farebox Revenue Growth – estimated by multiplying transit patronage by the average fare
Urban Transport X, C. A. Brebbia & L. C. Wadhwa (Editors)© 2004 WIT Press, www.witpress.com, ISBN 1-85312-716-7
Urban Transport X 381
In addition forecasts of transit patronage growth are used to estimate a range of road congestion relief benefits. These benefits include reductions in travel time as a result of fewer cars using the road because the drivers are using public transport. It also includes reduced levels of accidents, vehicle operating costs and also environmental emissions from reductions in car usage. The following formulae is used in this assessment:
fitUnitKmBeneTravelDistAvShareGrowthRCRB CDT *.*)*(= (5) RCRB = Road Congestion Relief Benefit GrowthT = Forecast growth in Transit (from Formula 3) ShareCD = Share of new transit users who previously drove a car Av.TravelDist = Average travel distance in kms UnitKMBenefit = per car vehicle km benefit representing the benefits of
reductions in road congestion, road accidents costs, vehicle operating costs and the value of reduced environmental noise and pollutant emission resulting from less car usage
The unit km benefit of road congestion relief is an important input to the
evaluation and is derived from experimental research of road traffic relief impacts in Melbourne [16, 17]. Table 3 shows the unit values applied for this assessment of secondary impacts.
Table 3: Unit values applied to estimate congestion relief benefits.
Externality Impacts Situation Value (Cents Aust./reduced
road vehicle km)
Source
Peak Heavy Congested Area
90
Peak Moderate Congested Area
60
Congestion Relief Benefits including : • road travel time benefits • reduced vehicle operating
costs • reduced road accident
benefits Peak Other/Off Peak
16
[17] [11]
Environmental Relief Benefits
All 2.4 [11]
3.2.6 Trip diversion impacts Any reductions in road space as a result of bus priority measures are likely to result in at least some trips diverting to alternative roads. Diversion will lessen the traffic impacts of any road capacity reduction. Three separate impacts occur: a. Diverting traffic will potentially have a longer journey (or disbenefit) b. Diverting traffic provides some relief to remaining traffic c. Traffic in alternate routes will disbenefit as a result of diverting traffic using
the alternate route.
Urban Transport X, C. A. Brebbia & L. C. Wadhwa (Editors)© 2004 WIT Press, www.witpress.com, ISBN 1-85312-716-7
382 Urban Transport X

The approach to this issue assumes that impacts b. and c. are relatively minor and to some extent counteract each other. Hence they are ignored. The value of factor a. cannot be zero otherwise no one would divert, they would remain on the existing roadway. However it cannot be higher than the value of disbenefits faced by other traffic using the road where transit priority initiatives have been implemented. If it were higher no traffic diversion would occur. The ‘rule of a half’ is adopted by assuming disbenefits to diverting traffic are half of those applying to traffic, which does not divert. This assumes ‘perfect information’ as the basis for making diversion decisions.
3.3 Evaluation approach
The evaluation is undertaken on an annual basis over a 30 years evaluation period. All costs and benefits are expanded from peak or off peak hours of modeling to represent equivalent annualized values. In this case expansion factors from peak hour to total weekday, week and then year are applied. The peak hour to annual value for example is 1,250 based on typical demand patterns in Melbourne.
4 Comparative methodology application
4.1 Case study setup
The methodology outlined above was applied to model the impacts of introducing a kerbside bus lane for the whole length of a two lane arterial road at varying bus headways. The key parameters of the application case study design are described in Table 4.
Table 4: Configuration of case study application – kerbside bus lane introduction.
Feature Parameter/Configuration Road Configuration • Main road (arterial) 2 by 2 lane
• Minor cross roads at 2 intersections one is 1 by 2 lanes the other 2 by 2 lanes
• Distance between intersections = 1,000m Intersection Signal Configuration
• Fixed 75% main road green time • Cycle Time = 1 Minute
Transit Service • Bus headway at 10, 20, 30 40 and 50/ hour • 30 second stop dwell time at departure side stops • Average bus occupancy = 50 passengers
Base Case • No Transit Priority Option Case • Full segregated bus lane with no setbacks Traffic Volume • Main road = 1,000 vehicles per hour Traffic Diversion • 10% of main road flow
Urban Transport X, C. A. Brebbia & L. C. Wadhwa (Editors)© 2004 WIT Press, www.witpress.com, ISBN 1-85312-716-7
Urban Transport X 383
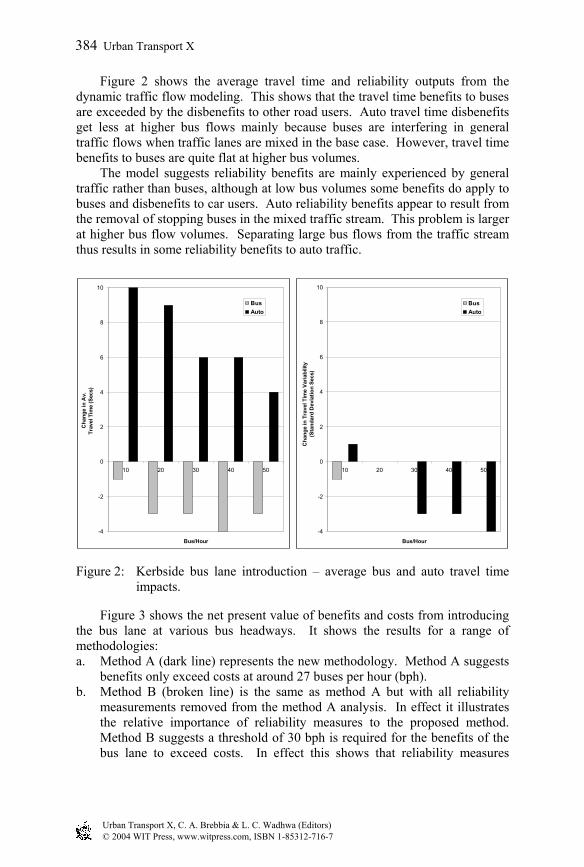
Figure 2 shows the average travel time and reliability outputs from the dynamic traffic flow modeling. This shows that the travel time benefits to buses are exceeded by the disbenefits to other road users. Auto travel time disbenefits get less at higher bus flows mainly because buses are interfering in general traffic flows when traffic lanes are mixed in the base case. However, travel time benefits to buses are quite flat at higher bus volumes.
The model suggests reliability benefits are mainly experienced by general traffic rather than buses, although at low bus volumes some benefits do apply to buses and disbenefits to car users. Auto reliability benefits appear to result from the removal of stopping buses in the mixed traffic stream. This problem is larger at higher bus flow volumes. Separating large bus flows from the traffic stream thus results in some reliability benefits to auto traffic.
Figure 2: Kerbside bus lane introduction – average bus and auto travel time impacts.
Figure 3 shows the net present value of benefits and costs from introducing the bus lane at various bus headways. It shows the results for a range of methodologies: a. Method A (dark line) represents the new methodology. Method A suggests
benefits only exceed costs at around 27 buses per hour (bph). b. Method B (broken line) is the same as method A but with all reliability
measurements removed from the method A analysis. In effect it illustrates the relative importance of reliability measures to the proposed method. Method B suggests a threshold of 30 bph is required for the benefits of the bus lane to exceed costs. In effect this shows that reliability measures
-4
-2
0
2
4
6
8
10
10 20 30 40 50
Bus/Hour
Cha
nge
in A
v. T
rave
l Tim
e (S
ecs)
BusAuto
-4
-2
0
2
4
6
8
10
10 20 30 40 50
Bus/Hour
Cha
nge
in T
rave
l Tim
e Va
riabi
lity
(Sta
ndar
d D
evia
tion
Secs
)BusAuto
Urban Transport X, C. A. Brebbia & L. C. Wadhwa (Editors)© 2004 WIT Press, www.witpress.com, ISBN 1-85312-716-7
384 Urban Transport X

would reduce the viability thresholds of bus lanes by about 10% of bus flows.
c. Method C (dotted line) shows the results of a more traditional evaluation method based only on the relative travel time trade offs resulting from the bus lane. Here the viable threshold for introducing a bus lane is 36 bph, well above the thresholds suggested by the proposed methodology. Figure 3 also shows the threshold for viable bus lane introduction suggested
by Vuchic [1]. This is the vertical line suggesting a threshold of 24 bph. Interestingly the method A threshold is above that of the Vuchic method [1]. The analysis suggests the Vuchic approach would underestimate the net transport disbenefits, which would emerge. Figure 4 shows the net impact of operating a bus lane at 24 bph. using the proposed new method (method A).
Figure 3: Kerbside bus lane introduction – evaluation output using alternative assumptions. Note: Net Present Value is over 30 years at a discount rate of 6%
Figure 4 shows that the Vuchic method would underestimate net project impacts by some $Aust 155,000. The major project costs result from disbenefits to auto traffic of some $329,000. This represents an average impact of an additional 7 seconds on travel time and a further 1.5 seconds of late arrival time
-$600
-$500
-$400
-$300
-$200
-$100
$-
$100
$200
$300
$400
$500
- 5.0 10.0 15.0 20.0 25.0 30.0 35.0 40.0 45.0 50.0
Buses/Hour
Net
Pre
sent
Val
ue ($
Aus
t 000
)
Method A - ProposedMethod C - Time Time AloneMethod B - A - Reliability
Vuchic Threshold
Urban Transport X, C. A. Brebbia & L. C. Wadhwa (Editors)© 2004 WIT Press, www.witpress.com, ISBN 1-85312-716-7
Urban Transport X 385

due to increases in unreliable traffic flows. In addition there is $65,000 of project infrastructure costs.
These costs (Figure 4) are only partly outweighed by project benefits of which transit user travel time benefits are the largest. This represents an average 2.5-second reduction in in-vehicle travel time on transit vehicles. Externality benefits resulting from reduced car usage are the second largest project benefits. In this case around 1,370 less car trips are made annually. This reduces vehicle operating costs, accidents, congestion and environmental impacts valued at around $48,000. Project benefits also include transit operating cost savings and a small increase in farebox revenues.
Figure 4: Kerbside bus lane introduction at 24 bph – evaluation output using method A. Note: Net Present Value is over 30 years at a discount rate of 6%.
5 Conclusions
This paper has described a new methodology for allocating road space in relation to public transport priority initiatives with particular reference to bus lanes. Previous methodologies have been shown to be either limited in the range of road space impacts considered or to lack detail regarding the approaches to adopt in valuing road space impacts. The proposed method includes the use of a dynamic traffic flow model to enable a full understanding of traffic impacts and an economic model to value a full range of road space impacts of transit priority
-$155
$134
48
$41
$17
-$329
-$65
-$400 -$300 -$200 -$100 $- $100 $200
Net Present Value
Total Transit User Benefits
Externality Benefits
Transit Operating CostImpacts
Farebox Revenue
Infrastructure Cost
Private Vehicle Impacts
Valu
e of
Ben
efits
/ Cos
ts ($
000)
Impact Area
BenefitsCosts
Urban Transport X, C. A. Brebbia & L. C. Wadhwa (Editors)© 2004 WIT Press, www.witpress.com, ISBN 1-85312-716-7
386 Urban Transport X

treatments. The proposed approach has been applied to a two lane arterial road where a kerbside bus lane is introduced. The results show that a lower threshold of bus vehicle flows is required to justify bus lanes compared to approaches based solely on travel time impacts. It has also suggested that approaches based on the volume of flows would underestimate general traffic impacts of bus lanes.
Acknowledgements
This research is funded as part of a research and development project by VicRoads. The support of VicRoads and the staff at the Road Based Public Transport Section is gratefully acknowledged.
References
[1] Vuchic V R (1981) Urban Public Transportation: Systems and Technology. (Prentice Hall: Englewood Cliffs, NJ, USA).
[2] Black J A Lim P N and Kim G H (1992) A Traffic Model for the Optimal Allocation of Arterial Roadspace: A Case Study of Seoul’s First Experimental Bus Lane Transportation Planning and Technology, Vol 16 pp 195-207.
[3] Sparks G A and May A D A (1971) Mathematical Model for Evaluation Priority Lane Operations on Freeways Highway Research Record 363 pp 27-42.
[4] Jepson F. and Ferreira L. (1999) Assessing Travel Time Impacts Of Measures To Enhance Bus Operations Road & Transport Research Vol 8 No 4 Dec 1999 pp 41-54.
[5] Radwan A E and Benevelli S A (1983) Bus Priority Strategy: Justification and Environmental Aspects Jrnl of Transportation Engineering Vol 109 pp 88-106.
[6] Oldfield R H Bly PH and Webster F V (1977) With-Flow Bus Lanes: Economic Justification Using a Theorectical Model Transport and Road Research Laboratory LR 809, 1977.
[7] Delgoffe L (1973) Guidelines for Improving the Transit of Street Level Public Transport in Towns UITP Review March 1973.
[8] Levinson H S Adams C L and Hoey W F (1975) Bus Use of Highways – Planning and Design Guidelines NCHRP Program Report 155 Transport Research Board, Washington, DC.
[9] The Department of Environment Transport and the Regions (1997) Keeping Buses Moving – A guide to traffic management to assist buses in urban areas Local Transport Note 1/97 London the Stationary Office.
[10] Currie G V Sarvi M Young W (2004) A Comprehensive Approach to Balanced Road Space Allocation in Relation to Transit Priority Paper presented at 83rd Annual Meeting of the Transportation Research Board, Washington DC, USA.
Urban Transport X, C. A. Brebbia & L. C. Wadhwa (Editors)© 2004 WIT Press, www.witpress.com, ISBN 1-85312-716-7
Urban Transport X 387

[11] Department of Infrastructure (2003). Investment Appraisal and Evaluation Guidelines. Department of Infrastructure, Melbourne, Australia 2002.
[12] Abkowitz M D (1981) Understanding the Effect of Transit Service Reliability on Work Travel Behaviour TRR 794, pp33-41
[13] Ryan A (1996) The Value of Time London Transport Research Note M (96).
[14] Kjoerstad K N and Renolen H (1996) Passenger Valuation of Time and Service Improvements PTRC European Transport Forum 2-6 Sept 1996.
[15] Jansson K (1994) Valuation of Travel Time and Information Paper to PTRC SAM Seminar G 1994.
[16] Booz Allen Hamilton (2000) Valuation of Public Transport Attributes Final Report to Transfund New Zealand Research programme 1999-2000.
[17] Ogden, K and Stanley, J. (2001) Internal Cost Estimates to DoI including Internal Review by Ashley (2001).
Urban Transport X, C. A. Brebbia & L. C. Wadhwa (Editors)© 2004 WIT Press, www.witpress.com, ISBN 1-85312-716-7
388 Urban Transport X