Embed Size (px)
Citation preview

A New Paradigm for Quality Metrics
PRESENTED BY:JAMES J. JOYNER, SR
NASA KENNEDY SPACE CENTER
Prepared for:NASA Quality Leadership Forum
Cape Canaveral, Florida USAMarch 2016

AGENDA
Overview of the Kennedy Space Center (KSC) Independent Assessment
Overview of Dimensionless Quality Metrics
• Metrics Assessment Overview
• What is a Metric?
• Concept of Variation and “Quality”
• Using Variation to Measure Performance
• Application of Dimensionless Quality Metrics
• Interpretation
Summary 2

3
KSC INDEPENDENT ASSESSMENTWHO ARE WE? WHAT DO WE DO?
KSC Independent Assessment (IA)• Capability funded by the Office of Safety and Mission Assurance
(SMA) for the NASA Human Spaceflight Centers.
• Allows Human Spaceflight Centers to independently review and assess technical and mission risks associated with Program and Projects.
• Provides objective, non-advocate analysis and solutions.
Assessments requests come from a variety of sources: • KSC Center Director
• KSC SMA Director
• Program/Project Managers/Chief SMA Officers
• KSC Directors
Wide variety of subjects, such as:• Systemic processes (e.g. Mission Assurance)
• Institutional (e.g. Personnel Safety)
• Technical (e.g. LC 39B Emergency Egress Assessment)
4
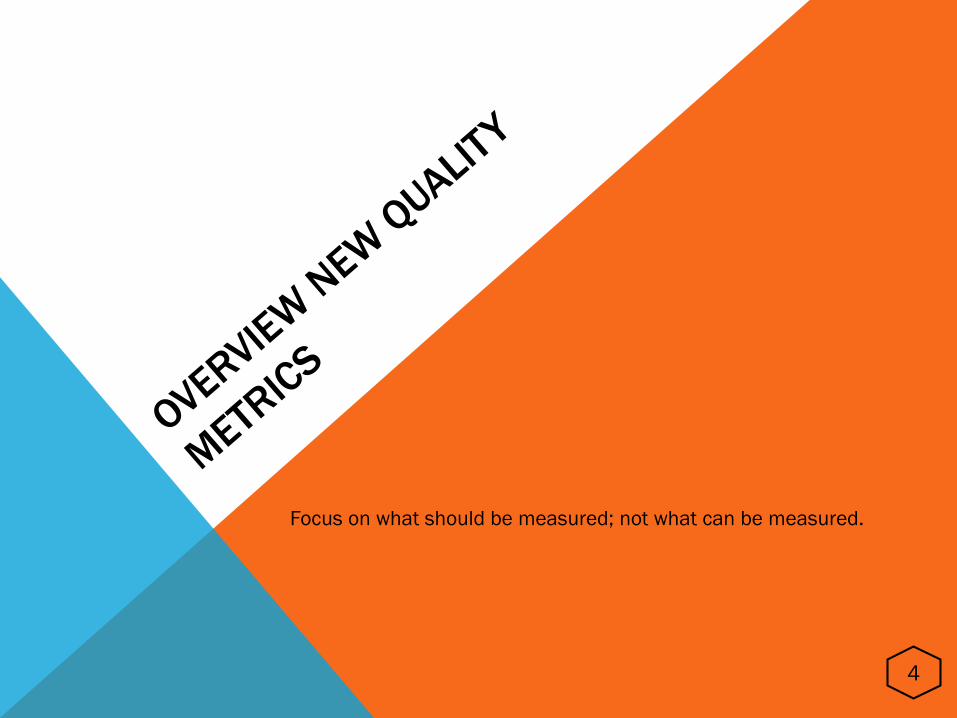
Focus on what should be measured; not what can be measured.
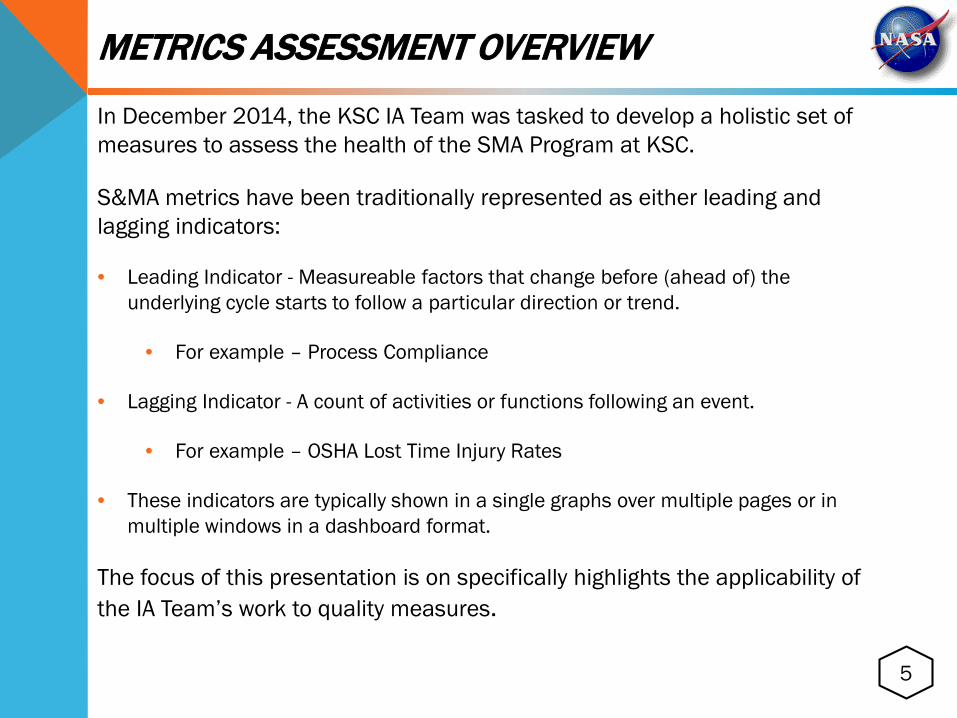
In December 2014, the KSC IA Team was tasked to develop a holistic set of measures to assess the health of the SMA Program at KSC.
S&MA metrics have been traditionally represented as either leading and lagging indicators:
• Leading Indicator - Measureable factors that change before (ahead of) the underlying cycle starts to follow a particular direction or trend.
• For example – Process Compliance
• Lagging Indicator - A count of activities or functions following an event.
• For example – OSHA Lost Time Injury Rates
• These indicators are typically shown in a single graphs over multiple pages or in multiple windows in a dashboard format.
The focus of this presentation is on specifically highlights the applicability of the IA Team’s work to quality measures.
METRICS ASSESSMENT OVERVIEW
5

WHAT IS A METRIC?
A metric is a comparison of two quantities. One quantity describes what the system is “Expected” to do (perfect state). The other quantity describes what the system “Actually” did (current state):
6
Source: http://history.nasa.gov/augustine/racfup5.htm Calendar Year
Figure 9Shuttle Launch Operations Planning and Realization
Laun
ches
Per
Yea
r
1 Year Prior ManifestCurrent Year ManifestActual Launches

CONCEPT OF “VARIATION” AND QUALITY
Variation is a common concept throughout Quality and the history of Quality Control. Some notable quotes by W. Edwards Deming, (1900-1993):• “Uncontrolled variation is the enemy of Quality.”• “Understanding variation is the key to success in Quality and Business.”• “If I could reduce my message to management to just a few words, I’d say it all has to
do with reducing variation.”
The concept of “Quality” reflects a recurring theme regarding documenting or recording variation: • Variation from policies and procedures to actual practices.• Variation from drawings to actual hardware configuration.• Variation from specifications to actual application.• Variation from requirements to actual results.• Variation from process to actual work performance.
The concept of “Variation” can be used to compare the Expected and Actual States:• Variation = Difference between the Expected versus Actual State
7

USING VARIATION TO MEASURE PERFORMANCEExpressing variation as a ratio (the deviation between the Expected and Actual) allows different measures to be plotted on the same graph for trending and comparison to provide a holistic view across a particular theme or discipline.
• Since multiple sets of data could be used in calculating the ratio, the ratio should be an absolute value to keep from hiding under performance and over performance through averaging.
Since all measurements are a ratio of variation and dimensionless, this variation-based metrics approach can be used a new analytical tool which is complimentary to existing/value-added metrics tools
• Leading and lagging indicators can be used with this non-traditional approach.• Combining different but related data on a single graph to provide a holistic view of the
health and status of a particular facet of a quality program which could not be done with traditional methods.
8
THE IDEAL LINE – NO VARIATION
9
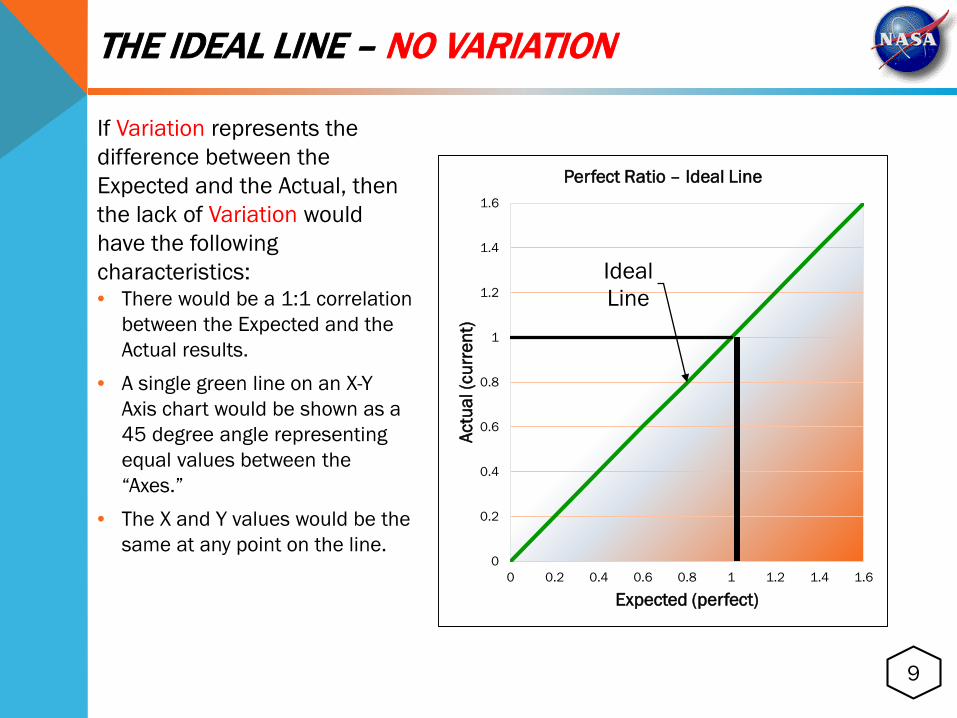
If Variation represents the difference between the Expected and the Actual, then the lack of Variation would have the following characteristics:• There would be a 1:1 correlation
between the Expected and the Actual results.
• A single green line on an X-Y Axis chart would be shown as a 45 degree angle representing equal values between the “Axes.”
• The X and Y values would be the same at any point on the line.
Ideal Line
0
0.2
0.4
0.6
0.8
1
1.2
1.4
1.6
0 0.2 0.4 0.6 0.8 1 1.2 1.4 1.6
Actu
al (c
urre
nt)
Expected (perfect)
Perfect Ratio – Ideal Line

10
Ideal Line
VariationLine
0
0.2
0.4
0.6
0.8
1
1.2
1.4
1.6
0 0.2 0.4 0.6 0.8 1 1.2 1.4 1.6
Actu
al (c
urre
nt)
Expected (perfect)
Perfect Ratio – Ideal LineVariation
ILLUSTRATING VARIATION
The blue lines represent the Variation from the actual to the expected values.Since Variation represents any difference from the actual to the expected, then it would have the following characteristics: The correlation would be equal to the Ratio of
the difference between the Actual value and the Expected value relative to the Expected value or:
Variation Ratio = 𝑨𝑨𝑨𝑨𝑨𝑨𝑨𝑨𝑨𝑨𝑨𝑨 𝑽𝑽𝑨𝑨𝑨𝑨𝑨𝑨𝑽𝑽−𝑬𝑬𝑬𝑬𝑬𝑬𝑽𝑽𝑨𝑨𝑨𝑨𝑽𝑽𝑬𝑬 𝑽𝑽𝑨𝑨𝑨𝑨𝑨𝑨𝑽𝑽𝑬𝑬𝑬𝑬𝑬𝑬𝑽𝑽𝑨𝑨𝑨𝑨𝑽𝑽𝑬𝑬 𝑽𝑽𝑨𝑨𝑨𝑨𝑨𝑨𝑽𝑽
Hence, the Variation Ratio (red vertical bar) for this metric is dimensionless and could be plotted for trending with: Historical data Other dimensionless ratios such as: Only other Quality ratios Only other Safety ratios Or a mixture of Safety and Quality ratios

11
“…when you can measure what you are speaking about and express it in numbers you know something about it..” William Thomas, 1st Baron Kelvin, 1824-1907

TRADITIONAL– QUALITY PROGRAM PERFORMANCE METRICS
Attributes of an quality program can be chosen and looked at as a aggregate. Examples include:• Quality of Delivered Products
• Supplier Performance• Customer Satisfaction
• Products Process Nonconformity:• Audits• Surveillance• Inspections
• Products Acceptance and/or Rejection:• Rework• Repair
The criteria for Products Acceptance/Rejection will be used to illustrate how variation and dimensionless can be applied as variation-based quality metric.
12

EXAMPLE – QUALITY OF DELIVERED PRODUCTS
The formulas below for the Products Acceptance/Rejection metrics were selected as examples how this variation-based metrics approach can be used a new analytical tool.
13
Formula for Products Acceptance/Rejection Ratio (PARR):PARR = 𝐑𝐑𝐑𝐑+ 𝐑𝐑𝐑𝐑𝐑𝐑
The 4th Quarter PARR is 0.50 as an aggregate of the Repair Ratio and Rework Ratio.
Formula for Rework Ratio (RWR):RWR= 𝑨𝑨𝑨𝑨𝑨𝑨𝑨𝑨𝑨𝑨𝑨𝑨 𝑹𝑹𝑽𝑽𝑹𝑹𝑹𝑹𝑹𝑹𝑹𝑹 −𝑹𝑹𝑽𝑽𝑹𝑹𝑹𝑹𝑹𝑹𝑹𝑹 𝑮𝑮𝑹𝑹𝑨𝑨𝑨𝑨
𝑹𝑹𝑽𝑽𝑹𝑹𝑹𝑹𝑹𝑹𝑹𝑹 𝑮𝑮𝑹𝑹𝑨𝑨𝑨𝑨
Assume there 22 items reworked and the goal was 20 items.
Thus, the 4th Quarter RWR = 0.10
Formula for Repair Ratio (RR):
RR = 𝑨𝑨𝑨𝑨𝑨𝑨𝑨𝑨𝑨𝑨𝑨𝑨 𝑰𝑰𝑨𝑨𝑽𝑽𝑰𝑰𝑰𝑰 𝑹𝑹𝑽𝑽𝑬𝑬𝑨𝑨𝑹𝑹𝑹𝑹 −𝑬𝑬𝑬𝑬𝑬𝑬𝑽𝑽𝑨𝑨𝑨𝑨𝑽𝑽𝑬𝑬 𝑹𝑹𝑽𝑽𝑬𝑬𝑨𝑨𝑹𝑹𝑹𝑹𝑬𝑬𝑬𝑬𝑬𝑬𝑨𝑨𝑽𝑽𝑨𝑨𝑽𝑽𝑬𝑬 𝑹𝑹𝑽𝑽𝑬𝑬𝑨𝑨𝑹𝑹𝑹𝑹
Assume 10 items are expected to be repaired per quarter and measured was 14.
Therefore, the 4th Quarter RR = 0.40
The interpretation and advantages of the aggregate chart is outlined on the next page.

INTERPRETATION
The aggregate chart is a roll up of dimensionless metric ratios.• Once the target ratio is identified, the
associated data subset can be analyzed for trends, stratification of types or sources of issues, the ability to drill down to specific areas, etc.
Are the ratios balanced?• Is the ratio (expressed as variation) from
ideal acceptable?
Total variation and/or individual ratios can be:• What is the trending (increase/decrease
based on Laplace Test results)?
Does one or more ratios stay constant regardless of resources or effort?
14
15
Good metrics start with good goals, and good goals as a set are like good management—holistic

SUMMARY
S&MA metrics have been traditionally represented as either leading and lagging indicators.
Traditional ways of viewing these metrics and trending the data is via graphs which reflect one attribute in each graph.
Using the concept of variation to develop “dimensionless” metrics allows for the combination of different but related data on a single graph to provide a holistic view of the health and status of a particular facet of a quality program.
16