Embed Size (px)
Citation preview
A new railway between Turin and Lyon
Is it reasonable?
Angelo Tartaglia

22 marzo 2013 Angelo Tartaglia 2
What is a new transport infrastructure for?
• To carry people
• To transport goods
• To generate profit for the builders
• To redistribute revenue (to create employment) during the building and
• afterwards
22 marzo 2013 Angelo Tartaglia 3
Why a new infrastructure when there are already others in
operation?
• Because one expects a coming flux of passengers and ware bigger than what the existing infrastructure can carry
• Because the cost for renewal, maintenance and management of the existing connection tends to approach the cost of an entirely new infrastructure in a few years

22 marzo 2013 Angelo Tartaglia 4
Passengers flux
• In 1992 the proponents claimed that the passengers between Turin and Lyon would grow from 2.000 to 20.000 per day in 10 years
• The offer of seats on the line in 20 years has remained between 2.000 e 3.000 pax/day

22 marzo 2013 Angelo Tartaglia 5
Existing High Speed rails
• The Tokyo-Osaka line has more than 400,000 pax/day
• The new Beijing-Shanghai expects more than 200,000 pax/day
• The TGV Atlantique has approximately 40,000 pax/day
• Out of these orders of magnitude a passenger line is a luxury which needs direct or indirect public subsidy

22 marzo 2013 Angelo Tartaglia 6
Flux of wares across the Alps

22 marzo 2013 Angelo Tartaglia 7
Quantitative data
1999 2008 2009 2010
Border
with Italy
Road
(Mton/y
ear)
Rail
(Mton/ye
ar)
Total Total Road Rail Total Road Rail Total
France 37,8 10,2 48 45,3 35,3 2,8 38,1 38 4,5 42,5
Austria 58,7 27,9 86,6 120,7 70,1 32,8 102,9 91,5 44,5 136,0
Switzerland 8,4 18,4 26,8 40,1 13,4 21,0 34,4 14,3 24 38,4
Alpine arch
104,9
56,5
161,4
206,1
118,7
56,6
175,3
143,8
73
216,9

22 marzo 2013 Angelo Tartaglia 8
Present trend (28 years)

Trends
23/07/2013 9 A. Tartaglia

Between France and Italy
23/07/2013 A. Tartaglia 10

22 marzo 2013 Angelo Tartaglia 11
Price and weight
• The Italian government often refers to the price of the transported goods
• Railways and infrastructures are designed referring not to the price but to the volume and weight of the goods to be transported
22 marzo 2013 Angelo Tartaglia 12
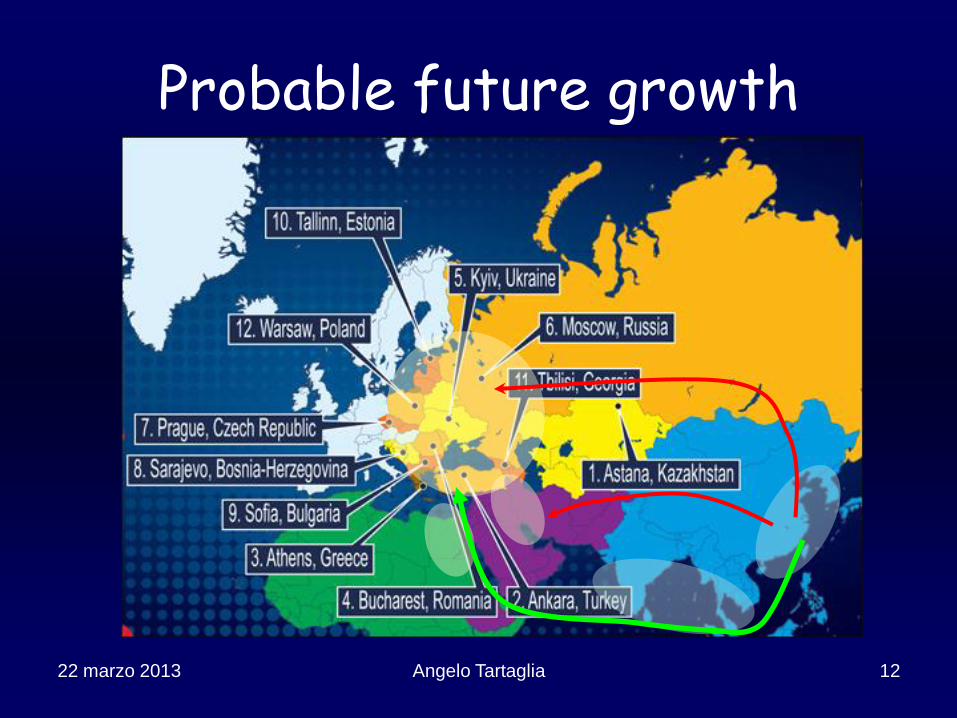
Probable future growth

22 marzo 2013 Angelo Tartaglia 13
North-South terrestrial corridors
22 marzo 2013 Angelo Tartaglia 14
Active links for Italy
• East/West: mainly intra-European (stationary)
• North/South: both intra-European and towards Far and Near East and Africa through the ports of the Mediterranean (growing)

22 marzo 2013 Angelo Tartaglia 15
Flux of goods between two finite markets
Mercati saturi
Far from saturation
Saturated markets

22 marzo 2013 Angelo Tartaglia 16
Italy-France (East-West)
Cavour
Letta

22 marzo 2013 Angelo Tartaglia 17
Europe-Asia, -Africa… (North-South)

22 marzo 2013 Angelo Tartaglia 18
Prevision models
• According to the proponents the flux of goods across the Susa Valley will multiply by 15-20 within some forty years
• If so, this would imply: – Either a generalized increase of the traffic
of goods across the whole Alpine arch – Or a substantial transfer from other
corridors to the Susa Valley – Or both
22 marzo 2013 Angelo Tartaglia 19
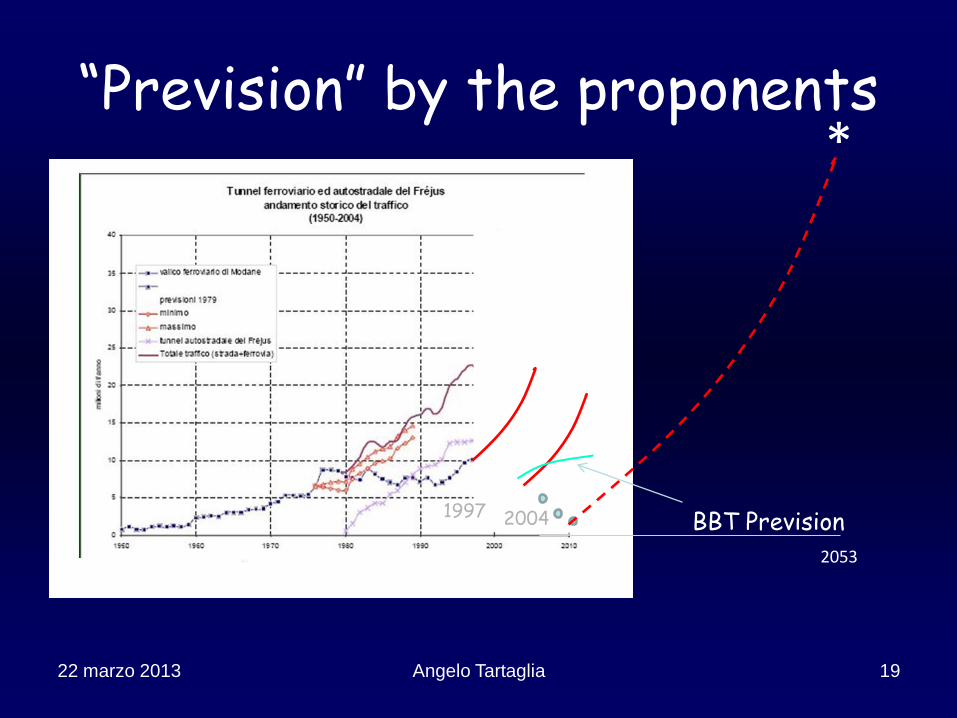
“Prevision” by the proponents
1997 2004
2053
*
BBT Prevision

22 marzo 2013 Angelo Tartaglia 20
Generalized growth
• The “predicted” growth of traffic through the Susa Valley would bring about the saturaton of the entire Alpine arch in a few decades.
• The internal Italian transportation network would saturate in turn
• The growth of traffic is based on two hypotheses:
– Generalized growth of GNP in Europe
– “Elasticity Factor” k equalling 1.7 in weight and value.

22 marzo 2013 Angelo Tartaglia 21
The real world
• Structural economic crisis with unknown outcome (stagnant or decreasing European GNP)
• Material growth of fluxes impossible for saturated markets
• 1.7 multiplier chosen ad hoc and without material justification
• Growing energy costs
• Growing cost of raw material

22 marzo 2013 Angelo Tartaglia 22
Elasticity factor
• k=1.7 “explained” by the trend of 11 months in 2011
• In 2006 LTF model it was k=1.4
• The correlation between two phenomena whose reason is unknown can give any result depending on the set of data one uses.

Paradox of the application of a long lasting k>1 to a transport system
22 marzo 2013 Angelo Tartaglia 23
The cost of transport would increase faster than the volume of the exchange
The available wealth would decrease in time, so ceasing to be the engine of the growth of the exchange

22 marzo 2013 Angelo Tartaglia 24
Transfer from other corridors
• Transfer could be the consequence of a forthcoming saturation of other corridors which brings again to a generalized exponential growth
• What would the advantage be of having on the Turin-Lyon rail goods that are already entering or exiting Italy by other paths?

22 marzo 2013 Angelo Tartaglia 25
Modal split
• Europe asserts the need of reducing the road transport to the advantage of the rail
• The NLTL is presented as substantially having that purpose
• The LTF model which “predicts” an extremely strong growth of commercial fluxes also predicts an increase of road transport through the valley of Susa

22 marzo 2013 Angelo Tartaglia 26
Trends in Europe (rail/total)
2000
2007
2008
Europe (27)
20%
18%
18%
France 21% 16% 16%
Switzerland 53% 54% 54%
Italy 11% 12% 12%

22 marzo 2013 Angelo Tartaglia 27
European environmental objectives
• Proclaimed European goals require absolute decreases (CO2 emissions, energy consumption) expressed as percentages of quantities that should stay fixed.
• Percent reductions of growing quantities can correspond (and indeed they do in the models) to absolute increases.

22 marzo 2013 Angelo Tartaglia 28
The “low cost” project
Lyon Turin
150 freight trains
300 freight trains
150 freight trains
Base tunnel

“Predictions” of the proponents for 2035
• 39.9 Mton on the NLTL (10 times the 2010 flux)
• 32.4 Mton on the road (1.6 times the 2010 flux, including Mount Blanc)
800,000 trucks more than today
Angelo Tartaglia 29 22 marzo 2013

However…
According to the proponents, in 2035 the only low cost will be in operation (base tunnel and historical railroad)
• The capacity of the line will remain the one of today: 20 Mton
• 19.9 Mton more will pour out on the road
• 2.1 million trucks (including the Mont Blanc) more than today on the road
Angelo Tartaglia 30 22 marzo 2013

2035 Scenario (according to the promoters)
• Total flux on the corridor: 72.3 Mton/year • NLTL “low cost”: 20 Mton/year (saturated) • On the road: 52.3 Mton/year 2.75 times 2010 2.1 million trucks more
2.75 times the present number of accidents 2.75 times the present fuel consumption 2.75 times the present emissions in the atmosphere
23/07/2013 A. Tartaglia 31

“Social benefits”
• The proponents assume that for each gram of spared CO2 there would be an economical advantage of 0.006-0.008 €, i.e. 6000-8000 €/ton. But…
• The European Commission recommends to use values of the order of 30-100 €/ton (about 100 times smaller)
Angelo Tartaglia 32 22 marzo 2013
In the coming decades
Angelo Tartaglia 33
• The price of oil will increase considerably
• The price of many raw materials will increase
considerably
• The price of food will increase considerably
• It is not clear what the world financial
instabilities will bring about.
22 marzo 2013
22 marzo 2013 Angelo Tartaglia 34
• Motivation – Substancial doubts
– Ideological stretching
• More problems – Revenue account
– Energy balance
– Technological and operational inconsistency
– Impact

Angelo Tartaglia 35
There are no reasonable motivations for
building the new line
There are many reasonable monivations for
NOT building the new line
22 marzo 2013