Embed Size (px)
Citation preview

Mississippi State University Mississippi State University
Scholars Junction Scholars Junction
Theses and Dissertations Theses and Dissertations
8-14-2015
A New SCADA Dataset for Intrusion Detection System Research A New SCADA Dataset for Intrusion Detection System Research
Ian P. Turnipseed
Follow this and additional works at: https://scholarsjunction.msstate.edu/td
Recommended Citation Recommended Citation Turnipseed, Ian P., "A New SCADA Dataset for Intrusion Detection System Research" (2015). Theses and Dissertations. 209. https://scholarsjunction.msstate.edu/td/209
This Graduate Thesis - Open Access is brought to you for free and open access by the Theses and Dissertations at Scholars Junction. It has been accepted for inclusion in Theses and Dissertations by an authorized administrator of Scholars Junction. For more information, please contact [email protected].

Template C v3.0 (beta): Created by J. Nail 06/2015
A new SCADA dataset for intrusion detection system research
By
Ian Turnipseed
A Thesis Submitted to the Faculty of Mississippi State University
in Partial Fulfillment of the Requirements for the Degree of Master of Science
in Electrical and Computer Engineering in the Department of Electrical and Computer Engineering
Mississippi State, Mississippi
August 2015

Copyright COPYRIGHT PAGE
Ian Turnipseed
2015

A new SCADA dataset for intrusion detection system research
By APPROVAL PAGE
Ian Turnipseed
Approved:
____________________________________ Thomas H. Morris (Major Professor)
____________________________________ David A. Dampier
(Committee Member)
____________________________________ Robert Wesley McGrew
(Committee Member)
____________________________________ James E. Fowler
(Graduate Coordinator)
____________________________________ Jason M. Keith
Dean Bagley College of Engineering

Name: Ian Turnipseed Date of Degree: August 14, 2015 Institution: Mississippi State University Major Field: Electrical and Computer Engineering Major Professor: Dr. Thomas Morris Title of Study: A new SCADA dataset for intrusion detection system research Pages in Study: 57 Candidate for Degree of Master of Science
Supervisory Control and Data Acquisition (SCADA) systems monitor and control
industrial control systems in many industrials and economic sectors which are considered
critical infrastructure. In the past, most SCADA systems were isolated from all other
networks, but recently connections to corporate enterprise networks and the Internet have
increased. Security concerns have risen from this new found connectivity. This thesis
makes one primary contribution to researchers and industry. Two datasets have been
introduced to support intrusion detection system research for SCADA systems. The
datasets include network traffic captured on a gas pipeline SCADA system in Mississippi
State University’s SCADA lab. IDS researchers lack a common framework to train and
test proposed algorithms. This leads to an inability to properly compare IDS presented in
literature and limits research progress. The datasets created for this thesis are available to
be used to aid researchers in assessing the performance of SCADA IDS systems.

ii
DEDICATION
Thanks for putting me through college Mom and Dad. I would also like to thank
Caterina for her continuous support along the way . Lastly, I would like to mention all
the friends and professors I have met and my brothers and sister, thanks for your
guidance!

iii
ACKNOWLEDGEMENTS
I would like to first acknowledge Dr. Morris for all his support and knowledge
that he gave me in my travels through graduate school. I would like thank him also for his
guidance into the research area of ICS security. It has helped me tremendously and will
never be forgotten. I would like to also thank both of my committee members Dr.
Dampier and Dr. McGrew for both the knowledge I have gained from them as professors
and for their support in graduate school.
iv
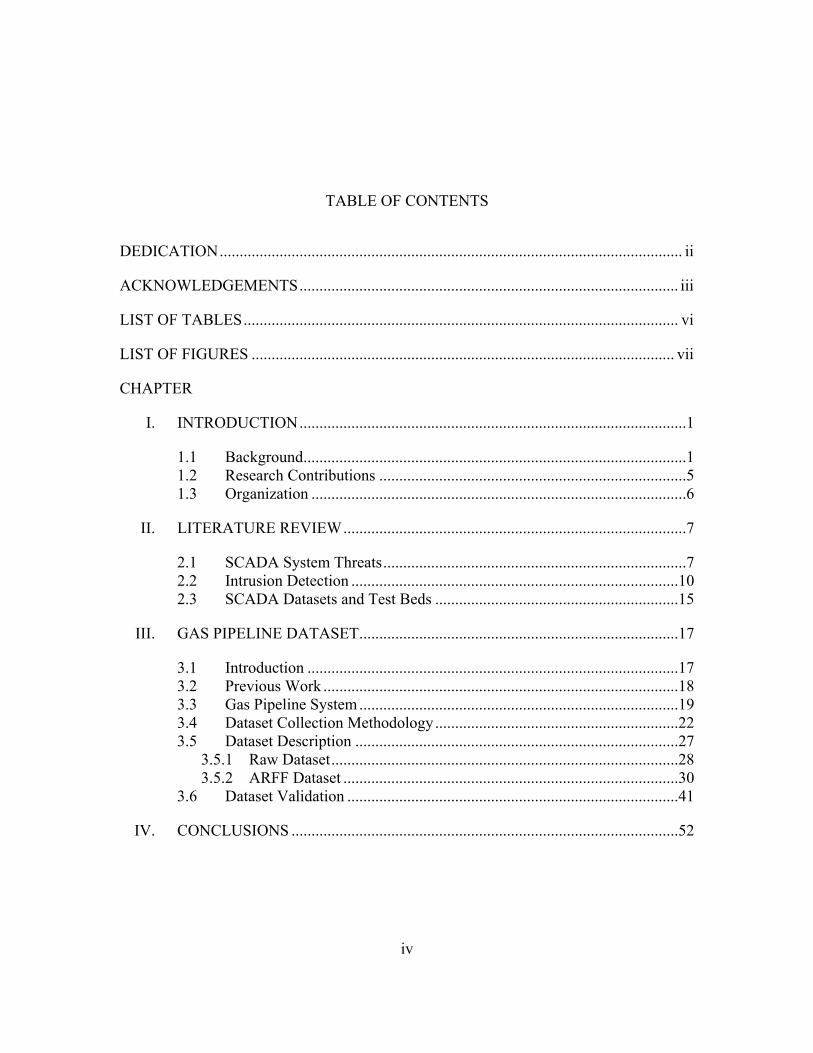
TABLE OF CONTENTS
DEDICATION .................................................................................................................... ii
ACKNOWLEDGEMENTS ............................................................................................... iii
LIST OF TABLES ............................................................................................................. vi
LIST OF FIGURES .......................................................................................................... vii
CHAPTER
I. INTRODUCTION .................................................................................................1
1.1 Background ................................................................................................1
1.2 Research Contributions .............................................................................5
1.3 Organization ..............................................................................................6
II. LITERATURE REVIEW ......................................................................................7
2.1 SCADA System Threats ............................................................................7
2.2 Intrusion Detection ..................................................................................10
2.3 SCADA Datasets and Test Beds .............................................................15
III. GAS PIPELINE DATASET ................................................................................17
3.1 Introduction .............................................................................................17
3.2 Previous Work .........................................................................................18
3.3 Gas Pipeline System ................................................................................19
3.4 Dataset Collection Methodology .............................................................22
3.5 Dataset Description .................................................................................27
3.5.1 Raw Dataset .......................................................................................28
3.5.2 ARFF Dataset ....................................................................................30
3.6 Dataset Validation ...................................................................................41
IV. CONCLUSIONS .................................................................................................52

v
REFERENCES ................................................................................................................. 53
APPENDIX
A. REGISTER MAPPING FOR GAS PIPELINE RTU ..........................................56

vi
LIST OF TABLES
2.1 Common SCADA System Threats[10] ............................................................8
3.1 Attack Categorization .....................................................................................24
3.2 Feature List .....................................................................................................31
3.3 System mode features .....................................................................................33
3.4 Feature list ......................................................................................................35
3.5 Categories of attacks [7] .................................................................................36
3.6 Cyber attacks 1-12 ..........................................................................................37
3.7 Cyber attacks 13-23 ........................................................................................39
3.8 Cyber attacks 24-35 ........................................................................................40
3.9 List of Algorithms ..........................................................................................41
3.10 Results of Algorithms .....................................................................................42
3.11 Percentage of attacks in dataset ......................................................................43
3.12 Comparison of False Positive Rates ...............................................................44
3.13 Precision and Recall for Datasets ...................................................................45
3.14 Confusion Matrix for NMRI and CMRI attacks ............................................46
3.15 Identified Problems in the Feature list of Gao’s Dataset [26] ........................50

vii
LIST OF FIGURES
1.1 Simple SCADA system [29] ............................................................................2
2.1 SCADA Attack Patterns [1] .............................................................................9
3.1 Gas Pipeline System and HMI .......................................................................20
3.2 Modbus RTU and TCP packet [21] ................................................................21
3.3 Types of Cyber Threats[27]............................................................................23
3.4 Process Framework/Methodology ..................................................................26
3.5 Modbus Frame ................................................................................................28
3.6 Instance within Raw Dataset ..........................................................................30
3.7 Differences between Setpoint Values .............................................................48
3.8 Gain Parameter Coverage ...............................................................................49
3.9 Differences between Control Modes ..............................................................50
A.1 Register Mapping Sheet .................................................................................57

viii
LIST OF ABBREVIATIONS
ADU – Application Data Unit
ARFF – Attribute Relationship File Format
BSM – Basic Security Mode
CIP – Critical Infrastructure Protection
CMRI – Complex Malicious Response Injection
CRC – Cyclic Redundancy Code
CSV – Comma Separated Value
DARPA – Defense Advanced Research Projects Agency
DNP3 – Distributed Network Protocol
DoS – Denial of Service
FC – Function Code
FIFO – First In First Out
GUI – Graphical User Interface
HIDS – Host Intrusion Detections System
HMI – Human Machine Interface
HVAC – Heating, Ventilation, and Air Conditioning
ICS – Industrial Control System
IDS – Intrusion Detection System
IP – Internet Protocol

ix
IT – Information Technology
LRC – Linear Redundancy Code
MBAP – Modbus Application Header
MFCI – Malicious Function Code Injection
MLA – Machine Learning Algorithm
MPCI – Malicious Parameter Command Injection
MSCI – Malicious State Command Injection
MTU – Master Terminal Unit
NIDS – Network Intrusion Detection System
NIPS – Network Intrusion Protection System
NMRI – Naïve Malicious Response Injection
NNIDS – Network Node Intrusion Detection System
PART – Projective Adaptive Resonance Theory
PDU – Protocol Data Unit
PID – Proportional-Integral-Derivative
PLC – Programmable Logic Controller
PSI – Pounds per Square Inch
R2L – Remote to Local
RTU – Remote Terminal Unit
SCADA – Supervisory Control and Data Acquisition
TCP – Transmission Control Protocol
U2R – User to Remote
WEKA - Waikato Environment for Knowledge Analysis

1
INTRODUCTION
1.1 Background
Supervisory Control and Data Acquisition (SCADA) systems monitor and control
highly critical infrastructure related utilities. These SCADA controlled systems are gas
pipelines, power plants, railroads, water treatment facilities, and even some HVAC
systems. In the past, most of these systems were isolated from all other networks, but
recently they many been integrated with the Internet and corporate enterprise networks.
By interconnecting these systems with other networks, control has increased for the
operators, and savings have increased for companies. With this newfound connectivity,
however, there are also many security concerns for these once isolated and remote
systems. If a vulnerability exists in one of these systems, it will now allow attackers to
remotely exploit and take control of these SCADA systems; this could cause failure in the
hardware and harm to people’s lives.
SCADA systems provide control and visualization of critical infrastructure
systems. These systems are generally made up of four components [1]. The first level
consists of sensors and actuators [1]. The sensors which collect data about the system are
pressure monitors, water level gauges, and laser sensors. The actuators control the
system’s state: pumps, motors, etc. The second level is the programmable logic
controllers (PLCs). These components control and collect information that determine the

2
system’s state. The controllers are generally referred to as remote terminal units (RTUs).
The RTU interfaces with the first level of the SCADA system, i.e. stores the sensor data
in predetermined registers. The third level of a SCADA system is supervisory controls
[1]. The supervisory controls are usually handled by the master terminal unit (MTU). The
MTU is the unit which communicates with the RTU. For example, in a gas pump system
the MTU can send a command to the RTU to turn on the pump. The MTU can also send a
read query to read from the RTU registers that contain the current pressure measurement.
There are many protocols which allow for this communication such as Profibus, Fieldbus,
Modbus, and Distributed Network Protocol Version 3 (DNP3). The fourth level, the
human-machine interface (HMI), is used by an operator to display the sensor data
collected by the MTU. The HMI usually contains a visual representation of the system
and the operation of the subsystems. It is also used to change parameters and states within
the SCADA system with communication through the MTU. A simple SCADA system is
shown in the diagram below.
Figure 1.1 Simple SCADA system [29]

3
According to "Security Aspects of SCADA and Corporate Network
Interconnection: An Overview", SCADA systems “were designed to be open, robust, and
easily operated and repaired, but not necessarily secure” [1]. This architecture suffers
from three key security factors. The first factor is the lack of authentication of the
communication protocols used by these SCADA systems [1]. This can lead to spoofing of
data transmitted by both the MTU and the RTU. This type of attack occurs at the protocol
level and is hard for an Intrusion Detection System (IDS) to detect. The second factor is
the idea that these systems are “secure through obscurity” [1]. This means that the
operators of these systems believe their specialized equipment and protocols cannot be
understood by anyone outside of their knowledge group [1]. The last factor is the notion
that the system cannot be harmed by an intruder because it is physically secure [1]. These
flawed ideas have made critical infrastructure systems vulnerable and in need of
improved cyber security protections.
There are many researchers examining the security in today’s SCADA systems to
help bring to light possible vulnerabilities and provide security solutions. A recent attack
in 2010, named Stuxnet, was able to compromise uranium-enrichment plants in Iran by
targeting the Siemens Step7 software [2]. The Siemen’s software was used to program
PLCs, the digital devices that control the industrial systems. Stuxnet was introduced into
the Windows environment and began searching for the Siemen’s software [2]. According
to “How Stuxnet Is Rewriting the Cyberterrorism Playbook,” once the software was
detected, Stuxnet was able to collect surveillance data, place the system into a critical
state, and even falsely respond to prevent alarms [2]. It was able to accomplish this by

4
overwriting the ladder logic and firmware on the PLC, allowing for the attacker to force
the PLC to report false responses [3].
Another attack known to have targeted SCADA systems is Flame which collected
surveillance data. Flame is similar to Stuxnet in that it infects Windows based systems.
The difference is that Flame does not want to cause harm to the system, but rather it
gathers and streams data to the command and control server [4]. The server would then
filter through the large amount of data being sent from the victim’s system and display
the results to an operator [4]. This attack was mostly exploited on systems in Iran to
collect data for some unknown nation state [4].
Another recent event, Aurora, was presented to the government by Idaho National
Laboratory as a demonstration to express the seriousness of these types of attacks. The
Aurora exploit was used on an experimental platform which replicated the controls of a
power system [5]. The attack specifically targeted the control system of a power system
and attempted to open and close circuit breakers [5]. The end goal was to cause a
generator to be physically damaged due to a change in the operation cycle causing a fatal
phase condition [5]. Although this attack was not exploited in a real system, the goal of
grabbing the attention of the government was accomplished, and research and
development in industrial control system (ICS) security has increased.
With the use of an intrusion detection systems (IDS), attacks such as these can be
detected, and an operator can be alerted to anomalous activity to help prevent further
damage. IDSs are an important layer of security which can be implemented in any
communication based system to monitor and analyze a system’s status. IDSs in SCADA
systems are improved by training them with data logs that represent real SCADA

5
network traffic. The need for a dataset which can be used to validate and improve IDS
systems is in high demand. The next sections will describe the research contributions and
provide an overview of this thesis.
1.2 Research Contributions
This thesis makes one primary contribution to researchers and industry. The
contribution is that of two datasets which have been introduced to replace a previous
dataset [6], hence the Gao dataset, that was deemed unsuitable for IDS research. The
information gathered in the dataset is network transactions between a Remote Terminal
Unit (RTU) and a Master Control Unit (MTU) in Mississippi State University’s in-house
SCADA gas pipeline. The new datasets were collected using a novel framework for
simulating real attacks and operator activity on a gas pipeline. Comparison to the
previous dataset validated that all problems which effected that dataset have been
resolved.
The datasets contain three separate categories of features: network information,
payload information, and labels. The network information provides a pattern of
communication for intrusion detection systems to train against. Unlike Information
Technology (IT) networks, SCADA systems have network topologies which are fixed
and the transactions between the nodes are repetitive and regular. This static behavior is
conducive to IDSs to detect anomalous activity. The second category of features is that of
payload information. The payload information provides information about the gas
pipeline’s state, settings, and parameters. These values are vital to understanding how the
system is performing and detecting if the system is in an out-of-bounds or critical state.

6
The last category of features is the network transaction label. The label is appended to
each line in the dataset to detail if the transaction is normal system activity or an attack.
It is postulated that the datasets can be used to aid researchers in assessing the
performance of SCADA IDS systems through the use of real SCADA attack patterns and
simulated operator operation of the HMI. Since SCADA systems are designed to last
several years [7], the network topologies are predetermined and communication patterns
remain fixed. Therefore these datasets can be used to assess SCADA IDS systems in
general, by providing these common characteristics.
1.3 Organization
The remainder of this thesis is arranged as follows. The next chapter, provides
recent research in the areas of SCADA system threats, IDSs for critical infrastructure
systems, and an analysis of other SCADA datasets and test beds. This chapter analyzes
exactly why this dataset is needed in the research community and what purpose it will
serve to other researchers. Chapter III discusses the gas pipeline system that was used to
create this dataset along with the methodologies and framework that were implemented.
The next two sections in Chapter III detail the two datasets which were created. The first
is the raw network transaction data which was captured, while the second preprocesses
the data given from the first. There is also a section which validates that the current
dataset has improved from the previous iteration. The last chapter provides conclusions
which were made from this research.

7
LITERATURE REVIEW
2.1 SCADA System Threats
Many researchers are studying and creating IDS systems using SCADA network
traffic. SCADA systems are becoming increasingly vulnerable to outside attackers and
have plagued the minds of security professionals. In “Security for Process Control, An
Overview,” Brundle and Naedele [8] discuss the importance of securing industrial control
systems by listing the challenges of SCADA security, providing reactions from the
industry to these challenges, and highlighting what security threats remain. There are
several security threats which remain in SCADA systems as shown in [8][9][10]. In
“Challenges and Direction toward Secure Communication in the SCADA System,” Hong
and Lee discuss the inherent security issues in SCADA and smart grid communication
technologies [9]. They provide details on how these open standard communication
protocols are becoming more vulnerable to cyber-attacks as they are connected to larger
networks. Since these protocols were made to be on isolated networks there are security
vulnerabilities not addressed in these protocols which do not account for being connected
to larger networks. Hong and Lee also discuss some of the problems with intrusion
detection systems. They state that SCADA IDSs require network traffic patterns to
determine if there is any anomalous activity occurring within the system [9]. The need
for a dataset which represents a real SCADA system and contains the “peculiar” traffic is

8
in high need to create IDSs tailored for SCADA applications. In “Analysis on Cyber
Threats to SCADA Systems” by Kang et al. also discusses many problems in current
SCADA systems [10]. The table below details the many attacks that effect these systems.
Table 2.1 Common SCADA System Threats[10]
Common RT Computer System Threats
1. Authorization Violation
9. Information Leakage
17. Sabotage 25. Traffic Analysis
2. Bombs (Logic or Time)
10. Intercept/Alter 18. Scavenging 26. Trap Door/ Back Door
3. Browsing 11. Interference Database Query Analysis
19. Spying 27. Trojan Horse
4. Bypassing Controls 12. Masquerade 20. Service Spoofing 28. Tunneling 5. Data Modification 13. Physical Intrusion 21. Sniffers 29. Unauthorized
Access Violations of Permission
6. Denial of Service 14. Replay 22. Substitution 30. Unauthorized Access
7. Eavesdropping 15. Repudiation 23. Terrorism 31. Virus 8. Illegitimate Use 16. Resource
Exhaustion 24. Theft 32. Worm
Many of these attacks are included in the proposed dataset and can be used to effectively train IDSs to detect attacks similar to these.
There are many other reports which detail security vulnerabilities in SCADA
systems [11][12]. In a report published by Dell on SCADA attack patterns, the authors
identified the most common threats common to SCADA systems [11]. The diagram
below shows their results.

9
Figure 2.1 SCADA Attack Patterns [1]
These attacks are executed to gain access to servers which control the SCADA
systems. Once these servers are compromised, an attacker has access to the workstations
which operate the physical process. “Software security: Application-level vulnerabilities
in SCADA systems” by Valentine et al. addresses what can happen when these
workstations are compromised. They discuss how ladder logic used in the PLCs of
SCADA systems do not provide protection against many common errors [10]. They
provide many examples of intentional and unintentional errors at the application level.
Their conclusions showed that verification and validation tools should be added to
provide another layer of protection for the PLCs. Similar to Hong and Lee’s work,
Dzung et al. outlines in “Security for Industrial Communication Systems” the many
issues found in communication networks for industrial applications [13]. Dzung provides

10
a list of attacks that are common to this application domain. These attacks are a subset of
the ones found in Table 2.1. In conclusion Dzung states that it is possible to secure
industrial control systems using many emerging and conventional technologies. One of
Dzung’s security technologies that is recommended is intrusion detection systems. These
systems are crucial to providing real time information of anomalous or malicious activity.
The next section will discuss intrusion detection systems.
2.2 Intrusion Detection
Intrusion detection systems are used to collect and analyze system activity data to
monitor a system’s status. They also provide examination of a system’s state and perform
integrity checks on files within the system. Many IDSs use machine learning algorithms
for pattern recognition to detect threat activity which is anomalous for a certain system.
There are other IDSs which use a signature-based system to compare activity to a
database of known threats [14]. These functionalities can be combined together for a
robust detection system and will provide a sufficient layer of protection for various
attacks.
An IDS consists of three main components. The first component is the “Network
Intrusion Detection system (NIDS)” [14]. The NIDS uses a signature-based system to
determine if the activity in the entire system is normal or if it can be found in the database
of known attacks [14]. If the NIDS finds a match of a signature, the activity is reported to
the operator or system administrator [14]. The NIDS does not prevent the traffic from
going through, but only provides a warning. The second component is the “Network
Node Intrusion detection system (NNIDS)” [14]. The NNIDS is more specific to the
communication between the control station and a single subsystem. It performs similar

11
functions as the NIDS, but it also provides some pattern recognition and behavior
analysis. Each subsystem requires an algorithm that is tailored toward its functions; this is
the reason for pattern recognition to be on this level. The specialization is needed to
provide the highest level of security and detection. The last level of security is found on
the subsystem itself. It is referred to as the “Host Intrusion Detection System (HIDS)”
[14]. This is the system that analyzes system state and performs integrity checks on the
systems data to determine if there is anomalous activity. Many SCADA systems have low
variability in states, and changes from normal behavior are easily detected with a proper
IDS installed.
There are many limitations to the IDS solutions discussed above, such as a high
false positive rate from noise generated in normal activity. The noise is introduced from
the system in the form of a bad packet or a hardware malfunction, but it would be
detected as anomalous and reported to the operator as a possible threat [16]. This high
number of false positives can reduce the effectiveness of the IDS, as the false positives
will overshadow the actual threats often causing real warnings to be ignored [16].
Another problem with IDS solutions, specifically the signature-based solutions, is the
constant need to upgrade signatures [16]. Although most systems require updating, this
can sometimes be overlooked by operators and can cause the systems to be vulnerable to
the most recent exploits. The next limitation is that the IDS cannot secure a system that
has poor authentication and identification protocols [16]. This is because of spoofing, the
introduction of normal behavior into the system that is identical to the traffic of the real
control station. For example spoofing, can be a problem with a system which records
pressure data, as it can allow false reports of the actual pressure measurement and cause

12
the operator to correct a system that is not actually in need of a control action, possibly
over-pressurizing the system. The above example is similar to the Aurora attack that was
designed for a power system and caused a generator to be in a critical condition. The
attack was able to use legitimate requests to place the generator into an out-of-phase state
that would cause harm to the system [5]. The last limitation that will be discussed is the
problem with analyzing encrypted traffic. An IDS is not able to inspect packets deeply if
the traffic is encrypted; therefore, traffic must be unencrypted before any attempts to
analyze it occur. The problem lies in processing times and may inhibit the IDS from
performing in real time. Although there are some limitations of an IDS, it still performs
an important role in securing networks.
IDSs are commonly used in computer networks (firewalls, etc.) and virus
software, but they are emerging in the industrial control system world. These systems
have been important in protecting web servers and personal computers and are now a
field of research for ICS professionals. Many reasons to implement an IDS in SCADA
systems have been discussed above. For example, highly critical infrastructure is
dependent on many specialized protocols that are designed with ease of use and
reparability in mind, rather than security [15]. These systems are highly reliant on the
operators and are in need of an automated approach to monitoring the system’s normal
activity. There are many studies to provide a broad approach which can be easily
distributed to system operators to improve security.
A recent approach for an IDS to be implemented on SCADA systems was
demonstrated in “An unsupervised anomaly-based detections approach for integrity
attacks on SCADA systems”, by Abdulmohsen Almalawi et. al [17]. Almalawi proposed

13
that an unsupervised learning algorithm (pattern recognition) approach would perform
best on SCADA network traffic [17]. He tested the theory by using data from a real world
industrial system, a water plant, and experimented with two different types of algorithms
[17]. Almalawi used many pre-processing techniques, massaging the input to improve
results in an algorithm while preserving the integrity of the data, to control noise that was
within the dataset from the water plant [17]. Almalawi then processed the dataset through
his clustering algorithm, a behavior analysis technique [17]. He concluded that his type of
behavioral approach shows promise and can accomplish high detection results within this
field [17]. With the fixed-width algorithm, Almalawi was able to achieve a detection rate
of over 90% with less than .01% false-negatives. The only concern was the processing
time, and complexity of the algorithms, and the data set contained no examples of attack
behavior and should be researched further to improve the efficiency of the process [17].
Another example of this automated approach is outlined in “Improving Security for
SCADA Sensor Networks with Reputation Systems and Self-Organizing Maps”, by Jose
M. Moya et. al [18]. Moya also used unsupervised learning algorithms, but he took into
account the severe processing power that is required to use these techniques. Moya first
trained the algorithm with a dataset of only normal activity [18]. This built clusters,
which he can then use to classify anything outside of these normal activity clusters as
anomalous. By creating the clusters before operation, Moya reduced the processing that is
required during normal operation of the IDS. He combined this with a quantization error
which can decipher attack traffic that is similar to normal traffic [18]. The quantization
error is calculated from the distance of that specific packet to the centroid of the cluster
[18]. If the distance is beyond a threshold, it is considered anomalous. Attack traffic

14
similar to normal is a common problem when spoofing is involved, as it can create
legitimate requests that are identical in structure to normal traffic. The quantization error
is able to place many spoofed packets in the anomalous clusters rather than cause a false-
negative [18].
There are some products which are already used in many real life systems and do
not use the novelty approach above. Many of these solutions require signature databases
or rules generated by the operator. The Snort IDS is an example of one of these products.
Snort IDS is a NIDS that is able to log and analyze real time SCADA network traffic
[19]. Snort has the capability of examining network packets and also deep packet
inspection, the ability to explore information within the payload of a packet. This type of
product is dependent upon a ruleset defined by the operator of a system [19]. The ruleset
is either a database of signatures or rules created by a professional in the field [19].
“Snort is, by far, the gold standard among open source NIDS systems, with over 100,000
users and 3 million downloads to date” [19]. The Snort IDS is also free, which allows any
company to install this type of system to increase the number of security layers within
their systems [19]. This type of IDS is effective for known attacks, but struggles with
attacks that are similar to normal traffic and places the system in states that are defined.
Another product that is used for IDS is Bro. Bro is not commonly used in
commercial systems, but rather for research. Bro can be adjusted to work with almost any
computer based communication protocol. In “Adapting Bro into SCADA: Building a
Specification-based Intrusion Detection System for the DNP3 Protocol”, by Hui Lin et al.
is able to use Bro in a SCADA system that uses the DNP3 protocol [20]. DNP3 is a
commonly used communication protocol in SCADA type systems. Bro uses a similar

15
detection scheme as Snort, but instead of using a ruleset, it uses known signatures of
attacks. Lin uses Bro to recognize semantics and provide validation of the DNP3 protocol
in the SCADA traffic [20]. Bro provides detection on attacks that replay previous packets
for denial of service [20]. Protection is also provided for created cyclic redundancy check
errors and attacks that cause unstable system states [20]. The denial of service attacks can
be detected just from observing the patterns that these attacks exhibit [20]. Recognition of
unstable state attacks requires knowledge about the system. Bro and Snort both require
databases for signatures. Almalawi and Moya both use machine learning algorithms
which do not require a database to understand the difference between normal and
anomalous behavior. Their approaches train MLAs against a dataset which automatically
categorizes or clusters the data into these categories. Both of these approaches use
completely independent datasets to test their methods which makes comparison of the
two approaches difficult. The next section will discuss many of the datasets and test beds
that are available for researchers to use and why the proposed dataset is needed.
2.3 SCADA Datasets and Test Beds
SCADA datasets and test beds can be used to analyze the performance of IDSs.
IDS researchers lack a common framework to train and test proposed algorithms. This
leads to an inability to properly compare proposed IDSs and limits research progress.
Many of the datasets used by researchers do not contain all types of attacks and gauging
the performance of the IDS is hard when all patterns of attack are not considered. In
[17][18], Almawali and Moya use separate datasets to test the performance of their IDS.
In the case of Almawali, the dataset used in his research was from a water treatment
plant. Although his dataset was from a real world system, it was not possible for him to

16
run attacks or simulate a fault against a system which is providing services to the world.
These unknowns make it difficult to gauge the effectiveness of his IDS. Similarly, Moya
did not provide an in depth discussion of the data used in his research. He states the data
is from a simulated sensor network and it contains attack patterns within. There are
several other researchers providing IDSs to the community by using their individual
dataset [22][23][24]. In “Building a SCADA Security Testbed” by Mahmood et al
describes his testbed which is meant to provide a simulation of a real SCADA system and
is able to connect to multiple real world systems [22]. This test bed allows researchers to
run attacks against his model and test IDSs against attacks. The problem with the test bed
is that it is not able to provide a dataset that is from a real system and the attacks run
against the system may not be comprehensive. In [23] “Using Model-based Intrusion
Detection for SCADA Networks” by Cheung et al, the researchers used a dataset
collected on a SCADA test bed located at Sandia National Laboratories. This dataset is
said to only contain reconnaissance type attacks on the Modbus TCP protocol. There IDS
is not being tested against other categories of attacks including injection and denial of
service (DoS). In [24] “Anomaly-Based Intrusion Detection for SCADA Systems” Yang
et al use a dataset which was collected on an Idaho National Lab’s simulation of a
SCADA system. The dataset contains both DoS and injection type attacks, but does not
include the reconnaissance attacks. A common dataset is needed to provide third-party
validation of IDS solutions. The dataset from this research has been created to fill the
void in this area. The next chapter will provide a detailed description of the dataset
created.

17
GAS PIPELINE DATASET
3.1 Introduction
The 1999 DARPA dataset produced by MIT’s Lincoln Labs [25] was created with
the intent for researchers to test viable Intrusion Detection Systems (IDS) for
effectiveness. The dataset has been a vital part in furthering research for evaluating
computer network IDSs and provides a benchmark for other researchers to compare and
validate results. The dataset was collected from a simulated Air Force base network
connected to the Internet. The simulated network produced a dataset that contained
network traffic in the form of a tcpdump. The information within the dataset includes the
sniffed network packets, Sun BSM data, file system information, and process information
for the purpose of identifying anomalous behavior contained within the collected
timeframe.
The various attacks which were carried out on the system are thoroughly
explained in the thesis of Kendal [25], but a brief explanation will be provided below.
The attacks are categorized into five groups: Data Attacks, User to Remote (U2R),
Remote to Local (R2L), Denial of Service (DoS), and Probe. The data attacks were used
to extract files in which the security policy states that the files should remain on the host
computer. This means that files that were secret or confidential were allowed to leave the
computer which was accessed by a legitimate user. The U2R attacks allowed a local user

18
to elevate privileges to communicate to a remote location. The R2L attacks allowed an
attacker to gain access to a victim’s machine and extract files or modify data in transit
from the victim’s machine. DoS attacks were designed to disrupt transmission of data
from network services. The last category of attacks included in the DARPA dataset are
probing attacks. This category of attacks aimed to collect information about the specific
system, such as IP addresses of local machines, open ports, and local operating systems.
By including attacks and normal activity within the dataset, researchers are able to create
IDSs tailored towards these applications. The same holds true for SCADA systems, but
currently a dataset does not exist which is accessible to all researchers and includes
various types of attacks.
3.2 Previous Work
The dataset proposed and created for this research is a second iteration of a
previous dataset from a gas pipeline system to fill the void in IDS research for SCADA
applications. The first iteration of the dataset was created by Wei Gao [7]. Gao’s dataset
was found to contain obvious patterns, which caused algorithms to appear to have
extremely high detection rates, up to 100%. The paper by Thornton et al. was initially
written to determine if machine learning algorithms could be used for anomaly detection
in SCADA systems. They also wanted to determine how effective these machine
learning algorithm by testing them with the Gao dataset. but instead, found the datasets
contained many serious issues [26]. The conclusions of the paper showed that the dataset
was unsuitable for IDS research due to obvious correlations between particular
parameters and the result to be predicted by the algorithms. These correlations are

19
unrealistic in real SCADA transactions and renders the datasets unsuitable in their current
form [26].
Many of these unrealistic transactions were caused by the system being placed
into only three different state configurations. To rid the dataset of these obvious patterns,
a new process was created to place the system into all possible state configurations that
represent normal operation of the gas pipeline. The states were chosen in random order to
reduce the chance of unintended patterns. Another factor that caused obvious patterns
within the dataset was the invariable attacks that were run against the system. The attacks
were static and did not contain dynamically changing parameters. The new process of
collecting the dataset also addressed this problem by parameterizing and randomizing the
order in which the attacks were executed. New attacks were also created in conjunction
with the existing attacks created by Gao [7]. The gas pipeline system which was used in
the creation of these datasets is discussed below.
3.3 Gas Pipeline System
The gas pipeline system used to collect the datasets was provided by Mississippi
State University’s in-house SCADA lab. The system consists of three major components:
sensors and actuators, a communication network, and supervisory control. Below is a
picture of the physical system along with the iFIX HMI.

20
Figure 3.1 Gas Pipeline System and HMI
At the lowest level, the gas pipeline contains two actuators along with a pressure
sensor. The actuators, a pump and a solenoid, are used to control the physical process of
the system, to maintain the pressure set by the supervisory controls. The gas pipeline has
three main system modes: automatic, manual, off. When the system is in automatic mode,
there are two schemes to maintain the pressure which are decided by the supervisory
controls. The first scheme is pump mode, which turns the pump on and off to keep the
pressure in the pipe at the set point. This scheme was created to simulate a constant load
on the system. The second scheme is solenoid mode, in which a relief valve controlled by
a solenoid is opened and closed to regulate pressure. Both the pump and solenoid modes
used a Proportional-Integral-Derivative (PID) control scheme. The system mode can also
be in manual mode which allows the operator to manually control the pump and solenoid.
The next component is the communication network in which the protocol used is
serial Modbus RTU. Modbus packets include a header and a payload. For Modbus over a
Serial Line, a packet includes a device address, function code, payload, and a cyclic

21
redundancy code (CRC) or linear redundancy code (LRC). Modbus/TCP packets include
a Modbus Application Protocol (MBAP) header, function code, and payload. The MBAP
header includes a transaction identifier, protocol identifier, length, and device identifier.
The device identifier is similar to the Modbus over Serial Line address. The data sets
described in this work are taken from a Modbus over Serial Line; however, they can be
safely used as a proxy for Modbus/TCP data with the exception there is no transaction
identifier, protocol identifier, and length field. The diagram below provides a visual
representation of a Modbus TCP and RTU packet.
Figure 3.2 Modbus RTU and TCP packet [21]
The transaction identifier is generally a count of transaction numbers. The
protocol identifier is always 0 for legal Modbus/TCP packets, and the length is the
number of bytes in the payload plus 1 byte for the function code.
Inside, the payload Modbus/TCP and Modbus over Serial Line packets are
identical. Modbus read and write commands are the most common command types. Read
and write payloads include additional packet attributes such as coil or register addresses,
quantities of requested or returned coils or registers, coil or register contents, error codes,

22
and exception codes. Some exceptional commands, such as the Diagnostic, file record
access, mask write, and read FIFO commands include sub function codes, and other
attributes to describe specific queries and responses.
The last component in the gas pipeline is the supervisory controls. These include
the MTU and the iFIX HMI. The MTU is set up in a one-to-many configuration, meaning
that all slave devices (RTUs) receive their controls from the one MTU, and the many
RTUs respond back to the MTU. The HMI connects to the MTU and provides an
interface for a human operator to monitor the system and provide supervisory controls
when needed.
In the next sections of this chapter the process in which the dataset was collected,
along with a detailed description of the dataset, are provided. The chapter will also
include a discussion to show that unintentional trends have been eradicated from the
dataset.
3.4 Dataset Collection Methodology
A new method of providing stimulus and collecting data logs was used to create
the dataset. The first step for improving the dataset was to parameterize and randomize
the order in which the attacks were executed. The execution was done by taking all
attacks from [7] and implementing them in a man-in-the-middle fashion. The purpose of
the man-in-the-middle method is to include all types of attacks as shown in the diagram
below.

23
Figure 3.3 Types of Cyber Threats[27]
Interception refers to attacks which are sent both to the attacker and to the initial
receiver. These types of attacks allow attackers to gain information about the each node’s
protocols, normal operation, and even the brand and model of the RTUs that the system is
utilizing. Interruption attacks are used to block all communication between two nodes in
a system. This type of attack would be a Denial of Service (DoS) between the MTU and
the RTU slave device in the gas pipeline. The modification attacks allow an attacker to
modify parameters or states in a system. In terms of the gas pipeline, an attacker could
modify the set point parameter exclusively and leave all other parameters untouched.
Similarly, the fabrication attacks allow for execution by completely creating a new packet
to be sent between the MTU and RTU. The attacks in the gas pipeline dataset fit into
these categories, but are broken down even further. The categories of attacks contained in
the dataset are shown in the table below.

24
Table 3.1 Attack Categorization
Type of Attacks Abbreviation Threat Type
Normal Normal(0) N/A
Naïve Malicious Response Injection NMRI(1) Modification/Fabrication
Complex Malicious Response Injection CMRI(2) Modification/Fabrication
Malicious State Command Injection MSCI(3) Modification/Fabrication
Malicious Parameter Command Injection MPCI(4) Modification/Fabrication
Malicious Function Code Injection MFCI(5) Modification/Fabrication
Denial of Service DoS(6) Interruption
Reconnaissance Recon(7) Interception
The parameterization was accomplished by establishing ranges for which each
attack operates. These ranges are created to provide a coverage of all possible attacks that
could be executed on a specific parameter. For example, the set point manipulation attack
modifies the set point parameter that controls the pressure level in the gas pipeline. This
attack ranges from extreme levels to ranges that are within normal operations. Once the
parameterization of each attack was accomplished, an algorithm to execute the attacks in
a random order was designed.
The algorithm’s intent is to allow for all attacks to execute an equal number of
times and to reduce the unintended patterns that were found in the first iteration of the
dataset. This does not necessarily mean the same number of attack packets will be created
or modified for all attacks, as some attacks require fewer packets to execute while others
require more to execute. For example, the function code scan attack is intended to scan
all function codes which exist in the Modbus framework. The number of packets required
for this attack will be significantly higher than the number to manipulate the set point

25
parameter. Once randomization of the attack patterns was implemented, the states that
were considered normal are also randomized. To accomplish the randomization of normal
states, an Auto IT script was coded to allow direct interaction with the iFIX HMI. Auto
IT is a Windows scripting language which allows programmers to automate interaction
with GUI’s, in this case a HMI. It is able to simulate mouse movements and keyboard
inputs of a process control network operation. The HMI controls and displays
information regarding the gas pipeline. It provides a visual representation of the current
state and operation of the gas pipeline. The Auto IT script simulates an operator changing
the system state and the PID parameters. During testing of the system, there are physical
constraints which prevent the pump from constantly being turned on. Therefore, the script
must allow the pump to have a cool down time of twenty minutes and a running time of
seven minutes. The script in turn runs the system at a 25.9% duty cycle.
A datalogger was also implemented to record only the packets which are received
by either the MTU or the RTU. The data logger sits on the man-in-the-middle PC and
was directly integrated into the attack framework through the use of C file input and
output. Figure 3.3 below illustrates the entire process.

Figu
re 3
.4
Proc
ess F
ram
ewor
k/M
etho
dolo
gy
26

27
3.5 Dataset Description
The datasets provided from this work are in two forms. The first form is a comma
separated value (CSV) text file. The second form is an Attribute Relationship File Format
(ARFF). The ARFF dataset was created to be used with WEKA. Waikato Environment
for Knowledge Analysis, WEKA, is a tool which has a comprehensive list of machine
learning algorithms [28]. WEKA has been used by many researchers in the IDS field for
testing the performance of specific algorithms. The organization of the dataset provided
represents one packet being delivered to either the MTU or to the RTU. Each instance in
the dataset contains network traffic information along with payload information. The
network information provides a pattern of communication for intrusion detection systems
to train against. Unlike Information Technology (IT) networks, SCADA systems have
network topologies which are fixed and the transactions between the nodes are repetitive
and regular. This static behavior is conducive to IDSs to detect anomalous activity. The
second category of features is that of payload information. The payload information
provides information about the gas pipeline’s state, settings, and parameters. These
values are vital to understanding how the system is performing and detecting if the
system is in an out-of-bounds or critical state. There are a total of 274,627 instances in
each dataset. Each row in the dataset contains multiple columns, which are commonly
referred to as features. These features will be discussed further in detail below. The
consequence of representing each Modbus frame as a row in the dataset is that not all
frames contain the same information, and many features are unknown for some instances.

28
3.5.1 Raw Dataset
A raw unprocessed dataset is provided. The dataset contains raw network traffic
data. The purpose of providing the raw data is to provide a way of validating the
legitimacy of the preprocessed, ARFF dataset, and to allow for researchers to preprocess
with their own specialized methods. There are six features for each instance in the raw
dataset. The first feature contains the Modbus frame that was received by either the
master or slave device. The Modbus frame contains all information from the network,
state, and parameters of the gas pipeline. The frame can be processed by determining the
function code which the system is using and utilizing the memory mapping provided in
Appendix A. The diagram in Appendix A contains the register values for both the master
and slave side PLCs. The memory mapping also provides the information that is
contained within each register such as set point, PID parameters, and state information.
The frame can be preprocessed into separate features for each register on the PLC. The
diagram below details an example Modbus frame for a write command from the MTU to
the RTU.
Figure 3.5 Modbus Frame

29
The register that is being written to in this write command is register 40002. In the
Modbus protocol, read and write register values start at 40000. These registers contain
the state and parameter information for the entire gas pipeline system. The ARFF dataset
provides some features that have been extracted from these register locations.
The second and third feature in a raw dataset row represent the category of attack
and specific attack that was executed. The specific category values are described in
Tables 3.5, 3.6, 3.7, and 3.8. The second feature is the major category (Table 3.5) and the
third feature is the specific attack (Tables 3.6, 3.7, and 3.8). In the case of a normal
operation Modbus frame, both of these features will report a zero. Both of these features
are necessary to train a supervised learning algorithm, as they allow the algorithm to
learn the behavior of these attack patterns. The diagram later in the section will provide a
one to one representation of the label and description to the categories and specific
attacks.
The fourth and fifth features in a raw dataset row represent the source and
destination of the frame. There are only three possible values for the source and
destination feature. The value can be a ‘1,’ which represents the master device sent the
packet, a ‘2,’ meaning the man-in-the-middle computer sent the packet, or a ‘3,’ which
means the slave device sent the packet. The purpose for this field is to provide a label to
explain the origin of the packet and to aid in the preprocessing of the raw dataset. The last
feature in the raw dataset contains a time stamp. The time stamp can be used to calculate
a time interval which could be used to help with an IDS. In normal operation of the
system, the time interval may only marginally change, but malicious command injection

30
or modification may lead to a larger time interval change. The figure below provides an
example row from the raw dataset.
Figure 3.6 Instance within Raw Dataset
3.5.2 ARFF Dataset
The ARFF dataset was created to be used with WEKA. It contains twenty
features, some of which are the same as in the raw dataset. The table below lists all
twenty features.

31
Table 3.2 Feature List
Features
address control scheme
function pump
length solenoid
setpoint pressure measurement
gain crc rate
reset rate command response
deadband time
cycle time binary result
rate categorized result
system mode specific result
The first feature contains the station address of the slave device. The station
address is a unique eight bit value that is assigned to each master and slave device. The
address is used to identify the slave that the master is transmitting commands to and the
slave which is responding. The Modbus protocol is configured so that all slave devices
receive all master transactions. The slave device must check the station address field to
determine if the message is intended for itself or for a different slave device. This feature
is used to enhance detection of device scan attacks, which broadcast commands to all
possible station addresses to determine which addresses are operable. The second feature
contains the function code. The function codes primarily used in the gas pipeline are read
(0x03) and write commands (0x16), but a possibility of 256 different function codes
exist. Some of these function codes can be used for malicious purposes, such as function
code ‘0x08’. The ‘0x08’ function code is generally used for diagnostics purposes, but it

32
can be used to force a slave device into a listen only mode. An attack like this would
cause a denial of service using a valid function code. IDSs can utilize this feature to
detect function codes which are out of the ordinary. The third feature contains the
Modbus frame length. Similar to the function code, the length of the Modbus frame is
fixed for each command or response query. In the gas pipeline system, a set of write and
read commands are used to repeatedly perform block writes and block reads from
specific registers. In detection of attacks, frames which are not of a specific length are
easily detected as anomalous.
The fourth feature contains the set point value that controls the pressure in the gas
pipeline. The set point feature is utilized when the gas pipeline system mode is set to
‘automatic’. The slave ladder logic attempts to maintain the set point value provided by
either opening a solenoid valve or turning on and off the pump. The set point feature
effects the physical system drastically and would be a common point of malicious intent
for an attacker. The next five features represent the PID controller values. Gain, reset
rate, dead band, cycle time, and rate are all values which are used to tune the PID
controller. An error is calculated based on these five parameters and allows the PID
controller to open and close the relief valve or turn on and off the pump to minimize the
error.
The tenth feature contains the value which controls the system’s duty cycle. There
are only three possible values which are valid and are shown in the table below.

33
Table 3.3 System mode features
System Mode Feature
0 Off
1 Manual
2 Automatic
Since the gas pipeline is configured to have a 25.9% duty cycle, the system mode
feature is generally set to ‘0’ unless the system is active. The eleventh feature in the
dataset is the control scheme feature. The control scheme in the gas pipeline determines
whether the system will be controlled by the pump or by the solenoid. If the control
scheme is set to pump, ‘0’, the solenoid will remain opened and the pump is cycled to
maintain gas pressure at the set point. The pump will continue to pump against the
opened solenoid which simulates a load in a real gas pipeline. If the pump is set to
solenoid, ‘1’, the pump is constantly on and the pressure is controlled by opening and
closing a solenoid valve to allow pressure to escape.
The twelfth feature controls the pump state only if system mode is set to manual.
The feature can only be two values off, ‘0’, or on, ‘1’. The system can be put into a
critical state if an attacker were able to change the system mode to manual and turn the
pump on. This type of attack could over pressurize the system and cause serious physical
damage. The thirteenth feature controls the state of the solenoid valve when the system is
also in manual mode. There are only two possibilities for this feature ‘0’, closed, and ‘1’,
opened. Similar attacks to that of the pump feature could cause serious damage to the
system by over or under pressurizing the system. The fourteenth feature contains the

34
current pressure measurement from the gas pipeline. The measurement is being provided
by a pressure gauge attached to the pipeline and the data is stored in a register. The
register is read by the master device and displayed on the HMI. This feature can be used
in many attacks to provide a false measurement to imitate behavior that is not actually
occurring in the system. The fifteenth feature contains the cyclic redundancy check
(CRC). The cyclic redundancy check allows the system to check for errors within a frame
that is being provided to either the master or the slave device. An attacker could
constantly transmit a bad CRC to cause a DoS style attack. In Modbus-TCP, the CRC
feature does not exist, the CRC is provided by the TCP frame. The sixteenth feature is
provided to allow an IDS to learn the difference between commands and responses. The
value can either be a ‘0’ for response or ‘1’ for command. This information is not parsed
from the Modbus frame itself, but rather is provided to aid in the preprocessing step. The
last four features, time stamp, specific attack, category attack, and binary attack, were
also provided in the raw dataset. Tables 3.5 -3.6 detail all of the features with their
respective type that are provided in the dataset.

35
Table 3.4 Feature list
Feature Type
address Network
function Command Payload
length Network
setpoint Command Payload
gain Command Payload
reset rate Command Payload
deadband Command Payload
cycle time Command Payload
rate Command Payload
system mode Command Payload
control scheme Command Payload
pump Command Payload
solenoid Command Payload
pressure measurement Response Payload
crc rate Network
command response Network
time Network
binary attack Label
categorized attack Label
specific attack Label
As discussed in the introduction, Flame, Stuxnet, and Aurora have caused
tremendous worry and have called in to question the security of current SCADA systems.
Cyber threat and vulnerability research show the security challenges that SCADA

36
systems face and demonstrate many different approaches. As discussed in Chapter II
researchers analyzed many different attack vectors and showed the security challenges
that face the SCADA systems. In these papers, the researchers demonstrated several
categories of attacks such as command injection, reconnaissance, and denial of service on
current SCADA protocols. Since these protocols are open standards it allows everyone to
study all angles of attack and provide security solutions. In order to provide a dataset for
SCADA IDS research many of these types of attacks must be executed against the
SCADA system. The attacks that are used in this data were found in Gao’s [7] research.
Gao developed seven categories of attacks. A table of these categories is provided below.
Table 3.5 Categories of attacks [7]
Type of Attacks Abbreviation
Normal Normal(0)
Naïve Malicious Response Injection NMRI(1)
Complex Malicious Response Injection CMRI(2)
Malicious State Command Injection MSCI(3)
Malicious Parameter Command Injection MPCI(4)
Malicious Function Code Injection MFCI(5)
Denial of Service DoS(6)
Reconnaissance Recon(7)
The seven categories of attacks are split into four overall categories: command
injection, response injection, denial of service (DoS), and reconnaissance. The
description of the attacks was found in Gao’s work and is summarized below [30]. All
attacks have been slightly modified in this work, but are similar in behavior. The

37
command injection attacks contain malicious state command injection (MSCI), malicious
parameter command injection (MPCI), and malicious function code injection attacks
(MFCI). The response injection attacks provide two types of behaviors. The first is naïve
malicious response injection (NMRI) which has sporadic and out of bounds behavior that
would not be present in normal operation. These attacks generally occur when the
malicious attacker lack information about the physical system process. The second type
of response injection is complex malicious response injection (CMRI). These attacks
leverage the state and physical process information to design attacks which mimic certain
normal behaviors.
Table 3.6 Cyber attacks 1-12
Attack Name Number Type Description
Setpoint Attacks 1-2 MPCI Changes the pressure set point outside and inside of the range of normal operation.
PID Gain Attacks
3-4 MPCI Changes the gain outside and inside of the range of normal operation.
PID Reset Rate Attacks
5-6 MPCI Changes the reset rate outside and inside of the range of normal operation.
PID Rate Attacks
7-8 MPCI Changes the rate outside and inside of the range of normal operation.
PID Deadband Attacks
9-10 MPCI Changes the dead band outside and inside of the range of normal operation.
PID Cycle Time Attacks
11-12 MPCI Changes the cycle time outside and inside of the range of normal operation.

38
The next category of attacks are reconnaissance attacks. Reconnaissance attacks
are designed to collect information about the system through some passive gathering, or
by forcing information from a device. The information can include network information
(state address, length, crc, etc.), or device characteristics (model number, communication
protocol, manufacturer, supported function codes).
CMRI attacks provide a level of sophistication over that of NMRI attacks. They
mimic certain behaviors which occur within normal bounds. These injected states are
leveraged to cause the system to lose efficiency, or cause loss of product and money.
These attacks can be used to hide state changes which can occur in command injection
attacks. Since these attacks inject states which display normal operation they become
more difficult to detect.

39
Table 3.7 Cyber attacks 13-23
Attack Name Number Type Description Pump Attack 13 MSCI Randomly changes the state
of the pump. Solenoid Attack 14 MSCI Randomly changes the state
of the solenoid. System Mode Attack
15 MSCI Randomly changes the system mode.
Critical Condition Attacks
16-17 MSCI Places the system in a Critical Condition. This condition is not included in normal activity.
Bad CRC Attack 18 DoS Sends Modbus packets with incorrect CRC values. This can cause denial of service.
Clean Registers Attack
19 MFCI Cleans registers in the slave device.
Device Scan Attack 20 Recon Scan for all possible devices controlled by the master.
Force Listen Attack 21 MFCI Forces the slave to only listen.
Restart Attack 22 MFCI Restart communication on the device.
Read Id Attack 23 Recon Read ID of slave device. The data about the device is not recorded, but is performed as if it were being recorded.
MSCI, MPCI, and MFCI attacks inject control configuration commands to modify
the system state and behavior. There are several impacts command injection attacks can
cause such as “loss of process control, interruption of device communications,
unauthorized modification of device configurations, and unauthorized modification of
process set points” [30]. MSCI attacks are designed to modify the state of the current
physical process. These types of attacks can place the system into a critical state which
can cause harm to the system and even the lives of the operators. MPCI attacks modify

40
parameters which determine set point and PID configurations. MFCI attacks inject
commands which exploit network protocol commands to change the behavior of the
network. Denial of Service (DoS) attacks attempt to disrupt communications between the
control and the process. This can be done through interruption of wireless networks, or
network protocol exploits.
Table 3.8 Cyber attacks 24-35
Attack Name Number Type Description
Function Code Scan Attack
24 Recon Scans for possible functions that are being used on the system. The data about the device is not recorded, but is performed as if it were being recorded.
Rise/Fall Attacks
25-26 CMRI Sends back pressure readings which create trends on the pressure reading’s graph.
Slope Attacks 27-28 CMRI Randomly increases/decreases pressure reading by a random slope
Random Value Attacks
29-31 NMRI Random pressure measurements are sent to the master.
Negative Pressure Attack
32 NMRI Sends back a negative pressure reading from the slave.
Fast Attacks 33-34 CMRI Sends back a high set point then a low setpoint which changes “fast”
Slow Attack 35 CMRI Sends back a high setpoint then a low setpoint which changes “slow”
Tables 3.6-3.8 provide a list and description for each of the 35 attacks within the
dataset. Many of the specific types of attacks run on this system are general and can be
applied to almost all types of systems. Therefore, this dataset can be used for research
inside and outside of the industrial control system area. The next section will discuss why
the proposed dataset is more suitable for IDS research than Gao’s dataset.

41
3.6 Dataset Validation
This section provides a detailed validation of why the new dataset has improved
from the previous dataset. The validation is provide by calculations comparing the two
datasets.
The dataset was run through a subset of the tests that are found in [26] to
determine if the patterns from Gao’s dataset have been eradicated. This paper was written
by Zac Thornton, Jeff Hsu, and David Mudd to determine if machine learning algorithms
could be used for anomaly detection in SCADA systems. They also wanted to determine
how effective these machine learning algorithm by testing them with the Gao dataset.
[26]. The end results showed that the Gao’s gas pipeline dataset contained unintended
patterns. This same procedure was followed to determine if the new dataset contained
similar patterns. Since the dataset contains 275,000 instances, the algorithms required a
significant amount of time and memory to execute. This was also expressed in Thornton
et al.’s paper and was addressed by using a 10% subset of Gao’s dataset. The process
used to acquire the 10% from the 100% was not conveyed in the paper, as such the
algorithms used were chosen to reduce time and memory constraints.
Table 3.9 List of Algorithms
Algorithms Category
Naïve Bayesian Network Bayes
PART Rule-Based
Random Tree Decision Tree
Multilayer Perceptron Neural Network

42
Step one in comparison of the old and new datasets was to use the datasets with
the machine learning algorithms listed in Table 3.9. Classification accuracy results from
the algorithms were collected and compared to that of Thornton et al.’s results. Table
3.10 below illustrates the differences between the two datasets.
Table 3.10 Results of Algorithms
Algorithm New Dataset Classification Accuracy
Gao’s Dataset Classification Accuracy
Naïve Bayesian Network 80.39% 98.5%
PART 94.14% 99.32%
Random Tree 99.7% 99.9%
Multilayer Perceptron 85.22% 100%
Table 3.10 shows the algorithms have become less accurate at detecting
anomalies using the new datasets and this is the direct result of the new methodology that
was used to create the dataset. Classification accuracy cannot be the only statistic
analyzed when determining the effectiveness of algorithms. False positive (FP) rates,
precision, and recall are equally as important. False positive is an important statistic, as it
can reveal discrepancies when it comes to the percentage of normal activity vs attack
activity. For example, if system A has 99% of all traffic being normal while only 1% of
the traffic being considered anomalous, then an IDS could consider all traffic to be
normal and achieve a true positive rate of 99% which may sound good, but in reality it
did not detect any of the 1% of anomalous traffic. The table below shows the percentage
of attack and normal traffic in each dataset.

43
Table 3.11 Percentage of attacks in dataset
Dataset Percentage of Attack Instances Percentage of Normal Instances
New Dataset 21.9% 78.1%
Gao’s Dataset 37.1% 62.8%
The discrepancy between normal and attack scenarios is shown through the kappa
statistic. The kappa statistic provides a metric to quantitatively show the agreement
between two observers. The statistic shows the percentage of agreements between two
observers who randomly assign each instance in the dataset a label. The kappa statistic
for the dataset is 83.1%. This means that 83.1% of all randomly assigned instances by the
observers (knowing the percentage of attack vs normal traffic) match-up.
Further analysis was conducted using the PART algorithm. The PART algorithm was
chosen as it is a rule-based algorithm which is well suited for a fixed-network topology
that has regular communication patterns. It was used because it highlighted the many
differences which show the benefits of the proposed dataset. It also provides results
which detail exactly which categories of attacks have reduced patterns. Further analysis
was also conducted using the three other algorithms, but is not provided in this research.
The results from the other algorithms support the results of the PART algorithm. Tables
3.12-3.14 show exactly which categories of attacks were not detected using the PART
algorithm.

44
Table 3.12 Comparison of False Positive Rates
Category New Dataset FP (%) Gao’s Dataset FP (%) Normal 20.7% 1.1% NMRI .8% 0% CMRI .5% .1% MSCI 0% 0% MPCI 0% .2% MFCI 0% 0% DoS 0% 0% Recon 0% 0%
Table 3.12 shows that 20.7 % of attack traffic is falsely reported as normal and
not as a category of attack compared to that of 1.1 % in the Gao dataset. This result
shows an improvement from the Gao dataset because the attacks are harder to decipher
from normal without further preprocessing or feature selection techniques. Inspection of
precision and recall reveals the exact attack categories in the new dataset which are being
classified incorrectly. Precision is the ratio of the number of instances classified correctly
as a category of attack and the total number of instances classified as that category of
attack. The equation below shows how precision was calculated for NMRI attacks.
𝑃𝑟𝑒𝑐𝑖𝑠𝑖𝑜𝑛 =# 𝑜𝑓 𝑖𝑛𝑠𝑡𝑎𝑛𝑐𝑒𝑠 𝑐𝑙𝑎𝑠𝑠𝑖𝑓𝑖𝑒𝑑 𝑐𝑜𝑟𝑟𝑒𝑐𝑡𝑙𝑦 𝑎𝑠 𝑁𝑀𝑅𝐼
𝑡𝑜𝑡𝑎𝑙 # 𝑜𝑓 𝑖𝑛𝑠𝑡𝑎𝑛𝑐𝑒𝑠 𝑐𝑙𝑎𝑠𝑠𝑖𝑓𝑒𝑑 𝑎𝑠 𝑁𝑀𝑅𝐼 (3.1)
Precision will provide a metric to determine the instances classified into a category of
attack against how many are actually of that category.
Recall is the ratio of the number of instances that are classified correctly as a
category of attack and the total number of instance in that category of attack. In the case
of NMRI attacks, the calculated recall is shown below.

45
𝑅𝑒𝑐𝑎𝑙𝑙 =# 𝑜𝑓 𝑖𝑛𝑠𝑡𝑎𝑛𝑐𝑒𝑠 𝑐𝑙𝑎𝑠𝑠𝑖𝑓𝑖𝑒𝑑 𝑐𝑜𝑟𝑟𝑒𝑐𝑡𝑙𝑦 𝑎𝑠 𝑁𝑀𝑅𝐼
𝑡𝑜𝑡𝑎𝑙 # 𝑜𝑓 𝑁𝑀𝑅𝐼 𝑖𝑛𝑠𝑡𝑎𝑛𝑐𝑒𝑠 (3.2)
Recall provides a metric to determine the true positive ratio in a category of attack. The
table below provides the values for recall and precision for both datasets.
Table 3.13 Precision and Recall for Datasets
New Dataset Gao’s Dataset
Category Precision Recall Precision Recall
Normal 94.5% 99.9% 99.4% 99.5%
NMRI 74.2% 82.4% 99.5% 94.4%
CMRI 89.3% 82.1% 99.4% 99.9%
MSCI 99.3% 54.9% 97.4% 95.1%
MPCI 99.8% 63.9% 97.5% 98.0%
MFCI 98.6% 100.0% 100.0% 95.8%
DoS 99.6% 48.3% 99.8% 97.9%
Recon 100.0% 97.1% 100.0% 100.0%
Table 3.13 shows that the precision and recall for all attack categories in the Gao
dataset are high. Thus, there were very few instances where the PART algorithm was
unable to provide the correct classification and only 1.1% of the attack instances were
reported as normal conditions shown in Table 3.12. Table 3.13 also shows that the
precision in the new dataset is the lowest for the response injection attacks. The low
precision lies in the PART algorithms fault in differentiating between NMRI and CMRI

46
attacks. The confusion matrix below shows the misclassification of NMRI and CMRI
attacks.
Table 3.14 Confusion Matrix for NMRI and CMRI attacks
Category Predicted NMRI Predicted CMRI
Actual NMRI 6389 1148
Actual CMRI 2156 10703
The confusion matrix provides a look into exactly how the PART algorithm
categorized the two categories of attacks. The misclassification is due in part to the
randomness of NMRI attacks, which has the possibility of overlapping in values with the
CMRI attacks.
Table 3.12 also shows that the recall rates for DoS, MPCI, and MSCI are around
50%, but have high precision. This means that the instances considered to be these
categories of attacks were indeed from these categories, but suffered in discovering all
instances which were from each category of attack. In the case of the DoS attacks, only
48.3% of instances were classified correctly. The reason for the low recall was because of
the Bad CRC attack. The Bad CRC attack injected an incorrect CRC value in a write
multiple register function command, which would cause the RTU to ignore the command
and in turn cause a DoS. The PART algorithm was able to correctly classify the write
command with the incorrect CRC value as an attack, but failed to classify the response
from the RTU as an attack. Therefore, the misclassification led to some skewing of the
results, and in reality, the detection of these attacks is greater than 98%. The
approximation was calculated by taking the precision into account and realizing that

47
99.6% of the commands that were thought to be DoS attacks were actually categorized as
DoS attacks. These result shows that the precision and recall for both the Gao dataset and
the new dataset are similar for the DoS attacks. The PART algorithm was still able to
detect the behavior of DoS attacks successfully and the new attack framework did not
change this fact, which is expected.
The low recall rates found in the MPCI and MSCI categories of attacks are a
direct result of the new attack framework. Since the system is now placed into all
possible normal conditions, the algorithms are forced to differentiate between multiple
normal conditions instead of just three that were provided in the old dataset.
In the case of the MPCI attacks, the set point and PID parameter coverage is greater in
the new dataset. Figure 3.7 highlights the differences in how the coverage of set point
values is different from the previous iteration of the dataset.

48
Figure 3.7 Differences between Setpoint Values
The bars labeled blue are normal behavior and the bars labeled red represent a
packet that contains an attack. The previous iteration of the dataset only allowed the
system to be in one normal configuration which was at 20 PSI. If the RTU did not receive
0
600
1200
0 31
Nu
mb
er o
f In
stan
ces
Setpoint
Setpoint New Dataset
Normal Attacks
0
10000
20000
30000
40000
50000
60000
70000
80000
90000
100000
20 80 90 70
Setpoint Gao Dataset
Attacks
Normal

49
20 PSI as the set point value, then it was blatantly obvious that the system was being
attacked. Thornton et al. expressed this in the future work section of their report,
“Setpoint only has unique 4 values: 20, 70, 80, and 90” [26]. Since the attacks were easily
detected, the high detection rates seen in Table 3.10 are unrealistic. This static behavior is
not only found in this feature of the dataset, but in most of the PID parameters as well.
Figure 3.8 illustrates the behavior in the gain PID parameter.
Figure 3.8 Gain Parameter Coverage
The new iteration provides more coverage by providing a range of values for each
parameter and is the direct cause to the lower detection rate.
The MSCI attacks were also effected in a similar way. The system was not being
placed into all system control modes and schemes which was causing easily detectable
patterns in the Gao dataset. This problem was mentioned in [26]. Figure 3.9 shows how
the system is now placed into all control modes.
0
2000
4000
6000
8000
10000
0 16
46
61
10
11
21
14
11
61
18Nu
mb
er o
f In
stan
ces
Gain
Gain New Dataset
Attacks
Normal
0
20000
40000
60000
80000
100000
120000
115Nu
mb
er o
f In
stan
ces
Gain
Gain Gao Dataset
Attacks
Normal

50
Figure 3.9 Differences between Control Modes
Now that the system is placed into all system modes, the measurement values are
more reflective of real behavior and have more variance. This also limits the number of
obvious attacks that were prevalent in the previous iteration of the dataset. Table 3.15 is
from Thornton et al.’s work and describes all the problems that were found in the
previous dataset.
Table 3.15 Identified Problems in the Feature list of Gao’s Dataset [26]
command_address setpoint control_mode
Always 4, unless DoS attack always 20 unless MPCI attack only 1 when MSCI
reponse_address resp_read_fun control scheme
always 19 unless Recon attack
only 1 when normal or CMRI attack
only 0 when MSCI
comm_read_function subfunction measurement
always 3 unless DoS attack always 0 unless MFCI attack All CMRIs in range 6-11 All NMRIs grossly out of bounds
0
10000
20000
30000
40000
50000
2 0 1
Control Mode New Dataset
Attacks
Normal
0
10000
20000
30000
40000
50000
60000
Auto Off Man
Nu
mb
er o
f In
stan
ces
Control Mode
Control Mode Gao Dataset
Attacks
Normal

51
Table 3.15 describes many of the obvious correlations between the features and
the attack patterns. The setpoint, res_read_fun, control_mode, control scheme,
subfunction, and measurement have been addressed by using the framework that was
described in the previous section and have shown to reduce the ease of detection. Some
of correlations are inherent to the system because of the repetitiveness of its interaction
with the slave device. These correlations should be embraced by the machine learning
algorithms to aid in detecting the anomalous behavior.
52
CONCLUSIONS
SCADA systems are becoming more vulnerable to outsider threats with increased
network connectivity. The need for industrial control system IDS research is increasing.
This thesis provides a set of labeled network data logs captured while a laboratory scale
gas pipeline was in normal states and under cyber-attacks as described. A new
methodology for implementing the attacks and a simulated operator have been
implemented to create these data logs. The data logs include artifacts of 35 cyber-attacks
and can be used to train and test classifiers u sed by IDSs. Comparison to a previous
iteration of the dataset was conducted to provide validation that the dataset has improved.
This was done by showing that obvious correlations between features and attack patterns
have been removed. The datasets will facilitate comparison of different IDS
implementations and provide third-party validation of results.

53
REFERENCES
[1] M. Pires; P.S. Oliveira, L.A.H.G., "Security Aspects of SCADA and Corporate Network Interconnection: An Overview," Dependability of Computer Systems, 2006. DepCos-RELCOMEX '06. International Conference on , vol., no., pp.127,134, 25-27 May 2006 doi: 10.1109/DEPCOS-RELCOMEX.2006.46
[2] S. Cherry, How Stuxnet Is Rewriting the Cyberterrorism Playbook. 2010. Available at: http://spectrum.ieee.org/podcast/telecom/security/how-stuxnet-is-rewriting-the-cyberterrorism- playbook accessed on 09.05.2014.
[3] W. Jones, "Flame: Cyberwarfare's Latest, Greatest Weapon." - IEEE Spectrum. IEEE, May 2012. Web. 27 Oct. 2014.
[4] J. Meserve, "Sources: Staged Cyber Attack Reveals Vulnerability in Power Grid." CNN. Cable News Network, Sept. 2007. Web. 27 Oct. 2014.
[5] J. Weiss, "Misconceptions about Aurora: Why Isn't More Being Done." InfoSec Island. N.p., 13 Apr. 2012. Web. 27 Oct. 2014.
[6] "Introduction to Industrial Control Networks" (PDF). IEEE Communications Surveys and Tutorials. 2012.
[7] T. Morris; W. Gao, Industrial Control System Network Traffic Data Sets to Facilitate Intrusion Detection System Research, Mississippi State University.
[8] M. Brundle; M. Naedele "Security for process control systems: An overview", IEEE Security Privacy, vol. 6, no. 6, pp.24 -29 2008
[9] H. Sugwon; L., Myongho; , "Challenges and Direction toward Secure Communication in the SCADA System," Communication Networks and Services Research Conference (CNSR), 2010 Eighth Annual , vol., no., pp.381-386, 11-14 May 2010
[10] D. Kang; J. Lee; S. Kim; J. Park; "Analysis on cyber threats to SCADA systems," Transmission & Distribution Conference & Exposition: Asia and Pacific, 2009 , vol., no., pp.1-4, 26-30 Oct. 2009
[11] "Dell Security Annual Threat Report." Boom: A Journal of California 5.1 (2015): 12-13. Dell. Dell, 2015. Web. 5 May 2015.

54
[12] S. Valentine and C. Farkas "Software security: Application-level vulnerabilities in SCADA systems," Information Reuse and Integration (IRI), 2011 IEEE International Conference on , vol., no., pp.498-499, 3-5 Aug. 2011
[13] D. Dzung; M. Naedele.; V. Hoff, T.P.; Crevatin, M.; "Security for Industrial Communication Systems," Proceedings of the IEEE , vol.93, no.6, pp.1152-1177, June 2005
[14] "Understanding Intrusion Detection." Sans.org. SANS Institute, 2001. Web. 27 Oct. 2014.
[15] M. Pires, P.S.; Oliveira, L.A.H.G., "Security Aspects of SCADA and Corporate Network Interconnection: An Overview," Dependability of Computer Systems, 2006. DepCos-RELCOMEX '06. International Conference on , vol., no., pp.127,134, 25-27 May 2006 doi: 10.1109/DEPCOS-RELCOMEX.2006.46
[16] R. Anderson (2001). Security Engineering: A Guide to Building Dependable Distributed Systems. New York: John Wiley & Sons. pp. 660-667.
[17] A. Almalawi, X. Yu, Z. Tari, A. Fahad, I. Khalil, “An unsupervised anomaly-based detection approach for integrity attacks on SCADA systems”, Computers & Security, Volume 46, October 2014, Pages 94-110, ISSN 0167-4048,
[18] J.M. Moya; Á. Araujo; Z. Banković; J.-M.De Goyeneche.; J.C. Vallejo; Malagón, P.; D. Villanueva; D. Fraga; E. Romero; J. Blesa, Improving Security for SCADA Sensor Networks with Reputation Systems and Self-Organizing Maps. Sensors 2009, 9, 9380-9397.
[19] J. Carr. "Snort: Open Source Network Intrusion Prevention." ESecurity Planet. ESecurity Planet, 5 June 2007. Web. 02 Nov. 2014.
[20] H. Lin , A. Slagell , C. Di Martino , Z. Kalbarczyk , R.K. Iyer, Adapting Bro into SCADA: building a specification-based intrusion detection system for the DNP3 protocol, Proceedings of the Eighth Annual Cyber Security and Information Intelligence Research Workshop, January 08-10, 2013, Oak Ridge, TN
[21] "Simply Modbus - About Modbus TCP." Simply Modbus - About Modbus TCP. N.p., n.d. Web. 03 June 2015. <http://www.simplymodbus.ca/TCP.htm>.
[22] A. Mahmood; H. Jianku; Z. Tari,;Y. Xinghuo; , "Building a SCADA Security Testbed," Network and System Security, 2009. NSS '09. Third International Conference on , vol., no., pp.357-364, 19-21 Oct. 2009
[23] S. Cheung et al. "Using model-based intrusion detection for SCADA networks." Proceedings of the SCADA security scientific symposium. Vol. 46. 2007.

55
[24] D. Yang, A. Usynin, and J. Wesley Hines. "Anomaly-based intrusion detection for SCADA systems." 5th intl. topical meeting on nuclear plant instrumentation, control and human machine interface technologies (npic&hmit 05). 2006.
[25] K. Da 2000. Attack development for intrusion detection. Master’s Thesis. Massachusetts Institute of Technology, Cambridge, MA.
[26] Z. Thornton, J. Hsu, and D. Mudd. SCADA ANOMALY DETECTION. Rep. Mississippi State University, n.d. Web. <http://www.ece.msstate.edu/~morris/icsdatasets/MSU_SCADA_Final_Report.pdf>.
[27] "Cryptography and Security in Computing." (2012): n. pag. Tech Target. Web.
[28] M. Hall, E. Frank, G. Holmes, B. Pfahringer, P. Reutemann, I. H. Witten (2009); The WEKA Data Mining Software: An Update; SIGKDD Explorations, Volume 11, Issue 1.
[29] Boyer, Stuart. "Collecting Data from Distant Facilities." ISA. International Society of Automation, 27 Oct. 2014. Web. Oct. 2007.
[30] Gao, W., Morris, T., Reaves, B., Richey, D. On SCADA Control System Command and Response Injection and Intrusion Detection, in the Proceedings of 2010 IEEE eCrime Researchers Summit. Dallas, TX. Oct 18-20, 2010. Best Paper Award Winner!

56
REGISTER MAPPING FOR GAS PIPELINE RTU

57
Figure A.1 Register Mapping Sheet