Embed Size (px)
Citation preview

HAL Id: hal-03207299https://hal.archives-ouvertes.fr/hal-03207299
Submitted on 24 Apr 2021
HAL is a multi-disciplinary open accessarchive for the deposit and dissemination of sci-entific research documents, whether they are pub-lished or not. The documents may come fromteaching and research institutions in France orabroad, or from public or private research centers.
L’archive ouverte pluridisciplinaire HAL, estdestinée au dépôt et à la diffusion de documentsscientifiques de niveau recherche, publiés ou non,émanant des établissements d’enseignement et derecherche français ou étrangers, des laboratoirespublics ou privés.
Distributed under a Creative Commons Attribution - NonCommercial - NoDerivatives| 4.0International License
A new soil degradation method analysis by Sentinel 2images combining spectral indices and statistics analysis:
application to the Cameroonians shores of Lake Chadand its hinterland
Sébastien Gadal, Paul Gbetkom, Alfred Homère Mfondoum
To cite this version:Sébastien Gadal, Paul Gbetkom, Alfred Homère Mfondoum. A new soil degradation method analysisby Sentinel 2 images combining spectral indices and statistics analysis: application to the Camerooni-ans shores of Lake Chad and its hinterland. 7th International Conference on Geographical InformationSystems Theory, Applications and Management (GISTAM 2021), Apr 2021, Online Streaming, CzechRepublic. pp.25-36. �hal-03207299�

1
A new soil degradation method analysis by sentinel 2 images combining
spectral indices and statistics analysis: application to the Cameroonians
shores of Lake Chad and its hinterland
Sébastien Gadal1, 4* a, Paul Gérard Gbetkom 1, 2 b, Alfred Homère Ngandam Mfondoum3 c,
1. Aix-Marseille Univ, CNRS, ESPACE UMR 7300, Univ Nice Sophia Antipolis, Avignon Univ, 13545 Aix-en-Provence, France,
[email protected] [email protected];
2. Laboratory of Botanic, Mycology, and Environment, University Mohammed V Rabat, 1014, 4 avenue ibn battuta Rabat Morocco;
3. StatsN’Maps, Private Consulting Firm, 19002 Dallas Parkway, Suite 1536, Dallas, Texas 72587; [email protected];
4. North-Eastern Federal University, 670000 Yakutsk, Republic of Sakha, Russian Federation
Abstract
This paper aims to model the soil degradation risk along the Cameroonian shores of Lake Chad. The processing is based on
a statistical analysis of spectral indices of sentinel 2A satellite images. A total of four vegetation indices such as the Greenness
Index and Disease water stress index and nine soil indices such as moisture, brightness, or organic matter content are
computed and combined to characterize vegetation cover and bare soil state, respectively. All these indices are aggregated
to produce one image (independent variable) and then regressed by individual indices (dependent variable) to retrieve
correlation and determination coefficients. Principal Component Analysis and factorial analysis are applied to all spectral
indices to summarize information, obtain factorial coordinates, and detect positive/negative correlation. The first factor
contains soil information, whereas the second factor focuses on vegetation information. The final equation of the model is
obtained by weighting each index with both its coefficient of determination and factorials coordinates. This result generated
figures cartography of five classes of soils potentially exposed to the risk of soil degradation. Five levels of exposition risk
are obtained from the "Lower" level to the "Higher": the "Lower" and "Moderate to low" levels occupy respectively 25,214.35
hectares and 130,717.19 hectares; the "Moderate" level spreads 137,404.34 hectares; the "High to moderate" and "Higher"
levels correspond respectively to 152,371.91 hectares and 29,175.73 hectares.
KEYWORDS: vegetation indices; soil indices; statistics analysis; Lake Chad, Sentinel 2.
1. INTRODUCTION
The state of soil is an important parameter in the
monitoring of the land dynamic and exploitation, for
sustainable use (Jazouli et al. 2019; Chen et al. 2019).
Its degradation, which reduces the exploitation of
natural resources in general and restricts the
productivity of agricultural soils, causes significant
socio-economic impacts. In the far-northern part of
Cameroon, the shores of Lake Chad, are in the most
exposed zone to the soil degradation risks due to
environmental conditions, more severe climatic
conditions, and modes of uses and exploitation of
natural resources (National Action Plan to Combat
Desertification (PAN/LCD) 2006). It is an area
marked by degradation and decline of soil fertility,
unsuitable cultivation practices, a high extension of
barren land, erosion, runoff, and decrease of fallows,
overgrazing, and pesticide pollution (Elias
Symeonakis and Drake 2010; GIZ, 2015).
The great spatial and temporal variability of the
rainfall combined with the rain aggressiveness
constitutes major risks related to the rainfall and
accelerates the soil degradation process in this zone
(PAN/LCD, 2006). Rainfalls as violent localized
showers, and strike bared soils, prepared for sowing
and lowly protected or cleaned from their vegetation
(Seignobos and Iyébi-Mandjek 2000). This is figured
out by the presence of vast expanses of bare soils,
most of which are very sensitive to water and wind
erosion, accentuated by the dwindling vegetation
cover. Slopes are low in this environment, and the
level of soil drainage is very varied. It is moreover
based on the level of draining that, (Seignobos and
2
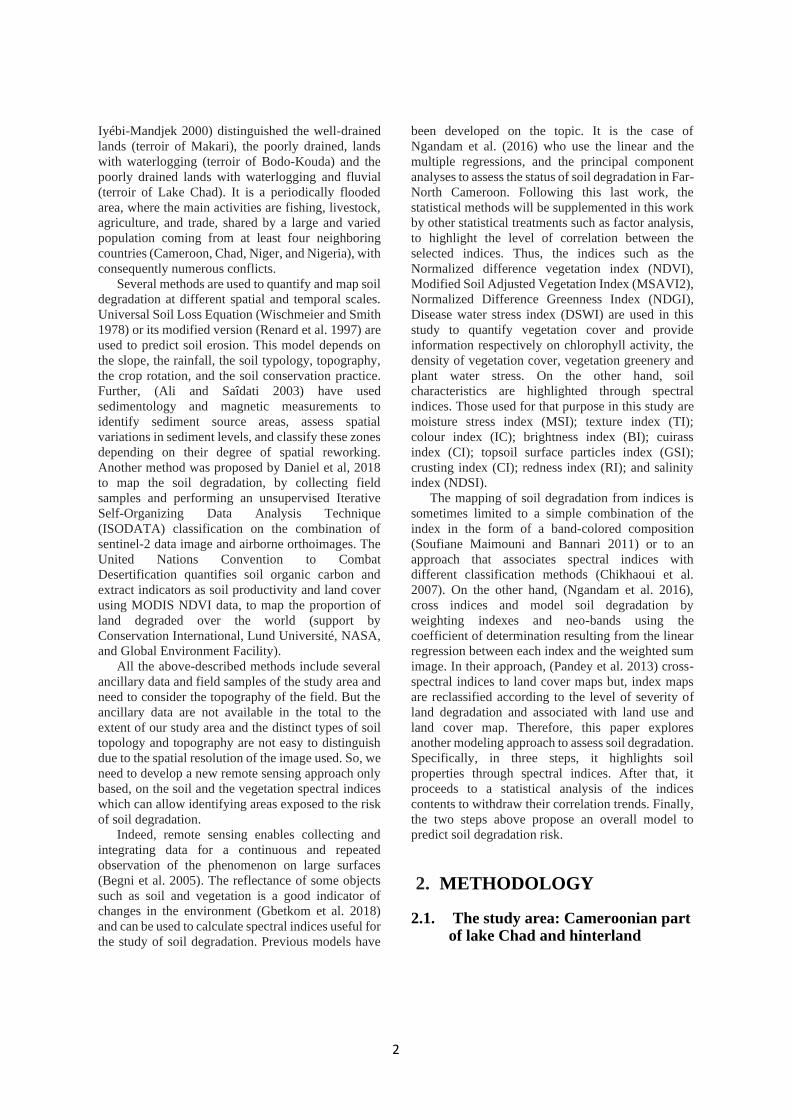
Iyébi-Mandjek 2000) distinguished the well-drained
lands (terroir of Makari), the poorly drained, lands
with waterlogging (terroir of Bodo-Kouda) and the
poorly drained lands with waterlogging and fluvial
(terroir of Lake Chad). It is a periodically flooded
area, where the main activities are fishing, livestock,
agriculture, and trade, shared by a large and varied
population coming from at least four neighboring
countries (Cameroon, Chad, Niger, and Nigeria), with
consequently numerous conflicts.
Several methods are used to quantify and map soil
degradation at different spatial and temporal scales.
Universal Soil Loss Equation (Wischmeier and Smith
1978) or its modified version (Renard et al. 1997) are
used to predict soil erosion. This model depends on
the slope, the rainfall, the soil typology, topography,
the crop rotation, and the soil conservation practice.
Further, (Ali and Saîdati 2003) have used
sedimentology and magnetic measurements to
identify sediment source areas, assess spatial
variations in sediment levels, and classify these zones
depending on their degree of spatial reworking.
Another method was proposed by Daniel et al, 2018
to map the soil degradation, by collecting field
samples and performing an unsupervised Iterative
Self-Organizing Data Analysis Technique
(ISODATA) classification on the combination of
sentinel-2 data image and airborne orthoimages. The
United Nations Convention to Combat
Desertification quantifies soil organic carbon and
extract indicators as soil productivity and land cover
using MODIS NDVI data, to map the proportion of
land degraded over the world (support by
Conservation International, Lund Université, NASA,
and Global Environment Facility).
All the above-described methods include several
ancillary data and field samples of the study area and
need to consider the topography of the field. But the
ancillary data are not available in the total to the
extent of our study area and the distinct types of soil
topology and topography are not easy to distinguish
due to the spatial resolution of the image used. So, we
need to develop a new remote sensing approach only
based, on the soil and the vegetation spectral indices
which can allow identifying areas exposed to the risk
of soil degradation.
Indeed, remote sensing enables collecting and
integrating data for a continuous and repeated
observation of the phenomenon on large surfaces
(Begni et al. 2005). The reflectance of some objects
such as soil and vegetation is a good indicator of
changes in the environment (Gbetkom et al. 2018)
and can be used to calculate spectral indices useful for
the study of soil degradation. Previous models have
been developed on the topic. It is the case of
Ngandam et al. (2016) who use the linear and the
multiple regressions, and the principal component
analyses to assess the status of soil degradation in Far-
North Cameroon. Following this last work, the
statistical methods will be supplemented in this work
by other statistical treatments such as factor analysis,
to highlight the level of correlation between the
selected indices. Thus, the indices such as the
Normalized difference vegetation index (NDVI),
Modified Soil Adjusted Vegetation Index (MSAVI2),
Normalized Difference Greenness Index (NDGI),
Disease water stress index (DSWI) are used in this
study to quantify vegetation cover and provide
information respectively on chlorophyll activity, the
density of vegetation cover, vegetation greenery and
plant water stress. On the other hand, soil
characteristics are highlighted through spectral
indices. Those used for that purpose in this study are
moisture stress index (MSI); texture index (TI);
colour index (IC); brightness index (BI); cuirass
index (CI); topsoil surface particles index (GSI);
crusting index (CI); redness index (RI); and salinity
index (NDSI).
The mapping of soil degradation from indices is
sometimes limited to a simple combination of the
index in the form of a band-colored composition
(Soufiane Maimouni and Bannari 2011) or to an
approach that associates spectral indices with
different classification methods (Chikhaoui et al.
2007). On the other hand, (Ngandam et al. 2016),
cross indices and model soil degradation by
weighting indexes and neo-bands using the
coefficient of determination resulting from the linear
regression between each index and the weighted sum
image. In their approach, (Pandey et al. 2013) cross-
spectral indices to land cover maps but, index maps
are reclassified according to the level of severity of
land degradation and associated with land use and
land cover map. Therefore, this paper explores
another modeling approach to assess soil degradation.
Specifically, in three steps, it highlights soil
properties through spectral indices. After that, it
proceeds to a statistical analysis of the indices
contents to withdraw their correlation trends. Finally,
the two steps above propose an overall model to
predict soil degradation risk.
2. METHODOLOGY
2.1. The study area: Cameroonian part of lake Chad and hinterland

3
The study area is located in the Far north
administrative region of Cameroon and shares
borders with the Republic of Chad to the north and
east, the Federal Republic of Nigeria to the west, and
the rest of the country to the south (Figure 1). It is
located between latitude 12 °N to 13 °N and meridian
14 °E to 15 °E. It is a semi-arid region with a Sudano-
Sahelian climate, characterized by a rainy season
from June to October and a dry season that runs from
November to May. The annual rainfall totals around
400 mm, the temperature range is 7.7 °C, and the
average monthly temperature is 28 °C.
Figure 1: Localisation of the study area
2.2. An approach based on sentinel 2 images
Two Sentinel 2 satellite images acquired on April 29,
2017, were used. They have 13 bands, but only six
of them were staked, i.e., Bands 2, 3, 4, 8, 11, and 12.
Figure 2: Flowchart of the methodology
2.3. Soil risk of degradation model design
2.3.1. Indices modeling
a. the vegetation index’s The use of vegetation indices has several objectives,
such as the estimation of the green vegetable mass,
the forecast of harvests, the description of the
phonological state of the soil cover, the inventory of
crops by segmentation of indices, and the evolution
of vegetation cover at the continental scale (Caloz and
Collet 2011). For example, the ability of the NDVI to
detect the presence, density, and condition of
vegetation was successfully used by Eklundh and
Olsson 2003, to observe a regreening of the Sahel
between 1982 and 2003, due to the spatial
increase in vegetation cover. The following indices
were therefore used in this study to analyze the
chlorophyll activity, the density of vegetation cover,
the vegetation greenery, and plant water stress.
Table 1: Characteristics of the vegetation indices
Indices Algorithm Goal References
For the chlorophyll activity: NDVI
NDVI = (NIR – R) / (NIR + R)
(Rouse et al. 1973)
Used to evaluate the chlorophyll activity of plants and also for the
monitoring of the state of the
vegetation cover.
(Martín-Sotoca et al. 2018); (E. Symeonakis and Drake 2004); Pang
et al. 2017; (Farooq Ahmad 2012).
For the density of
vegetation cover:
MSAVI2
MSAVI 2 =
(Qi et al. 1994)
Description of the vegetation
density and reduces the effects of soil, in particular when the canopy
is sparse especially in arid and
semi-arid environments.
(Qi et al. 1994); (Ngandam et al.
2016); (Farooq Ahmad 2012).
For the characterization of
DSWI = (NIR+G) / (SWIR+R)

4
the plant water
stress: DSWI
(Apan et al. 2003) Used to describe the variation of
the water content of foliage.
Pu 2008; X. Li et al. 2014; Apan et al.
2003.
For the recognition
of the vegetation greenery: NDGI
NDGI = (G-R) / (G+R) (Chamard et al. 1991)
Used to estimate the biomass of
vegetation and measure the hydric potential of the leaves at the level
of the canopy
(Romero et al. 2018); (Gao et al.
2017); (H. Li et al. 2015); (Rallo et al. 2014); (Sun, Li, and Li 2011).
The visual comparison of vegetation index's
efficiency to discriminate and quantify canopy
density shows a more accurate representation using
MSAVI2. Unlike the NDVI, the MSAVI2 offers a
sensitive distinction between bare soils and green
areas in less vegetated regions. Also, this index
attributes low values to aquatic spaces in contrast to
the DSWI and NDGI indices. These observations are
consistent with the results of previous works that
showed the potential of MSAVI2 to map the state of
the vegetation cover in arid environments (Ngandam
et al. 2016); (Farooq Ahmad 2012). The four indices
distinguish vegetated areas from bare soils. However,
the use of soil indices in addition to vegetation indices
is essential to characterize the bare spaces. So, nine
soil indices are computed and combined.
b. the soil indices Escadafal and Huete 1991 use the soil color index to
distinguish surface materials from soils according to
the saturation of their color. Chikhaoui et al. 2005
characterize the state of land degradation in Morocco
through the Land degradation index (LDI).
The following indices were therefore used in this
study to highlight the mineralogical composition of
soils, to assess the organic matter content of soils, and
the physical state of soils in terms of moisture and
compactness. Moreover, parameters such as color,
brightness, texture, and moisture characterize the
absorption properties of the soil constituents and are
important for mapping soil conditions, particularly in
arid environments.
Table 2: Characteristics of the soil index’s
Indices Algorithm Goal References
The moisture stress:
MSI
MSI = SWIR1/NIR (Yongnian et al, 2004)
Used to evaluate the spatial extend of less
soil moisture, due to the higher level of evapotranspiration.
(Elhag and Bahrawi 2017) ;
(Welikhe et al. 2017).
The texture analysis:
TI
TI =
(SWIR1-
SWIR2)/(SWIR1+SWIR2)
(Madeira Netto 1991)
The texture index is calculated to evaluate
the content or percentage of sand, silt, and
clay in soil composition, and appreciate the
level of the mineral alteration of rock.
(Madeira Netto 1991);
(Oliveira et al. 2016); Houssa
et al, 1996.
The soil color: CI
CI = (R-V)/ (R+V)
(Escadafal and Huete 1991)
This index is used to extract information concerning the organic matter content and
mineralogical composition of the soil.
(Soufiane Maimouni and Bannari 2011).
The soil brightness:
BI
BI =
(Kauth and Thomas 1976)
The role of the brightness index is to identify
the reflectance of soil and to highlight the vegetal cover of bare areas.
(Bannari et al. 1996);
(Soufiane Maimouni and Bannari 2011).
The soil Cuirass: CI
CI = 3*G-R-100
(Pouchin 2001)
It aims is to dissociate vegetated coverings from mineralized surfaces.
Okaingni et al. 2010; Stéphane et al. 2016.
The Topsoil Grain
Size: GSI
GSI =(R-B)/(R+V+B)
(Xiao et al. 2006)
GSI or topsoil grain size index is an index appropriated to characterize the texture of
the soil surface depending on the soil
reflectance curve.
(Jieying Xiao, Shen, and Ryutaro 2014); (Ngandam et
al. 2016).
The soil crusting: CI
CI= (R – B) / (R + B)
(Karnieli 1997)
Is used to detect and map from satellite imagery different lithological morphological
units. It is also able to
reveal poor infiltration, reduced air exchange between the soil and the atmosphere
(Karnieli 1997).
The soil redness: RI
RI = R²/B*G3
(Mathieu et al. 1998)
Used as one of the indicators to evaluate the
mineralogy of soils, including the iron content.
(Ray et al. 2014); (Escadafal
and Huete 1991); (Mandal 2016).
The soil salinity:
NDSI
NDSI = (R-NIR) / (R+NIR)
(Khan et al. 2005)
Is used to identify soils affected by salinity,
and to show the spatial extent of salinity
prevalent in our study area.
(Azabdaftari and Sunar
2016); (Chandana’ et al.
2004); (Asfaw, et al, 2018); Gorji et al, 2015; Allbed et al,
2014; (Narmada, et al, 2015).

5
The indices that characterize the soils using the
reflectance curves and the spectral properties of the
soil constituents (MSI, BI, crust Index, TI, cuirass
Index, RI, color Index, GSI, NDSI). Cuirass and crust
indices show that compact soils are mostly present in
the southern part of the study area where soils are
completely bare. The low values of the color index
coincide with the high values of the redness index and
correspond to the densely vegetated Lake Chad
littoral spaces, which are therefore rich in organic
matter. On the other hand, spaces with a low redness
index have high values of brightness, MSI, and NDSI,
which indicates low soil moisture and a prominent
level of drought and soil salinity. Furthermore, in the
southern part of the study area, where the levels of
cuirass and crust are already high, the soil texture is
also dominated by the presence of coarse particles
considering the results of the texture indices and GSI
2.3.2. Statistical patterns
The model being developed also depends on the
statistical information withdrawn from the indices.
This includes linear regression, factor analysis, and
principal component analysis were calculated.
a. linear regression By adding all the indices used, we obtain a new image
that summarizes all the information provided by each
index. The image obtained will serve as the
independent variable for the linear modeling between
indices. The purpose is to highlight the potential
regressions between the synthetic image of the
indices used here as an explanatory variable, and each
of the vegetation and soil indices used as variables to
explain.
Figure 3: correlation between synthetic image and index’s
It thus appears that five indices are negatively
correlated to the synthetic image. These are the NDVI
(-0.119), the DSWI (-0.747), NDGI (-0.769), TI (-
0.606), and the redness index which has the most
negative coefficient of correlation (-0.827).
Moreover, the high values of the coefficient of
determination of all the soil indices except the NDSI
show their influence on the synthetic image (Table 3).
The other correlations are positive with values
ranging from 0.119 for the NDSI to 0.953 for the
brightness index.
The index most strongly determined by the
synthesis image is the brightness index with an R²
equal to 0.909. The other soil indices have an R² with
values that vary in the interval [0.037-0.385]. For
vegetation indices, the R² values are contained
between 0.007 and 0.592.
Table 3: statistics relations between synthetic image and indices
Indices Correlation Coefficient Determination Coefficient P values
Threshold Test
-0.4
0.1
0.6
2000 4000 6000
ND
VI
synthetic image
y = 0,2537-7,9483E-06*x(R²=0,014)
-0.8
-0.3
0.2
0.7
2000 7000
MS
AV
I2
synthetic image
y = 0,2033+8,5536E-06*x(R²=0,007)
0.5
1.5
2.5
3.5
2000 4000 6000
DS
WI
synthetic image
y = 1,3331-6,0103E-05*x(R²=0,558)
-0.2
0.1
0.3
2500 4500 6500
ND
GI
synthetic image
y = 9,0742E-02-2,1518E-05*x
(R²=0,592)
0
0.5
1
1.5
2000 4000 6000
MS
I
synthetic image
y = 0,5416+8,9365E-05*x(R²=0,552)
500
1500
2500
3500
2000 4000 6000
bri
gh
tness in
dex
synthetic image
y = 201,7408+0,4089*x(R²=0,909)
0.1
0.2
0.3
0.4
2500 4500 6500
Cru
st
ind
ex
synthetic image
y = 0,1436+1,3516E-05*x(R²=0,438)
0
0.1
0.2
0.3
2500 4500 6500
textu
re in
dex
synthetic image
y = 0,2144-1,4896E-05*x(R²=0,367)
500
1500
2500
2000 4000 6000
cu
irass in
dex
synthetic image
y = 284,8433+0,2923*x(R²=0,887)
0.0000005
0.0000015
0.0000025
2500 4500 6500
red
ness in
dex
synthetic image
y = 2,5755E-06-1,8635E-10*x
(R²=0,684)
0.1
0.2
0.3
0.4
2500 4500 6500
co
lou
r in
dex
synthetic image
y = 0,1436+1,3516E-05*x(R²=0,438)
0
0.1
0.2
2500 4500 6500
GS
I
synthetic image
y = 8,3203E-02+1,0307E-05*x
(R²=0,470)
-0.8
-0.3
0.2
2000 4000 6000
ND
SI
synthetic image
y = -0,2537+7,9483E-06*x(R²=0,014) Each correlation is defined by an
equation where:
y = dependent variable
x = independent variable
R² = coefficient of determination

6
NDVI -0,119 R²=0,014 P < 0,0001 Important
MSAVI2 0,081 R²=0,007 P < 0,0001 Important
DSWI -0,747 R²=0,558 P < 0,0001 Important
NDGI -0,769 R²=0,592 P < 0,0001 Important
MSI 0,743 R²=0,552 P < 0,0001 Important
BI 0,953 R²=0,909 P < 0,0001 Important
Crust index 0,662 R²=0,438 P < 0,0001 Important
TI -0,606 R²=0,367 P < 0,0001 Important
Cuirass index 0,942 R²=0,887 P < 0,0001 Important
Redness index -0,827 R²=0,684 P < 0,0001 Important
Colour index 0,662 R²=0,438 P < 0,0001 Important
GSI 0,685 R²=0,470 P < 0,0001 Important
NDSI 0,119 R²=0,014 P < 0,0001 Important
b. descriptive statistics For this step, we use the factorial analysis which is a
fundamental tool of statistical analysis of data tables
that do not have a particular structure (Baccini 2010,
Palm 1993). It is usually combined with the Principal
Component Analysis (PCA) that is an extremely
powerful tool for synthesizing information (Guerrien
2003), to reduce dimensional space (two for
example) to obtain the most relevant summary of the
initial data. The output graphs are supported by
characteristic numerical values, useful to ease the
interpretation of the results. The graphs to be
interpreted are, the geographical representations and
the tables which make it possible to see the
connections and the oppositions between the studied
characteristics, according to the factors used for
illustration.
Table 4: Factorial coordinates of indices
FACTORIAL ANALYSIS PRINCIPAL COMPONENT ANALYSIS
F1 F2 F1 F2
NDVI 0,053 -0,976 NDVI 0,056 0,974
MSAVI2 -0,177 -0,960 MSAVI2 -0,172 0,961
DSWI 0,921 0,139 DSWI 0,927 -0,151
NDGI 0,964 0,159 NDGI 0,958 -0,169
MSI -0,900 -0,075 MSI -0,912 0,085
BI -0,871 -0,133 BI -0,889 0,143
Crust Index -0,899 -0,203 Crust Index -0,906 0,219
TI 0,581 -0,761 TI 0,584 0,764
Cuirass Index -0,701 0,399 Cuirass Index -0,731 -0,428
RI 0,641 -0,541 RI 0,664 0,574
Colour Index -0,899 -0,203 Colour Index -0,906 0,219
GSI -0,922 -0,185 GSI -0,925 0,198
NDSI -0,053 0,976 NDSI -0,056 -0,974
Factors “one” and “two” condense the most
information and explain 85.62% of the common
variability of the characteristics measured for the
factor analysis and 87.54% for the PCA (Figure 4).
Moreover, for each method, factor one with more
than 54% of the information is more important than
factor two that contains a little more than 31%. For
each factor, the best-revealed indices are displayed in
bold and the opposition of the indices is measured by
the signs of the values (Table 4). For both methods,
the first factor opposes DSWI, greenery, and redness
indices, with MSI, brightness, crusting, cuirass, color,
and GSI indices. On the second factor the NDVI,
MSAVI2, and texture indices are opposed to the
NDSI index. The degrees of opposition and their
disposition are illustrated by the graph of correlations
between variables and factors (Figure 4).
Figure 4: correlations between variables and factors
The symmetrical opposition of the first factor
indices shows that in the studied area when the
greenery is high and the DSWI is also high, the
brightness and the crusting of the soils decrease, the
NDVIMSAVI2
DSWI
NDGIMSI BI CRUST
TI
CUIRASS
RICOLOU
R
GSI
NDSI
-1.0
-0.8
-0.5
-0.3
0.0
0.3
0.5
0.8
1.0
-1.0 -0.8 -0.5 -0.3 0.0 0.3 0.5 0.8 1.0
F2 (
31,1
1 %
)
F1 (54,51 %)
NDVIMSAVI2
DSWINDGI
MSI
BICRUST
TI
CUIRASS
RI
CIGSI
NDSI-1.0
-0.8
-0.5
-0.3
0.0
0.3
0.5
0.8
1.0
-1.0 -0.8 -0.5 -0.3 0.0 0.3 0.5 0.8 1.0
F2 (
31,7
8 %
)
F1 (55,76 %)

7
soils are wetter, darken, and the granulometry of
topsoil is dominated by small particles. One can
understand that the clear soils are much encrusted,
dry, formed of particles of coarse size, and
characterized by a high brightness. The correlation of
the redness and texture indices with the four
vegetation indices informs on the fact that red soils
(hydromorphic and vertisol soils with significant iron
content) and sandy soils are mostly present in the
vegetated areas and as the soils are battleships
vegetation cover decreases. Also, the opposition
between NDVI and NDSI reflects the fact that the
decline in chlorophyll activity is followed by an
increase in soil salinity. Besides, the influence of soil
salinity on plant quality and health is also observed
by the proximity of NDSI with NDGI and DSWI in
the correlation circle.
The first factor informs more about soil-related
information and opposes five soil indices (MSI, BI,
crust index, color index, GSI) to two vegetation
indices, NDGI and the DSWI. Factor “two”
concentrates vegetation information by contrasting
the other two main vegetation indices (NDVI and
MSAVI2) with the salinity index (NDSI).
Consequently, the main characteristics of the soils
derived from the correlations circles between indices
(variables) and the factors are the organic matter
content, humidity, and the physical state of the soils
for the first factor. The second factor is the state and
density of the vegetation cover.
However, the comparison of results obtained
between the linear regression and the factorial
analysis requires a few remarks. This concerns the
consistency of negative correlations between
MSAVI2 and NDSI on one hand and positive
correlations between MSAVI2 and NDVI on the
other. Both are valid for linear regression and
descriptive statistics and can then explain why the
NDSI is not close to other soil indices. We notice the
low representativeness of the cuirass, redness, and
texture indices and their low correlation with the
other indices. One can also note that in the correlation
circle of the PCA, all the variables are far from the
center than they are in the factorial’s analysis one.
The oppositions between the (variable) indices
remain the same for the PCA as for the factorial
analysis only their signs concerning the first-factor
change.
2.3.3. The equation proposed for the model
The model’s equation proposed here is designed to
balance all the information obtained from the
statistical analysis performed with the indices and
based on previous work approaches. The adopted
approach is to weigh the index maps with their
coefficient of determination which serves us to
highlight the individual contribution of each index to
the final map of soil degradation. Also, we consider
for each index of its highest values of factorial
coordinates obtained through the factorial analysis
and the PCA to preserve the best information
provided by each of these methods of analysis. This
information is combined to compose the following
equation:
3. RESULTS
3.1. Map of exposition soils degree to agents and degradation factors
The result of this modeling is a map of exposition
soils degree to agents and degradation factors. The
potential soil exposition state is classified on the map
below in five levels of exposition risk from the
"Lower" level to the "Higher" (Table 5). The diversity
of land cover explains the nature and the state of the
soils, justifies the heterogeneity of the map, and
explains the need to have a high number of classes to
represent all the levels of exposition risk.
In the absence of field truth data, the different
exposition levels are obtained by performing a
standard deviation threshold of the image histogram.
The standard deviation threshold method allows
ndvi*(xmax+Ymax)*R² + msavi2*(xmax+Ymax)*R² + dswi*(xmax+Ymax)*R² + ndgi*(xmax+Ymax)*R²+
msi*(xmax+Ymax)*R² + bi*(xmax+Ymax)*R² + crust index*(xmax+Ymax)*R² + ti*(xmax+Ymax)*R² + cuirass
index*(xmax+Ymax)*R² + ri*(xmax+Ymax)*R² + colour index*(xmax+Ymax)*R² + gsi*(xmax+Ymax)*R² +
ndsi*(xmax+Ymax)*R² = RISK OF SOILS DEGRADATION
ndvi(17,09+0,64) 0,014 + msavi2(16,81+2,06) 0,007 + dswi(2,57+10,73) 0,558 + ndgi(2,88+11,23) 0,592 +
msi(1,45+10,49) 0,552 + bi(2,44+10,23) 0,909 + crust index(3,73+10,47) 0,438 + ti(13,32+6,76) 0,367 + cuirass
index(7,30+8,41) 0,887 + ri(9,79+7,46) 0,684 + colour index(3,73+10,47) 0,438 + gsi(3,23+10,74) 0,470 +
ndsi(17,09+0,64) 0,014 = RISK OF SOILS DEGRADATION

8
visualizing how much the attribute values of a class
vary compared to the mean, by using mean values and
standard deviations from the mean.
Table 5: Classification of degradation levels
INDICES
EXPOSITIONS LEVELS
LOWER HIGHER
NDVI (high to low
chlorophyll activity) 0,501 - 0,861 0,285 - 0,501 0,070 - 0,285 -0,145 - 0,070 -0,502 - -0,145
MSAVI2 (high to low
vegetation density) 0,425 - 0,925 0,041 - 0,425 -0,342 - 0,041 -0,726 - -0,342 -2,012 - -0,726
DSWI (high to low
vegetation water stress) 1,516 - 6,787 1,252 - 1,516 0,988 - 1,252 0,724 - 0,988 0 - 0,724
NDGI (high to low
vegetation greenery) 0,039 - 0,370 -0,040 - 0,039 -0,120 - -0,040 -0,200 - -0,120 -0,355 - -0,200
MSI (high to low soil
moisture) 0 - 0,657 0,657 - 1,038 1,038 - 1,419 1,419 - 1,622 1,622 - 5,746
BI (low to high soil
brightness) 0 - 1394,708 1394,708 - 3280,037 3280,037 - 5165,367 5165,367 - 7050,696 7050,696 - 15541,476
CRUST INDEX (low to
high soil crusting) -0,113 - 0,141 0,141 - 0,205 0,205 - 0,269 0,269 - 0,333 0,333 - 0,607
TI (low to high soil
texture) -0,578 - 0,007 0,007 - 0,078 0,078 - 0,149 0,149 - 0,220 0,220 - 0,428
CUIRASS INDEX (low to
high soil cuirass) -100 - 1703,341 1703,341 - 2439,784 2439,784 - 3176,226 3176,226 - 3912,669 3912,669061 - 366881
RI (high to low soils
redness)
2,297e-006 - 1,403e-
005
1,731e-006 - 2,297e-
006
1,166e-006 - 1,731e-
006
6,005e-007 - 1,166e-
006
3,366e-009 - 6,005e-
007
COLOR INDEX (low to
high soil color) 304,098 - 833,117 833,117 - 1588,966 1588,966 - 2344,815 2344,815 - 3100,664 3100,664 - 16903,046
GSI (low to high grain
size) -0,085 - 0,042 0,042 - 0,088 0,088 - 0,133 0,133 - 0,189 0,189 - 0,416
NDSI (low to high soils
salinity) -0,861 - -0,506 -0,506 - -0,291 -0,291 - -0,075 -0,075 - 0,140 0,140 - 0,497
The "Lower" and "Moderate to low" levels cover
the permanent open water areas of the lake, the
marshland, and vegetated areas of the immediate
shores, a portion of the intermediate shores, and
occupy respectively 25,214.35 hectares and
130,717.19 hectares (Figure 5). The "Moderate" level
of exposition spreads sparsely over the bare areas of
the outer shores and the hinterland over an area of
137,404.34 hectares. The "High to moderate" and
"Higher" levels dominate the outer shores and the
hinterland. With 152,371.91 hectares, the "High to
moderate" level represents the most widespread state
of exposition of our study area. The "Higher" level
occupies 29,175.73 hectares. The main difficulty now
is to be able to identify for each level of exposition
the most influential indices.
Figure 5: map of soils exposition risk to
degradation
The method adopted to answer this concern is
inspired by (Ngandam et al. 2016), which consists of
classifying the indices by class of degradation and
identifying the influence of the indices according to
their spatial distribution by class (Table 6). For the
"Higher" level, the top five indices with the largest
spatial distributions are in decreasing order, DSWI
(210,406.3 hectares), RI (168,640.87 hectares), GSI

9
(124,851.26 hectares), TI (62,076.68 hectares), and
NDSI (41,903.57 hectares). As a result, the "Higher"
level is explained by bare soils where vegetation has
completely disappeared, the low rate of iron in the
soil, the coarse texture of the surface particles, and
high salinity. For the "High to moderate" level, the
GSI, NDGI, RI, MSI, and crust index with
respectively 227,054.85 hectares, 213,842.42
hectares, 196,491.09 hectares, 190,128.43 hectares,
179,840.75 hectares are the most indicative. This
means that the soils of this class are also characterized
by the coarse texture of the particles on the surface,
but also by the weak greenery of the vegetation, an
important crusting, and low moisture and iron
contents.
The following indices: brightness (314,392.22
hectares), salinity (310,755.2 hectares), chlorophyll
(310,022.07 hectares), crust (169,496.11 hectares)
and cuirass (166,788.83 hectares) are the most
influential for the "Moderate" level. The soils of this
class are clear and salty, weakly covered with
vegetation, and compact on their surfaces.
A good vegetation cover of the soil, the fine
texture of the soil particles, dark soils, weakly
cuirassed, characterizes the "Moderate to low" level
that covers the open waters of the lake, marshland
areas, and part of the immediate and intermediate
shores and which contain organic matter in significant
quantities. Indeed, in this class, the MSAVI2 with
307,273.49 hectares is the most widespread index
followed by TI 189,099.23 hectares, BI 131,856.39
hectares, cuirass index 114,273.9 hectares, and color
index 103,409.8 hectares. In the "Lower" class, which
occupies open water and marshland, the influence of
vegetation indices is the most important
(MSAVI2 116,895.5 hectares, NDGI 51,141.44
hectares, NDVI 47,347.15 hectares), the soil moisture
is high (MSI 56,785.6 hectares), and their salinity rate
is low (the NDSI 45,373.94 hectares).
Table 6: areas of degradation level by index.
LEVEL OF
DEGRADATION NDVI MSAVI2 DSWI NDGI MSI BI
CRUST
INDEX TI
CUIRASS
INDEX RI
COLOUR
INDEX GSI NDSI
Lower 47347,15 116895,5 12232,53 51141,44 56785,6 20022,04 44050,68 436,12 34703,46 12455,87 42013,35 9303 45373,94
Moderate to low 65710,8 307273,49 43821,77 77454,57 73233,53 131856,39 75252,17 189099,23 114273,9 30834,54 103409,8 36286,48 66397,32
Moderate 310022,07 9348,34 65791,41 132378,86 122002,11 314392,22 169496,11 161940,13 166788,83 66436,07 134027,8 77362,84 310755,2
High to moderate 10351,48 15298,62 142606,5 213842,42 190128,43 8575,23 179840,75 61304,64 132939,34 196491,09 178548,4 227054,85 10428,33
Higher 41426,95 26042,49 210406,3 41,15 32708,78 15,46 6218,72 62076,68 26152,92 168640,87 16859,07 124851,26 41903,57
TOTAL 474858,45 474858,44 474858,5 474858,44 474858,45 474861,34 474858,43 474856,8 474858,45 474858,44 474858,4 474858,43 474858,4
3.2. Validation of results
A confusion matrix was used to validate the results
obtained by a comparison with the existing map of the
land degradation status of the far north region of
Cameroon, provided by (Ngandam et al. 2016). A
subset containing the main characteristic of the study
area was used, i.e., the permanent open water, the
marshland, the immediate shores, the external shores,
and the hinterland.
So, the confusion matrix performed provided the
information for verification and accuracy assessment
between our results with the ground truth map. The
overall accuracy which represents in percent the
number of correctly classified values divided by the
total numbers of values is 54.3%, and the kappa
coefficient which assesses how much better the
classification is than a random classification has a
value of 40.49%.
4. CONCLUSION
The present work was based on laboratory tests
applied to sentinel 2A satellite images. The purpose
was to model the risk of soil degradation in Sahelian
regions by combining spectral indices with statistical
analyses. The results are highly correlated to some
factors as the phenological season of satellite image
acquisition, the quality of the images, the formula of
the indices used, and the applied statistical treatments.
Also, statistical analysis was applied to the
resulting image giving on one hand the correlation
and determination coefficients of each index, and on
the other hand, the factorial axes which summarize
more information. All indices are considered
statistically significant (P-value < 0.0001). The first
two factors of PCA and factorial analysis explain
respectively 87.54 % and 85.62 % of the common
variability of the characteristics measured. The first
factor contains the soil information, and the second
factor focuses information on vegetation. This final
equation of the model is obtained by index weighting
with the respective values of the coefficient of
determination, which oscillates between 0.007 for the
MSAVI2 and 0.909 for the brightness index. Among

10
the most serious levels of degradation, the "High to
moderate" level is the most widespread with
15,271.91 hectares, followed by the "Moderate" level
with 137,404.34 hectares, and the "Higher" level,
which occupies an area of 29,175.73 hectares.
However, we apply our methodology to images of
a specific month of the year (April). So, the challenge
now is the adaptation of the model to previous years
and other periods of the year. Moreover, the lack of
consideration of urban areas is a limit for this work
because the elements that constitute the habitat
(example of aluminum roofs) necessarily influence
the results of the calculation of certain indices.
At last, whatever performing decorrelation
analysis as a method of unlinking indices, all of them
is calculated on satellite images from the same sensor.
Consequently, they have a basic dependent relation
because of their origin same spectral characteristics.
For this reason, it should be interesting in further
analysis to perform the whole analysis on multisource
satellite images (SPOT or MODIS), to assess the
statistic behavior and decorrelation, while an index of
one source and another of the other source is used as
the independent and dependent variable.
Moreover, the method adopted in this study to
evaluate the contribution of the different indices to
each degree of degradation brought interesting
results. However, the presence on our images of open
waters and marshland to a certain extent brings out a
new constraint to consider. The low values of
vegetation indices of NDVI and MSAVI2 appear in
open water rather than appearing in bare spaces.
Without this class of occupation, these two indices
would have better contributed to characterize the
classes of strong degradation as the DSWI did. To
overcome this difficulty, one of the ways of
improving the model will be to classify indices as
functions of the distinct levels of degradation, using
the spectral windows obtained from the spectral
signature of these indices.
The imbalance between the number of vegetation
index and the number of soil index is to be
considered, through a readjustment that will allow
integrating new parameters including climatic like the
temperature of the surface, precipitations, albedo, or
evapotranspiration. Other elements such as
topography and hydrographic network distribution
are also to be considered.
ACKNOWLEDGMENTS
The authors are grateful to European Space Agency
(ESA) and the Copernicus program for the Sentinel 2
satellite images direct access. We thank all those who
contributed to this article.
REFERENCES
Ali, Faleh, and Bouhlassa Saîdati. 2003. ‘Exploitation Des
Mesures Magnétiques Dans l’étude de l’état de Stabilité
Des Sols: Cas Des Bassins-Versants Abdelali et Markat
(Prérif-Maroc)’. Papeles de Geografía, 14.
Allbed, Amal, Lalit Kumar, and Yousef Y. Aldakheel.
2014. ‘Assessing Soil Salinity Using Soil Salinity and
Vegetation Indices Derived from IKONOS High-
Spatial Resolution Imageries: Applications in a Date
Palm Dominated Region’. Geoderma 230–231
(October): 1–8.
Apan, Armando, Alex Held, Stuart Phinn, and John
Markley. 2003. ‘Formulation and Assessment of
Narrow-Band Vegetation Indices from EO-1 Hyperion
Imagery for Discriminating Sugarcane Disease’, 13.
Asfaw, Engdawork, K. V. Suryabhagavan, and Mekuria
Argaw. 2018. ‘Soil Salinity Modeling and Mapping
Using Remote Sensing and GIS: The Case of Wonji
Sugar Cane Irrigation Farm, Ethiopia’. Journal of the
Saudi Society of Agricultural Sciences 17 (3): 250–58.
Azabdaftari, A., and F. Sunar. 2016. ‘Soil Salinity Mapping
Using Multitemporal Landsat Data’. ISPRS -
International Archives of the Photogrammetry, Remote
Sensing and Spatial Information Sciences XLI-B7
(June): 3–9.
Baccini, Alain. 2010. ‘Statistique Descriptive
Multidimensionnelle’.
Bannari, A., A. R. Huete, D. Morin, and F. Zagolski. 1996.
‘Effets de La Couleur et de La Brillance Du Sol Sur Les
Indices de Végétation’. International Journal of
Remote Sensing 17 (10): 1885–1906.
Caloz, Régis, and Claude Collet. 2011. Précis de
Télédétection Volume 3 Traitements Numériques
d’images de Télédétection. Vol. 3. Presses de
l’Université du Quebec.
Chamard, Ph.C, M.C Guenegou, Jeannine Lerhun, J.
Levasseur, and M. Togola. 1991. ‘Utilisation Des
Bandes Spectrales Du Vert et Du Rouge Pour Une
Meilleure Évaluation Des Formations Végétales
Actives’. In Congrès AUPELF-UREF, edited by Marie-
Françoise Courel, 6. Sherbrooke, Canada.
Chandana’, PG, K D N Weerasinghe’, S Subasinghe’, and
S Pathirana. 2004. ‘Remote Sensing Approach to
Identify Salt-Affected Soils in Hambantota District’, 6.
Chen, Di, Naijie Chang, Jingfeng Xiao, Qingbo Zhou, and
Wenbin Wu. 2019. ‘Mapping Dynamics of Soil
Organic Matter in Croplands with MODIS Data and
Machine Learning Algorithms’. Science of The Total
Environment 669 (June): 844–55.
Chikhaoui, Mohamed, Ferdinand Bonn, Amadou Idrissa
Bokoye, and Abdelaziz Merzouk. 2005. ‘A Spectral
Index for Land Degradation Mapping Using ASTER
Data: Application to a Semi-Arid Mediterranean

11
Catchment’. International Journal of Applied Earth
Observation and Geoinformation 7 (2): 140–53.
Chikhaoui, Mohamed, Ferdinand Bonn, Abdelaziz
Merzouk, and Bernard Lacaze. 2007. ‘Cartographie de
La Dégradation Des Sols à l’aide Des Approches Du
Spectral Angle Mapper et Des Indices Spectraux En
Utilisant Des Données Aster’. Revue Télédétection 7
(1-2-3–4): 343–57.
Eklundh, Lars, and Lennart Olsson. 2003. ‘Vegetation
Index Trends for the African Sahel 1982–1999’.
Geophysical Research Letters 30 (8).
Elhag, Mohamed, and Jarbou A. Bahrawi. 2017. ‘Soil
Salinity Mapping and Hydrological Drought Indices
Assessment in Arid Environments Based on Remote
Sensing Techniques’. Geoscientific Instrumentation,
Methods and Data Systems 6 (1): 149–58.
Escadafal, Richard, and A. Huete. 1991. ‘Etude des
propriétés spectrales des sols arides appliquée à
l’amélioration des indices de végétation obtenus par
télédétection’. Comptes Rendus de l’Académie des
Sciences.Série 2 : Mécanique... 312: 1385–91.
Farooq Ahmad. 2012. ‘Spectral Vegetation Indices
Performance Evaluated for Cholistan Desert’. Journal
of Geography and Regional Planning 5 (6).
Gao, Yongnian, Junfeng Gao, Jing Wang, Shuangshuang
Wang, Qin Li, Shuhua Zhai, and Ya Zhou. 2017.
‘Estimating the Biomass of Unevenly Distributed
Aquatic Vegetation in a Lake Using the Normalized
Water-Adjusted Vegetation Index and Scale
Transformation Method’. Science of The Total
Environment 601–602 (December): 998–1007.
Gbetkom, Paul Gérard, Sébastien Gadal, Ahmed El
Aboudi, Alfred Homère Ngandam Mfondoum, and
Mamane Barkawi Mansour Badamassi. 2018.
‘Mapping Change Detection of LULC on the
Cameroonian Shores of Lake Chad and Its Hinterland
through an Inter-Seasonal and Multisensor Approach’.
International Journal of Advanced Remote Sensing and
GIS 7 (1): 2835–49.
Gérard Begni, Richard Escadafal, Delphine Fontannaz, and
Anne-Thérèse Hong-Nga Nguyen. 2005. ‘La
Télédetection : Un Outil Pour Le Suivi et l’évaluation
de La Désertification’, no. 2: 48.
GIZ. 2015. ‘Audit Environnemental Conjoint Sur
l’Assèchement Du Lac Tchad’. Afrique du Sud.
Gorji, Taha, Aysegul Tanik, and Elif Sertel. 2015. ‘Soil
Salinity Prediction, Monitoring and Mapping Using
Modern Technologies’. Procedia Earth and Planetary
Science 15: 507–12.
Guerrien, Marc. 2003. ‘L’intérêt de l’analyse En
Composantes Principales (ACP) Pour La Recherche En
Sciences Sociales: Présentation à Partir d’une Étude Sur
Le Mexique’. Cahiers Des Amériques Latines, no. 43
(July): 181–92.
Houssa, Rachida, Jean-Claude Pion, and Hervé Yésou.
1996. ‘Effects of Granulometric and Mineralogical
Composition on Spectral Reflectance of Soils in a
Sahelian Area’. ISPRS Journal of Photogrammetry and
Remote Sensing 51 (6): 284–98.
Jazouli, Aafaf El, Ahmed Barakat, Rida Khellouk, Jamila
Rais, and Mohamed El Baghdadi. 2019. ‘Remote
Sensing and GIS Techniques for Prediction of Land
Use Land Cover Change Effects on Soil Erosion in the
High Basin of the Oum Er Rbia River (Morocco)’.
Remote Sensing Applications: Society and Environment
13 (January): 361–74.
Karnieli, A. 1997. ‘Development and Implementation of
Spectral Crust Index over Dune Sands’. International
Journal of Remote Sensing 18 (6): 1207–20.
Kauth, R., and G. Thomas. 1976. ‘The Tasselled Cap -- A
Graphic Description of the Spectral-Temporal
Development of Agricultural Crops as Seen by
LANDSAT’. LARS Symposia, January.
Khan, Nasir M., Victor V. Rastoskuev, Y. Sato, and S.
Shiozawa. 2005. ‘Assessment of Hydrosaline Land
Degradation by Using a Simple Approach of Remote
Sensing Indicators’. Agricultural Water Management
77 (1–3): 96–109.
Li, Heli, Chunjiang Zhao, Guijun Yang, and Haikuan Feng.
2015. ‘Variations in Crop Variables within Wheat
Canopies and Responses of Canopy Spectral
Characteristics and Derived Vegetation Indices to
Different Vertical Leaf Layers and Spikes’. Remote
Sensing of Environment 169 (November): 358–74.
Li, Xinchuan, Youjing Zhang, Yansong Bao, Juhua Luo,
Xiuliang Jin, Xingang Xu, Xiaoyu Song, and Guijun
Yang. 2014. ‘Exploring the Best Hyperspectral
Features for LAI Estimation Using Partial Least
Squares Regression’. Remote Sensing 6 (7): 6221–41.
Madeira Netto, José. 1991. ‘Etude quantitative des relations
constituants minéralogiques-réflectance diffuse des
latosols brésiliens : application à l’utilisation
pédologique des données satellitaires TM (région de
Brasilia)’. Bondy: ORSTOM. Centre IRD de Bondy.
Maimouni, S., A. Bannari, A. El-Harti, and A. El-Ghmari.
2011. ‘Potentiels et limites des indices spectraux pour
caractériser la dégradation des sols en milieu semi-
aride’. Canadian Journal of Remote Sensing 37 (3):
285–301.
Maimouni, Soufiane, and Abderrazak Bannari. 2011.
‘Cartographie de La Dégradation Des Sols En Milieu
Semi-Aride’, 10.
Mandal, Umesh K. 2016. ‘Spectral Color Indices Based
Geospatial Modeling of Soil Organic Matter in Chitwan
District, Nepal’. ISPRS - International Archives of the
Photogrammetry, Remote Sensing and Spatial
Information Sciences XLI-B2 (June): 43–48.
Martín-Sotoca, Juan J., Antonio Saa-Requejo, Javier
Borondo, and Ana M. Tarquis. 2018. ‘Singularity Maps
Applied to a Vegetation Index’. Biosystems
Engineering 168 (April): 42–53.
Mathieu, Renaud, Marcel Pouget, Bernard Cervelle, and
Richard Escadafal. 1998. ‘Relationships between
Satellite-Based Radiometric Indices Simulated Using
Laboratory Reflectance Data and Typic Soil Color of
an Arid Environment’. Remote Sensing of Environment
66 (1): 17–28.
Narmada, Gobinath, and Bhaskaran. 2015. ‘Monitoring and
Evaluation of Soil Salinity in Terms of Spectral

12
Response Using Geoinformatics in Cuddalore
Environs’. International Journal of Geomatics and
Geosciences 5 (4): 536–43.
Ngandam, Mfondoum Alfred Homère, Joachim Etouna,
Buji Kindess Nongsi, Fabrice Armel Mvogo Moto, and
Florine Gustave Noulaquape Deussieu. 2016.
‘Assessment of Land Degradation Status and Its Impact
in Arid and Semi-Arid Areas by Correlating Spectral
and Principal Component Analysis Neo-Bands’.
International Journal of Advanced Remote Sensing and
GIS 5 (1): 1539–60.
Okaingni, Jean-Claude, Koffi Fernand Kouamé, and
Arnaud Martin. 2010. ‘Cartographie Des Cuirasses
Dans Les Formations Volcano- Sédimentaires de La
Zone d’anikro- Kadiokro (Côte d’Ivoire) à l’aide de La
Théorie Des Fonctions de Croyance’. Revue
Télédétection 9 (1): 19–32.
Oliveira, Pedro D. de, Michel K. Sato, Sueli Rodrigues, and
Herdjania V. de Lima. 2016. ‘S-Index and Soybean
Root Growth in Different Soil Textural Classes’.
Revista Brasileira de Engenharia Agrícola e Ambiental
20 (4): 329–36.
Palm, R. 1993. ‘Les Méthodes d’analyse Factorielle :
Principes et Applications’, 36.
Pandey, Prem Chandra, Meenu Rani, Prashant Kumar
Srivastava, Laxmi Kant Sharma, and Mahendra Singh
Nathawat. 2013. ‘Land Degradation Severity
Assessment with Sand Encroachment in an
Ecologically Fragile Arid Environment: A Geospatial
Perspective’. QScience Connect, no. 2013 (March): 43.
Pang, Guojin, Xuejia Wang, and Meixue Yang. 2017.
‘Using the NDVI to Identify Variations in, and
Responses of, Vegetation to Climate Change on the
Tibetan Plateau from 1982 to 2012’. Quaternary
International 444 (July): 87–96.
‘Plan d’Action National de Lutte Contre La Désertification
(PAN/LCD)’. 2006.
Pouchin, T. 2001. ‘Cours de Télédétection’. Université Le
Havre France.
Pu, R. 2008. ‘An Exploratory Analysis of in Situ
Hyperspectral Data for Broadleaf Species
Recognition’, 6.
Qi, J., A. Chehbouni, A.R. Huete, Y.H. Kerr, and S.
Sorooshian. 1994. ‘A Modified Soil Adjusted
Vegetation Index’. Remote Sensing of Environment 48
(2): 119–26.
Rallo, Giovanni, Mario Minacapilli, Giuseppe Ciraolo, and
Giuseppe Provenzano. 2014. ‘Detecting Crop Water
Status in Mature Olive Groves Using Vegetation
Spectral Measurements’. Biosystems Engineering 128
(December): 52–68.
Ray, S S, J P Singh, Gargi Das, and Sushma Panigrahy.
2014. ‘Use of High Resolution Remote Sensing Data
for Generating Site-Specific Soil Management Plan’, 6.
Renard, K. G., G. R. Foster, G. A. Weesies, D. K. McCool,
and D. C. Yoder. 1997. Predicting Soil Erosion by
Water: A Guide to Conservation Planning with the
Revised Universal Soil Loss Equation (RUSLE). US
Government Printing Office.
Romero, Maria, Yuchen Luo, Baofeng Su, and Sigfredo
Fuentes. 2018. ‘Vineyard Water Status Estimation
Using Multispectral Imagery from an UAV Platform
and Machine Learning Algorithms for Irrigation
Scheduling Management’. Computers and Electronics
in Agriculture 147 (April): 109–17.
Rouse, John Wilson, R. H. Haas, John A. Schell, and
Donald W. Deering. 1973. ‘Monitoring Vegetation
Systems in the Great Plains with ERTS’, 309–17.
Seignobos, Christian, and Olivier Iyébi-Mandjek. 2000.
‘Atlas de la province Extrême-Nord Cameroun’. Paris :
Yaoundé: Institut de recherche pour le développement ;
République de Cameroun, Ministère de la recherche
scientifique et technique, Institut national de
cartographie.
StéphaneKoff, Avy, Abderrahman Ait Fora, and Hicham
Elbelrhiti. 2016. ‘Cartographie de l’état Du Couvert
Végétal Du Nord de La Côte d’ivoire à Partir d’images
Satellites: Exemple de La Zone de Korhogo’. European
Scientific Journal, ESJ 12 (29): 204.
Sun, Hong, Minzan Li, and Daoliang Li. 2011. ‘The
Vegetation Classification in Coal Mine Overburden
Dump Using Canopy Spectral Reflectance’. Computers
and Electronics in Agriculture 75 (1): 176–80.
Symeonakis, E., and N. Drake. 2004. ‘Monitoring
Desertification and Land Degradation over Sub-
Saharan Africa’. International Journal of Remote
Sensing 25 (3): 573–92.
Symeonakis, Elias, and Nick Drake. 2010. ‘10-Daily Soil
Erosion Modelling over Sub-Saharan Africa’.
Environmental Monitoring and Assessment 161 (1–4):
369–87.
Welikhe, Pauline, Joseph Essamuah Quansah, Souleymane
Fall, and Wendell McElhenney. 2017. ‘Estimation of
Soil Moisture Percentage Using LANDSAT-Based
Moisture Stress Index’. Journal of Remote Sensing &
GIS 06 (02).
Wischmeier, Walter H., and Dwight David Smith. 1978.
Predicting Rainfall Erosion Losses: A Guide to
Conservation Planning. Department of Agriculture,
Science and Education Administration.
Xiao, J., Y. Shen, R. Tateishi, and W. Bayaer. 2006.
‘Development of Topsoil Grain Size Index for
Monitoring Desertification in Arid Land Using Remote
Sensing’. International Journal of Remote Sensing 27
(12): 2411–22.
Xiao, Jieying, Yanjun Shen, and Tateishi Ryutaro. 2014.
‘Mapping Soil Degradation by Topsoil Grain Size
Using MODIS Data’, 8.
Yongnian Zeng, Zhaodong Feng, and Nanping Xiang.
2004. ‘Assessment of Soil Moisture Using Landsat
ETM+ Temperature/Vegetation Index in Semiarid
Environment’. In IEEE International IEEE
International IEEE International Geoscience and
Remote Sensing Symposium, 2004. IGARSS ’04.
Proceedings. 2004, 6:4306–9. Anchorage, AK, USA:
IEEE.