Embed Size (px)
Citation preview
7/28/2019 A New Technique to Find the Effect of Active Power Loading on Voltage Stability and Algorithm to Improve Voltage …
http://slidepdf.com/reader/full/a-new-technique-to-find-the-effect-of-active-power-loading-on-voltage-stability 1/9
Journal of Information Engineering and Applications www.iiste.org
ISSN 2224-5782 (print) ISSN 2225-0506 (online)
Vol.3, No.5, 2013
1
A New Technique to find the effect of Active Power Loading on
Voltage Stability and Algorithm to improve Voltage Stability of
Radial and Meshed Power SystemsB Mahipal (corresponding author)
E-mail:[email protected], E-mail:[email protected]
P Venugopal Rao
E-mail:[email protected]
T Swetha
(E-mail:[email protected])
G Babu Naik
(E-mail:[email protected])
Ch Nareshkumar
(E-mail:[email protected])
Abstract
This paper will analyze the impact of active power on voltage stability of radial and meshed systems and a new
algorithm is proposed which would indicate the amount and location at which the active power is to be reduced
to improve the voltage stability of entire power system or set of buses that are prone to voltage instability. A new
sensitivity matrix named Active Power L-Index sensitivity matrix is been proposed. The proposed approach issimple and easy to be implemented into large power systems. The proposed approach has been applied to several
Indian rural distribution networks and IEEE 14-bus test system which demonstrated applicability of the proposed
approach.
Index Terms- L-index matrix, Jacobian matrix, sensitivity, Active Power L-Index sensitivity matrix
I. IntroductionAccording to [1], voltage stability refers to the ability of a power system to maintain steady voltages at all buses
in the system after being subjected to a disturbance from a given initial operating condition. It depends on theability to maintain/restore equilibrium between load demand and load supply from the power system. The
increased load and generation in many systems without a corresponding augmentation of the transmission
infrastructure has resulted in the overloading of the transmission lines. As a result, the transmission lines operate
near their steady state limits. The transmission of large amounts of power through the lines results in the largevoltage drops. Sudden disturbances like line generator outage or faults in the transmission lines may result in
conditions that the transmission system may not be able to supply the load demand. This could manifest as a
drop in the system bus voltages which may be sudden or progressive. If the necessary remedial measures are not
taken, then this may lead to the blackout or collapse of the whole system. As a result of a number of voltage
stability incidents reported from various countries, there is a widespread interest in understanding, characterizing
and preventing this phenomenon. This paper is essentially concerned with analyzing the effect of active power on voltage stability.
II. MotivationThe increasing number of power system blackouts in many countries in recent years, is a major source of
concern. Power engineers are very interested in preventing blackouts and ensuring that a constant and reliableelectricity supply is available to all customers. Incipient voltage instability, which may result from continues
load growth or system contingencies, is essentially a local phenomenon. However, sequences of events
accompanying voltage instability may have disastrous effects, including a resultant low-voltage profile in a
significant area of the power network, known as the voltage collapse phenomenon. Severe instances of voltage
collapse, including the August 2003 blackout in North - Eastern U.S.A, Canada, France, Japan, etc.[[2]- [4]],
have highlighted the importance of constantly maintaining an acceptable level of voltage stability. The designand analysis of accurate methods to evaluate the voltage stability of a power system and predict incipient voltage
instability, are therefore of special interest in the field of power system protection and planning.
Static and dynamic approaches are used to analyze the problem of voltage stability. Dynamic analysis
provides the most accurate indication of the time responses of the system [5]. Voltage stability indices is to
predict which bus/line/path is most critical from the voltage stability perspective by assessing at the various parameters of the power system at a particular operating condition. In [7], an index called L-index is calculated
7/28/2019 A New Technique to Find the Effect of Active Power Loading on Voltage Stability and Algorithm to Improve Voltage …
http://slidepdf.com/reader/full/a-new-technique-to-find-the-effect-of-active-power-loading-on-voltage-stability 2/9
Journal of Information Engineering and Applications www.iiste.org
ISSN 2224-5782 (print) ISSN 2225-0506 (online)
Vol.3, No.5, 2013
2
for all the load buses in the system based on the elements and the voltage phasors. The load buses whose L-index values are near 1 indicate that they are prone to voltage instability.
In the literature not much work has been done to study the effect of active power loading on the behavior of
variation of L-Indices. In the [6], the effect of reactive power on the voltage stability is been studied. Lot of
experiments are done and simulations were carried out to find out the effect of active power on voltage stability.Several practical rural radial distribution feeders in India have been successfully analyzed and plots of L-Index
and variation of L-Index with the variation of active power are section.In this paper the effect of reducing real power at a bus on the remaining buses for radial and meshed systems is
found out. Active Power L-Index Sensitivities(LP) matrix which gives the information of the change in value of
L-Index [7] with change in real power at any bus in the system has been proposed. A new method is developed
to improve the stability of the system using Active Power L-Index sensitivities approach(LP) which is applicable
to improve the stability of radial and meshed systems. Linear programming optimization technique has been
used to get location and amount of active power to be changed to make system stable.
III.LITERATURE REVIEW
A. L-Index
This method is proposed in [7] to find the buses which are most prone to voltage instability. In this method the
Y bus matrix of the system is split into rows and columns of generators and load buses. = (1)
= (2)
FLG = - [YLL]-1
[YLG] (3)
= 1 −
(4)
where the subscript“G” :- refers to the generator buses in the system
“L” :- refers to the load buses in the system
A L-index value away from 1 and close to 0 indicates a large voltage stability margin. The maximum of L-
indices(Lmax) of the buses to which it corresponds is the most critical bus. Also the summation of the squares of
the L indices of the individual buses(ΣL2) is used as a relative indicator of the overall voltage stability of the
system at different operating conditions [8].
B. Participation Factors
The participation factor has been proposed in [9]. It is developed as follows. Consider the load flow jacobian
= !" # $%&
(5)
Although both P and Q changes affect system conditions, it is possible to study the effects of reactive power injections on the voltage stability by setting ∆ P (P constant) and deriving the Q-V sensitivities at different loads.
Thus the Equ.5 can be written as
∆Q = [L – M H-1 N] ∆V = JR ∆V (6)
JR = ξ Λη (7)
where
Λ :- left eigen matrix of JR
η :- right eigen matrix of JR
ξ :- eigenvalues of JR
The participation factors for the bus k and the critical mode i are defined as ξ kiη ik
.
IV. EFFECT OF ACTIVE POWER LOADING ON L-INDEX
L-index for the 15 bus radial system given in Appendix Table VII is calculated at each bus, but for better
7/28/2019 A New Technique to Find the Effect of Active Power Loading on Voltage Stability and Algorithm to Improve Voltage …
http://slidepdf.com/reader/full/a-new-technique-to-find-the-effect-of-active-power-loading-on-voltage-stability 3/9
Journal of Information Engineering and Applications www.iiste.org
ISSN 2224-5782 (print) ISSN 2225-0506 (online)
Vol.3, No.5, 2013
3
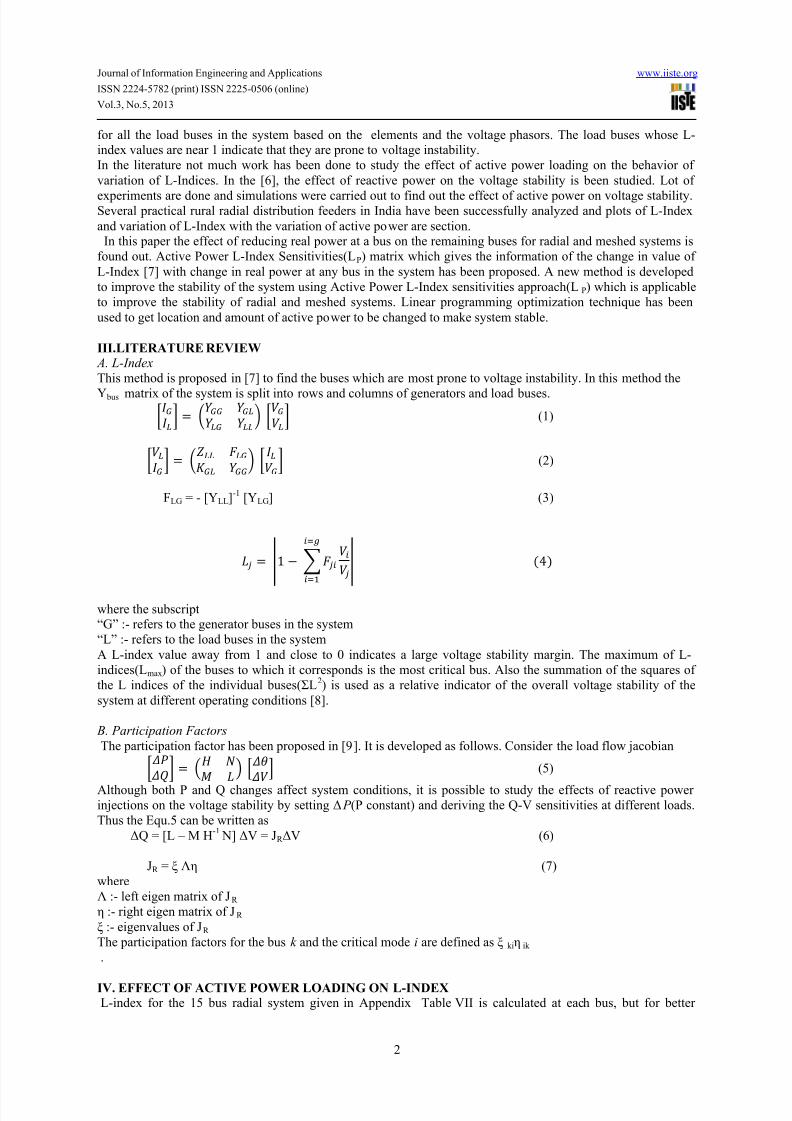
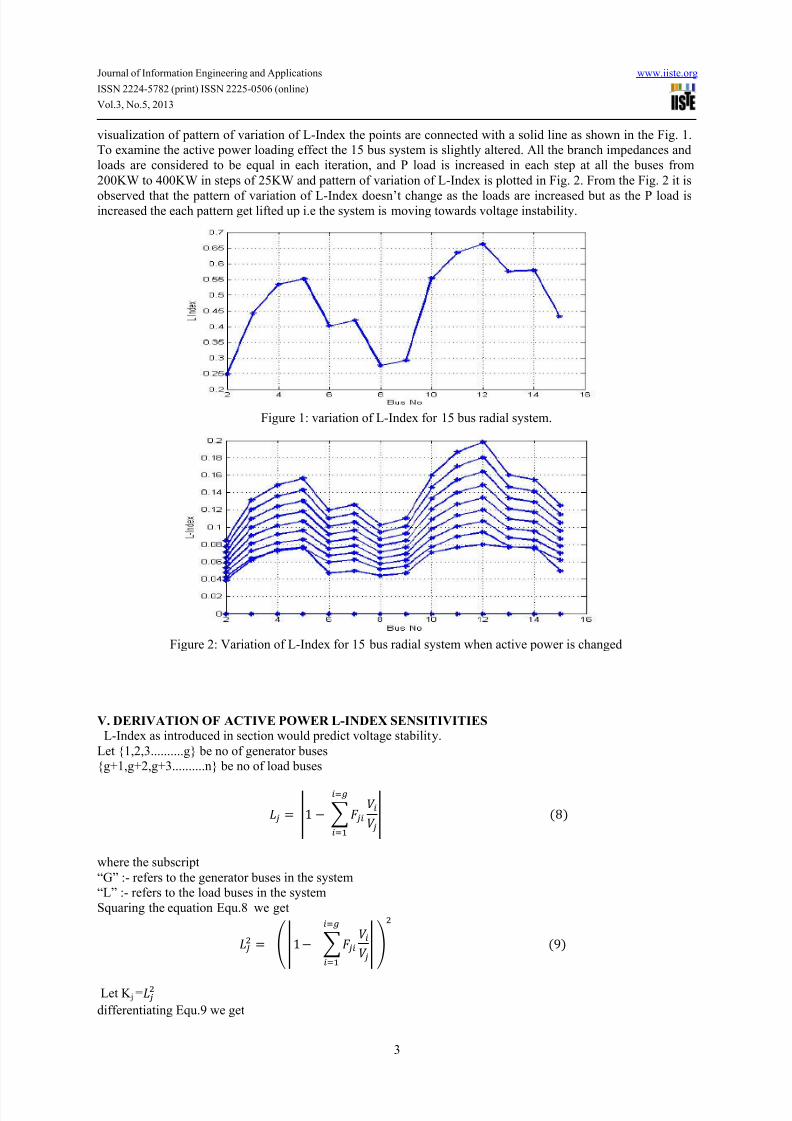
visualization of pattern of variation of L-Index the points are connected with a solid line as shown in the Fig. 1.To examine the active power loading effect the 15 bus system is slightly altered. All the branch impedances and
loads are considered to be equal in each iteration, and P load is increased in each step at all the buses from
200KW to 400KW in steps of 25KW and pattern of variation of L-Index is plotted in Fig. 2. From the Fig. 2 it is
observed that the pattern of variation of L-Index doesn’t change as the loads are increased but as the P load isincreased the each pattern get lifted up i.e the system is moving towards voltage instability.
Figure 1: variation of L-Index for 15 bus radial system.
Figure 2: Variation of L-Index for 15 bus radial system when active power is changed
V. DERIVATION OF ACTIVE POWER L-INDEX SENSITIVITIES
L-Index as introduced in section would predict voltage stability.
Let {1,2,3..........g} be no of generator buses{g+1,g+2,g+3..........n} be no of load buses
= 1 − (8)
where the subscript
“G” :- refers to the generator buses in the system“L” :- refers to the load buses in the system
Squaring the equation Equ.8 we get
= * 1 − + (9)
Let K j =
differentiating Equ.9 we get
7/28/2019 A New Technique to Find the Effect of Active Power Loading on Voltage Stability and Algorithm to Improve Voltage …
http://slidepdf.com/reader/full/a-new-technique-to-find-the-effect-of-active-power-loading-on-voltage-stability 4/9
Journal of Information Engineering and Applications www.iiste.org
ISSN 2224-5782 (print) ISSN 2225-0506 (online)
Vol.3, No.5, 2013
4
= − 2 *1 −
+ *
+ (10)
From the newton’s power flow equation we have = / / / / $%& (11)
In order to see the effect of change in real power, make ∆Q as zero. By doing so we have
[J11] ∆θ + [J12]∆V = ∆P (12)
[J21] ∆θ + [J22]∆V = 0 (13)Rewriting Equ. 12 we get
[J11] ∆θ = ∆P - [J12]∆V (14)
∆θ = [J11]-1
∆P - [J11]-1
[J12]∆V (15)
Substituting Equ.15 in Equ. 13
[J21] [J11]-1
∆P - [J21] [J11]-1
[ J12]∆V + [J22]∆V = 0 (16)
[J21] [J11]-1
∆P = ([J21] [J11]-1
[ J12]∆V - [J22]) ∆V (17)
([J21] [J11]-1
[J12] - [J22])-1
( [ J21] [J11]-1
)∆P = ∆V (18)
Let ([J21] [J11]-1
[J12] - [J22])-1
( [ J21] [J11]-1
= JRP
Let the elements of JRP be
JRP =
3, 3, ⋯ 3,73, 3, … 3,7
⋮37, ⋮37, ⋱… ⋮37,7 ;(19)
= 37
(20)
From Equ.10 we get
∆ = −2 *1 − + *
+ (21)
Substituting Equ.20 in Equ.21
∆ = −2 *1 − + *
+ 3 (22)7
As ∆K j = 2L j∆L j
As ∆K j = 2L j∆L j
∆ = − 1 *1 − + *
+ 3
7 (2)
− 1 *1 − + *
+ 3
7 = @
7/28/2019 A New Technique to Find the Effect of Active Power Loading on Voltage Stability and Algorithm to Improve Voltage …
http://slidepdf.com/reader/full/a-new-technique-to-find-the-effect-of-active-power-loading-on-voltage-stability 5/9
Journal of Information Engineering and Applications www.iiste.org
ISSN 2224-5782 (print) ISSN 2225-0506 (online)
Vol.3, No.5, 2013
5
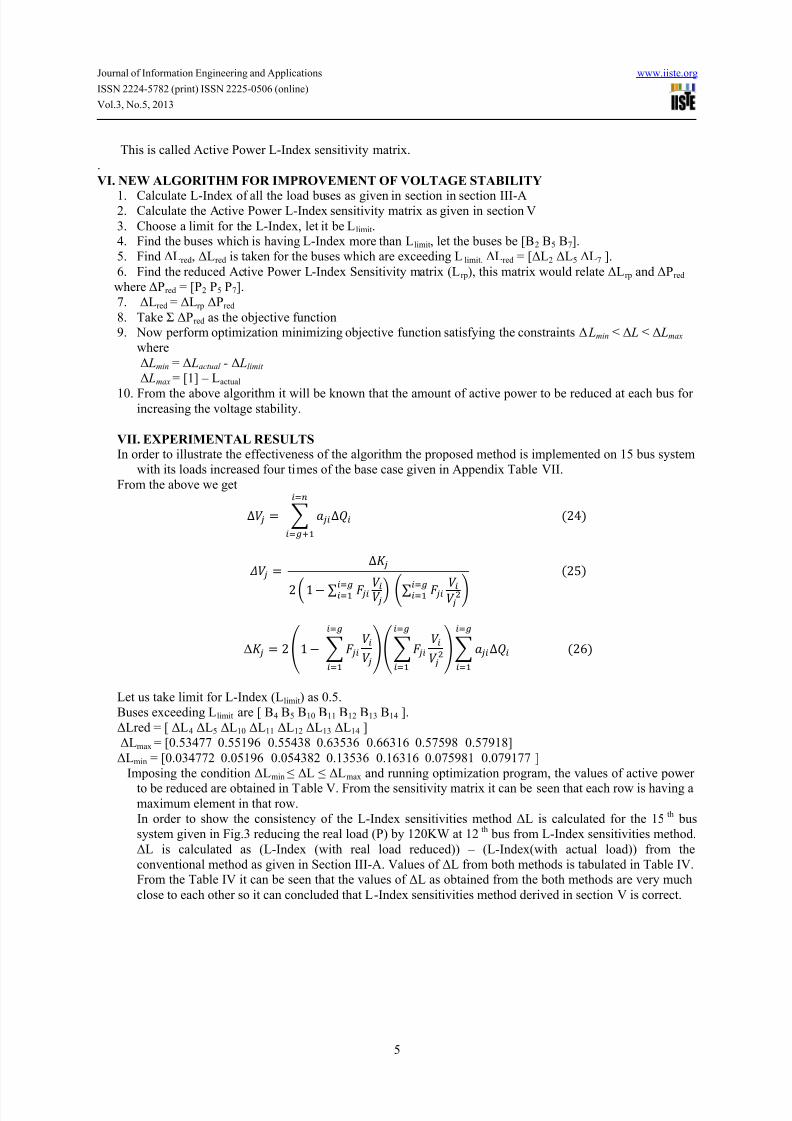
This is called Active Power L-Index sensitivity matrix.
.
VI. NEW ALGORITHM FOR IMPROVEMENT OF VOLTAGE STABILITY
1. Calculate L-Index of all the load buses as given in section in section III-A2. Calculate the Active Power L-Index sensitivity matrix as given in section V
3. Choose a limit for the L-Index, let it be Llimit.4. Find the buses which is having L-Index more than Llimit, let the buses be [B2 B5 B7].
5. Find ∆Lred, ∆Lred is taken for the buses which are exceeding Llimit. ∆Lred = [∆L2 ∆L5 ∆L7 ].
6. Find the reduced Active Power L-Index Sensitivity matrix (Lrp), this matrix would relate ∆Lrp and ∆Pred
where ∆Pred = [P2 P5 P7].
7. ∆Lred = ∆Lrp ∆Pred
8. Take Σ ∆Pred as the objective function9. Now perform optimization minimizing objective function satisfying the constraints ∆ Lmin ≤ ∆ L ≤ ∆ Lmax
where
∆ Lmin = ∆ Lactual - ∆ Llimit
∆ Lmax = [1] – Lactual
10. From the above algorithm it will be known that the amount of active power to be reduced at each bus for increasing the voltage stability.
VII. EXPERIMENTAL RESULTS
In order to illustrate the effectiveness of the algorithm the proposed method is implemented on 15 bus system
with its loads increased four times of the base case given in Appendix Table VII.
From the above we get
∆ = A∆ (24)7
=∆
2 1 − ∑ C∑ D (25)
∆ = 2 *1 − + *
+ A∆
(26)
Let us take limit for L-Index (Llimit) as 0.5.
Buses exceeding Llimit are [ B4 B5 B10 B11 B12 B13 B14 ].
∆Lred = [ ∆L4 ∆L5 ∆L10 ∆L11 ∆L12 ∆L13 ∆L14 ]
∆Lmax = [0.53477 0.55196 0.55438 0.63536 0.66316 0.57598 0.57918]
∆Lmin = [0.034772 0.05196 0.054382 0.13536 0.16316 0.075981 0.079177 ]
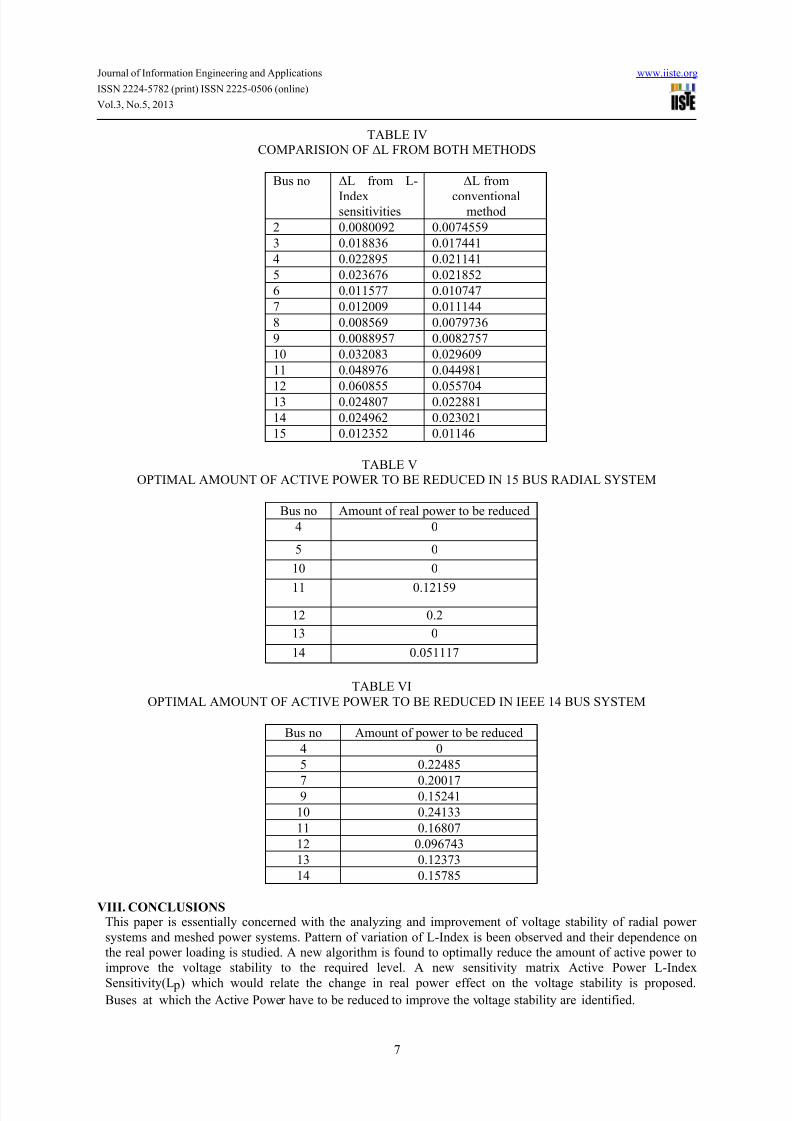
Imposing the condition ∆Lmin ≤ ∆L ≤ ∆Lmax and running optimization program, the values of active power
to be reduced are obtained in Table V. From the sensitivity matrix it can be seen that each row is having amaximum element in that row.
In order to show the consistency of the L-Index sensitivities method ∆L is calculated for the 15th
bus
system given in Fig.3 reducing the real load (P) by 120KW at 12th
bus from L-Index sensitivities method.
∆L is calculated as (L-Index (with real load reduced)) – (L-Index(with actual load)) from the
conventional method as given in Section III-A. Values of ∆L from both methods is tabulated in Table IV.From the Table IV it can be seen that the values of ∆L as obtained from the both methods are very much
close to each other so it can concluded that L-Index sensitivities method derived in section V is correct.
7/28/2019 A New Technique to Find the Effect of Active Power Loading on Voltage Stability and Algorithm to Improve Voltage …
http://slidepdf.com/reader/full/a-new-technique-to-find-the-effect-of-active-power-loading-on-voltage-stability 6/9
Journal of Information Engineering and Applications www.iiste.org
ISSN 2224-5782 (print) ISSN 2225-0506 (online)
Vol.3, No.5, 2013
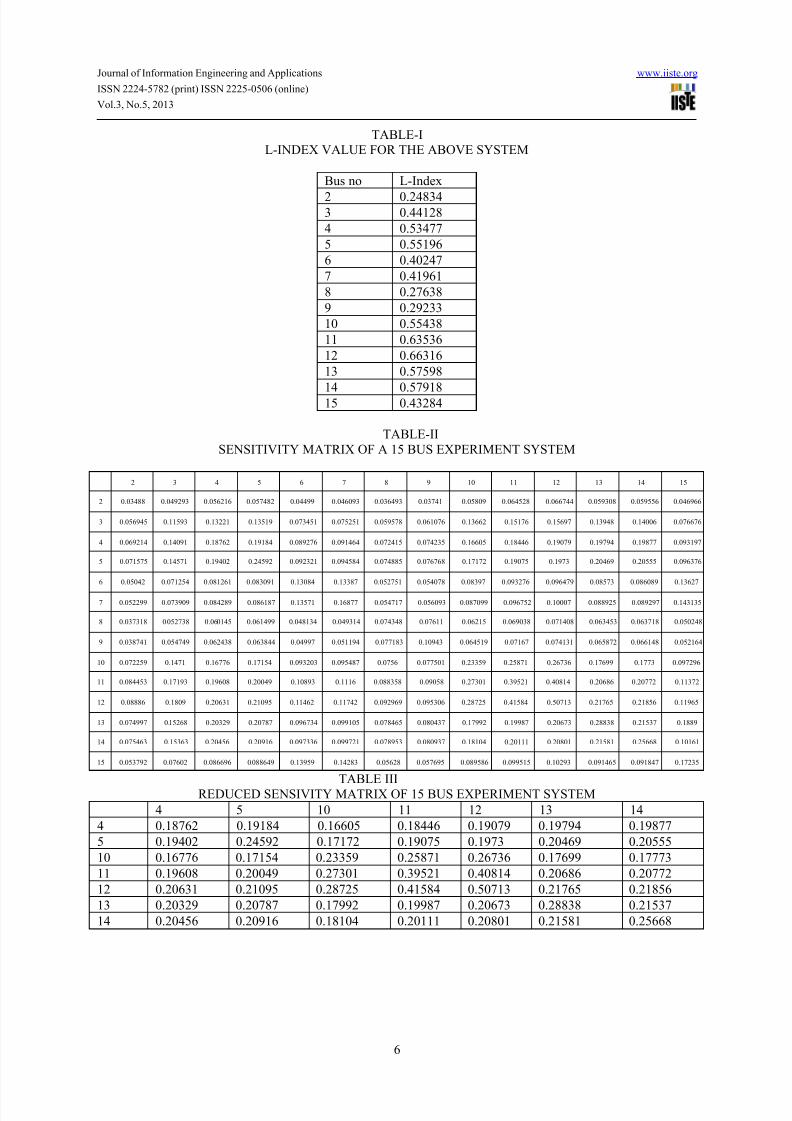
6
TABLE-IL-INDEX VALUE FOR THE ABOVE SYSTEM
Bus no L-Index
2 0.248343 0.44128
4 0.53477
5 0.55196
6 0.40247
7 0.41961
8 0.27638
9 0.29233
10 0.55438
11 0.63536
12 0.66316
13 0.57598
14 0.5791815 0.43284
TABLE-II
SENSITIVITY MATRIX OF A 15 BUS EXPERIMENT SYSTEM
2 3 4 5 6 7 8 9 10 11 12 13 14 15
2 0.03488 0.049293 0.056216 0.057482 0.04499 0.046093 0.036493 0.03741 0.05809 0.064528 0.066744 0.059308 0.059556 0.046966
3 0.056945 0.11593 0.13221 0.13519 0.073451 0.075251 0.059578 0.061076 0.13662 0.15176 0.15697 0.13948 0.14006 0.076676
4 0.069214 0.14091 0.18762 0.19184 0.089276 0.091464 0.072415 0.074235 0.16605 0.18446 0.19079 0.19794 0.19877 0.093197
5 0.071575 0.14571 0.19402 0.24592 0.092321 0.094584 0.074885 0.076768 0.17172 0.19075 0.1973 0.20469 0.20555 0.096376
6 0.05042 0.071254 0.081261 0.083091 0.13084 0.13387 0.052751 0.054078 0.08397 0.093276 0.096479 0.08573 0.086089 0.13627
7 0.052299 0.073909 0.084289 0.086187 0.13571 0.16877 0.054717 0.056093 0.087099 0.096752 0.10007 0.088925 0.089297 0.143135
8 0.037318 0.052738 0.060145 0.061499 0.048134 0.049314 0.074348 0.07611 0.06215 0.069038 0.071408 0.063453 0.063718 0.050248
9 0.038741 0.054749 0.062438 0.063844 0.04997 0.051194 0.077183 0.10943 0.064519 0.07167 0.074131 0.065872 0.066148 0.052164
10 0.072259 0.1471 0.16776 0.17154 0.093203 0.095487 0.0756 0.077501 0.23359 0.25871 0.26736 0.17699 0.1773 0.097296
11 0.084453 0.17193 0.19608 0.20049 0.10893 0.1116 0.088358 0.09058 0.27301 0.39521 0.40814 0.20686 0.20772 0.11372
12 0.08886 0.1809 0.20631 0.21095 0.11462 0.11742 0.092969 0.095306 0.28725 0.41584 0.50713 0.21765 0.21856 0.11965
13 0.074997 0.15268 0.20329 0.20787 0.096734 0.099105 0.078465 0.080437 0.17992 0.19987 0.20673 0.28838 0.21537 0.1889
14 0.075463 0.15363 0.20456 0.20916 0.097336 0.099721 0.078953 0.080937 0.18104 0.20111 0.20801 0.21581 0.25668 0.10161
15 0.053792 0.07602 0.086696 0.088649 0.13959 0.14283 0.05628 0.057695 0.089586 0.099515 0.10293 0.091465 0.091847 0.17235
TABLE IIIREDUCED SENSIVITY MATRIX OF 15 BUS EXPERIMENT SYSTEM
4 5 10 11 12 13 14
4 0.18762 0.19184 0.16605 0.18446 0.19079 0.19794 0.19877
5 0.19402 0.24592 0.17172 0.19075 0.1973 0.20469 0.20555
10 0.16776 0.17154 0.23359 0.25871 0.26736 0.17699 0.17773
11 0.19608 0.20049 0.27301 0.39521 0.40814 0.20686 0.20772
12 0.20631 0.21095 0.28725 0.41584 0.50713 0.21765 0.21856
13 0.20329 0.20787 0.17992 0.19987 0.20673 0.28838 0.21537
14 0.20456 0.20916 0.18104 0.20111 0.20801 0.21581 0.25668
7/28/2019 A New Technique to Find the Effect of Active Power Loading on Voltage Stability and Algorithm to Improve Voltage …
http://slidepdf.com/reader/full/a-new-technique-to-find-the-effect-of-active-power-loading-on-voltage-stability 7/9
Journal of Information Engineering and Applications www.iiste.org
ISSN 2224-5782 (print) ISSN 2225-0506 (online)
Vol.3, No.5, 2013
7
TABLE IVCOMPARISION OF ∆L FROM BOTH METHODS
Bus no ∆L from L-
Indexsensitivities
∆L from
conventionalmethod
2 0.0080092 0.0074559
3 0.018836 0.017441
4 0.022895 0.021141
5 0.023676 0.021852
6 0.011577 0.010747
7 0.012009 0.011144
8 0.008569 0.0079736
9 0.0088957 0.0082757
10 0.032083 0.029609
11 0.048976 0.044981
12 0.060855 0.05570413 0.024807 0.022881
14 0.024962 0.023021
15 0.012352 0.01146
TABLE VOPTIMAL AMOUNT OF ACTIVE POWER TO BE REDUCED IN 15 BUS RADIAL SYSTEM
Bus no Amount of real power to be reduced
4 0
5 0
10 0
11 0.12159
12 0.2
13 0
14 0.051117
TABLE VI
OPTIMAL AMOUNT OF ACTIVE POWER TO BE REDUCED IN IEEE 14 BUS SYSTEM
Bus no Amount of power to be reduced
4 0
5 0.22485
7 0.200179 0.15241
10 0.24133
11 0.16807
12 0.096743
13 0.12373
14 0.15785
VIII. CONCLUSIONSThis paper is essentially concerned with the analyzing and improvement of voltage stability of radial power
systems and meshed power systems. Pattern of variation of L-Index is been observed and their dependence on
the real power loading is studied. A new algorithm is found to optimally reduce the amount of active power to
improve the voltage stability to the required level. A new sensitivity matrix Active Power L-Index
Sensitivity(L p) which would relate the change in real power effect on the voltage stability is proposed.Buses at which the Active Power have to be reduced to improve the voltage stability are identified.
7/28/2019 A New Technique to Find the Effect of Active Power Loading on Voltage Stability and Algorithm to Improve Voltage …
http://slidepdf.com/reader/full/a-new-technique-to-find-the-effect-of-active-power-loading-on-voltage-stability 8/9
Journal of Information Engineering and Applications www.iiste.org
ISSN 2224-5782 (print) ISSN 2225-0506 (online)
Vol.3, No.5, 2013
8
References[1] Prabha Kundur. Definition and Classification of Power System Stability By IEEE/CIGRE Joint Task Force
on Stability Terms and Definitions
[2] Thakahashi K and Nomura Y. The Power System Failure on July 23rd
, 1987 In Tokyo, CIGRE SC-37
meeting, 37.8707,1987[3] Isoda.H and Thanaka. “Power System Failure in EDF on Jan. 12nd,1987”, CRIEPI Research Report
No.T87903, 1987[4] Bourgin.F, Testud.G, Heilbronn and Verseille. Present Practice and Trends on the French Power System to
Prevent Voltage Collapse”, IEEE Trans. Vol.PS-8, No.3, August 1993
[5] Gao B, Kundur P, Morisson, G.K. Towards the Development of a systematic Approach for Voltage Stability
Assessment of Large-Scale Power Systems”, IEEE Transactions on Power Systems, vil. 11, no. 3, pp1314-1319
[6] Rajendar Gogu and Basavaraja Banakara A Novel Algorithm for Capacitor placement to improve voltage
stability of Radial and Meshed Power Systems, Journal of Information Engineering and Applications ISSN2224-5782 ISSN 2225-0506 Vol.2, No.11, 2012
[7]Kessel p and Glavitsch. Estimating the voltage stability in power system, IEEE Transaction on Power
Delivery, Vol PWRD-1, No 3, july 1986, pp 346-354
[8] Thukaram D and Abraham Lomi. Selection of static VAR compensator Location and size for system voltage
stability improvement, Electrical Power System Research, Vol54, May2000, pp 139-150[9] Yakout Mansour , Wilsun Xu, Fernando Alovardo and Chhewang Rinzin. SVC Placement Using Criticalmodes of Voltage Instability, IEEE Transaction on Power Systems, Vol 9, May 19
About the Authors
Mahipal Bhukya received his B.tech.Degree in Electrical and Electronics Engineering from
BVRIT, Narsapur, Medak, India in 2009 and he has completed his Master of Engineering in the Department of Electrical Engineering at Indian Institute of Science, Banglore .At present he is working as Assistant professor in
the Department of Electrical and Electronics Engineering at KITS Warangal, India. His area of interests are
Voltage Stability and high voltage Transients.
P Venugopal Rao, He is working as Professor & HOD in the Department of Electrical and
Electrocnics Engineering at KITS Warangal, India. He has completed his M.Tech in the Department of electrical engineering at REC Warangal. His area of interests are Power Electronics applications in power
Systems and FACTS .
Swetha Thuti She has completed her Master of Technology in the Department of Electrical and
Electronics Engineering at SR Engineering College, Warangal, India. She is working as Assistant professor inthe Department of Electrical and Electronics Engineering at KITS Warangal. Her area of interests are Power
Electronics and Power Systems.
G Babu Naik ,from BMSIT, Banglore, India. He is working as Assistant professor in theDepartment of Electrical. He has completed his Master of Engineering in the Department of Electrical
Engineering at Indian Institute of Science, Banglore. His area of interests are Power System and Power
electronics.
7/28/2019 A New Technique to Find the Effect of Active Power Loading on Voltage Stability and Algorithm to Improve Voltage …
http://slidepdf.com/reader/full/a-new-technique-to-find-the-effect-of-active-power-loading-on-voltage-stability 9/9
Journal of Information Engineering and Applications www.iiste.org
ISSN 2224-5782 (print) ISSN 2225-0506 (online)
Vol.3, No.5, 2013
9
Ch.Naresh Kumar ,He is working as Executive Engineering at HAL, Banglore.He hascompleted his Master of Engineering in the Department of Electrical Engineering at Indian Institute of Science,
Banglore .His area of interests are Voltage Stability and Power Electronics.
APPENDIX
TABLE VII
LINE DATA AND NOMINAL LOAD DATA OF 15 BUS SYSTEM
Node PLo
(kW)
QLo
(kVAR)
Sending
end
Receiving
node
R
(ohms)
X
(ohms)1 0 0 1 2 1.35309 1.32349
2 44.1 44.1 2 3 1.17024 1.14464
3 70 70 3 4 0.84111 0.82271
4 140 140 4 5 1.52348 1.02760
5 44.1 44.1 2 8 2.01317 1.35790
6 140 140 8 9 1.68671 1.13770
7 70 70 2 6 2.55727 1.72490
8 70 70 6 15 1.08820 0.73400
9 44.1 44.1 6 7 1.25143 0.84410
10 140 140 3 10 1.79553 1.21110
11 70 70 10 11 2.44845 1.65150
12 44.1 44.1 11 12 2.01317 1.3579013 70 70 4 13 2.23081 1.50470
14 140 140 4 14 1.19702 0.80740
15 140 140


![52407115 Voltage Stability[1]](https://img.pdfslide.net/doc/110x75/577d225a1a28ab4e1e97265d/52407115-voltage-stability1.jpg)