Embed Size (px)
Citation preview

A New View of the Food ChainStefano NatellaMujtaba RanaVamil DivanCharlie Mills
Sugar
December, 2013
Sugar supply chain
September 11, 2013
1
- Manufacturers, e.g. Nestle, Coca-Cola, Pepsi, Kraft, Mondeléz
- Flavouring, e.g. DSM, Givaudan
Food & Beverage
- Agribusiness, e.g. ADM
- Processors, e.g. ABF, Tongaat
Agribusiness / Sugarproducers
- Trading, e.g. Glencore, Noble
- Refiners, e.g. Cargill, Bunge
Trading / Refining
- Agribusiness, e.g. Wilmar
- Processors, e.g. ABF, Cosan
Sweeteners
- Government
- Health Authorities
- Taxation
Regulation ?
- Bottlers, e.g. Coca-Cola FEMSA, Coca-Cola
Hellenic
Packaging
CONSUMERS
- Pharma. e.g. Novo Nordisk, Sanofi
- Managed Care. e.g. United Health
-Medical Care. e.g. Fresenius
Healthcare
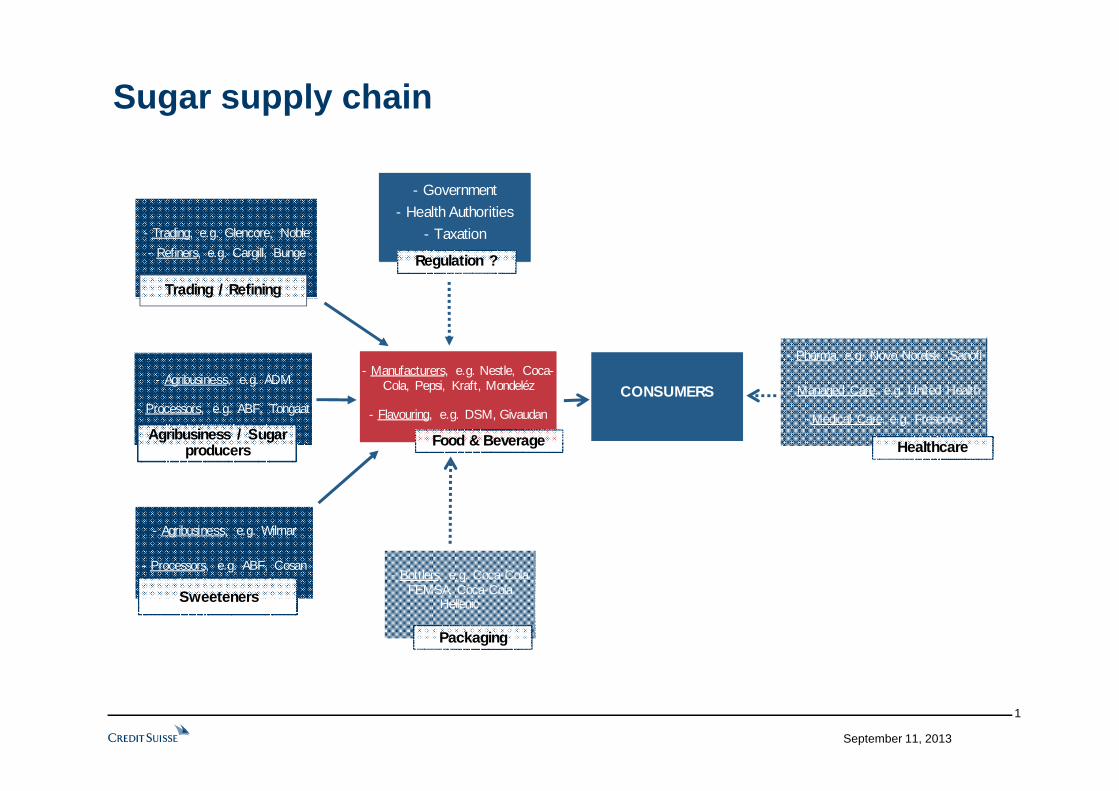
Sugar and Type II Diabetes – Medical History
Etienne Lancereaux (1829-1910)French doctor who studied diabetes and pancreas
Haven Emerson (1874-1957)New York city Public Health Commissioner and Columbia Professor
Sir Frederick Banting (1891-1941)Nobel Peace Prize for medicine for insulin discovery (1923)
John Yudkin (1910-1995)British physiologist and scientist
“Fat diabetes is due to over consumption of sugar” (1877)
“Sweetness of Death” (1924)
“In the U.S. the incidence of diabetes has increased proportionally with the per capita consumption of cane sugar” (1929)
Pure, White and Deadly (1972)
September 11, 2013 2
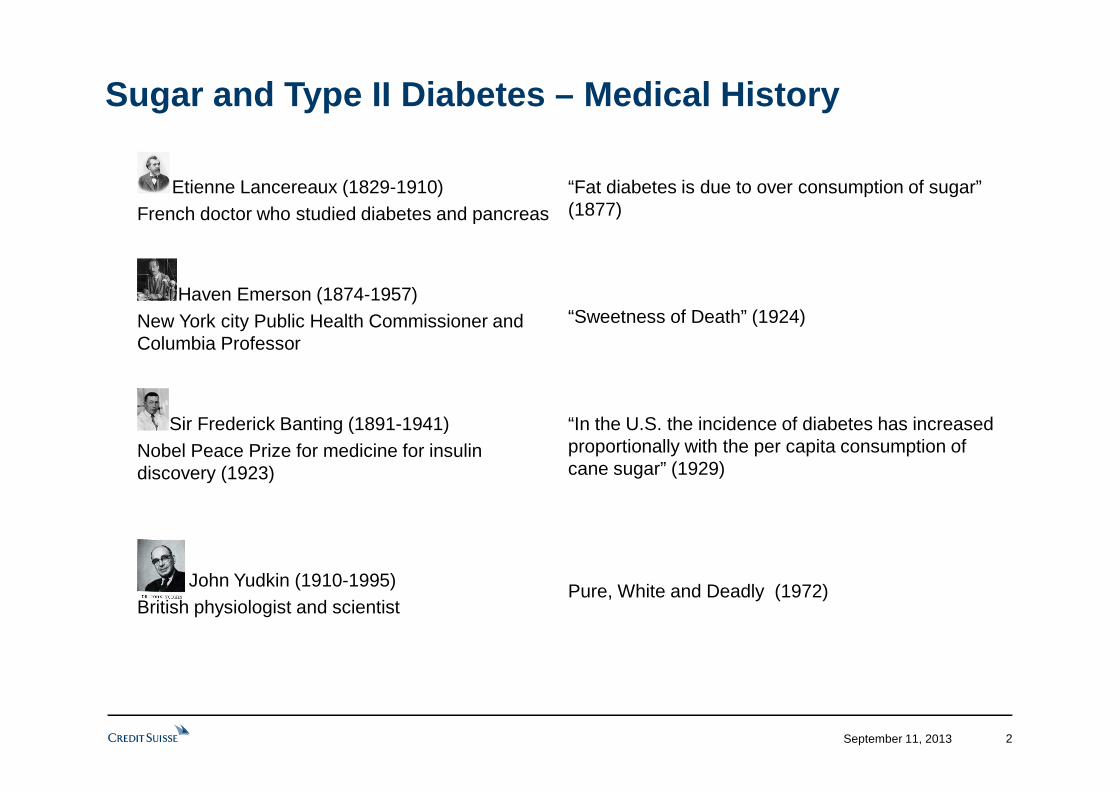
September 11, 2013 3Source: Stephan J. Guyenet and Jeremy Landen
Medical Research: Increase in Sugar Consumption
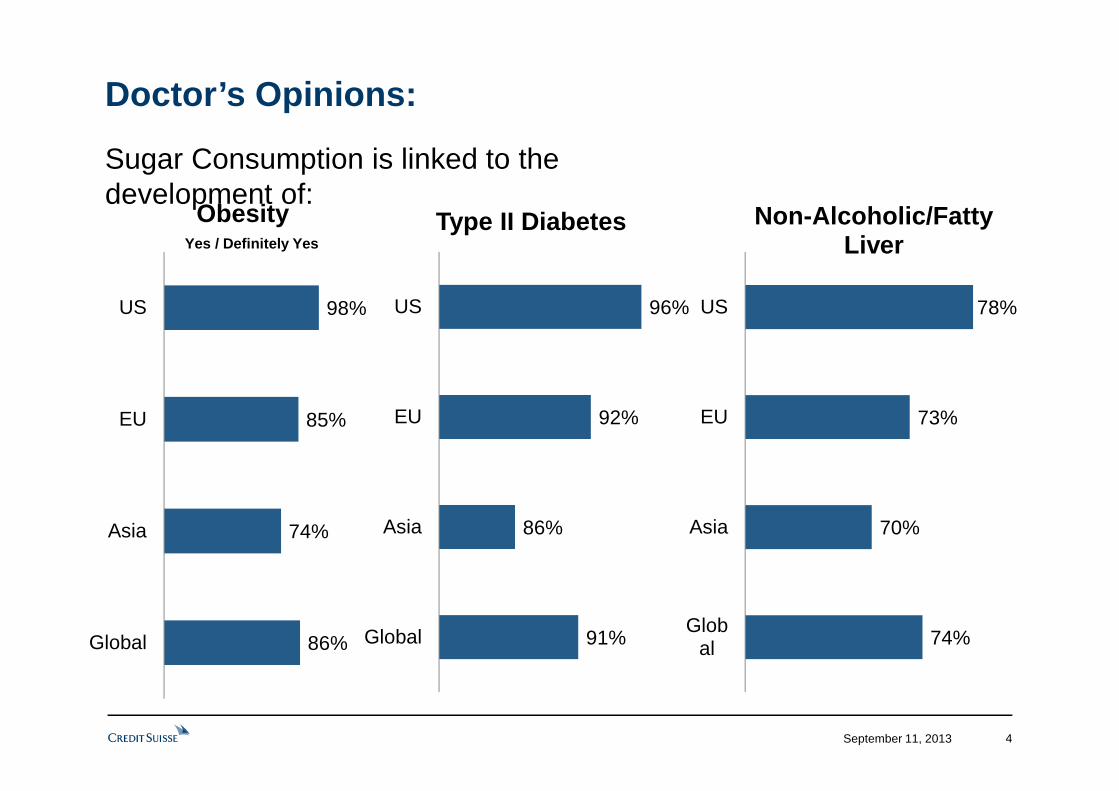
86%
74%
85%
98%
Global
Asia
EU
US
Obesity
September 11, 2013 4
91%
86%
92%
96%
Global
Asia
EU
US
Type II Diabetes
74%
70%
73%
78%
Global
Asia
EU
US
Non-Alcoholic/Fatty Liver
Sugar Consumption is linked to the development of:
Yes / Definitely Yes
Doctor’s Opinions:
Septem
ber 11, 2013
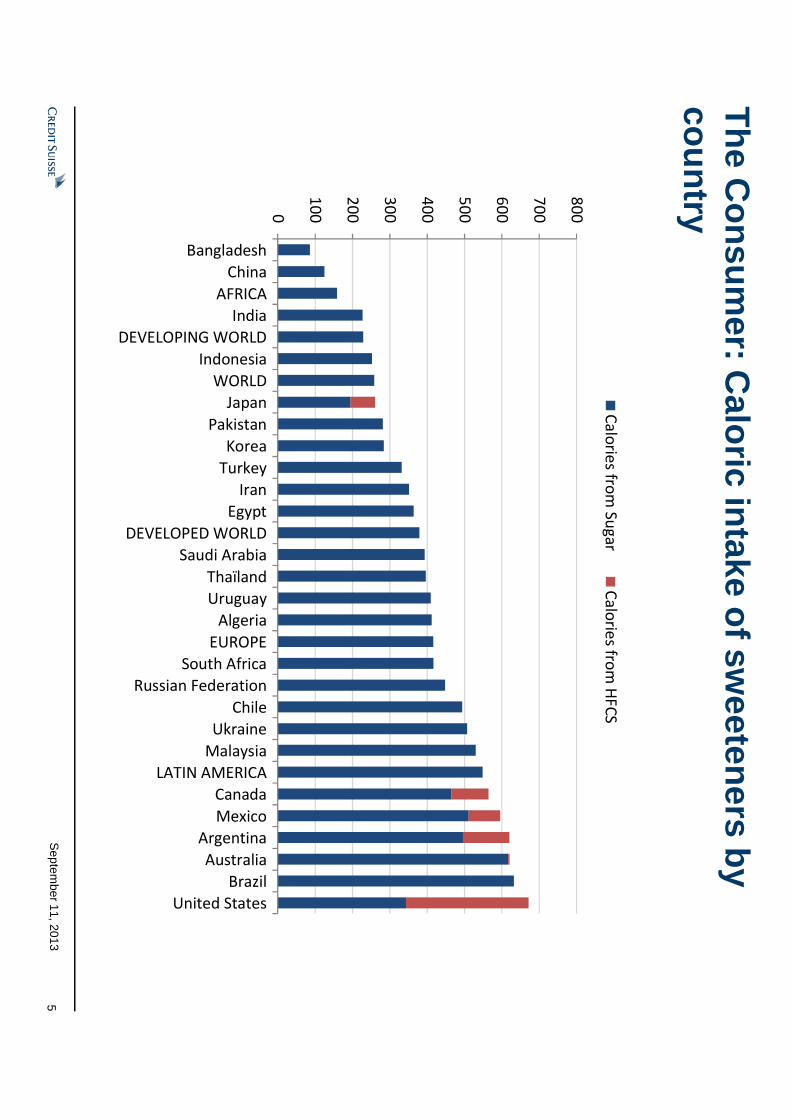
The C
onsumer: C
aloric intake of sw
eeteners by country
0
10
0
20
0
30
0
40
0
50
0
60
0
70
0
80
0
Bangladesh
China
AFRICA
India
DEVELOPING WORLD
Indonesia
WORLD
Japan
Pakistan
Korea
Turkey
Iran
Egypt
DEVELOPED WORLD
Saudi Arabia
Thaïland
Uruguay
Algeria
EUROPE
South Africa
Russian Federation
Chile
Ukraine
Malaysia
LATIN AMERICA
Canada
Mexico
Argentina
Australia
Brazil
United States
Ca
lorie
s from
Su
ga
rC
alo
ries fro
m H
FC
S
5
September 11, 2013 6
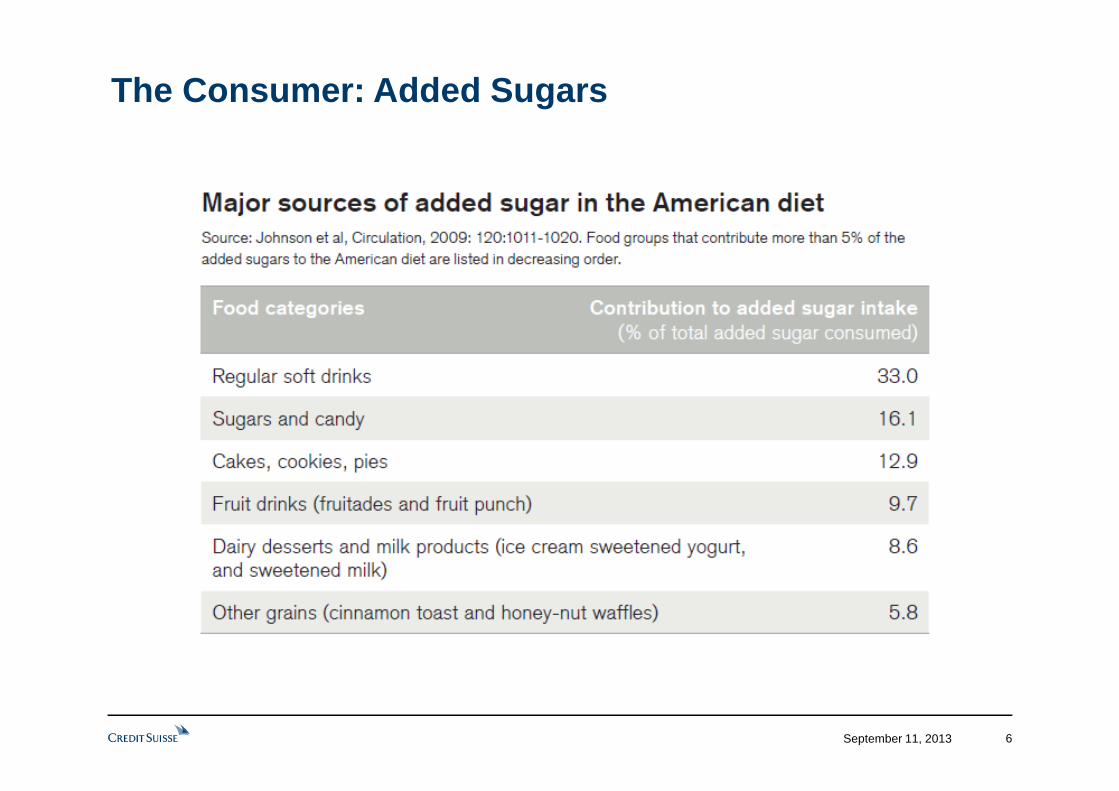
The Consumer: Added Sugars
September 11, 2013 7
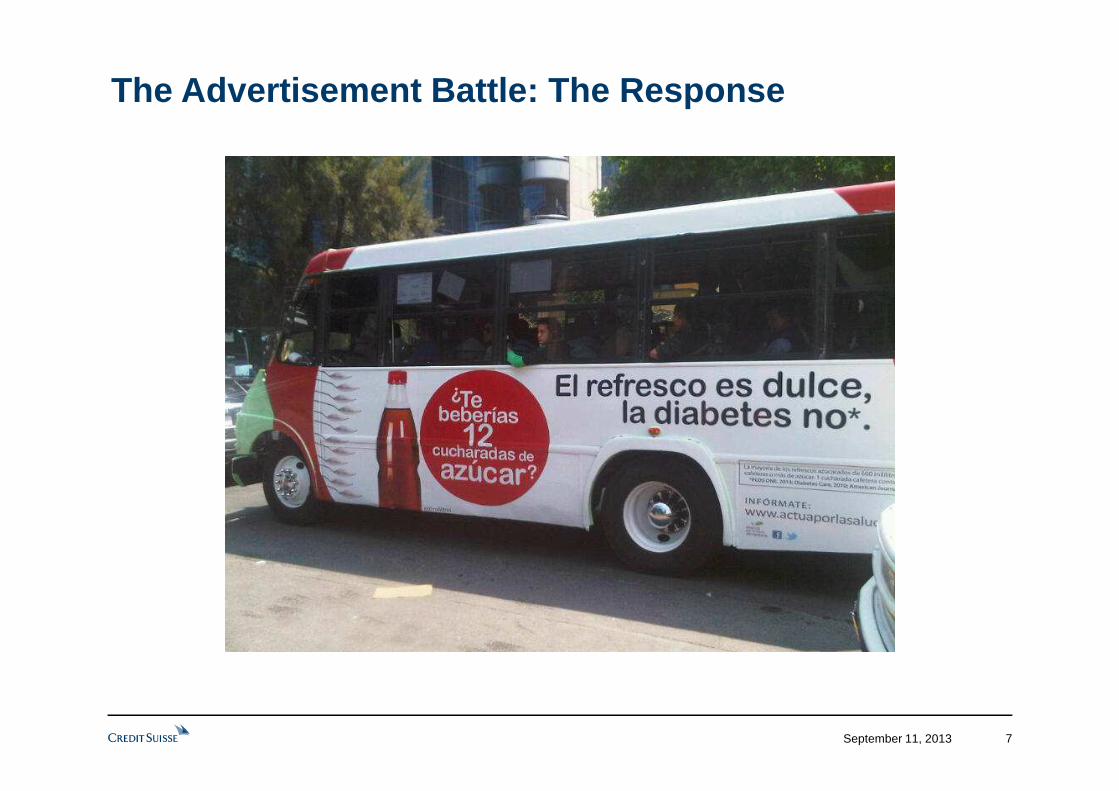
The Advertisement Battle: The Response
September 11, 2013
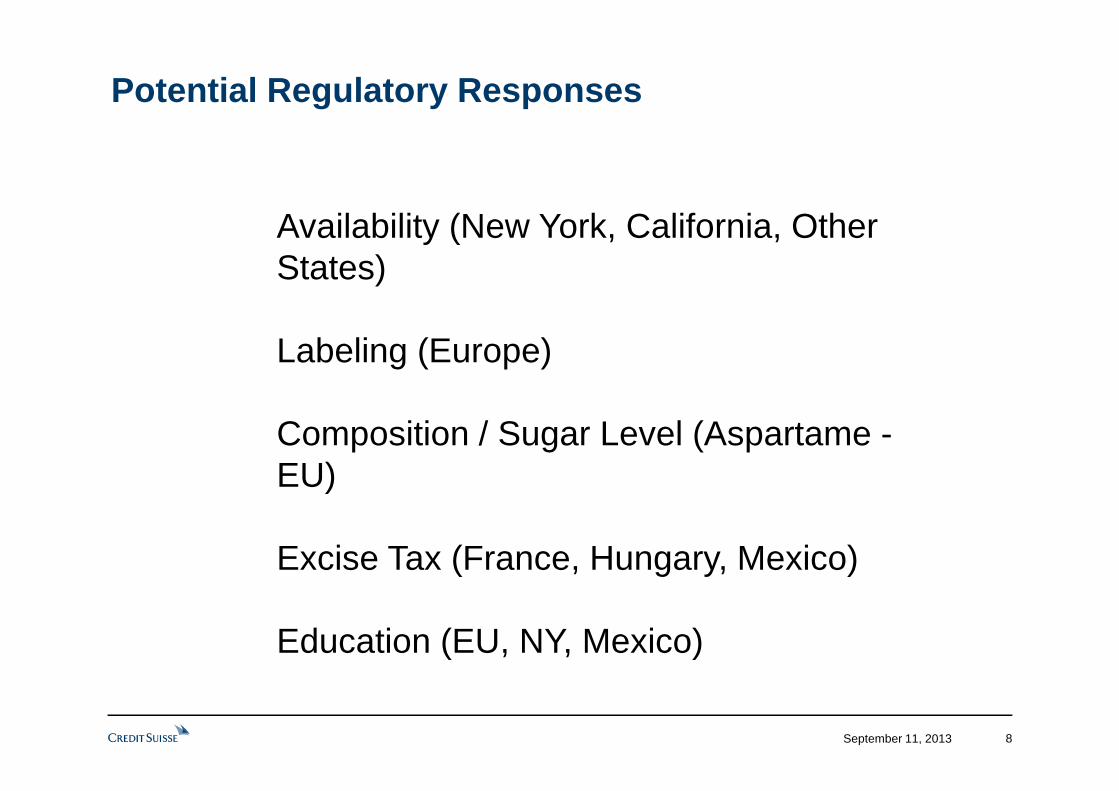
� Availability (New York, California, Other States)
� Labeling (Europe)
� Composition / Sugar Level (Aspartame -EU)
� Excise Tax (France, Hungary, Mexico)
� Education (EU, NY, Mexico)
8
Potential Regulatory Responses
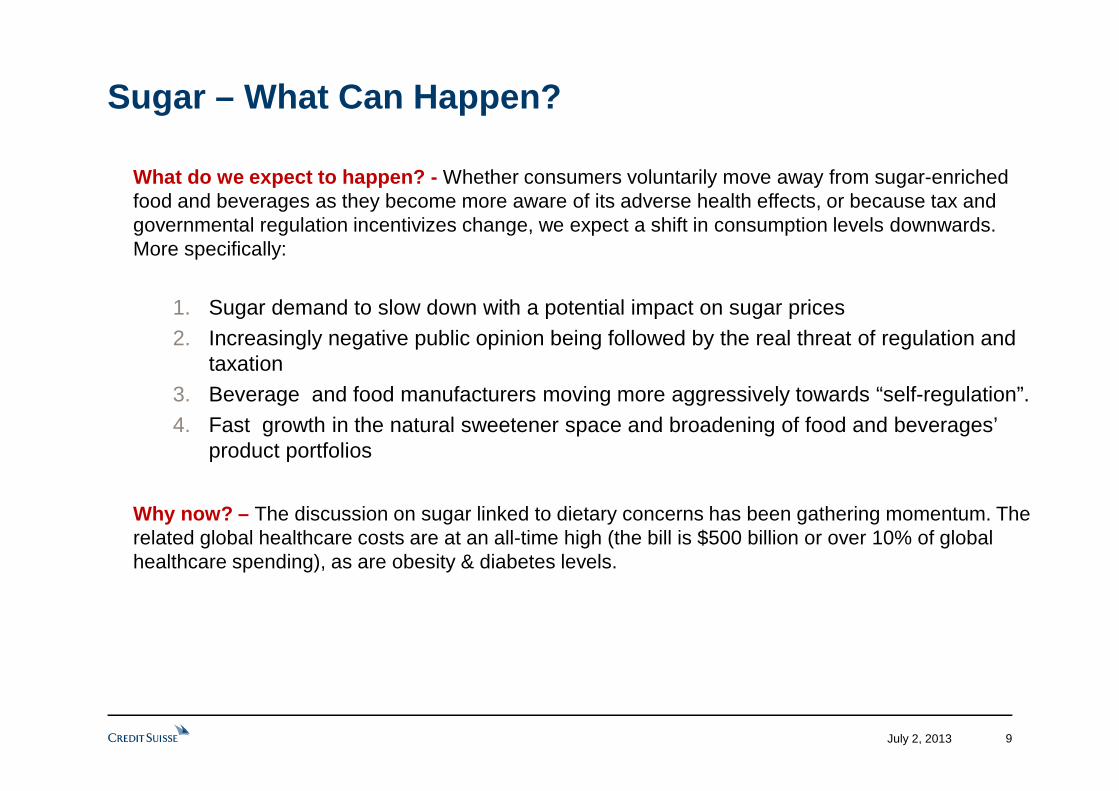
� What do we expect to happen? - Whether consumers voluntarily move away from sugar-enriched food and beverages as they become more aware of its adverse health effects, or because tax and governmental regulation incentivizes change, we expect a shift in consumption levels downwards. More specifically:
1. Sugar demand to slow down with a potential impact on sugar prices2. Increasingly negative public opinion being followed by the real threat of regulation and
taxation3. Beverage and food manufacturers moving more aggressively towards “self-regulation”.4. Fast growth in the natural sweetener space and broadening of food and beverages’
product portfolios
� Why now? – The discussion on sugar linked to dietary concerns has been gathering momentum. The related global healthcare costs are at an all-time high (the bill is $500 billion or over 10% of global healthcare spending), as are obesity & diabetes levels.
July 2, 2013 9
Sugar – What Can Happen?
September 11, 2013 10
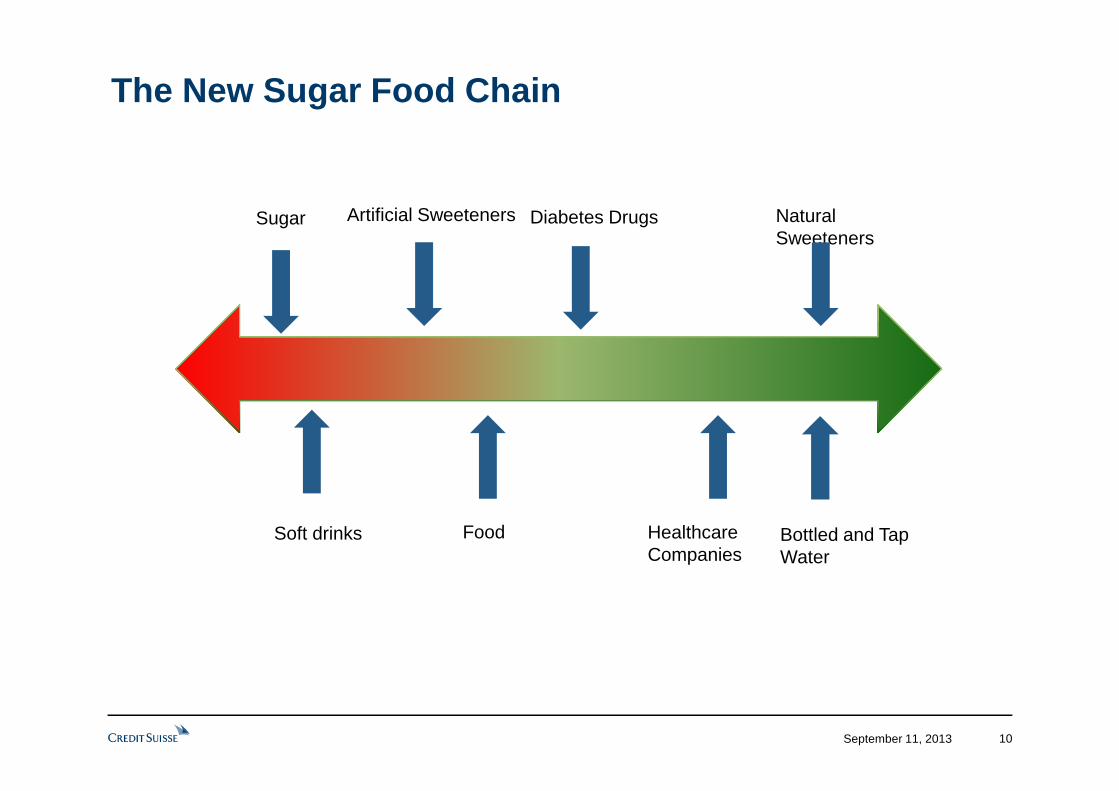
Sugar Diabetes Drugs Natural Sweeteners
Soft drinks Food Healthcare Companies
Artificial Sweeteners
The New Sugar Food Chain
Bottled and Tap Water
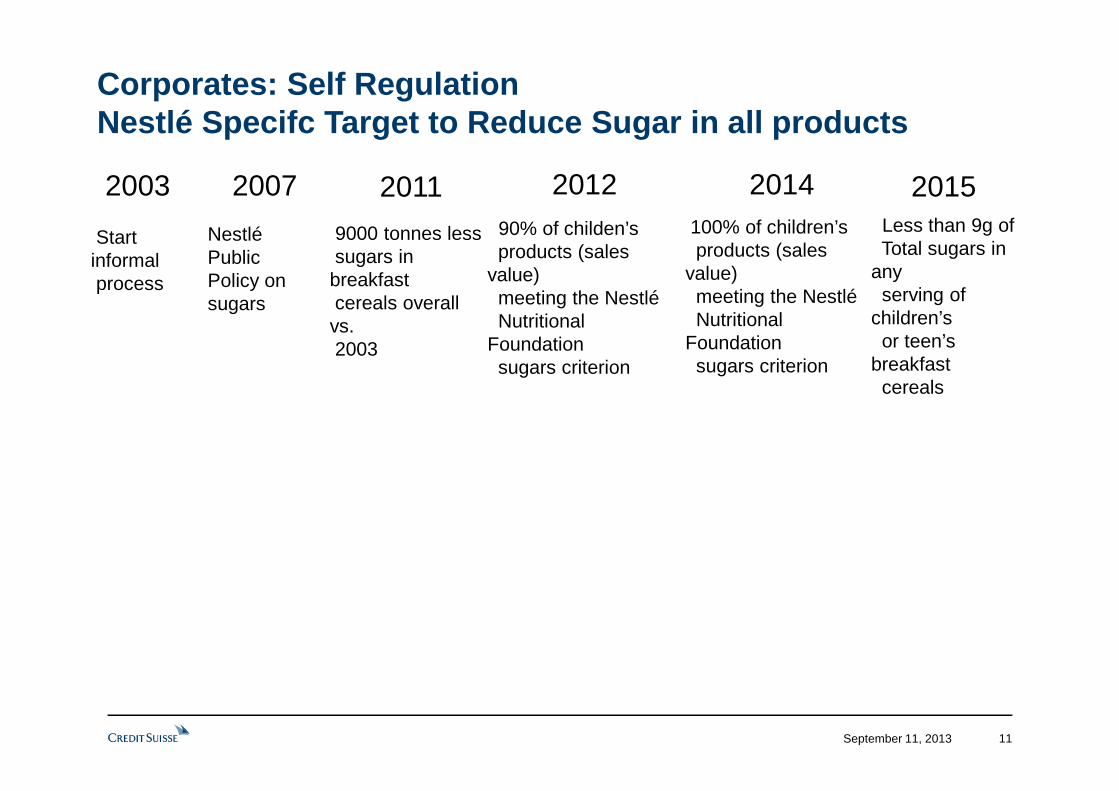
Corporates: Self RegulationNestlé Specifc Target to Reduce Sugar in all product s
September 11, 2013 11
Less than 9g ofTotal sugars in
any serving of
children’sor teen’s
breakfastcereals
9000 tonnes less sugars in breakfast cereals overall vs. 2003
100% of children’s products (sales
value) meeting the Nestlé Nutritional
Foundationsugars criterion
90% of childen’sproducts (sales
value) meeting the Nestlé Nutritional
Foundationsugars criterion
Nestlé Public Policy on sugars
2007 2011 2012 2014 20152003
Start informal process
September 11, 2013 12
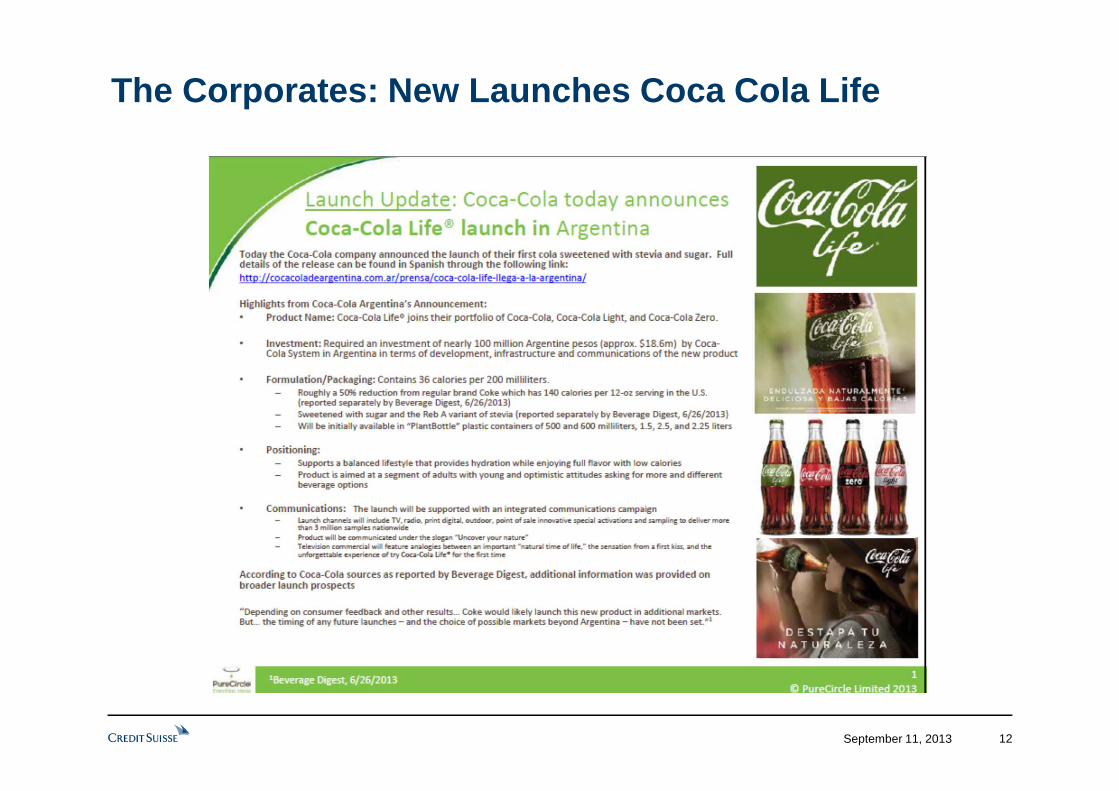
The Corporates: New Launches Coca Cola Life
September 11, 2013
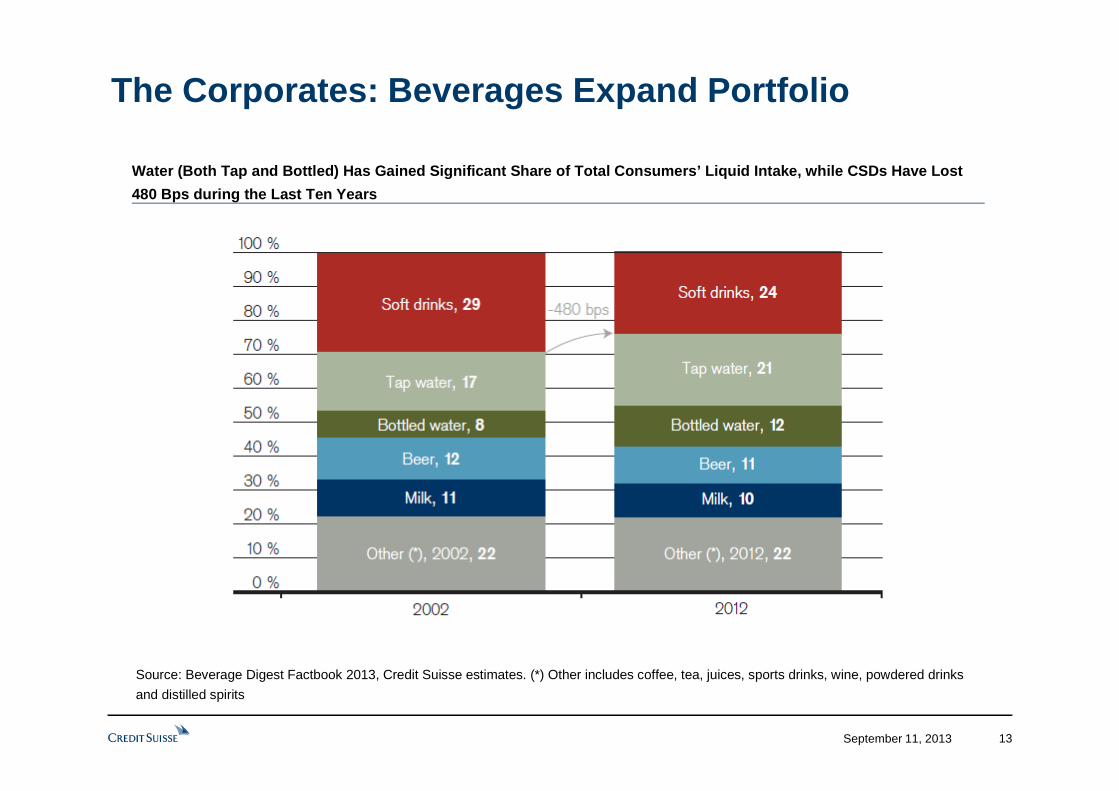
Water (Both Tap and Bottled) Has Gained Significant Share of Total Consumers’ Liquid Intake, while CSD s Have Lost
480 Bps during the Last Ten Years
13
Source: Beverage Digest Factbook 2013, Credit Suisse estimates. (*) Other includes coffee, tea, juices, sports drinks, wine, powdered drinks
and distilled spirits
The Corporates: Beverages Expand Portfolio
September 11, 2013 14
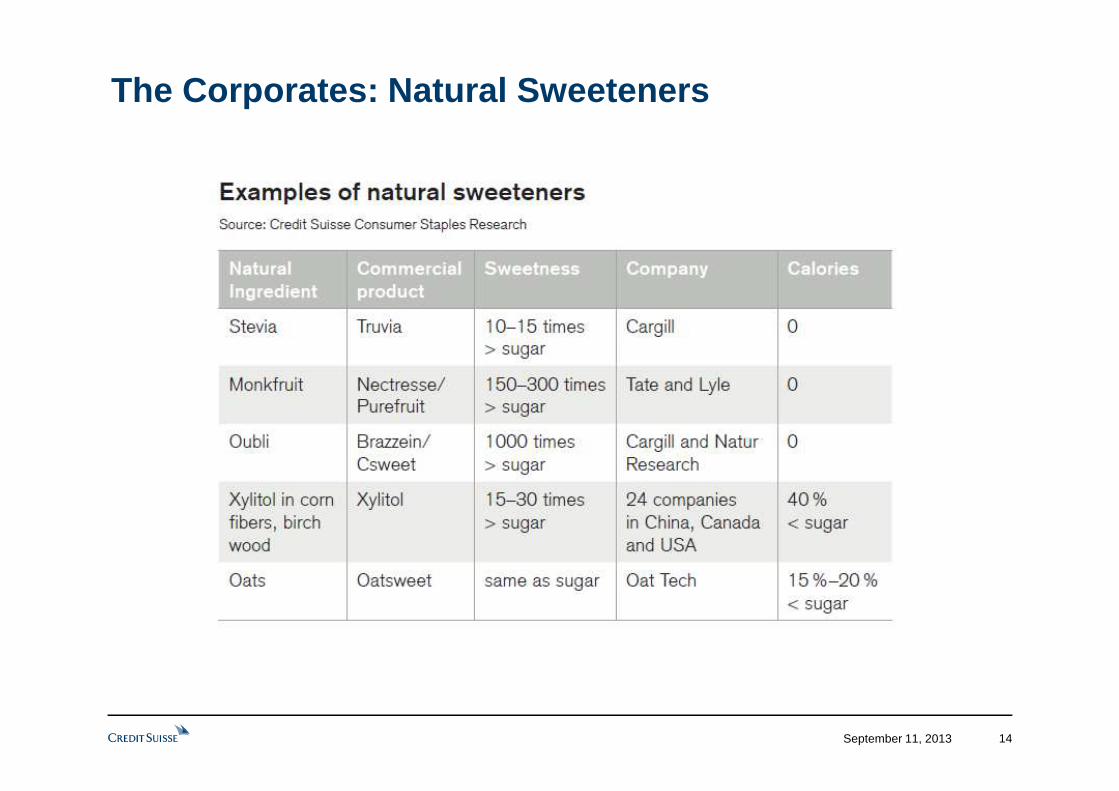
The Corporates: Natural Sweeteners