Embed Size (px)
Citation preview

A novel approach to improving TAT and Quality in the clinical lab
November 16th 2011Presented by Ralph Millare & Christian Basa
Providence Saint Joseph Medical CenterBurbank, CA
Overview
• Who we are?– Presenters
• PSJMC Clinical Laboratory– Operations & the Competitive Landscape– Journey towards Excellence
• Automation and Batch Processes– Advantages, Disadvantages & Risks– Queuing Theory and TAT
• Continuous Improvement in the Laboratory– Semi-automation– Visual controls– Business Intelligence
• Lessons Learned
Millare R., Basa, C. (2011)
About us
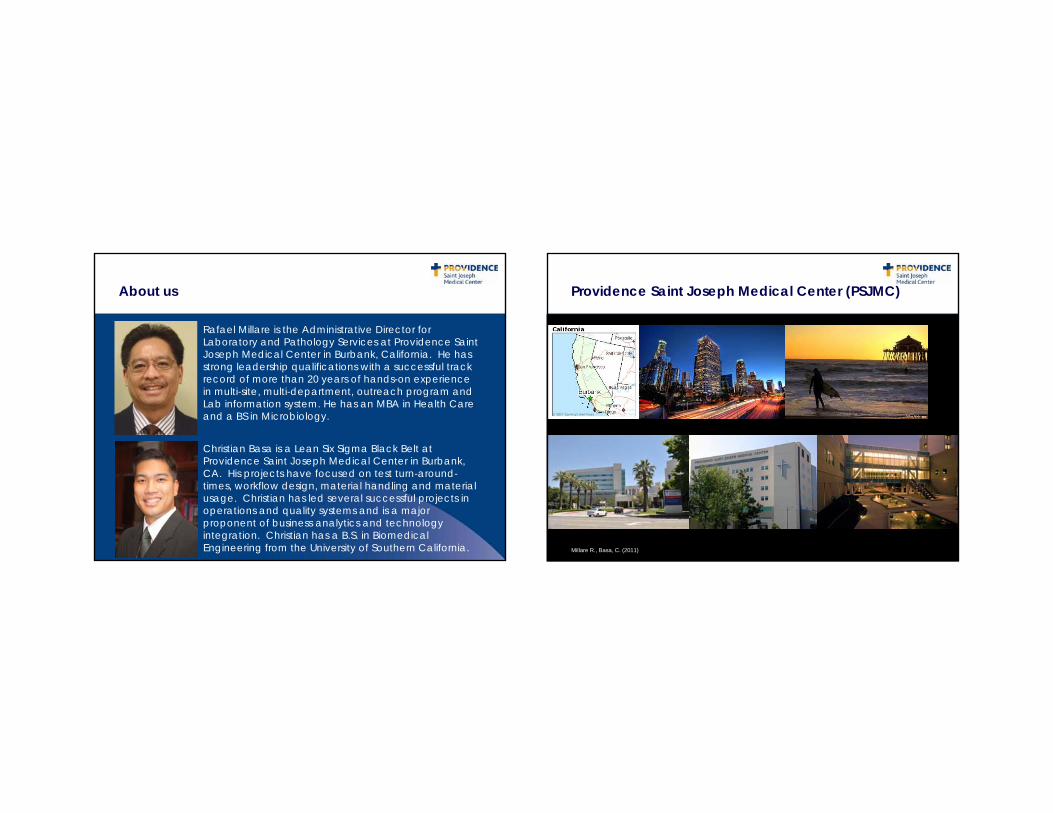
• Christian Basa is a Lean Six Sigma Black Belt at Providence Saint Joseph Medical Center in Burbank, CA. His projects have focused on test turn-around-times, workflow design, material handling and material usage. Christian has led several successful projects in operations and quality systems and is a major proponent of business analytics and technology integration. Christian has a B.S. in Biomedical Engineering from the University of Southern California.
• Rafael Millare is the Administrative Director for Laboratory and Pathology Services at Providence Saint Joseph Medical Center in Burbank, California. He has strong leadership qualifications with a successful track record of more than 20 years of hands-on experience in multi-site, multi-department, outreach program and Lab information system. He has an MBA in Health Care and a BS in Microbiology.
Millare R., Basa, C. (2011)
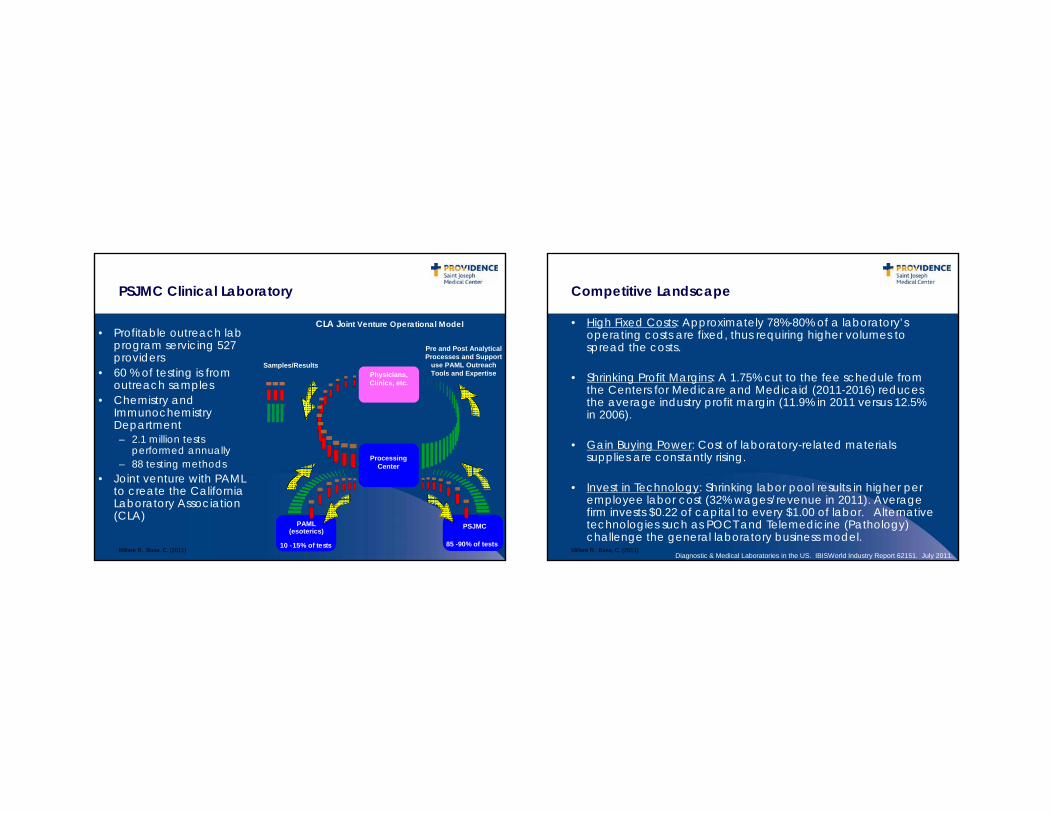
Providence Saint Joseph Medical Center (PSJMC)
Millare R., Basa, C. (2011)

Providence Health & Services Southern California
Millare R., Basa, C. (2011)
Providence Saint Joseph Medical Center (PSJMC)
• Providence Health & Services founded in 1943 by the Sisters of Providence
• 431 licensed patient beds– Largest hospital serving the San Fernando and Santa
Clarita Valleys• Active medical staff of more than 650 physicians• More than 2,300 staff members – including 800 RNs• More than 50,000 patients in the Emergency
Department last year• Recognized leader in excellence:
– Top 5% in US for Overall Clinical Performance– Top 5% in US for Women’s Health Services– 5 Star rated Cardiac Services– Top 10% in US for GI Services and Stroke Care
Millare R., Basa, C. (2011)
PSJMC Clinical Laboratory
• Profitable outreach lab program servicing 527 providers
• 60 % of testing is from outreach samples
• Chemistry and Immunochemistry Department– 2.1 million tests
performed annually– 88 testing methods
• Joint venture with PAML to create the California Laboratory Association (CLA)
CLA Joint Venture Operational Model
Samples/ResultsPhysicians, Clinics, etc.
PAML(esoterics)
PSJMC
85 -90% of tests10 -15% of tests
Processing Center
Pre and Post Analytical Processes and Support
use PAML Outreach Tools and Expertise
Millare R., Basa, C. (2011)
Competitive Landscape
• High Fixed Costs: Approximately 78%-80% of a laboratory’s operating costs are fixed, thus requiring higher volumes to spread the costs.
• Shrinking Profit Margins: A 1.75% cut to the fee schedule from the Centers for Medicare and Medicaid (2011-2016) reduces the average industry profit margin (11.9% in 2011 versus 12.5% in 2006).
• Gain Buying Power: Cost of laboratory-related materials supplies are constantly rising.
• Invest in Technology: Shrinking labor pool results in higher per employee labor cost (32% wages/revenue in 2011). Average firm invests $0.22 of capital to every $1.00 of labor. Alternative technologies such as POCT and Telemedicine (Pathology) challenge the general laboratory business model.
Diagnostic & Medical Laboratories in the US. IBISWorld Industry Report 62151. July 2011.Millare R., Basa, C. (2011)
Journey Towards Excellence
Spring 2009
Automation ExpansionRoche MPA
streamlines pre-analytical operation
Summer 2010
BusinessGrowth
Joint-venture w/ PAML
increases laboratory test
volume
Winter 2010
Continuous ImprovementRegional Lab Excellence
Council facilitates the
spread of learning
Fall 2011
Business Intelligence
Real-time data reporting allows
proactive operational
management
Fall 2008
Technology Integration
Roche’s cobas introduces high
accuracy specimen analysis
Millare R., Basa, C. (2011)
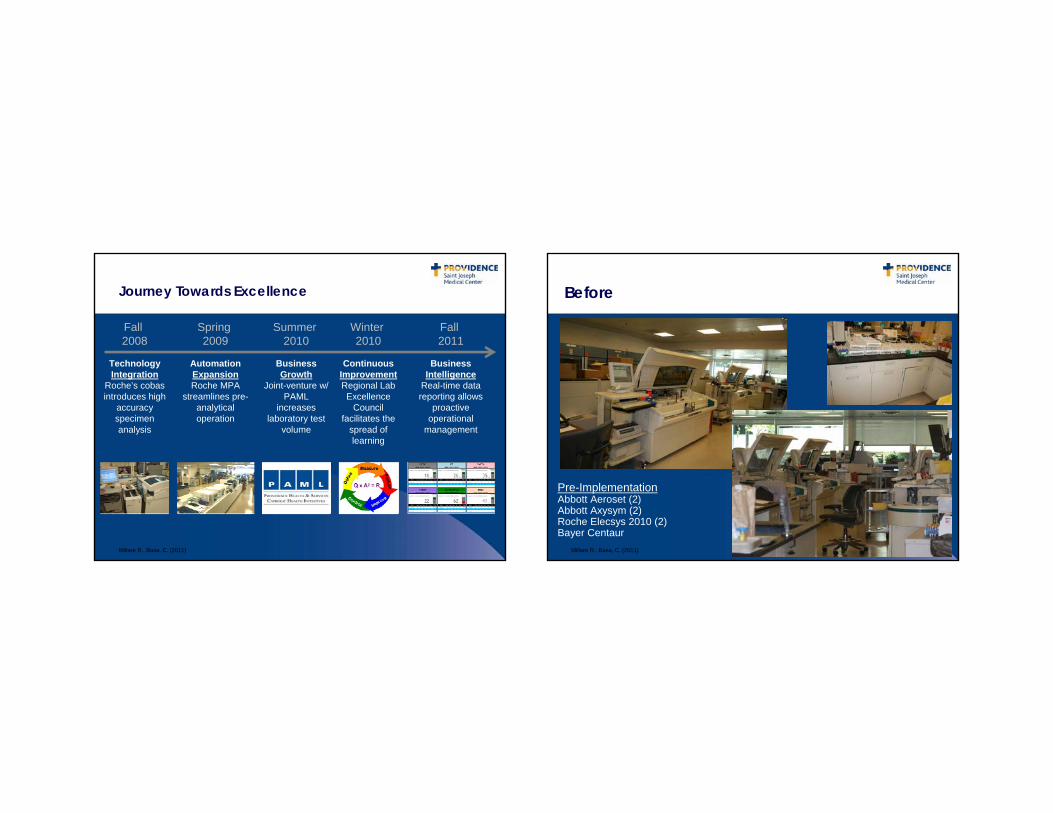
Before
Pre-ImplementationAbbott Aeroset (2)Abbott Axysym (2)Roche Elecsys 2010 (2)Bayer Centaur
Millare R., Basa, C. (2011)
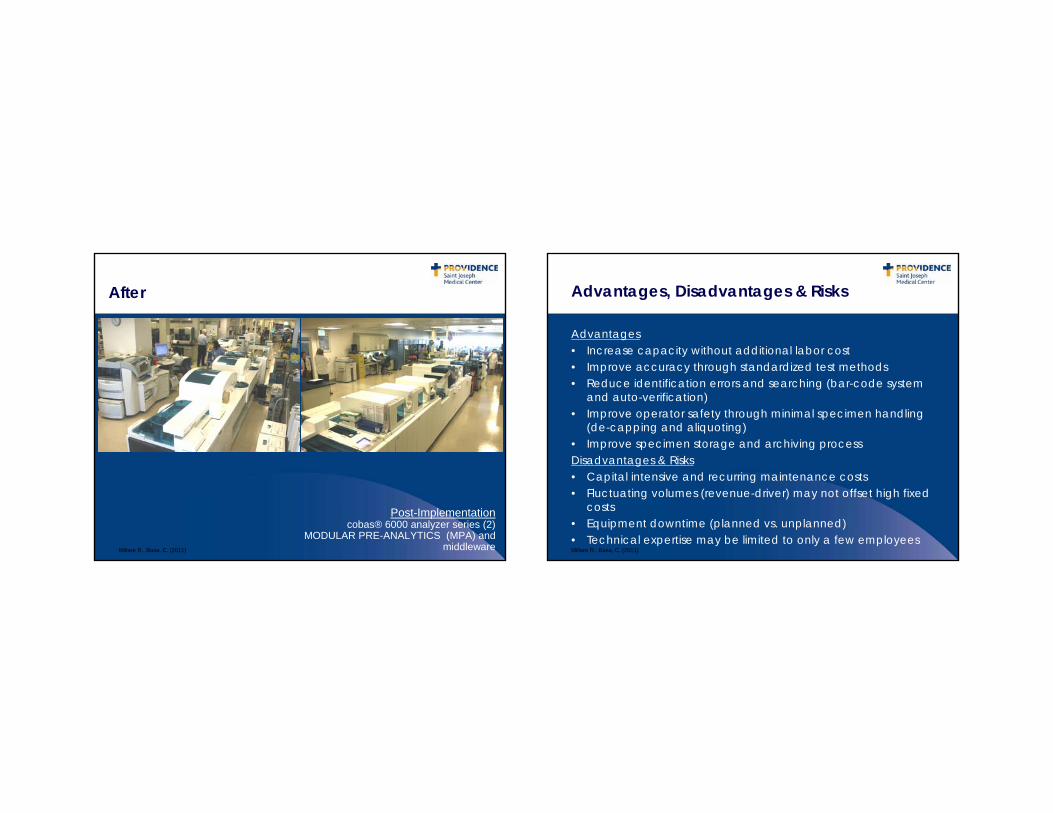
After
Post-Implementationcobas® 6000 analyzer series (2)
MODULAR PRE-ANALYTICS (MPA) and middlewareMillare R., Basa, C. (2011)
Advantages, Disadvantages & Risks
Advantages• Increase capacity without additional labor cost• Improve accuracy through standardized test methods• Reduce identification errors and searching (bar-code system
and auto-verification)• Improve operator safety through minimal specimen handling
(de-capping and aliquoting)• Improve specimen storage and archiving processDisadvantages & Risks• Capital intensive and recurring maintenance costs• Fluctuating volumes (revenue-driver) may not offset high fixed
costs• Equipment downtime (planned vs. unplanned)• Technical expertise may be limited to only a few employeesMillare R., Basa, C. (2011)
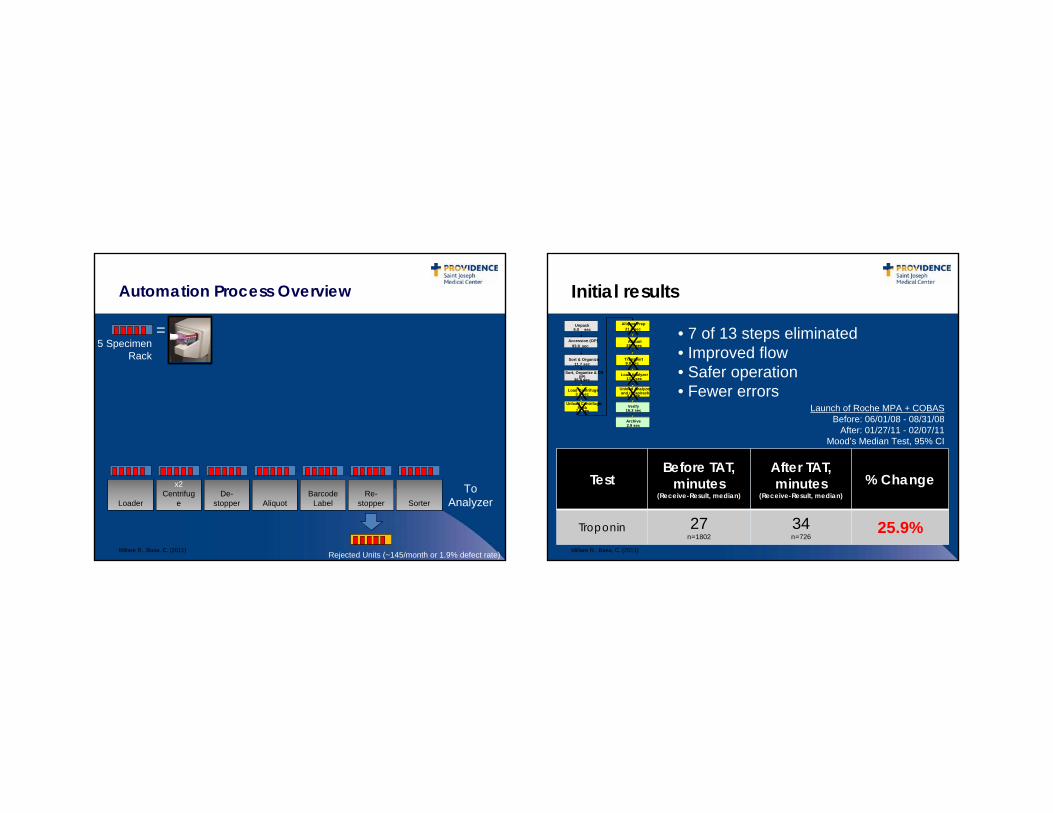
Automation Process Overview
Loader
x2Centrifug
e AliquotBarcode
LabelRe-
stopper SorterDe-
stopper
=5 Specimen
Rack
To Analyzer
Rejected Units (~145/month or 1.9% defect rate)Millare R., Basa, C. (2011)
Initial results
TestBefore TAT,
minutes (Receive-Result, median)
After TAT, minutes
(Receive-Result, median)
% Change
Troponin 27n=1802
34n=726
25.9%
Launch of Roche MPA + COBASBefore: 06/01/08 - 08/31/08
After: 01/27/11 - 02/07/11Mood’s Median Test, 95% CI
• 7 of 13 steps eliminated• Improved flow• Safer operation• Fewer errors
Sort & Organize11.7 sec
Sort, Organize & CV(IP)
36.8 sec
Load Centrifuge3.0 sec
Aliquot Prep21.6 sec
Unpack6.0 sec
Unload Centrifuge,Rack
7.8 sec
Aliquot28.5 sec
Accession (OP)93.9 sec
Load Analyzer13.3 sec
Transport9.8 sec
Unload Analyzerand recap/rack
4.6 sec
Verify16.3 sec
Archive2.9 sec
Sort & Organize11.7 sec
Sort, Organize & CV(IP)
36.8 sec
Load Centrifuge3.0 sec
Aliquot Prep21.6 sec
Unpack6.0 sec
Unload Centrifuge,Rack
7.8 sec
Aliquot28.5 sec
Accession (OP)93.9 sec
Load Analyzer13.3 sec
Transport9.8 sec
Unload Analyzerand recap/rack
4.6 sec
Verify16.3 sec
Archive2.9 sec
XX
XXXXX
Millare R., Basa, C. (2011)
Hmmm…
Millare R., Basa, C. (2011)
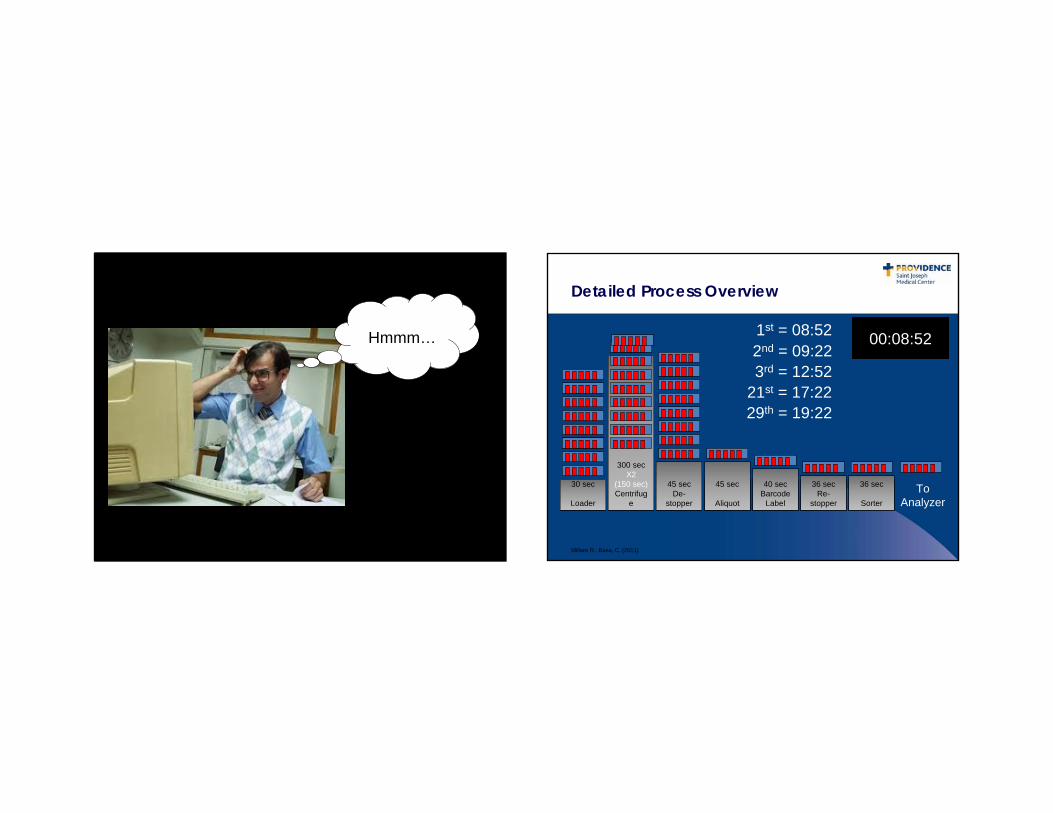
Detailed Process Overview
Loader
x2Centrifug
e AliquotBarcode
LabelRe-
stopper SorterDe-
stopper
To Analyzer
300 secX2
(150 sec)Centrifug
e
45 sec
Aliquot
40 secBarcode
Label
36 sec Re-
stopper
36 sec
Sorter
45 secDe-
stopper
00:00:0000:00:3000:01:0000:05:3000:06:1500:07:0000:07:4000:08:1600:08:521st = 08:522nd = 09:223rd = 12:52
21st = 17:2229th = 19:22
30 sec
Loader
Millare R., Basa, C. (2011)
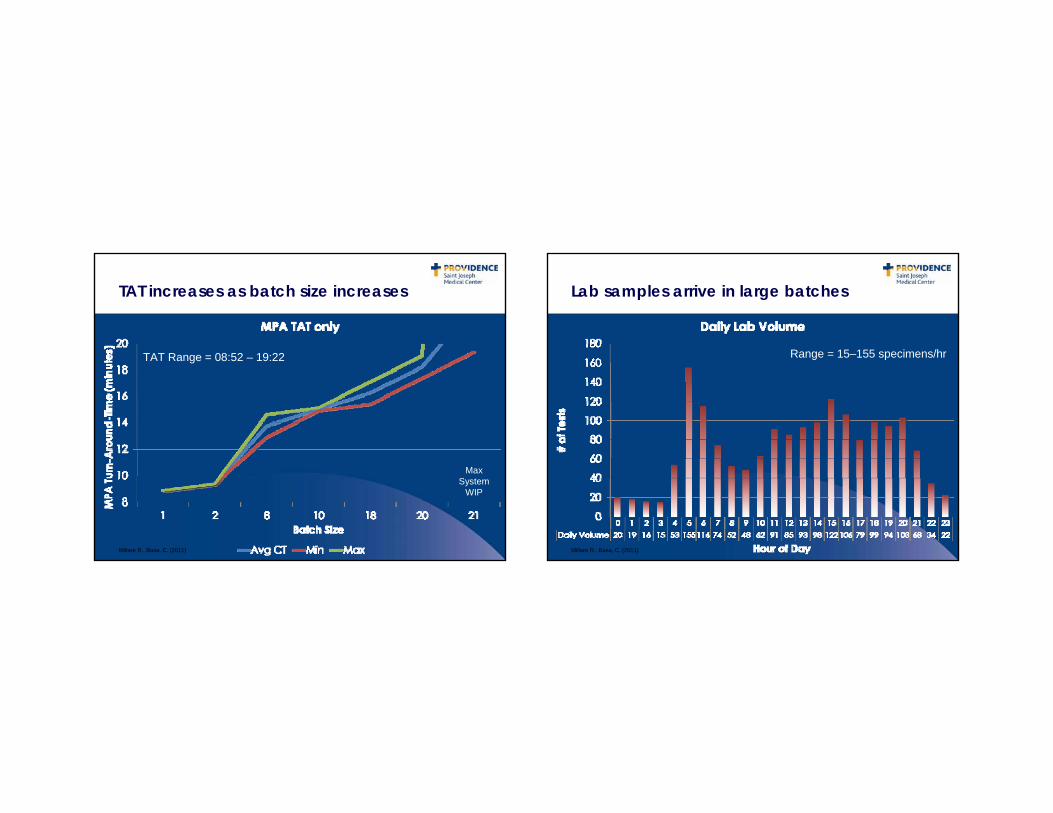
TAT increases as batch size increases
Max System
WIP
TAT Range = 08:52 – 19:22
Millare R., Basa, C. (2011)
Lab samples arrive in large batches
Range = 15–155 specimens/hr
Millare R., Basa, C. (2011)
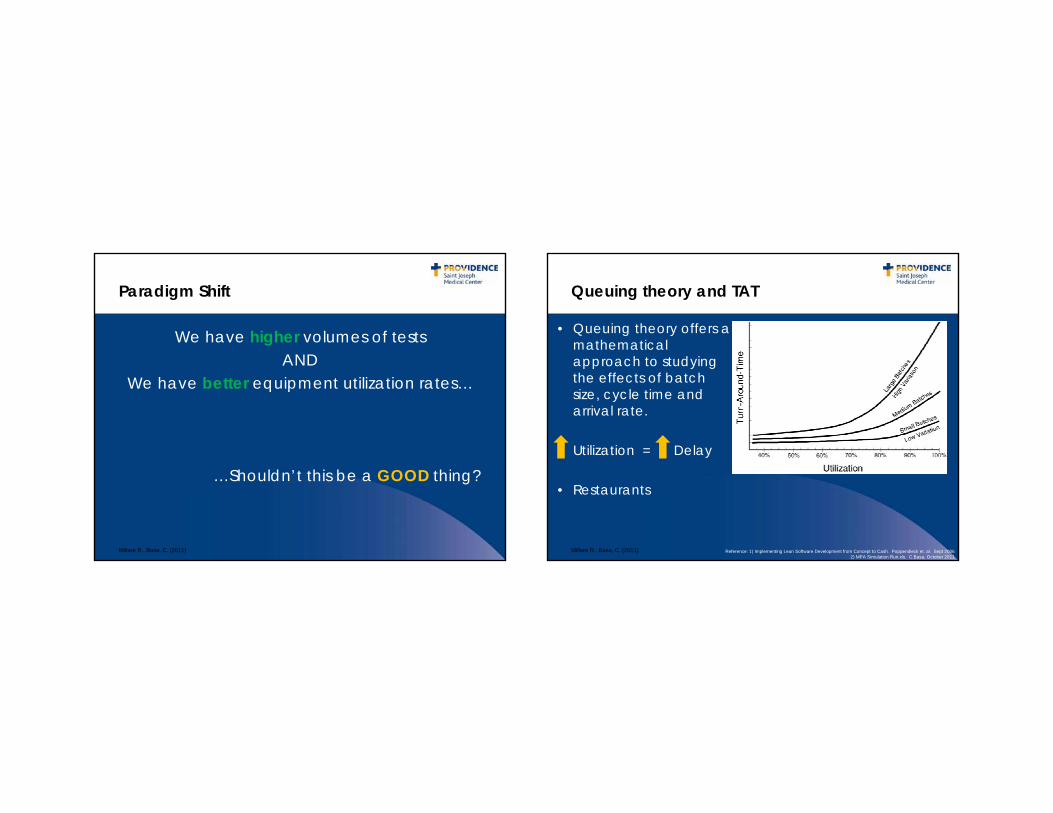
Paradigm Shift
We have higher volumes of testsAND
We have better equipment utilization rates…
…Shouldn’t this be a GOOD thing?
Millare R., Basa, C. (2011)
Queuing theory and TAT
• Queuing theory offers a mathematical approach to studying the effects of batch size, cycle time and arrival rate.
• Utilization = Delay
• Restaurants
Reference: 1) Implementing Lean Software Development from Concept to Cash. Poppendieck et. al. Sept 20062) MPA Simulation Run.xls. C.Basa, October 2011
Millare R., Basa, C. (2011)
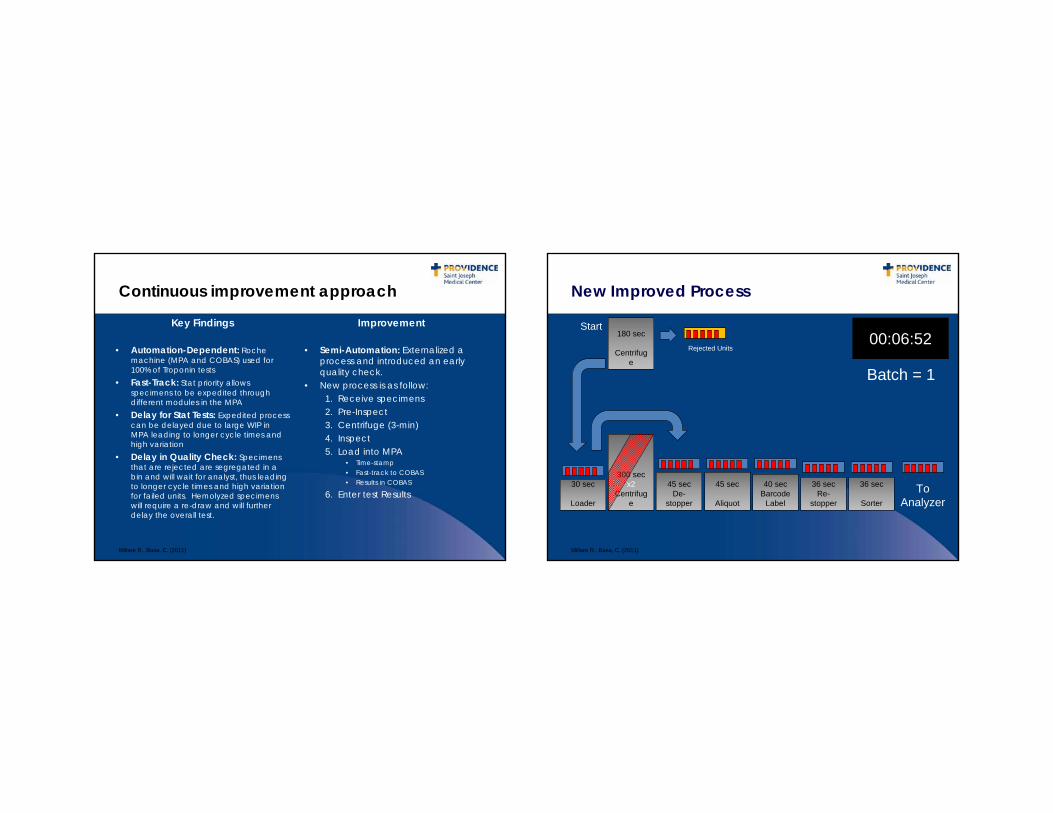
Continuous improvement approach
Key Findings
• Automation-Dependent: Roche machine (MPA and COBAS) used for 100% of Troponin tests
• Fast-Track: Stat priority allows specimens to be expedited through different modules in the MPA
• Delay for Stat Tests: Expedited process can be delayed due to large WIP in MPA leading to longer cycle times and high variation
• Delay in Quality Check: Specimens that are rejected are segregated in a bin and will wait for analyst, thus leading to longer cycle times and high variation for failed units. Hemolyzed specimens will require a re-draw and will further delay the overall test.
Improvement
• Semi-Automation: Externalized a process and introduced an early quality check.
• New process is as follow:1. Receive specimens2. Pre-Inspect3. Centrifuge (3-min)4. Inspect5. Load into MPA
• Time-stamp• Fast-track to COBAS• Results in COBAS
6. Enter test Results
Millare R., Basa, C. (2011)
New Improved Process
30 sec
Loader
300 secx2
Centrifuge
45 sec
Aliquot
40 secBarcode
Label
36 sec Re-
stopper
36 sec
Sorter
45 secDe-
stopper
Rejected Units
Start180 sec
Centrifuge
To Analyzer
00:06:52
Batch = 1
Millare R., Basa, C. (2011)
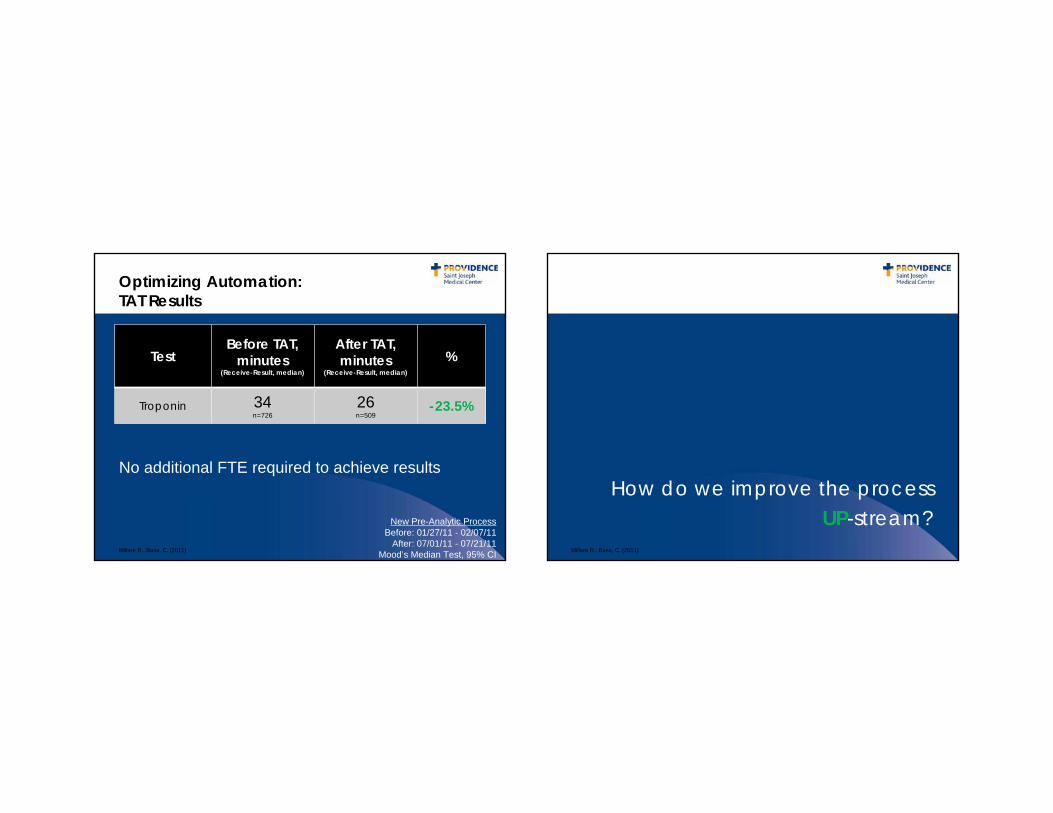
Optimizing Automation: TAT Results
TestBefore TAT,
minutes (Receive-Result, median)
After TAT, minutes
(Receive-Result, median)
%
Troponin 34n=726
26n=509
-23.5%
New Pre-Analytic ProcessBefore: 01/27/11 - 02/07/11
After: 07/01/11 - 07/21/11Mood’s Median Test, 95% CI
No additional FTE required to achieve results
Millare R., Basa, C. (2011)
How do we improve the process UP-stream?
Millare R., Basa, C. (2011)
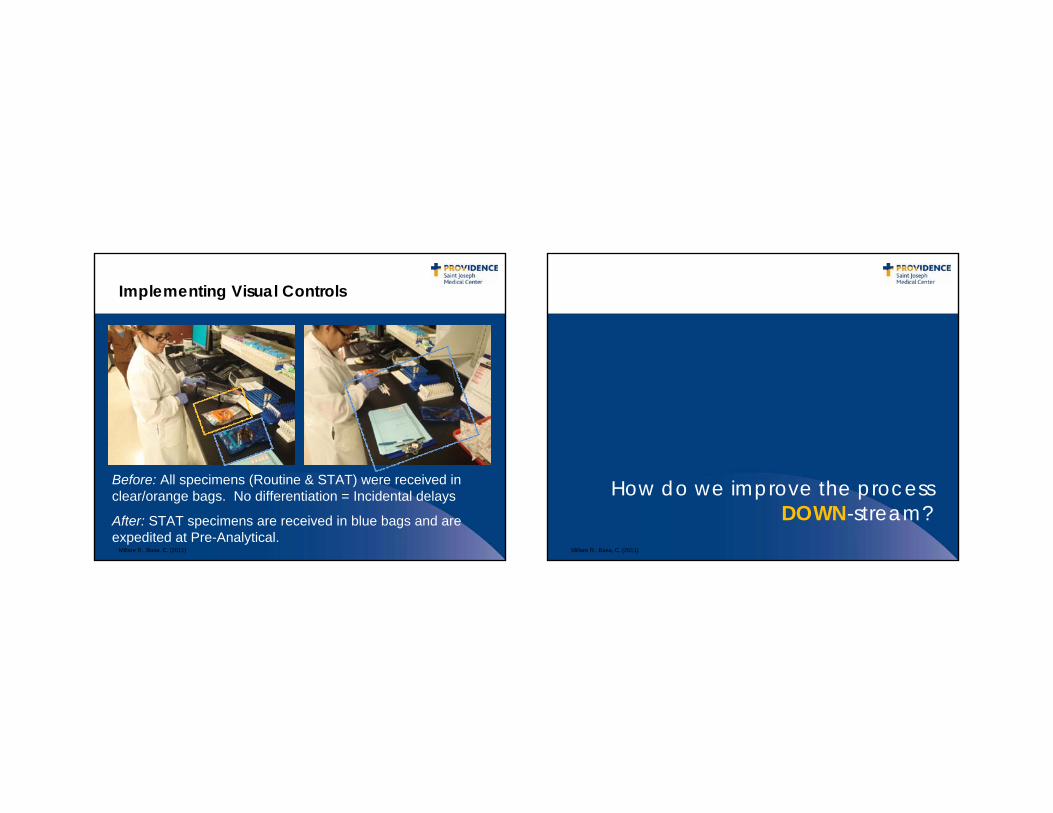
Implementing Visual Controls
Before: All specimens (Routine & STAT) were received in clear/orange bags. No differentiation = Incidental delays
After: STAT specimens are received in blue bags and are expedited at Pre-Analytical.
Millare R., Basa, C. (2011)
How do we improve the process DOWN-stream?
Millare R., Basa, C. (2011)
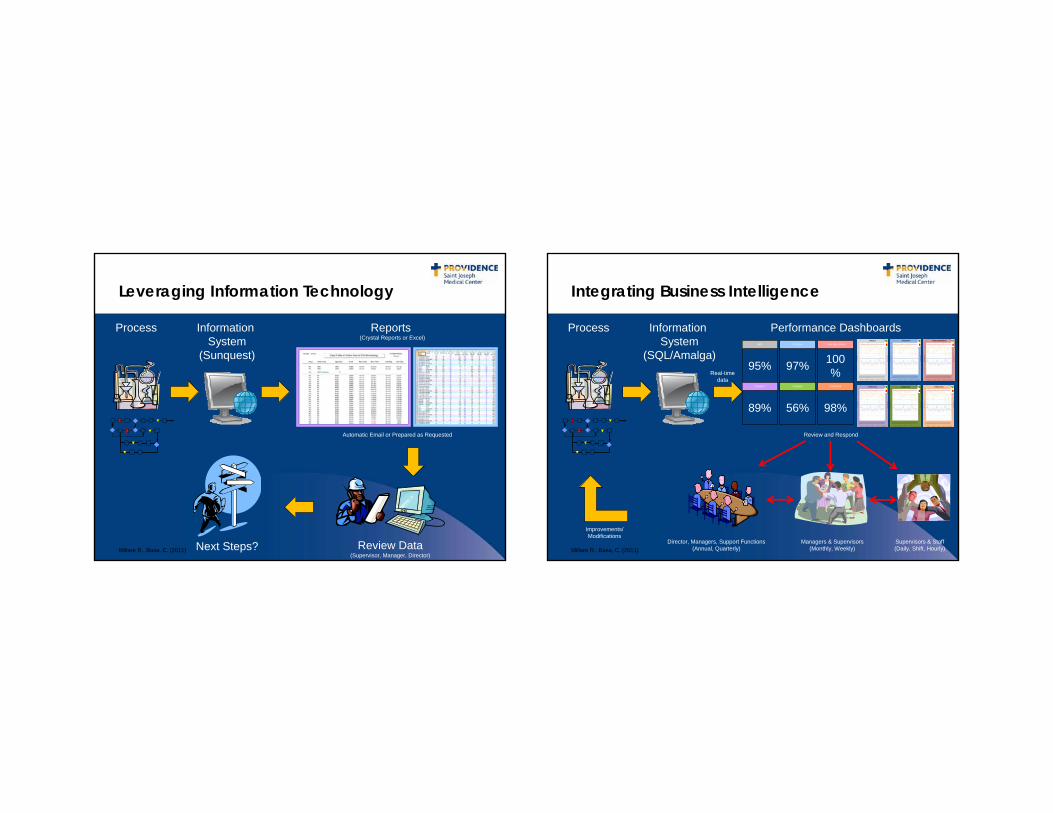
Leveraging Information Technology
Process Information System
(Sunquest)
Reports (Crystal Reports or Excel)
Automatic Email or Prepared as Requested
Next Steps? Review Data(Supervisor, Manager, Director)
Millare R., Basa, C. (2011)
Integrating Business Intelligence
Process Information System
(SQL/Amalga)
Performance Dashboards
Director, Managers, Support Functions(Annual, Quarterly)
Managers & Supervisors(Monthly, Weekly)
Supervisors & Staff(Daily, Shift, Hourly)
Real-timedata
Improvements/Modifications
Review and Respond
95%
CBC updated 01/21/11 13:45
89%
Troponin T updated 01/21/11 13:45
97%
Pro Time updated 01/21/11 13:45
56%
Urinalysis updated 01/21/11 13:45
100%
Comp. Met. Panelupdated 01/21/11 13:45
98%
Lactic Acid updated 01/21/11 13:45
Millare R., Basa, C. (2011)
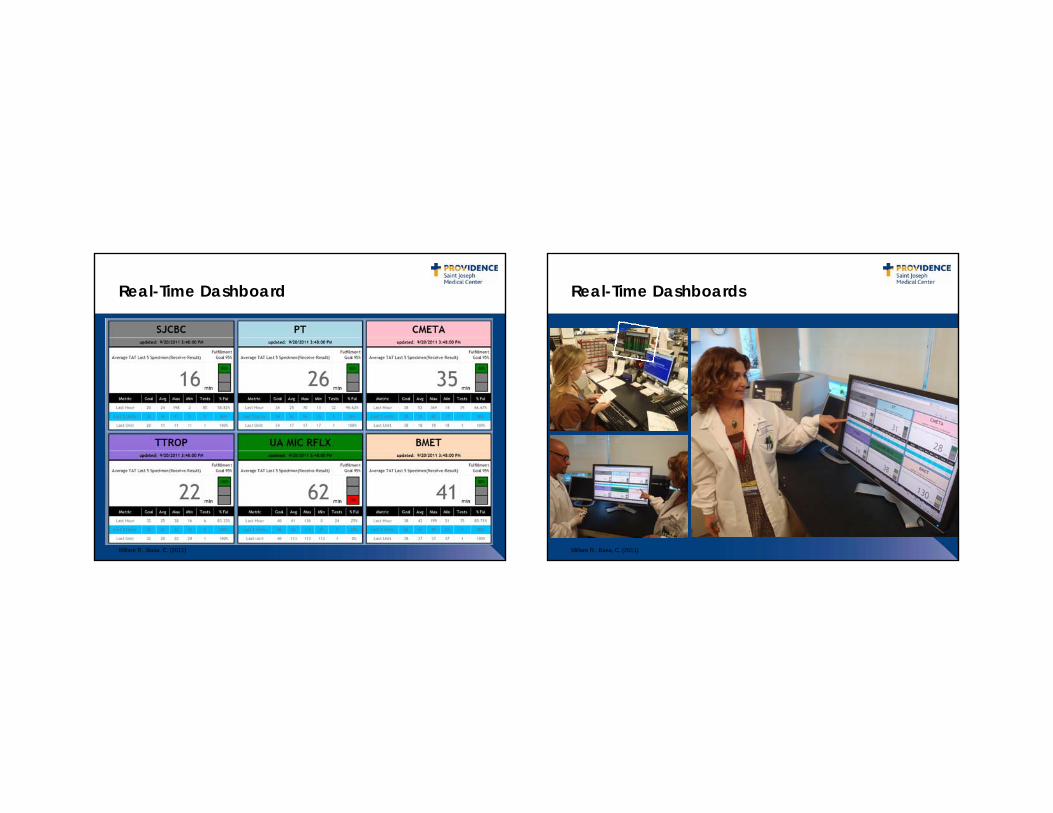
Real-Time Dashboard
Millare R., Basa, C. (2011)
Real-Time Dashboards
Millare R., Basa, C. (2011)
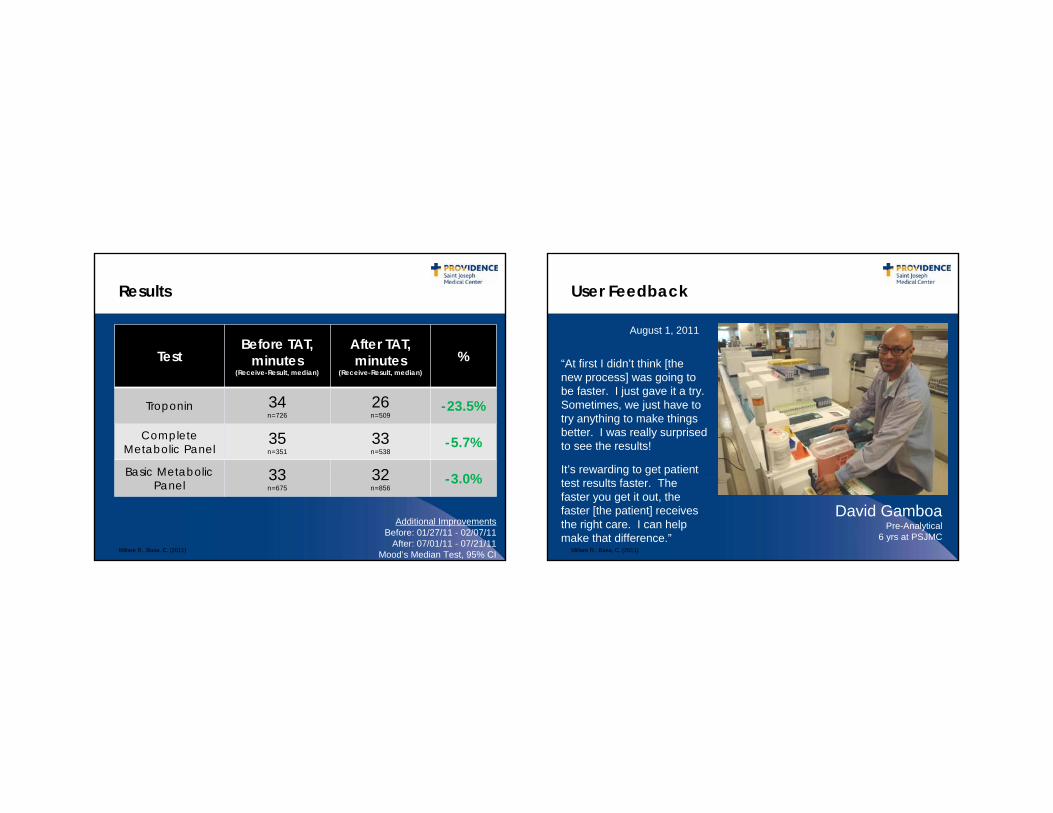
Results
TestBefore TAT,
minutes (Receive-Result, median)
After TAT, minutes
(Receive-Result, median)
%
Troponin 34n=726
26n=509
-23.5%
Complete Metabolic Panel
35n=351
33n=538
-5.7%
Basic Metabolic Panel
33n=675
32n=856
-3.0%
Additional ImprovementsBefore: 01/27/11 - 02/07/11
After: 07/01/11 - 07/21/11Mood’s Median Test, 95% CIMillare R., Basa, C. (2011)
David GamboaPre-Analytical
6 yrs at PSJMC
August 1, 2011
“At first I didn’t think [the new process] was going to be faster. I just gave it a try. Sometimes, we just have to try anything to make things better. I was really surprised to see the results!
It’s rewarding to get patient test results faster. The faster you get it out, the faster [the patient] receives the right care. I can help make that difference.”
User Feedback
Millare R., Basa, C. (2011)
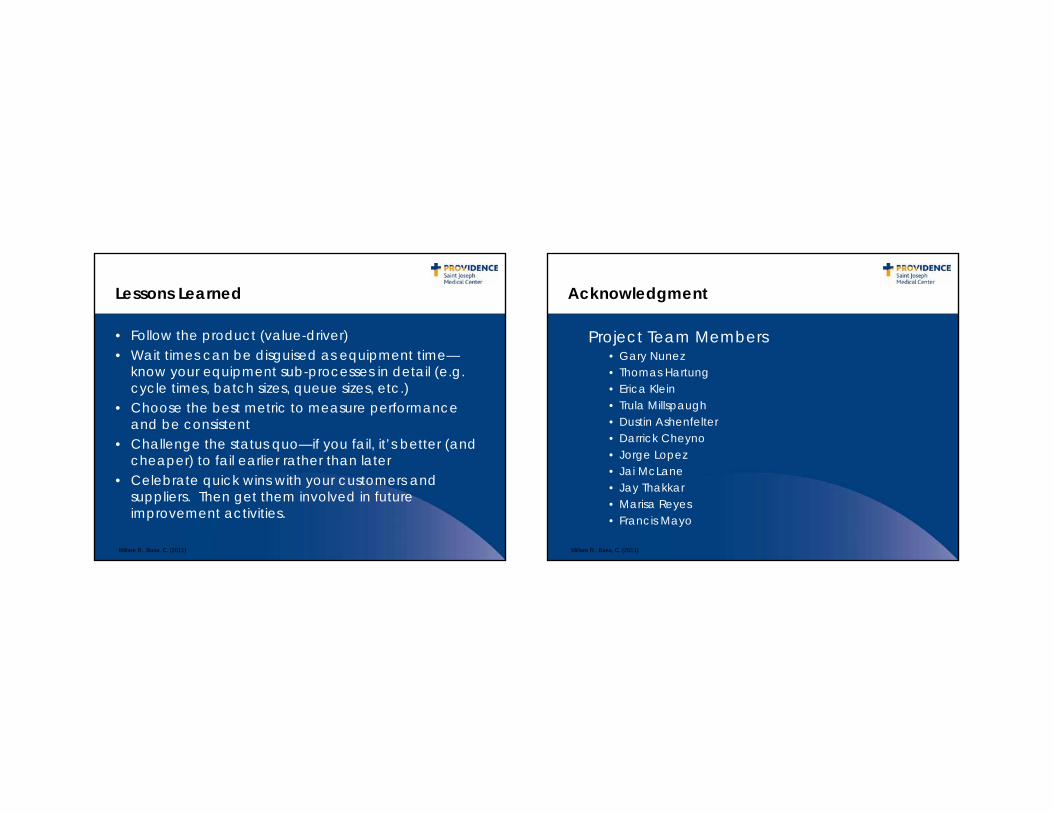
Lessons Learned
• Follow the product (value-driver)• Wait times can be disguised as equipment time—
know your equipment sub-processes in detail (e.g. cycle times, batch sizes, queue sizes, etc.)
• Choose the best metric to measure performance and be consistent
• Challenge the status quo—if you fail, it’s better (and cheaper) to fail earlier rather than later
• Celebrate quick wins with your customers and suppliers. Then get them involved in future improvement activities.
Millare R., Basa, C. (2011)
Acknowledgment
Project Team Members• Gary Nunez• Thomas Hartung• Erica Klein• Trula Millspaugh• Dustin Ashenfelter• Darrick Cheyno• Jorge Lopez• Jai McLane• Jay Thakkar• Marisa Reyes• Francis Mayo
Millare R., Basa, C. (2011)

Thank you!!!
Questions?
Millare R., Basa, C. (2011)