Embed Size (px)
Citation preview

0018-9294 (c) 2015 IEEE. Personal use is permitted, but republication/redistribution requires IEEE permission. See http://www.ieee.org/publications_standards/publications/rights/index.html for more information.
This article has been accepted for publication in a future issue of this journal, but has not been fully edited. Content may change prior to final publication. Citation information: DOI 10.1109/TBME.2016.2549363, IEEETransactions on Biomedical Engineering
1
A Novel Grading Biomarker for the Prediction ofConversion from Mild Cognitive Impairment to
Alzheimer’s DiseaseTong Tong, Qinquan Gao*, Ricardo Guerrero, Christian Ledig, Liang Chen
Daniel Rueckert and the Alzheimer’s Disease Neuroimaging Initiative (ADNI)
Abstract—Objective: Identifying mild cognitive impairment(MCI) subjects who will progress to Alzheimer’s disease is notonly crucial in clinical practice, but also has a significant potentialto enrich clinical trials. The purpose of this study is to developan effective biomarker for an accurate prediction of MCI-to-ADconversion from magnetic resonance (MR) images.
Methods: We propose a novel grading biomarker for theprediction of MCI-to-AD conversion. First, we comprehensivelystudy the effects of several important factors on the perfor-mance in the prediction task including registration accuracy, agecorrection, feature selection and the selection of training data.Based on the studies of these factors, a grading biomarker isthen calculated for each MCI subject using sparse representationtechniques. Finally, the grading biomarker is combined with ageand cognitive measures to provide a more accurate prediction ofMCI-to-AD conversion.
Results: Using the ADNI dataset, the proposed global grad-ing biomarker achieved an area under the receiver operatingcharacteristic curve (AUC) in the range of 79%-81% for theprediction of MCI-to-AD conversion within 3 years in 10-foldcross validations. The classification AUC further increases to84%-92% when age and cognitive measures are combined withthe proposed grading biomarker.
Conclusion: The obtained accuracy of the proposed biomarkerbenefits from the contributions of different factors: a tradeoffregistration level to align images to the template space; theremoval of the normal aging effect; selection of discriminativevoxels; the calculation of the grading biomarker using AD andnormal control groups; the integration of sparse representationtechnique and the combination of cognitive measures.
Significance: The evaluation on the ADNI dataset shows theefficacy of the proposed biomarker and demonstrates a significantcontribution in accurate prediction of MCI-to-AD conversion.
Index Terms—structural MR imaging, biomarker, predictionof MCI conversion, machine learning, Alzheimer’s disease
I. INTRODUCTION
Studies have shown that individuals with mild cognitiveimpairment (MCI) progress to Alzheimer’s disease (AD) ata rate of 10% to 15% per year [1]. In the clinical context,
T Tong, R. Guerrero, C. Ledig, L. Chen, and D. Rueckert are withBiomedical Image Analysis Group, Department of Computing, ImperialCollege London, UK.
*Q. Gao is with Fujian Provincial Key Lab of Medical Instrument &Pharmaceutical Technology, Department of the Internet of Things, FuzhouUniversity, Fuzhou, China.(email: [email protected])
Data used in the preparation of this article were obtained from theADNI database (www.loni.ucla.edu/ADNI). As such, the investigators with-in the ADNI contributed to the design and implementation of ADNIand/or provided data but did not participate in analysis or writing ofthis report. A complete listing of ADNI investigators can be found at:www.loni.ucla.edu/ADNI/Collaboration/ADNI Authorship list.pdf
it is particularly interesting to predict whether a subject withMCI will go on to develop AD or not within a given timeperiod (i.e. 3 years) as early diagnosis would allow doctorsto treat patients sooner so that potential disease-modifyingtherapies could be tested and applied. Although no drug ortreatment has so far been reported to be able to stop theprogress of AD, there are some medications that can delaythe onset of some symptoms such as memory loss, confusion,and cognitive problems [2]. In addition, the early diagnosisis also helpful for selecting suitable patients for clinical trials.Numerous studies [3], [4], [5], [6], [7], [8], [9], [10], [11], [12],[13], [14], [15], [16], [17], [18], [19], [20] use neuroimagingtechniques to detect pathology associated with AD and topredict the MCI-to-AD conversion. Among them, structuralmagnetic resonance imaging (MRI) has been the most exten-sively used imaging modality in the detection and predictionof AD as it is widely available and offers good diagnosticaccuracy with moderate costs. In addition, MRI shows highcorrelation with the progression from MCI to AD [21]. How-ever, the pathological variations between stable MCI (SMCI)and progressive MCI (PMCI) that can be detected by MRIare subtle. This subtle difference is also accompanied withlarge inter-subject variability and age-related changes, whichmakes the MRI-based prediction of MCI-to-AD conversiona challenging task. In a recent comprehensive study [22], tenmethods were evaluated for the MRI-based prediction of MCI-to-AD conversion and only four methods could discriminatebetween SMCI and PMCI more accurately than a randomclassifier. Therefore, it is essential to develop more advancedmethods for the prediction of MCI-to-AD conversion.
In order to reduce the large inter-subject variability, MRimages are usually spatially registered to a common spacefor comparison [14], [20], [23]. Different studies have useddifferent registration techniques to align anatomies at differentlevels of detail. For example, affine registration was used in[23] while more accurate nonrigid registrations were utilizedin other studies [14]. In [22], the registration in SPM5 wascompared to the more accurate registration method DARTEL.The use of DARTEL was shown to significantly improve theclassification results [22]. Although accurate registration cansuccessfully align anatomical structures in different subjectsfor comparison, the pathological changes between groups maybe partially removed at the same time. At the extreme whereno registration is performed, the inter-subject variability andthe pathological changes between groups are fully preserved.

0018-9294 (c) 2015 IEEE. Personal use is permitted, but republication/redistribution requires IEEE permission. See http://www.ieee.org/publications_standards/publications/rights/index.html for more information.
This article has been accepted for publication in a future issue of this journal, but has not been fully edited. Content may change prior to final publication. Citation information: DOI 10.1109/TBME.2016.2549363, IEEETransactions on Biomedical Engineering
2
However, large inter-subject variability may conceal the moresubtle pathological variations, hampering the classification ofMCI subjects. At the other extreme where registration is nearperfect, inter-subject variability and pathological changes areboth removed. Thus, there is a tradeoff between the levelof image alignment that removes uninteresting inter-subjectvariability and the amount of detectable pathological changes,which would still allow the measurement of group differencesfor classification.
The group differences are not only affected by pathologicalchanges and inter-subject variability, but also influenced bythe changes associated with aging. Since the normal aging canresult in atrophy on the brain, it can be similar to the atrophiescaused by AD. This adds confounding effects in using thedisease-specific changes for classification. In previous studies,age has been demonstrated as an important feature in eitherdetecting AD [23] or predicting MCI-to-AD conversion [13]because it is a risk factor for AD. Therefore, it may be helpfulto remove the effect of normal aging from MRI data beforetraining the classifiers. For example, in a recent challenge [24],eight out of fifteen teams incorporated aging effects in their al-gorithms for the classification of AD, where the normal agingeffect was eliminated using age-dependent normalization [24]or regression [20], [24]. The removal of effects associated withnormal aging has been reported to improve the classificationperformance significantly [20], [25] or slightly [22] dependingon the adopted features and classification methods.
In addition to the effect of registration and normal aging, theuse of training data from different groups of subjects can alsoinfluence the prediction of MCI-to-AD conversion. Since thepopulation of MCI subjects is highly heterogeneous, previousstudies [14], [20], [23], [26], [27], [28] have shown that theinclusion of AD and normal controls (NC) subjects can bebeneficial for the classification between SMCI and PMCI.A semi-supervised learning method [20], [27] was used tointegrate information from AD and NC subject to augmentthe prediction of MCI-to-AD conversion. Auxiliary data fromAD and NC subjects were used in a domain transfer learningmethod [28] to aid the classification of MCI subjects. In [14],classifiers learned for separating AD and NC subjects weredirectly used to distinguish between SMCI and PMCI. In[23], new biomarkers were derived by propagating diseaseinformation from AD and NC subjects to MCI subjects.
Another important factor for the prediction of MCI-to-ADconversion is feature selection. The number of available voxel-wise features (1,827,095 after preprocessing) in the wholebrain is very large, but many of these features may not berelated to pathological change due to AD. Therefore, featureselection is an essential step to select the most informativeand revelant features for training effective classifiers. Statis-tical methods such as t-tests or wrapper-based methods suchas the support vector machine recursive feature elimination(SVM-RFE) are commonly used approaches for selectingfeatures. More recently, sparse regression techniques havebeen utilized to select discriminative features for analysis. Forexample, LASSO regression that incorporates an L1 penaltyto encourage a sparse solution has been applied to identifyimportant voxels in the brain that are related to pathological
changes of AD in [29]. However, the selected voxels arerandomly distributed over the whole brain, which is difficultfor interpretation. More advanced sparse regression methodssuch as Elastic Net [30] or tree structured sparse learning [29]were proposed to integrate the spatial structure in the imagesinto the feature selection process so that more interpretableresults can be generated. In another recent work [31], groupsparse regression method has been utilized to select themultimodel features by considering the intrinsic relatednessbetween features across different modalities.
In this paper, we will first study the impact of the abovefour different factors: registration accuracy, age correction,selection of training data and features. Based on the obser-vation of the impact of these factors, we further propose anovel biomarker which we refer to as global grading for theprediction of MCI-to-AD conversion. The proposed gradingbiomarker benefits from the studies of these factors. To cal-culate the grading biomarker, MR images are first aligned tothe template space using well controlled registration. Then, thenormal aging effect is removed from the image intensities byusing a linear regression model. After that, a feature selectionstep is carried out to select voxels that can characterize theatrophy associated with AD. Finally, a global grading value iscalculated for each MCI subject by utilizing the selected voxelsand the disease information of AD and NC subjects. Themain novelties of the proposed MR-based grading biomarkerare: (1) a well controlled registration accuracy to align MRimages to a template space for comparison; (2) the removal ofconfounding effects associated with aging; (3) a robust featureselection step which is performed on discriminating NC versusAD, thus eliminating the use of MCI subjects in the featureselection step, and (4) the propagation of disease informationfrom NC and AD subjects to MCI subjects using sparserepresentation technique. The classification performance of theproposed biomarker was validated on the standardized list [32]of baseline scans from the Alzheimer’s Disease NeuroimagingInitiative (ADNI) and compared with those of other state-of-the-art methods [20], [22], [33] on the same datasets.Furthermore, the proposed grading biomarker is combinedwith cognitive measures to gain further improvements in theprediction of MCI-to-AD conversion.
II. MATERIAL AND METHODS
A. ADNI Dataset
Data used in the preparation of this article were obtainedfrom the ADNI database (adni.loni.ucla.edu). The ADNI waslaunched in 2003 by the National Institute on Aging (NIA), theNational Institute of Biomedical Imaging and Bioengineering(NIBIB), the Food and Drug Administration (FDA), privatepharmaceutical companies and non-profit organizations, as a$60 million, 5-year public-private partnership. The primarygoal of ADNI has been to test whether serial MRI, PET,other biological markers, and clinical and neuropsychologicalassessment can be combined to measure the progression ofMCI and early AD. Determination of sensitive and specificmarkers of very early AD progression is intended to aidresearchers and clinicians to develop new treatments and

0018-9294 (c) 2015 IEEE. Personal use is permitted, but republication/redistribution requires IEEE permission. See http://www.ieee.org/publications_standards/publications/rights/index.html for more information.
This article has been accepted for publication in a future issue of this journal, but has not been fully edited. Content may change prior to final publication. Citation information: DOI 10.1109/TBME.2016.2549363, IEEETransactions on Biomedical Engineering
3
monitor their effectiveness, as well as lessen the time and costof clinical trials.
The standardized list of baseline scans from ADNI-1 [32]was utilized in our work to enable future comparisons withother methods. The standardized list consists of 818 subjectsthat were classified into five different groups as shown inTable I. The AD and NC groups were determined accordingto the diagnosis at baseline. Subjects in the MCI group wereclassified as PMCI if the subjects converted to AD duringa 3 year follow-up. Subjects were classified as SMCI if thediagnosis was MCI at both baseline and 36 months. Thosewhose diagnosis were missing at 36 months were grouped asunknow MCI (uMCI). The uMCI subjects were not used inthe validation.
B. Image PreprocessingThe framework of the proposed classification method is
illustrated in Figure 1, consisting of five steps in the prepro-cessing stage. T1-weighted Magnetic Resonance (MR) brainimages were first preprocessed by the standard ADNI pipelineas described in [34], and skull-stripped using the methodproposed in [35]. In order to investigate the effect of registra-tion on the prediction of MCI-to-AD conversion, all imageswere aligned to the MNI152 template using registration basedon B-spline free-form deformation (FFD) [36]. Five differentlevels of deformation were used: affine, 20mm, 10mm, 5mm,2.5mm (from coarse to fine registration), generating imagesin the MNI152 template space with different alignment levels.Except for the affine registration, non-rigid were performedusing B-spline FFD with the above varying control pointspacings. It should be mentioned that if more accuate registra-tion is applied, the images are better aligned for comparisonwhile at the same time more pathological changes might beremoved. Additionally, the approach proposed in [37] was usedto normalize the image intensities between the subjects and thetemplate. The basic idea in [37] is to deform the histogramof a given image to match a standard histogram. In ourwork, we used the histogram of the MNI152 template imageas the standard histogram. After registration and intensitynormalization, all the images were in the same templatespace and had the same intensity scale for comparison. Then,the normalized intensities in the images can be extracted asfeatures for classification.
The effects of normal aging were then estimated on thevoxel-wise intensities of NC subjects by fitting a linear re-gression model [25] at each location. Given that there areN healthy subjects and each image contains M brain vox-els, the normalized intensity values of the preprocessed MRimages of all NC subjects can be represented by a matrixXT = [X1
T , X2T , · · · , Xi
T , · · · , XMT ] ∈ RN×M , where
each row is given as Xi = [xi1, xi2, · · · , xiN ] ∈ R1×N , i =1, 2, · · · ,M . The ages of N healthy subjects are denoted asa vector A ∈ R1×N . The effect of age-related atrophy isestimated at each voxel separately by fitting a linear regressionmodel Xi = wiA+ bi. After this model is solved in the leastsquares sense, the aging effect at the ith voxel of the jth imagecan be removed as xnewij = xij − wiaj − bi. Figure 2 showsan example of the images after different preprocessed steps.
(a) (b) (c)
Fig. 2. Images after different preprocessing steps: (a) image after skull-stripping; (b) image after spatially and intensity normalization (left) and theMNI152 template (right); (c) image after the removal of normal aging effect.
C. Feature Selection
After preprocessing, there is still a large amount of voxelsavailable in brain MR images, but not all of them are relatedto the pathological changes specific to AD. In addition, thenumber of available images is typically much smaller than thenumber of voxels, which could result in classifier overfitting.Therefore, a feature selection step is necessary to tackle thisproblem and also to select informative voxels for classification.Sparse regression techniques have been widely used to selectdiscriminative voxels for AD classification in previous works[29], [30]. The LASSO method using L1 norm [29] is oneof the effective sparse regression methods. However, thereare two drawbacks of the original LASSO sparse regression[38]: (a) the structural relationship of neighboring voxels areignored; (b) the number of selected voxels is limited bythe number of images. In order to address these drawbacks,advanced sparse regression methods [29], [30], [31] havebeen recently proposed for selecting discriminative voxels. Forexample, manifold learning techniques [31] have been suc-cessfully incorporated into the sparse feature selection modelsto aid the classification. Furthermore, some studies [39], [40]proposed methods of joint sparse feature selection for bothdisease diagnosis and clinical score prediction. Although theseadvanced methods [31], [39], [40] provide a good solutionfor selecting meaningful features, they were applied to selectfeatures from hundreds of region-wise features. When featureselection is performed over millions of voxel-wise features,these advanced methods might not be implemented efficiently.In this work, we utilized an Elastic Net (EN) method [30] forfeature selection as this method can still be solved efficientlyeven with an input of millions of features. It is formulated asfollows:
β = minβ
1
2‖y −Xβ‖22 + λs‖β‖1 + λg ‖β‖22 (1)
where X is a matrix containing vectorized training images andy includes the clinical labels of these images. The EN methodadds a L2 regularization term to the LASSO regression, whichresults in a grouping effect to select highly correlated variables(i.e. neighboring voxels) and allows us to select a number ofvoxels greater than the number of images. Equation 1 can besolved efficiently when λg →∞. As shown in [41], a closed-form solution of minimizing Equation 1 can then be obtainedfor each variable xi:

0018-9294 (c) 2015 IEEE. Personal use is permitted, but republication/redistribution requires IEEE permission. See http://www.ieee.org/publications_standards/publications/rights/index.html for more information.
This article has been accepted for publication in a future issue of this journal, but has not been fully edited. Content may change prior to final publication. Citation information: DOI 10.1109/TBME.2016.2549363, IEEETransactions on Biomedical Engineering
4
TABLE IDEMOGRAPHIC INFORMATION OF THE DATASET USED IN THIS STUDY. MMSE: MINI-MENTAL STATE EXAMINATION; CDR-SB: CLINICAL DEMENTIA
RATING-SUM OF BOXES; RAVLT: REY’S AUDITORY VERBAL LEARNING TEST; FAQ: FUNCTIONAL ACTIVITIES QUESTIONNAIRE; ADAS-COG:ALZHEIMER’S DISEASE ASSESSMENT SCALE-COGNITIVE SUBTEST.
Group Number Age MMSE CDR-SB RAVLT FAQ ADAS-cogNC 229 75.9 ± 5.0 29.1 ± 1.0 0.03 ± 0.12 42.9 ± 10.0 0.14 ± 0.60 6.20 ± 2.91SMCI 129 74.6 ± 7.5 27.6 ± 1.7 1.34 ± 0.65 35.1 ± 10.2 2.03 ± 3.08 9.65 ± 4.11PMCI 171 74.5 ± 7.0 26.6 ± 1.7 1.88 ± 0.97 27.1 ± 6.2 5.61 ± 5.11 13.20 ± 4.03uMCI 98 75.2 ± 8.0 27.0 ± 1.9 1.48 ± 0.87 31.3 ± 9.1 3.08 ± 3.73 11.03 ± 4.39AD 191 75.3 ± 7.5 23.3 ± 2.0 4.31 ± 1.63 22.9 ± 8.1 13.03 ± 6.85 18.55 ± 6.45
Fig. 1. The framework of the proposed method. The influence of different steps (in orange color) including registration, age correction, feature selection andtraining groups are studied. Based on the analysis of the impact of these factors, a novel grading biomarker is then proposed for the prediction of MCI-to-ADconversion. The same pre-processing step is applied to all images before calculating the grading biomarker.
βiλg→∞
=
(∣∣yTxi∣∣− λs2
)+
sgn(yTxi
), i = 1, 2, . . . ,M
(2)where (v)+ = max(v, 0) refers to the positive part. Equation(2) is known as a univariate soft thresholding problem andcan be solved very efficiently since yTxi is the univariateregression coefficient. Most existing approaches perform thefeature selection by just using the data from MCI subjects.However, in a recent study [20], it was shown that thefeature selection using data from AD and NC subjects couldsignificantly improve the prediction accuracy of MCI-to-ADconversion. Here, we applied the EN method on images ofAD and NC subjects for determining discriminative voxels.Another benefit from using AD and NC subjects for featureselection is that we can avoid the double-dipping problem. Theapproach that uses the same dataset for selection and selectiveanalysis is referred to as double dipping [42]. For example,if the test data are involved in both the feature selectionand the subsequent classifier validation, it will result in thedouble-dipping problem. Classification methods should avoiddouble dipping in order to perform a fair validation. In ourwork, only AD and NC subjects are used for feature selection,avoiding the use of the information from MCI subjects. Thus,our approach does not have this problem. In addition, a re-sampling scheme [30] was employed to reduce sampling biasand to enable a robust feature selection. This scheme selectsdiscriminative voxels by repeatedly fitting the EN regressionmodel on a random subset of the training images while keepingtrack of voxels that are consistently selected in the sparse
regression model. Figure 3 shows three orthogonal views ofthe probabilistic mask obtained from the EN algorithm usingnon-rigid registration with a 10mm control point spacing.
Fig. 3. Orthogonal views of the probability mask for the selection ofdiscriminative voxels.
D. Calculation of Global Grading Biomaker
One aim in this work is to develop a biomarker for theprediction of MCI-to-AD conversion by utilizing the informa-tion from AD and NC subjects. As shown in many studies[14], [20], [23], [28], the disease information of AD andNC subjects are helpful for separating PMCI and SMCI.The hypothesis justifying this is that the subjects with SMCIare more NC-like while subjects who go on to developdementia are more AD-like. The classification of AD vs NCis a simplified version of the classification between PMCIand SMCI. Since the population of MCI subjects is highlyheterogeneous, training classfier for AD vs NC might bemore effective than training classifier for PMCI vs SMCI.Here, we develop a novel biomarker by propagating diseaselabels of NC and AD subjects to MCI subjects. A global

0018-9294 (c) 2015 IEEE. Personal use is permitted, but republication/redistribution requires IEEE permission. See http://www.ieee.org/publications_standards/publications/rights/index.html for more information.
This article has been accepted for publication in a future issue of this journal, but has not been fully edited. Content may change prior to final publication. Citation information: DOI 10.1109/TBME.2016.2549363, IEEETransactions on Biomedical Engineering
5
grading value is calculated for each MCI subject and used asbiomarker for classification. Given the NC and AD subjects asthe training population, the relationship between the trainingpopulation and each MCI subject needs to be investigated sothat the disease information of the training population can bepropagated to MCI subjects. In [23], the relationship betweeneach MCI subject and the training population is modeled by aweighting function. Here, we model this relationship using asparse representation method, which has been demonstrated tobe superior to the weighting function in image segmentation[43], [44]. Each MCI subject is assumed to lie in the space ofthe training population, which means that it can be representedby a linear combination of NC and AD subjects in the trainingpopulation. In addition, a sparse constraint is added to therepresentation. In order to seek a sparse representation ofeach MCI subject, we also use the Elastic Net technique.After feature selection, K discriminative voxels are determinedand K intensity values are extracted from each image. GivenXADNC ∈ RK×N that contains the intensity values of Ntraining images and XMCI ∈ RK×1 that contains the intensityvalues of a single MCI image, the sparse representation of thisMCI subject can be obtained by minimizing the following costfunction:
α = minα
1
2
∥∥XMCI −XADNCα∥∥22+λ1‖α‖1+λ2 ‖α‖
22 (3)
Here α are the coding coefficients. Most of the coefficients inα are zero due to the sparsity constraint. If the coefficient in αis not zero, it indicates that the corresponding training imagehas been selected to propagate its clinical label informationto the target MCI subject. By adding L2 norm in Equation(3), a grouping effect can be obtained over the sparse codingcoefficients. Qualitatively speaking, an algorithm exhibits thegrouping effect if the coding coefficients of a group of highlycorrelated subjects tend to be equal. For example, there aretwo training subjects with very similar or identical intensitypatterns. If we just use L1 norm, it will select one of themwhile eliminating the other one. However, in calculating thegrading biomarker, both subjects are similar to the target sub-ject and should be used to propagate their disease informationto the target subject. After adding L2 norm as in equation(3), both subjects can be selected in calculating the gradingbiomarker. After the sparse solution is obtained, the scoringof the target MCI subject is based on the coding coefficientsα and the clinical status of the selected training population.The clinical status of a training image is denoted as sj . If thetraining image is a NC subject, sj is set to 1; otherwise, sjis set to −1 for AD subjects. A global grading value of thetarget MCI subject is then calculated by:
gMCI =
∑Nj=1 α(j)sj∑Nj=1 α(j)
(4)
where N is the number of the training images in XADNC andα(j) is the coding coefficient corresponding to the trainingimage XADNC(j). If gMCI is close to −1, it indicates thatthis MCI subject is more characteristic of PMCI than SMCIand is likely to convert to AD within the given time period.
If gMCI is close to 1, it indicates that the MCI subject willpossibly not convert to AD and remain stable within the giventime period.
E. Implementation details
For training classifiers with single type of features (i.e.intensity features or grading biomarkers), support vector ma-chine (SVM) with a linear kernel was used as SVM is one ofthe most widely used classifiers. The implementation of SVMwas performed using liblinear in matlab (http://www.csie.ntu.edu.tw/∼cjlin/liblinear). The liblinear was used since it can beimplemented efficiently for large-scale linear classification. Itis a large-scale classification problem when millions of voxel-wise intensity features are used for the input of classifier train-ing. The linear SVM only has one soft margin parameter C,which was optimized in the range of 2i, i = {−5,−4, · · · , 5}via cross validation. All features were normalized to havezero mean and unit variance before the classification. Forcalculating the grading biomarker, the parameters λ1 andλ2 in Equation 3 were determined on the logarithmic scale10i, i = {−3,−2, · · · , 3}. The best setting found is λ1 = 0.1and λ2 = 100, which was used for the final calculationof grading features. The sparse coding process of EN wascarried out using the SPAMS toolbox (http://spams-devel.gforge.inria.fr/index.htm) [45]. For the evaluation of classi-fication performance, 10-fold cross validation was carried out.The reported results in terms of accuracy (ACC), sensitivity(SEN), specificity (SPE) and area under curve (AUC) areaverages over 100 runs. To assess the statistical significanceof different results, Student’s t-tests were performed using theaccuracies of the 100 runs. In addition, in order to allow fora fair comparison with the best result reported in [20], wecombined the proposed global grading biomarker with ageand cognitive measures for classification. The random forestclassifier (http://code.google.com/p/randomforest-matlab) wasthen trained using the combined biomarkers as in [20]. Therandom forest classifier was utilized because it was shown toyield better performance than SVM for combining differenttypes of biomarkers [20]. Therefore, when the input wasan individual type of features, SVM was used for classifiertraining while random forest was only used in combining ofdifferent types of features.
III. RESULTS
A. The impact of registration and age correction
Experiments were conducted to investigate the effect ofregistration and age correction on the prediction of MCI-to-ADconversion. Since AD and NC subjects were used as trainingimages in the following feature selection step, the impact ofregistration and age correction were also analysed for theclassification of AD vs NC. As can be seen from Figures4 and 5, the SVM classifiers achieve the best accuraciesusing registration with a control point spacing between 5mmand 10mm in both classification scenarios, which can be agood choice for the classification of AD using MR intensities.In addition, Figure 4 shows that the removal of the age-related effects is significantly helpful for the classification
0018-9294 (c) 2015 IEEE. Personal use is permitted, but republication/redistribution requires IEEE permission. See http://www.ieee.org/publications_standards/publications/rights/index.html for more information.
This article has been accepted for publication in a future issue of this journal, but has not been fully edited. Content may change prior to final publication. Citation information: DOI 10.1109/TBME.2016.2549363, IEEETransactions on Biomedical Engineering
6
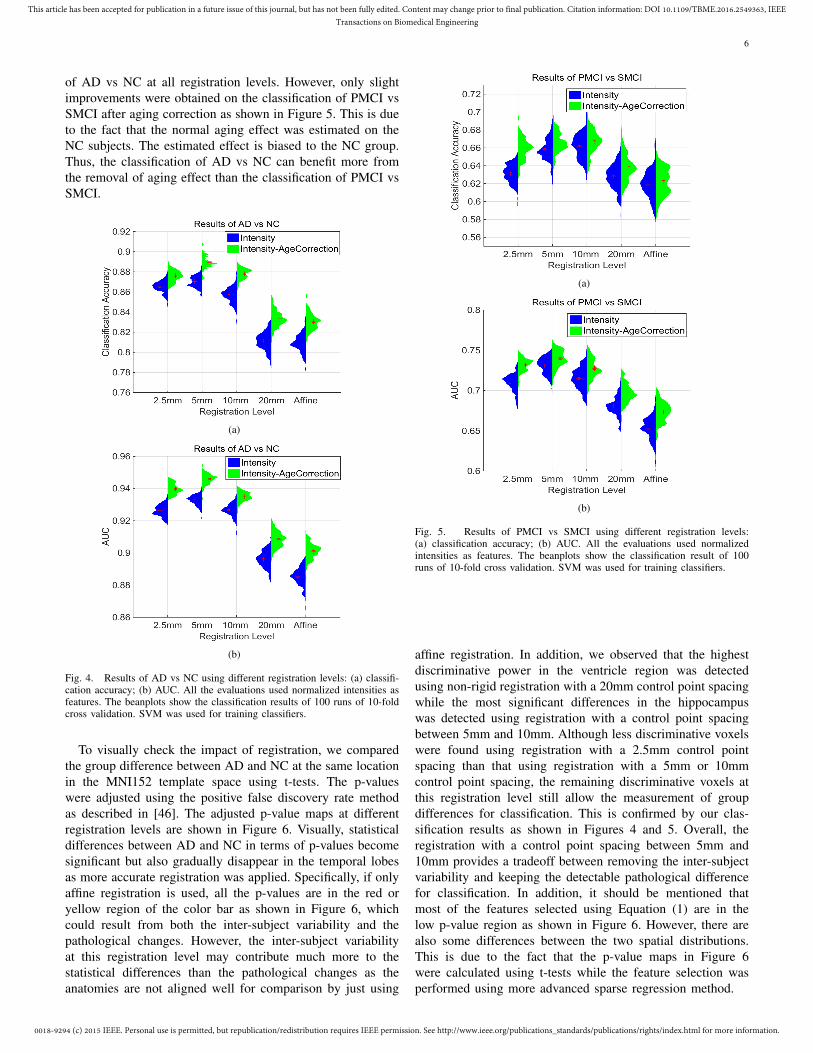
of AD vs NC at all registration levels. However, only slightimprovements were obtained on the classification of PMCI vsSMCI after aging correction as shown in Figure 5. This is dueto the fact that the normal aging effect was estimated on theNC subjects. The estimated effect is biased to the NC group.Thus, the classification of AD vs NC can benefit more fromthe removal of aging effect than the classification of PMCI vsSMCI.
(a)
(b)
Fig. 4. Results of AD vs NC using different registration levels: (a) classifi-cation accuracy; (b) AUC. All the evaluations used normalized intensities asfeatures. The beanplots show the classification results of 100 runs of 10-foldcross validation. SVM was used for training classifiers.
To visually check the impact of registration, we comparedthe group difference between AD and NC at the same locationin the MNI152 template space using t-tests. The p-valueswere adjusted using the positive false discovery rate methodas described in [46]. The adjusted p-value maps at differentregistration levels are shown in Figure 6. Visually, statisticaldifferences between AD and NC in terms of p-values becomesignificant but also gradually disappear in the temporal lobesas more accurate registration was applied. Specifically, if onlyaffine registration is used, all the p-values are in the red oryellow region of the color bar as shown in Figure 6, whichcould result from both the inter-subject variability and thepathological changes. However, the inter-subject variabilityat this registration level may contribute much more to thestatistical differences than the pathological changes as theanatomies are not aligned well for comparison by just using
(a)
(b)
Fig. 5. Results of PMCI vs SMCI using different registration levels:(a) classification accuracy; (b) AUC. All the evaluations used normalizedintensities as features. The beanplots show the classification result of 100runs of 10-fold cross validation. SVM was used for training classifiers.
affine registration. In addition, we observed that the highestdiscriminative power in the ventricle region was detectedusing non-rigid registration with a 20mm control point spacingwhile the most significant differences in the hippocampuswas detected using registration with a control point spacingbetween 5mm and 10mm. Although less discriminative voxelswere found using registration with a 2.5mm control pointspacing than that using registration with a 5mm or 10mmcontrol point spacing, the remaining discriminative voxels atthis registration level still allow the measurement of groupdifferences for classification. This is confirmed by our clas-sification results as shown in Figures 4 and 5. Overall, theregistration with a control point spacing between 5mm and10mm provides a tradeoff between removing the inter-subjectvariability and keeping the detectable pathological differencefor classification. In addition, it should be mentioned thatmost of the features selected using Equation (1) are in thelow p-value region as shown in Figure 6. However, there arealso some differences between the two spatial distributions.This is due to the fact that the p-value maps in Figure 6were calculated using t-tests while the feature selection wasperformed using more advanced sparse regression method.

0018-9294 (c) 2015 IEEE. Personal use is permitted, but republication/redistribution requires IEEE permission. See http://www.ieee.org/publications_standards/publications/rights/index.html for more information.
This article has been accepted for publication in a future issue of this journal, but has not been fully edited. Content may change prior to final publication. Citation information: DOI 10.1109/TBME.2016.2549363, IEEETransactions on Biomedical Engineering
7
Fig. 6. Visualization of the impact of registration. The presented results wereobtained on 191 AD vs 229 NC using t-tests. The normalized intensities afterage correction were used for comparison. Only the p-values lower than 10−2
are displayed. The showed overlay values are the log base 10 of p-values.The hippocampus area is enlarged for visualization. The lower p values (i.eas shown in blue) represent more significant differences between AD patientsand healthy subjects, indicating possible disease changes due to AD in thatregion (i.e the blue region).
B. The importance of feature selection and training dataselection
The performance of the EN feature selection was furtherevaluated for the classification of PMCI vs SMCI. We alsoperformed feature selection on AD and NC subjects. Theintuition behind this is that the pathological changes fromNC to AD should cover the pathological changes from SMCIto PMCI. Thus, we assumed that the features selected fromdiscriminating NC vs AD would be useful for the classificationbetween PMCI and SMCI. As shown in Table II, the improve-ment of using the EN feature selection was the most significantat the registration level with a control spacing of 10mm, but thefeature selection is not consistently helpful at all registrationlevels. In addition, the feature selection performed over ADand NC subjects are more effective than that performed overMCI subjects.
Moreover, the influence of using different data for trainingclassifiers was also studied. We performed both the featureselection and the classifier training on AD vs NC and thenapplied the learned classifier for discriminating PMCI vsSMCI. The results are shown in Table II. It is interesting to
TABLE IICLASSIFICATION RESULTS OF PMCI VS SMCI. INTENSITIES WERE USED
AS FEATURES. SVM WAS USED FOR TRAINING CLASSIFIERS. THEMETHOD MCI MCI REPRESENTS THAT THE CLASSIFIERS WERE TRAINED
ON THE MCI SUBJECTS WITHOUT FEATURE SELECTION. THE METHODMCIEN MCI MEANS THAT BOTH THE FEATURE SELECTION USING EN
AND CLASSIFIER TRAINING USING SVM WERE PERFORMED ON MCISUBJECTS. THE METHOD ADNCEN MCI REPRESENTS THAT THEFEATURE SELECTION WAS PERFORMED ON AD VS NC WHILE THE
CLASSIFIER TRAINING WAS CARRIED OUT ON MCI SUBJECTS.ADNCEN ADNC REPRESENTS THAT BOTH THE FEATURE SELECTION
AND CLASSIFIER TRAINING WERE PERFORMED ON AD VS NC.
Method Registraionlevel Affine 20mm 10mm 5mm 2.5mm
MCI MCI ACC (%) 63.1 63.7 66.5 66.7 65.9AUC (%) 68.3 69.2 72.8 74.0 73.2
MCIEN MCI ACC (%) 62.0 63.8 69.1 66.9 64.8AUC (%) 67.1 69.0 75.8 73.1 72.7
ADNCEN MCI ACC (%) 63.4 65.2 69.2 67.9 66.0AUC (%) 69.0 69.7 76.5 75.3 71.6
ADNCEN ADNC ACC (%) 66.7 70.0 73.2 72.4 71.7AUC (%) 70.8 74.2 78.2 76.5 76.3
note that the use of AD and NC subjects in training classifiercan significantly improve the classification accuracy and theimprovement is consistently at all registration levels.
C. Grading biomarker
Based on the selected voxels using EN, the disease informa-tion of AD and NC subjects were then propagated to MCI sub-jects to calculate the global grading biomarkers as describedin section II-D. In this way, we can avoid training classifierson AD vs NC but still use the disease information from ADand NC subjects to aid the classification of PMCI vs SMCIdue to the propagation process. The proposed global gradingbiomarker was also evaluated using different levels of registra-tion. In addition, the hippocampus grading biomarker proposedin [23] was calculated for comparison. In order to calculatethe hippocampus grading biomarker at different registrationlevels, several steps were carried out: (1) the hippocampus wassegmented in native space using the method described in [47].In this method, 30 atlases were transformed to a target imagespace using non-rigid registration [36]. Then, atlas label mapswere transformed using the obtained transformations. Finally,a label fusion step with an expectation-maximization (EM)refinement was conducted to obtain a consensus segmentation.The detailed parameter settings of this approach can be foundin [47]. (2) the segmented hippocampus was transformedto the template space using different levels of registration;(3) the clinical labels were propagated from NC and ADsubjects to MCI subjects at voxel level using patches [47];(4) average grading value within the hippocampus, which weterm the hippocampus grading, was calculated for each MCIsubject. Figure 7 shows that the classification results using theproposed global grading are more accurate than those usingthe hippocampus grading. The improvement is hypothesized tobe due to the feature selection using EN and the propagationof disease information at image level.

0018-9294 (c) 2015 IEEE. Personal use is permitted, but republication/redistribution requires IEEE permission. See http://www.ieee.org/publications_standards/publications/rights/index.html for more information.
This article has been accepted for publication in a future issue of this journal, but has not been fully edited. Content may change prior to final publication. Citation information: DOI 10.1109/TBME.2016.2549363, IEEETransactions on Biomedical Engineering
8
Fig. 7. Comparison of the classification results using the global gradingbiomarker and the hippocampus (local) grading biomarker at different reg-istration levels. 100 runs of 10-fold cross validation were carried out. SVMwas used for training classifiers.
TABLE IIICOMPARISON OF CLASSIFICATION RESULTS OF PMCI VS SMCI WITH THEADNI SUBSET USED BY [22]. BACC REPRESENTS BALANCED ACCURACY,WHICH IS CALCULATED AS THE AVERAGE OF SENSITIVE AND SPECIFICITY.
Method Classifier SEN SPE AUC BACCVoxel-COMPARE in [22] SVM 62% 67% - 65%Voxel-STAND in [22] SVM 57% 78% - 67%Hippo-Volume in [22] Parzen 62% 69% - 66%Thickness-Direct in [22] SVM 32% 91% - 62%All biomarkers in [33] LDA 69% 54% - 62%MRI biomarker in [20] SVM 64% 72% 75% 68%Aggrerate biomarker in [20] RF 40% 94% 81% 67%Proposed global grading biomarker SVM 86.5% 67.2% 79.0% 76.9%Proposed combined biomarkers RF 85.2% 71.8% 83.8% 78.5%
D. Comparison with state-of-the-art methods
In this study, we evaluated the proposed method with thesame data as used by [20] and [22] respectively. The datafrom these studies was released and are also subsets ofthe standardized set [32]. The same cross validations as in[20] and [22] were used for fair comparisons. The globalgrading biomarker was calculated using registration with acontrol point spacing of 10mm. In addition, the global gradingbiomarker was combined with age and cognitive measuresfor classification (including MMSE, CDR-SB, RAVLT, FAQand ADAS-cog as shown in Table I), resulting in what wecall the combined biomarkers. This was performed as it hasbeen previously demonstrated to aid the classification of MCIsubjects [20]. In order to ensure a fair comparison with [20],the random forest classifier [20] was used to integrate ageand cognitive measures for classification. Different measuresof the same subject were concatenated into a feature vectorfor training. Tables III and IV show that our proposed methodachieves competitive performance with these state-of-the-artmethods. Based on the dataset used in [22], only four out of tenmethods can predict conversion slightly more accurately thana random classifier as shown in Table III but none of them ob-tained significantly better results. The obtained accuracy of ourproposed method is 76.1% with an AUC of 83.8%, which ismuch higher than that of a random classifier. To the best of ourknowledge, the study in [20] reported the highest classificationperformance on the prediction of MCI-to-AD conversion to
TABLE IVCOMPARISON OF CLASSIFICATION RESULTS OF PMCI VS SMCI WITH THE
ADNI SUBSET USED BY [20].
Method Classifier ACC SEN SPE AUCMRI biomarker in [20] SVM 74.7% 88.9% 51.6% 76.6%Proprosed global grading biomarker SVM 78.9% 76.0% 82.9% 81.3%Aggrerate biomarker in [20] RF 81.7% 86.7% 73.6% 90.2%Proposed combined biomarkers RF 84.1% 88.7% 76.5% 91.7%
date. In addition, to enable future comparisons with othermethods, we have provided the evaluation script (includingimage list, features and cross-validation source codes availableat http://scholar.harvard.edu/ttong/software/novel-grading) toreproduce the best result reported in this paper.
IV. DISCUSSION
Fig. 8. The classification results of PMCI vs SMCI by adding different factorsone by one. SVM was used for training classifiers. ** means that the result issignificantly improved by adding this factor. Original means that the resultswere obtained by using normalized intensities after affine registration. Thereis only one accuracy for the fifth column because the classifier was trainedon discriminating AD vs NC and then directly applied on the classificationof PMCI vs SMCI. Thus, there is no cross validation in this scenario. For thesixth column, cross validations were applied to all MCI subjects using theirgrading biomarkers as input features while the combined biomarkers wereused in the seventh column.
In this study, we have developed a novel grading biomarkerfor the prediction of MCI-to-AD conversion. First, we investi-gated the impact of several important factors on the predictionperformance including registration accuracy, age correction,feature selection and the selection of training data. By addingor optimizing these preprocessing steps, the classificationaccuracy between SMCI and PMCI can be gradually improvedfrom 62% to 73% as shown in Figure 8. Except for the age cor-rection, all the other three factors significantly contribute to theimprovement of the prediction accuracy. Based the analysis ofthese factors, we further proposed a novel grading biomarker.Using the grading biomarker, the prediction accuracy furtherincreased to 75%. The proposed grading biomarker benefitsnot only from the studies of the above pre-processing steps butalso from the use of the sparse representation technique. Dueto the sparsity constraint, the sparse representation techniquecan only allow a few similar training subjects from AD and

0018-9294 (c) 2015 IEEE. Personal use is permitted, but republication/redistribution requires IEEE permission. See http://www.ieee.org/publications_standards/publications/rights/index.html for more information.
This article has been accepted for publication in a future issue of this journal, but has not been fully edited. Content may change prior to final publication. Citation information: DOI 10.1109/TBME.2016.2549363, IEEETransactions on Biomedical Engineering
9
TABLE VRESULTS OF DIFFERENT CLASSIFIERS USING THE COMBINED
BIOMARKERS.
Method ACC SEN SPE AUCCombined biomarker SVM 77.2% 75.0% 80.1% 84.9%Combined biomarker RF 80.7% 86.7% 72.6% 87.0%
NC to propagate their disease information to the MCI subjectsfor calculating the grading features, thus eliminating somedissimilar subjects in the feature calculation. The obtainedaccuracy using age and cognitive measures is 76%, which isslight higher than that of the grading biomarker. However,the prediction accuracy was further boosted to 81% with anAUC of 87% by combining the proposed grading biomarkerwith age and cognitive measures, indicating that there arecomplementary information between these different measures.
One contribution of our work is the comprehensive studyof the impact of different factors: (1) We demonstrated thatnon-rigid registration with a control spacing point between5mm and 10mm is a good choice for the classification of ADusing MR intensities as this registration level can provide atradeoff between the removal of inter-subject variability andthe amount of detectable pathological changes. However, asshown in Figure 5, the pathological changes in the ventricleregion was best detected using registration with a 20mmcontrol point spacing while the highest discriminative power inthe hippocampus area was obtained after applying registrationwith a control spacing point between 5mm and 10mm. There-fore, it may be helpful to apply a multi-level feature selectionto extract the pathological changes at different registrationlevels so that the best detectable pathological changes atdifferent regions can be combined for classification. We willinvestigate this in our future work. (2) Since normal aging hassimilar atrophy effects on certain regions as AD [20], [25],[48], it would cause a confounding effect on using the disease-specific changes for classification. Thus, a linear regressionmodel [25], [49] was used to remove the confounding effectof normal aging. Although the improvement by adding agecorrection is not significant, it is consistently helpful for allthe classification experiments as shown in Figures 4 and 5.In addition, it should be noted that the linear correction ofage is an approximation of the normal aging process sincethe trajectory of normal aging can be assumed to be nonlinearas shown in previous studies [21], [50]. A more specializednonlinear regression model would be more effective in re-moving the confounding effects of normal aging. Althoughthe normal aging effect was removed from the calculationof disease-specific MR biomarkers, age was added as anadditional feature in the final classification. This is due tothe fact that age is a risk factor for AD. It is reported thatolder subjects are more likely to develop AD than youngersubjects. This means that age is an important predictor forclassification of AD. Thus, we added age as an additionalfeature in the final classification. (3) Moreover, we observedthat the effectiveness of the feature selection is related to theaccuracy of the registration as demonstrated in Table II. Whenaffine registration is applied, the anatomies are not aligned welland thus the feature selection is not effective at this registration
level as it does not compare like with like. When very accurateregistration is applied (i.e. non-rigid registration with a 2.5mmcontrol point spacing), the feature selection is also not effectiveas less noisy features present due to the removal of inter-subject variability. Feature selection is more effective at theregistration level between 5mm and 10mm since not only thepathological changes can be detected at this registration levelbut also the amount of noisy voxels (possible due to remaininginter-subject variability) is still large as shown in Figure 5. (4)In addition, when the classifier is trained on AD vs NC, theclassification performance between PMCI and SMCI can besignificantly improved, which is in accordance with resultspresented in previous studies [14], [51], [52]. This findingis encouraging because it is easier to obtain labeled trainingdata from AD and NC subjects than from MCI subjects (MCIsubjects need to be tracked for years to establish their traininglabels while the training labels of AD and NC subjects can bedetermined at baseline).
Another contribution in this work is the proposal of theglobal grading biomarker. In contrast to recent studies on theADNI data that rely on combinations of complex features [7],[33], [53], [54], [55] or integrations of multiple modalities[5], [56], [14], the proposed biomarker is a single MRI-basedinterpretable feature. When the grading value is close to −1, itindicates that the subject is more characteristic of PMCI thanSMCI and has a high possibility to convert to AD within 3years while the grading value 1 means that this MCI subjectwill possibly remain stable within this period. Although theproposed grading biomarker is calculated using normalizedintensities, it can also be calculated using other features suchas the grey matter density maps [22] or cortical thickness [13].However, the factors including registration, age correction,feature selection and training groups may also have significantinfluence on these features and need to be studied in order tocalculate an effective grading biomarker for the prediction ofMCI-to-AD conversion.
The prediction accuracy for conversion from MCI to ADvaries in the range of 56%-82% in recent studies as shown inTable VI. The variations in the reported results can be causedby several factors such as different machine learning methods,different biomarkers, different subsets from ADNI, differentcross validations. Another important factor, which can also sig-nificantly affect the prediction results, is how the MCI subjectsare separated into SMCI and PMCI. For example, as shownin Table VI, the proposed combined biomarkers achievedsignificantly different results when different definitions ofSMCI and PMCI were adopted. Based on the definition asdescribed in section II-A, the proposed biomarkers achieveda classification AUC of 87%. When we applied the samevalidatation on the subjects using the definition of SMCI andPMCI as described in [20], the classification AUC increasedto 92%. The improvement is caused by the strict definition ofSMCI as in [20], which removed those SMCI subjects whoconverted to AD after 36 months. In spite of the large variationin the reported accuracies, it is encouraging to note that thereis an increasing trend in the prediction accuracy with the recentprogress on this challenging task, which will finally lead to aprediction rate suitable for clinical use.

0018-9294 (c) 2015 IEEE. Personal use is permitted, but republication/redistribution requires IEEE permission. See http://www.ieee.org/publications_standards/publications/rights/index.html for more information.
This article has been accepted for publication in a future issue of this journal, but has not been fully edited. Content may change prior to final publication. Citation information: DOI 10.1109/TBME.2016.2549363, IEEETransactions on Biomedical Engineering
10
TABLE VIRESULTS OF PREVIOUS STUDIES FOR PREDICTING MCI-TO-AD CONVERSION ON THE ADNI DATASET. RF WAS APPLIED TO THE COMBINED
BIOMARKER FOR TRAINING CLASSIFIERS. ACC: ACCURACY; AUC: AREA UNDER THE RECEIVER OPERATING CHARACTERISTIC CURVE.
Study Data Number of Subjects Conversion time ACC AUC[4] MRI 76 PMCI, 134 SMCI 0-18 months 64% -
[57] MRI 72 PMCI, 50 SMCI 0-24 months 73% -[3] MRI 27 PMCI, 76 SMCI 0-36 months 81% 77%
[22] MRI 76 PMCI, 134 SMCI 0-18 months 67% -[33] MRI 167 PMCI, 238 SMCI 0-48 months 56%-68% -[58] MRI, CSF 69 PMCI, 170 SMCI 0-36 months 62% 73%[59] MRI 154 PMCI, 215 SMCI 0-36 months 72% -[9] MRI 62 PMCI, 256 SMCI 0-18 months 66% 65%[7] MRI 72 PMCI, 131 SMCI 0-18 months 71% -
[23] MRI, age 167 PMCI, 238 SMCI 0-48 months 74% -
[60] MRI, PETcognitive scores 38 PMCI, 50 SMCI 0-24 months 78% 77%
[10] MRIcognitive scores 153 PMCI, 182 SMCI 0-36 months 65% -
[55] MRI 89 PMCI, 111 SMCI 0-36 months 75% 84%
[14] MRI, PETAPOE 47 PMCI, 96 SMCI 0-36 months 74% 80%
[19] MRI 167 PMCI, 238 SMCI 0-48 months 72% 76%
[20] MRI, agecognitive scores 164 PMCI, 100 SMCI 0-36 months 82% 90%
Combined biomarkers(this study)
MRI, agecognitive scores
164 PMCI, 100 SMCI 0-36 months 84% 92%171 PMCI, 129 SMCI 0-36 months 81% 87%
V. CONCLUSION
In this work, we first investigated the influence of fourfactors on the prediction of MCI-to-AD conversion: regis-tration accuracy, age correction, feature selection and theselection of training data. Furthermore, we have proposed anew biomarker based on global grading for the prediction ofMCI-to-AD conversion. The evaluation on the ADNI datasetshows promising results and demonstrates the efficacy of theproposed biomarker. As indicated by the experimental results,the improvement of the classification performance on the MCI-to-AD conversion prediction benefits from the contributionof several factors: (a) the optimal registration level to alignimages to the template space; (b) the removal of the age-related effect; (c) the feature selection step using EN; (d)the calculation of the grading biomarker using AD and NCgroups; (e) the use of the sparse representation technique; (f)the combination of cognitive measures.
ACKNOWLEDGMENTS
This work was partially funded under the 7thFramework Programme by the European Commission(http://cordis.europa.eu; EU-Grant-611005-PredictND) andthe Provincial Natural Science Foundation of Fujian, China(Grant No. 2016J05157). The ADNI Data collection andsharing for this project was funded by the Alzheimer’s DiseaseNeuroimaging Initiative (ADNI; Principal Investigator:Michael Weiner; NIH grant U01 AG024904). ADNI isfunded by the National Institute on Aging, the NationalInstitute of Biomedical Imaging and Bioengineering (NIBIB),and through generous contributions from the following:Pfizer Inc., Wyeth Research, Bristol-Myers Squibb, EliLilly and Company, GlaxoSmithKline, Merck & Co. Inc.,AstraZeneca AB, Novartis Pharmaceuticals Corporation,Alzheimer’s Association, Eisai Global Clinical Development,Elan Corporation plc, Forest Laboratories, and the Institute for
the Study of Aging, with participation from the U.S. Food andDrug Administration. Industry partnerships are coordinatedthrough the Foundation for the National Institutes of Health.The grantee organization is the Northern California Institutefor Research and Education, and the study is coordinated bythe Alzheimer’s Disease Cooperative Study at the Universityof California, San Diego. ADNI data are disseminated by theLaboratory of Neuroimaging at the University of California,Los Angeles.
REFERENCES
[1] M. Grundman et al., “Mild cognitive impairment can be distinguishedfrom Alzheimer disease and normal aging for clinical trials,” Archivesof neurology, vol. 61, no. 1, pp. 59–66, 2004.
[2] K. G. Yiannopoulou and S. G. Papageorgiou, “Current and future treat-ments for Alzheimer’s disease,” Therapeutic advances in neurologicaldisorders, vol. 6, no. 1, pp. 19–33, 2013.
[3] C. Misra et al., “Baseline and longitudinal patterns of brain atrophy inMCI patients, and their use in prediction of short-term conversion toAD: results from ADNI,” NeuroImage, vol. 44, no. 4, pp. 1415–1422,2009.
[4] M. Chupin et al., “Fully automatic hippocampus segmentation andclassification in Alzheimer’s disease and mild cognitive impairmentapplied on data from ADNI,” Hippocampus, vol. 19, no. 6, pp. 579–587, 2009.
[5] D. Zhang et al., “Multimodal classification of Alzheimer’s disease andmild cognitive impairment,” NeuroImage, vol. 55, no. 3, pp. 856–867,2011.
[6] C.-Y. Wee et al., “Enriched white matter connectivity networks foraccurate identification of MCI patients,” NeuroImage, vol. 54, no. 3,pp. 1812–1822, 2011.
[7] Y. Cho et al., “Individual subject classification for Alzheimer’s diseasebased on incremental learning using a spatial frequency representationof cortical thickness data,” NeuroImage, vol. 59, no. 3, pp. 2217–2230,2012.
[8] J. Ye et al., “Sparse learning and stability selection for predicting MCIto AD conversion using baseline ADNI data,” BMC neurology, vol. 12,no. 1, p. 46, 2012.
[9] E. Westman et al., “Combining MRI and CSF measures for classificationof Alzheimer’s disease and prediction of mild cognitive impairmentconversion,” NeuroImage, vol. 62, no. 1, pp. 229–238, 2012.
0018-9294 (c) 2015 IEEE. Personal use is permitted, but republication/redistribution requires IEEE permission. See http://www.ieee.org/publications_standards/publications/rights/index.html for more information.
This article has been accepted for publication in a future issue of this journal, but has not been fully edited. Content may change prior to final publication. Citation information: DOI 10.1109/TBME.2016.2549363, IEEETransactions on Biomedical Engineering
11
[10] R. Casanova et al., “Alzheimer’s disease risk assessment using large-scale machine learning methods,” PloS one, vol. 8, no. 11, p. e77949,2013.
[11] C. Gaser et al., “BrainAGE in mild cognitive impaired patients: predict-ing the conversion to Alzheimer’s disease,” PloS one, vol. 8, no. 6, p.e67346, 2013.
[12] K. R. Gray et al., “Random forest-based similarity measures for multi-modal classification of alzheimer’s disease,” NeuroImage, vol. 65, pp.167–175, 2013.
[13] S. F. Eskildsen et al., “Prediction of Alzheimer’s disease in subjectswith mild cognitive impairment from the ADNI cohort using patternsof cortical thinning,” NeuroImage, vol. 65, pp. 511–521, 2013.
[14] J. Young et al., “Accurate multimodal probabilistic prediction of conver-sion to Alzheimer’s disease in patients with mild cognitive impairment,”NeuroImage: Clinical, vol. 2, pp. 735–745, 2013.
[15] G. Yu et al., “Multi-task linear programming discriminant analysis forthe identification of progressive MCI individuals,” Plos one, vol. 9, no. 5,p. e96458, 2014.
[16] T. Tong et al., “Multiple instance learning for classification of dementiain brain MRI,” Medical Image Analysis, vol. 18, no. 5, pp. 808–818,2014.
[17] F. Li et al., “A robust deep model for improved classification of AD/MCIpatients,” IEEE Journal of Biomedical and Health Informatics, vol. 19,no. 5, pp. 1610–1616, 2015.
[18] C.-Y. Wee et al., “Sparse temporally dynamic resting-state functionalconnectivity networks for early MCI identification,” Brain Imaging andBehavior, pp. 1–15, 2015.
[19] S. Eskildsen et al., “Structural imaging biomarkers of Alzheimer’sdisease: predicting disease progression,” Neurobiology of Aging, vol. 36,pp. 23–31, 2015.
[20] E. Moradi et al., “Machine learning framework for early MRI-basedAlzheimer’s conversion prediction in MCI subjects,” NeuroImage, vol.104, pp. 398–412, 2015.
[21] C. R. Jack et al., “Hypothetical model of dynamic biomarkers of theAlzheimer’s pathological cascade,” The Lancet Neurology, vol. 9, no. 1,pp. 119–128, 2010.
[22] R. Cuingnet et al., “Automatic classification of patients with Alzheimer’sdisease from structural MRI: A comparison of ten methods using theADNI database,” NeuroImage, vol. 56, no. 2, pp. 766–781, 2011.
[23] P. Coupe et al., “Scoring by nonlocal image patch estimator for earlydetection of Alzheimer’s disease,” NeuroImage: Clinical, vol. 1, no. 1,pp. 141–152, 2012.
[24] E. E. Bron et al., “Standardized evaluation of algorithms for computer-aided diagnosis of dementia based on structural MRI: The CADDemen-tia challenge,” NeuroImage, vol. 111, pp. 562–579, 2015.
[25] J. Dukart et al., “Age correction in dementia–matching to a healthybrain,” PloS one, vol. 6, no. 7, p. e22193, 2011.
[26] K.-H. Thung et al., “Neurodegenerative disease diagnosis using in-complete multi-modality data via matrix shrinkage and completion,”NeuroImage, vol. 91, pp. 386–400, 2014.
[27] R. Filipovych et al., “Semi-supervised pattern classification of medicalimages: application to mild cognitive impairment,” NeuroImage, vol. 55,no. 3, pp. 1109–1119, 2011.
[28] B. Cheng et al., “Domain transfer learning for MCI conversion predic-tion,” in International Conference on MICCAI, 2012, pp. 82–90.
[29] M. Liu et al., “Identifying informative imaging biomarkers via treestructured sparse learning for AD diagnosis,” Neuroinformatics, vol. 12,no. 3, pp. 381–394, 2014.
[30] R. Guerrero et al., “Manifold population modeling as a neuro-imagingbiomarker: Application to ADNI and ADNI-GO,” NeuroImage, vol. 94,pp. 275–286, 2014.
[31] B. Jie et al., “Manifold regularized multitask feature learning formultimodality disease classification,” Human brain mapping, vol. 36,no. 2, pp. 489–507, 2015.
[32] B. T. Wyman et al., “Standardization of analysis sets for reporting resultsfrom ADNI MRI data,” Alzheimer’s & Dementia, vol. 9, no. 3, pp. 332–337, 2013.
[33] R. Wolz et al., “Multi-method analysis of MRI images in early diag-nostics of Alzheimer’s disease,” PloS one, vol. 6, no. 10, p. e25446,2011.
[34] C. R. Jack et al., “The Alzheimer’s disease neuroimaging initiative(ADNI): MRI methods,” Journal of Magnetic Resonance Imaging,vol. 27, no. 4, pp. 685–691, 2008.
[35] K. K. Leung et al., “Brain MAPS: an automated, accurate and ro-bust brain extraction technique using a template library,” NeuroImage,vol. 55, no. 3, pp. 1091–1108, 2011.
[36] D. Rueckert et al., “Nonrigid registration using free-form deformations:application to breast MR images,” IEEE Transactions on MedicalImaging, vol. 18, no. 8, pp. 712–721, 1999.
[37] L. G. Nyu and J. K. Udupa, “On standardizing the MR image intensityscale,” Magnetic Resonance in Medicine, vol. 42, no. 6, pp. 1072–1081,1999.
[38] R. Tibshirani, “Regression shrinkage and selection via the lasso,” Jour-nal of the Royal Statistical Society, pp. 267–288, 1996.
[39] X. Zhu et al., “A novel matrix-similarity based loss function for jointregression and classification in AD diagnosis,” NeuroImage, vol. 100,pp. 91–105, 2014.
[40] X. Zhu, H.-I. Suk et al., “Subspace regularized sparse multi-tasklearning for multi-class neurodegenerative disease identification,” IEEEtransaction on biomedical engineering, 2015, in press.
[41] H. Zou and T. Hastie, “Regularization and variable selection via theelastic net,” Journal of the Royal Statistical Society, vol. 67, no. 2, pp.301–320, 2005.
[42] N. Kriegeskorte et al., “Circular analysis in systems neuroscience: thedangers of double dipping,” Nature neuroscience, vol. 12, no. 5, pp.535–540, 2009.
[43] G. Wu et al., “A generative probability model of joint label fusion formulti-atlas based brain segmentation,” Medical Image Analysis, vol. 18,no. 6, pp. 881–890, 2014.
[44] T. Tong et al., “Segmentation of MR images via discriminative dictio-nary learning and sparse coding: Application to hippocampus labeling,”NeuroImage, vol. 76, pp. 11–23, 2013.
[45] J. Mairal et al., “Online dictionary learning for sparse coding,” inInternational Conference on Machine Learning, 2009, pp. 689–696.
[46] J. D. Storey, “The positive false discovery rate: a Bayesian interpretationand the q-value,” Annals of statistics, pp. 2013–2035, 2003.
[47] C. Ledig et al., “Alzheimer’s disease state classification using structuralvolumetry, cortical thickness and intensity features,” MICCAI challengeon computer-aided diagnosis of dementia, pp. 55–64, 2014.
[48] R. Desikan et al., “MRI measures of temporoparietal regions showdifferential rates of atrophy during prodromal AD,” Neurology, vol. 71,no. 11, pp. 819–825, 2008.
[49] R. I. Scahill et al., “A longitudinal study of brain volume changesin normal aging using serial registered magnetic resonance imaging,”Archives of neurology, vol. 60, no. 7, pp. 989–994, 2003.
[50] N. C. Fox and J. M. Schott, “Imaging cerebral atrophy: normal ageingto Alzheimer’s disease,” The Lancet, vol. 363, no. 9406, pp. 392–394,2004.
[51] L. Ferrarini et al., “Morphological hippocampal markers for automateddetection of Alzheimer’s disease and mild cognitive impairment con-verters in magnetic resonance images,” Journal of Alzheimer’s Disease,vol. 17, no. 3, pp. 643–659, 2009.
[52] N. Singh et al., “Genetic, structural and functional imaging biomarkersfor early detection of conversion from MCI to AD,” in InternationalConference on MICCAI, 2012, pp. 132–140.
[53] A. Chincarini et al., “Local MRI analysis approach in the diagnosis ofearly and prodromal Alzheimer’s disease,” NeuroImage, vol. 58, no. 2,pp. 469–480, 2011.
[54] Y. Li et al., “Discriminant analysis of longitudinal cortical thicknesschanges in Alzheimer’s disease using dynamic and network features,”Neurobiology of Aging, vol. 33, no. 2, pp. 427.e15–427.e30, 2012.
[55] C.-Y. Wee et al., “Prediction of Alzheimer’s disease and mild cogni-tive impairment using cortical morphological patterns,” Human BrainMapping, vol. 34, no. 12, pp. 3411–3425, 2013.
[56] E. Adeli-Mosabbeb et al., “Robust feature-sample linear discriminantanalysis for brain disorders diagnosis,” in Advances in Neural Informa-tion Processing Systems, 2015, pp. 658–666.
[57] O. Querbes et al., “Early diagnosis of Alzheimer’s disease using corticalthickness: impact of cognitive reserve,” Brain, vol. 132, no. 8, pp. 2036–2047, 2009.
[58] C. Davatzikos et al., “Prediction of MCI to AD conversion, via MRI,CSF biomarkers, and pattern classification,” Neurobiology of Aging,vol. 32, no. 12, pp. 2322.e19–2322.e27, 2011.
[59] J. Koikkalainen et al., “Multi-template tensor-based morphometry: ap-plication to analysis of Alzheimer’s disease,” NeuroImage, vol. 56, no. 3,pp. 1134–1144, 2011.
[60] D. Zhang et al., “Predicting future clinical changes of MCI patientsusing longitudinal and multimodal biomarkers,” PloS one, vol. 7, no. 3,p. e33182, 2012.