Embed Size (px)
Citation preview

A Novel Method for Remotely Detecting Trace ExplosivesCharles M. Wynn, Stephen Palmacci, Roderick R. Kunz, and Mordechai Rothschild
Events in recent years have led to an
increased need for improvements in our
abilities to detect explosives. In numerous
situations, the capability to detect explosives
sensitively, accurately, and rapidly could have great benefit
to national security both at home and abroad. Some of the
homeland situations that would benefit from improve-
ments in explosives detection include screening passen-
gers and luggage at airports and other sensitive locations,
and screening vehicles and people along the perimeters of
high-value installations such as federal buildings. Abroad,
the improvised explosive device (IED) problem is clearly
in need of creative solutions to mitigate the devices’ very
damaging effects. Much research has been conducted to
help solve these problems; however, it is unlikely that any
one solution will suffice.
If we view the problem of explosive devices as a
timeline, from the initial planning to construction of the
devices and ultimately to their detonation, we can see
that it is preferable to detect the activities as early in the
process as possible. The term “left of boom” derives from
displaying the explosives creation-to-detonation timeline
from left to right and is sometimes used to refer to the
concept of early explosives detection. Figure 1 shows a
graphical representation of this process.
To address these concerns, we have begun several
efforts to both understand and help solve the difficult prob-
lem of explosives detection. In particular, we are focus-
ing on a solution for rapid and remote detection of trace
amounts of explosives, with the idea that such a capability
would significantly improve our ability to respond left of
boom. As we discuss later, bomb making is a messy process
The development of a technique with the ability to detect trace quantities of explosives at a distance is of critical importance. In numerous situations when explosive devices are prepared, transported, or otherwise handled, quantifiable amounts of the explosive material end up on surfaces. Rapid detection of these chemical residues in a noninvasive standoff manner would serve as an indicator for attempts at concealed assembly or transport of explosive materials and devices. We are investigating the use of a fluorescence-based technique to achieve the necessary detection sensitivity.
»

A NOVEL METHOD FOR REMOTELY DETECTING TRACE EXPLOSIVES
that leaves behind quantifiable residues on a variety of sur-
faces. Trace-detection techniques could thus be used foren-
sically, identifying devices and bomb-related activities,
such as assembly, earlier in the process and thus prevent-
ing the need for more difficult countermeasures later on.
To be practically useful, the technique must be rapid and
sensitive. Additionally, long-range capabilities that could
scan from distances of at least ten meters open up numer-
ous possibilities in which large areas of interest could be
rapidly assessed for indications of explosives activity. For
a brief explanation of the issues we face in trace detection
of various explosives, see the sidebar “Explosives and Their
Characteristics” on page 30.
We have been investigating a multistep technique in
which the first step is a dissociation of polyatomic materi-
als into diatomic molecules. The technique is known as
photodissociation followed by laser-induced fluorescence
(PD-LIF). The laser powers required for this technique are
significantly lower than those of some other methods, and
there is a good possibility of successful detection by using
eye-safe lasers. When nitro-bearing explosives are illumi-
nated with ultraviolet (UV) light within their absorption
band (see Figure 2) and of a sufficient intensity, the mol-
ecules dissociate (the PD step of PD-LIF), creating, among
other things, fragments of nitric oxide (NO). Identification
of this NO photofragment through laser-induced fluores-
cence (LIF) forms the basis of our detection technique. NO
(not to be confused with nitrous oxide, N2O) can be found
in smog. There is, however, a very important difference
between the NO produced in the dissociation of explosives
and that which can occur as a pollutant. The atmospheric
pollutant exists in its ground state, while the NO produced
in the photodissociation process is initially produced with
excess vibrational energy. This excess energy is extremely
significant in that it not only allows us to distinguish
explosives from smog, but also, as we show later, allows
us to devise a detection scheme that should be relatively
immune to many common types of optical clutter (see the
sidebar “Optical Clutter” on page 34).
We have performed extensive studies [1] of the
bomb-making process to determine the sensitivity levels
necessary for detecting microscopic explosives residues.
When explosive devices are prepared, transported, or
otherwise handled, quantifiable amounts of the explosive
material end up on both people and related surfaces. The
primary vectors of transport are the hands and feet of the
bomb makers and bomb handlers. Even when people do
not directly contact explosive material, they may trans-
fer quantifiable amounts of residue that they pick up via
secondary transfer. Such a transfer occurs when some-
one directly handling explosives touches a surface such
as a countertop or door handle, and then someone else
touches that surface. The second person will pick up a
quantifiable amount of explosives upon contact with the
surface and may then transfer it to additional surfaces.
We carefully quantified the amounts that were trans-
ferred to surfaces under a variety of conditions. These
surfaces, such as vehicles, luggage, clothing, walkways,
and doors, could potentially be used as early indicators
of activity. Although we identified large variability in the
amount of explosives residues transferred to surfaces,
in most instances, a majority of surfaces of interest had
quantities of at least 1 μg/cm2. We use this quantity as
a rough estimate of the required sensitivity for a foren-
FIGURE 1. The interest in detection of explosives is focused on the early timeline activities, including the planning stages, although after-action post-detonation evaluation could determine the detonation products for forensic pur-poses. After-action activities on the part of the perpetrators would include evaluating the effects of the explosion. CONOPS stands for concept of operations.
Obtainfunds
Developorganization
Gather andprovidematerials
Planattack
Performattacks
ImproviseCONOPS,tactics,devices
Evaluateafter-actionactivities
BOOM
CHARLES M. WYNN, STEPHEN PALMACCI, RODERICK R. KUNz, AND MORDECHAI ROTHSCHILD
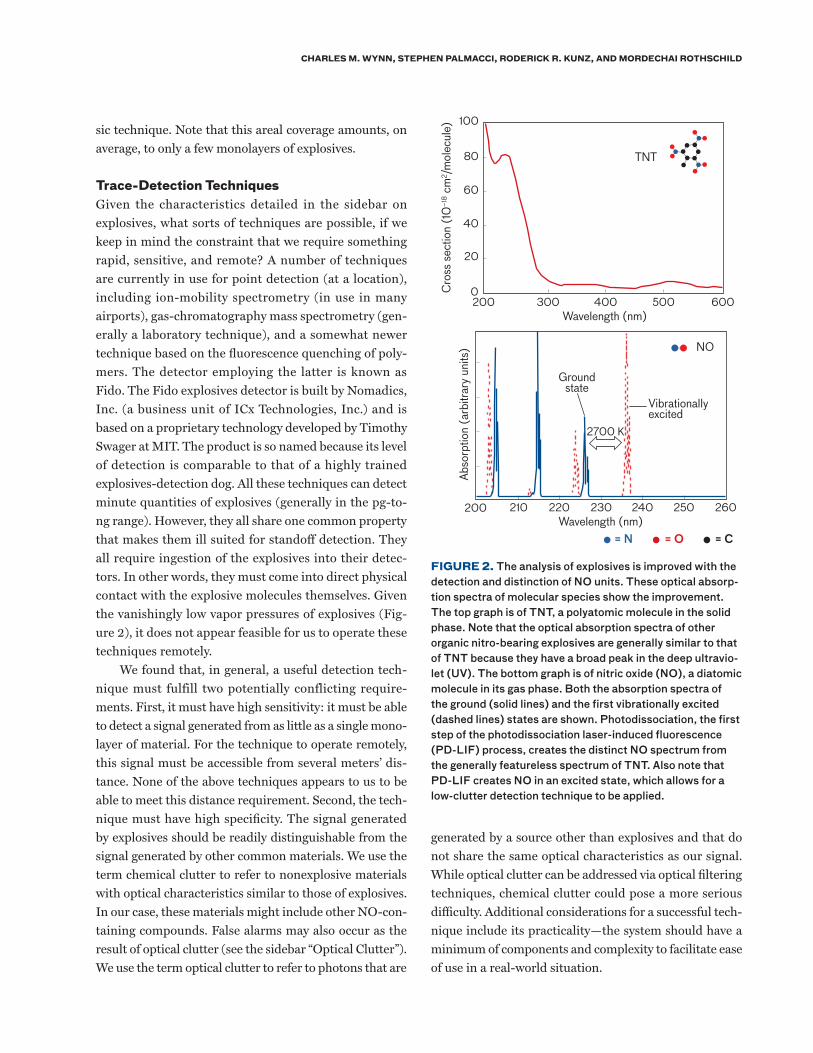
sic technique. Note that this areal coverage amounts, on
average, to only a few monolayers of explosives.
Trace-Detection TechniquesGiven the characteristics detailed in the sidebar on
explosives, what sorts of techniques are possible, if we
keep in mind the constraint that we require something
rapid, sensitive, and remote? A number of techniques
are currently in use for point detection (at a location),
including ion-mobility spectrometry (in use in many
airports), gas-chromatography mass spectrometry (gen-
erally a laboratory technique), and a somewhat newer
technique based on the fluorescence quenching of poly-
mers. The detector employing the latter is known as
Fido. The Fido explosives detector is built by Nomadics,
Inc. (a business unit of ICx Technologies, Inc.) and is
based on a proprietary technology developed by Timothy
Swager at MIT. The product is so named because its level
of detection is comparable to that of a highly trained
explosives-detection dog. All these techniques can detect
minute quantities of explosives (generally in the pg-to-
ng range). However, they all share one common property
that makes them ill suited for standoff detection. They
all require ingestion of the explosives into their detec-
tors. In other words, they must come into direct physical
contact with the explosive molecules themselves. Given
the vanishingly low vapor pressures of explosives (Fig-
ure 2), it does not appear feasible for us to operate these
techniques remotely.
We found that, in general, a useful detection tech-
nique must fulfill two potentially conflicting require-
ments. First, it must have high sensitivity: it must be able
to detect a signal generated from as little as a single mono-
layer of material. For the technique to operate remotely,
this signal must be accessible from several meters’ dis-
tance. None of the above techniques appears to us to be
able to meet this distance requirement. Second, the tech-
nique must have high specificity. The signal generated
by explosives should be readily distinguishable from the
signal generated by other common materials. We use the
term chemical clutter to refer to nonexplosive materials
with optical characteristics similar to those of explosives.
In our case, these materials might include other NO-con-
taining compounds. False alarms may also occur as the
result of optical clutter (see the sidebar “Optical Clutter”).
We use the term optical clutter to refer to photons that are
generated by a source other than explosives and that do
not share the same optical characteristics as our signal.
While optical clutter can be addressed via optical filtering
techniques, chemical clutter could pose a more serious
difficulty. Additional considerations for a successful tech-
nique include its practicality—the system should have a
minimum of components and complexity to facilitate ease
of use in a real-world situation.
200
0
20
40
300 400 500 600200Wavelength (nm)
Groundstate
Vibrationallyexcited
2700 KC
ross
sect
ion
(10
–18 c
m2 /m
olec
ule)
210 220 230 240 250 260Wavelength (nm)
Abso
rptio
n (a
rbitr
ary
units
)
60
80
100
TNT
= N = O = C
NO
FIGURE 2. The analysis of explosives is improved with the detection and distinction of NO units. These optical absorp-tion spectra of molecular species show the improvement. The top graph is of TNT, a polyatomic molecule in the solid phase. Note that the optical absorption spectra of other organic nitro-bearing explosives are generally similar to that of TNT because they have a broad peak in the deep ultravio-let (UV). The bottom graph is of nitric oxide (NO), a diatomic molecule in its gas phase. Both the absorption spectra of the ground (solid lines) and the first vibrationally excited (dashed lines) states are shown. Photodissociation, the first step of the photodissociation laser-induced fluorescence (PD-LIF) process, creates the distinct NO spectrum from the generally featureless spectrum of TNT. Also note that PD-LIF creates NO in an excited state, which allows for a low-clutter detection technique to be applied.
A NOVEL METHOD FOR REMOTELY DETECTING TRACE EXPLOSIVES
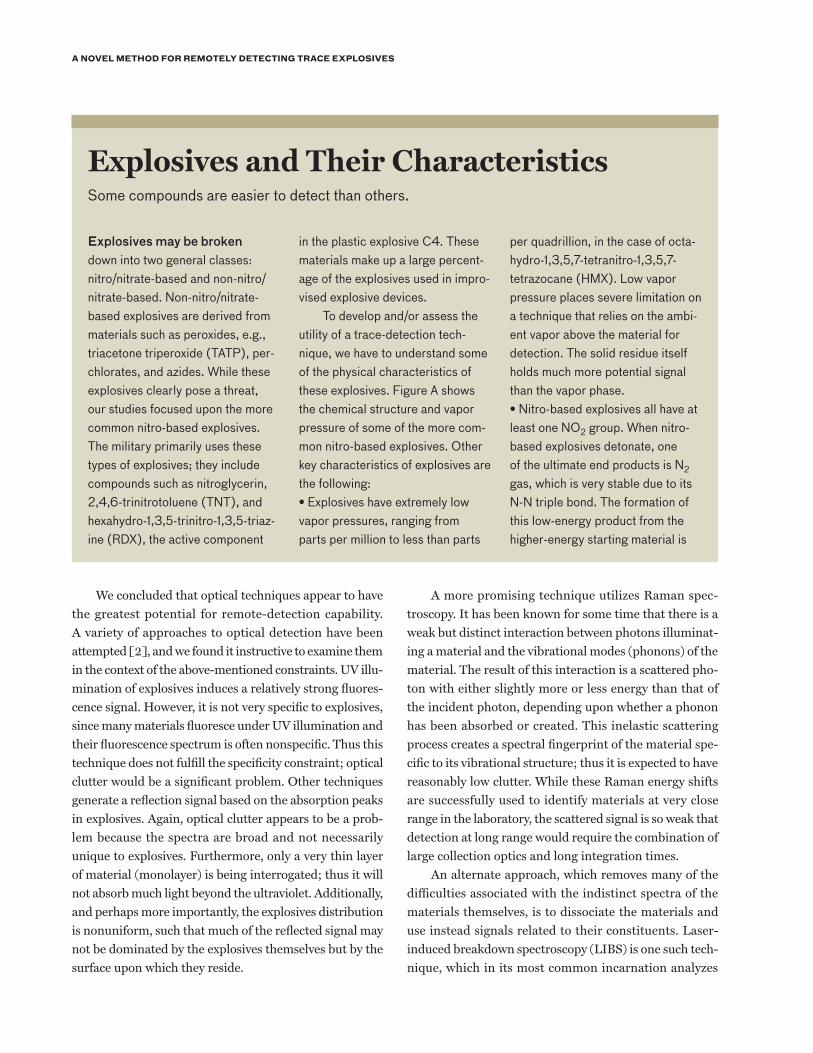
Explosives may be broken down into two general classes: nitro/nitrate-based and non-nitro/nitrate-based. Non-nitro/nitrate-based explosives are derived from materials such as peroxides, e.g., triacetone triperoxide (TATP), per-chlorates, and azides. While these explosives clearly pose a threat, our studies focused upon the more common nitro-based explosives. The military primarily uses these types of explosives; they include compounds such as nitroglycerin, 2,4,6-trinitrotoluene (TNT), and hexahydro-1,3,5-trinitro-1,3,5-triaz-ine (RDX), the active component
in the plastic explosive C4. These materials make up a large percent-age of the explosives used in impro-vised explosive devices.
To develop and/or assess the utility of a trace-detection tech-nique, we have to understand some of the physical characteristics of these explosives. Figure A shows the chemical structure and vapor pressure of some of the more com-mon nitro-based explosives. Other key characteristics of explosives are the following:• Explosives have extremely low vapor pressures, ranging from parts per million to less than parts
per quadrillion, in the case of octa-hydro-1,3,5,7-tetranitro-1,3,5,7-tetrazocane (HMX). Low vapor pressure places severe limitation on a technique that relies on the ambi-ent vapor above the material for detection. The solid residue itself holds much more potential signal than the vapor phase. • Nitro-based explosives all have at least one NO2 group. When nitro-based explosives detonate, one of the ultimate end products is N2 gas, which is very stable due to its N-N triple bond. The formation of this low-energy product from the higher-energy starting material is
Explosives and Their CharacteristicsSome compounds are easier to detect than others.
We concluded that optical techniques appear to have
the greatest potential for remote-detection capability.
A variety of approaches to optical detection have been
attempted [2], and we found it instructive to examine them
in the context of the above-mentioned constraints. UV illu-
mination of explosives induces a relatively strong fluores-
cence signal. However, it is not very specific to explosives,
since many materials fluoresce under UV illumination and
their fluorescence spectrum is often nonspecific. Thus this
technique does not fulfill the specificity constraint; optical
clutter would be a significant problem. Other techniques
generate a reflection signal based on the absorption peaks
in explosives. Again, optical clutter appears to be a prob-
lem because the spectra are broad and not necessarily
unique to explosives. Furthermore, only a very thin layer
of material (monolayer) is being interrogated; thus it will
not absorb much light beyond the ultraviolet. Additionally,
and perhaps more importantly, the explosives distribution
is nonuniform, such that much of the reflected signal may
not be dominated by the explosives themselves but by the
surface upon which they reside.
A more promising technique utilizes Raman spec-
troscopy. It has been known for some time that there is a
weak but distinct interaction between photons illuminat-
ing a material and the vibrational modes (phonons) of the
material. The result of this interaction is a scattered pho-
ton with either slightly more or less energy than that of
the incident photon, depending upon whether a phonon
has been absorbed or created. This inelastic scattering
process creates a spectral fingerprint of the material spe-
cific to its vibrational structure; thus it is expected to have
reasonably low clutter. While these Raman energy shifts
are successfully used to identify materials at very close
range in the laboratory, the scattered signal is so weak that
detection at long range would require the combination of
large collection optics and long integration times.
An alternate approach, which removes many of the
difficulties associated with the indistinct spectra of the
materials themselves, is to dissociate the materials and
use instead signals related to their constituents. Laser-
induced breakdown spectroscopy (LIBS) is one such tech-
nique, which in its most common incarnation analyzes

CHARLES M. WYNN, STEPHEN PALMACCI, RODERICK R. KUNz, AND MORDECHAI ROTHSCHILD
accompanied by the release of a sizable amount of energy. Note that inorganic nitrate-based explo-sives have NO3 groups instead of NO2 groups (ammonium-nitrate fuel oil is one such example). Our initial work focused on organic materials that contain NO2 groups.• The explosives residues relating to bomb activities can be, on aver-age, only a few monolayers thick. However, they are nonuniform, taking the form of mounds or clumps at the microscopic level. This nonuniformity means that some percentage of a surface of interest may be bare, containing no explosive material at all.• The optical absorption spec-trum (Figure 2 in the main text) of nitro-bearing explosives is
broad and nondistinct. There is a broad absorption peak in the ultra-violet (UV), and the explosives will fluoresce in the visible as a result of UV illumination.
REFERENCES
a. National Research Council, Existing and Potential Standoff Explosives Detection Techniques (The National Academies Press, Washington, D.C., 2004).
b. J. Steinfeld and J. Wormhoudt, “Explosives Detection: A Challenge for Physical Chemistry,” Ann. Rev. Phys. Chem., vol. 49, 1998, pp. 203–232.
FIGURE A. The vapor pressures of some nitro-bearing explosives are quite low and span orders of magnitude, indicating the dif-ficulties of trace detection of vapors [a, b]. TNT is 2,4,6-trinitrotoluene, RDX is hexa-hydro-1,3,5-trinitro-1,3,5-triazine, PETN is pentaerythritol tetranitrate, and HMX is octa-hydro-1,3,5,7-tetranitro-1,3,5,7-tetrazocane.
10–12
10–15
10–9
10–6
Rela
tive
conc
entra
tion
in a
ir
Nitroglycerin
TNT
PETNRDX (C4)
HMX
Common feature:NO2
= N = O = C
the atomic constituents. LIBS uses tightly focused, high-
energy laser pulses to dissociate the materials into their
constituent atoms via the formation of a microplasma.
The atomic emission spectra allow identification of the
atoms and estimation of their relative abundances. A
nitrogen/oxygen ratio consistent with explosives is used
as an indicator of the presence of a specific explosive.
While the LIBS signal is strong, the relative ratios can be
easily obscured by the existence of other nitrogen and/or
oxygen-bearing materials present on surfaces. In other
words, LIBS is highly susceptible to clutter [3, 4]. In
addition, there is the disadvantage of using high-intensity
lasers that aren’t eye safe.
Photodissociation Followed by Laser-Induced FluorescencePD-LIF is a dissociation-based technique in which the
polyatomic materials are dissociated into diatomic mol-
ecules, as opposed to the atoms produced via LIBS. The
laser powers required for the PD-LIF process are sig-
nificantly lower than those of LIBS, and there is a good
possibility (as we discuss later) that successful detection
can occur if eye-safe lasers are used (again in contrast to
LIBS). When nitro-bearing explosives are illuminated
with UV light within their absorption band (see Figure
2) and of a sufficient intensity, the molecules dissociate
and create, among other things, fragments of NO. Identi-
fication of this NO photofragment forms the basis of our
detection technique. As mentioned earlier, the NO prod-
uct of PD has excess vibrational energy when compared
to the potential chemical-clutter components of NO in
smog, for example.
An additional advantage of having produced the NO
molecule via photodissociation is that we are now deal-
ing with a gas-phase diatomic molecule (as compared to
a solid-phase polyatomic molecule), which has a much
more distinct spectrum that can be used as an identify-
ing fingerprint. The lower portion of Figure 2 displays
the absorption spectrum of NO. Note the distinct lines, as
compared to the broad spectrum of 2,4,6-trinitrotoluene
(TNT). Also note the different spectra for the ground and
excited states of the molecule. As can be seen from the

A NOVEL METHOD FOR REMOTELY DETECTING TRACE EXPLOSIVES
figure, the energy difference between the two is ~2700 K:
thus the excited state is not occupied under standard
ambient temperatures. In PD-LIF, detection of the vibra-
tionally excited NO is achieved via laser-induced fluores-
cence. Here, a photon further pumps the vibrationally
excited NO fragment into an electronically excited state.
The electronically excited NO molecules rapidly fluoresce
as they return to their ground states. Because of the initial
excess of vibrational energy, this fluorescence occurs at a
shorter wavelength (226 nm)—i.e., higher energy—than
the exciting laser photons (236.2 nm). Signal photons that
are of shorter wavelengths, or shifted toward the blue end
of the spectrum relative to the laser photons, are critical
to minimizing optical clutter. A schematic of this multi-
step (photodissociation/vaporization—photoexcitation—
fluorescence) detection process is shown in Figure 3. In
brief the steps are the following:
1. The first photon is absorbed by the explosives
and very rapidly (<<1 ns) vaporizes and dissoci-
ates the explosives’ components into fragments
including the vibrationally excited NO.
2. A second photon pumps the vibrationally
excited NO to an electronically excited state.
This pumping must happen within a few ns,
which is the lifetime of the vibrationally excited
state in a standard atmosphere.
3. The resulting NO fluorescence, which occurs
at a shorter wavelength than that of the laser, is
used for detection.
Note that all these steps occur within a single laser
pulse. The exquisite specificity of this technique derives
from the precise wavelengths involved in the LIF process.
It is highly unlikely that many other materials will pro-
duce photons at precisely 226 nm in response to illumi-
nation at precisely 236 nm, since few will share the exact
spectral structure of the excited NO. Thus we can utilize
a narrow-wavelength source and a narrowband detec-
tor to specifically detect these NO fragments with a high
degree of sensitivity and specificity. We note also that it is
fortuitous that the nitro-bearing explosives absorb quite
well at the UV wavelength needed to pump NO. Because
of this absorption, we can accomplish the multiphoton
process with a single laser pulse, significantly simplifying
the necessary equipment.
Advantages of this detection method include a rela-
tively strong fluorescence signal—which can be gener-
ated by using eye-safe excitation-laser intensities—and a
low false-alarm rate. The low false-alarm rate is expected
because relatively few processes produce light at shorter
wavelengths than the source laser. In contrast, most other
Pulsed UV laser2
1
2
226 nmVibrationallyexcited
nitric oxide Internuclear distance
S 2Σ
X 2Π
Explosives residue(nitro-bearing)
Electronicstates
Ener
gy Vibr
atio
nal
leve
ls
33
236.2 nm
= N = O = C
1. Vaporize andphotodissociate
solid explosive �� h��� excited NO vapor
3. Detect higher-energyphotons
Eliminates red-shiftedfluorescence clutter
Photo-detector
2. Optically pump NO(same laser pulse as step 1)
FIGURE 3. The PD-LIF explosives-detection technique can be understood as a three-step process. In the first step, a mate-rial with a distinct signature is created by vaporizing and dissociating solid explosives and forming gaseous NO fragments. In the second step, these fragments are optically pumped to a higher-energy state. Finally, the higher-energy fluorescence emis-sion is detected. The wavelength of the fluorescence and the wavelength required to induce fluorescence are both very pre-cise, which provides the specificity of the technique.

CHARLES M. WYNN, STEPHEN PALMACCI, RODERICK R. KUNz, AND MORDECHAI ROTHSCHILD
processes, such as scattering or traditional fluorescence,
are single-photon processes in which each incident pho-
ton yields another of equal or lesser energy. The PD-LIF
process involves multiple photons, the first of which
creates a molecule with excess energy and the second
of which further excites that molecule. As the molecule
relaxes to its ground state (see Figure 3), photons are
emitted with greater energy than that of the incident
photons. As such, this technique isn’t susceptible to false
alarms from traditional fluorescence processes, for which
the resultant photons typically are at longer wavelengths.
The sidebar on optical clutter shows how these higher-
energy emitted photons are distinguishable from typi-
cal fluorescence coming from the surfaces on which the
explosives reside.
PD-LIF Detection MeasurementsPrevious studies by others [5] have examined the PD-LIF
signature from explosives vapors. We, however, probed the
solid and liquid explosives themselves [6, 7] as they offer
the potential for much greater signal, since the vapor pres-
sure of explosives is very low. The four main components
in single-laser PD-LIF laboratory experiments shown in
Figure 4 are the excitation laser, the photodetector, the
bandpass optical filters, and the samples being tested. In
our studies, the laser was a tunable pulsed Continuum
9030 system, which provides variable laser output from
215 to 310 nm. The laser output was an ~1 cm2 beam of
7 ns pulses, emitted at a rate of 30 pulses per second, with
energies of 2 to 3 mJ per pulse. The spectral linewidth was
0.03 to 0.04 nm around the wavelengths of interest. All
wavelengths reported are the values in air (approximately
0.03% less than the wavelengths in a vacuum).
The fluorescence detection subsystem consisted of
a solar-blind (tuned to eliminate the background solar
radiation) photomultiplier tube (PMT) with narrowband
filters. Narrowband filters are essential in these experi-
ments because they are needed to suppress the scattered
laser light. The Perkin Elmer cesium-tellurium channel
photomultiplier had single-photon sensitivity, negligible
dark counts, and a quantum efficiency of 10% near the
signals of interest (220 to 230 nm). The PMT was used
in both a photon-counting and linear mode (dependent
upon photon flux) and was calibrated for short laser
pulses at various cathode voltages in order to ensure a
linear response at a given flux level. Experiments were
performed primarily in a close-range geometry, so that
the PMT and filters were positioned 6 cm directly above
the sample. No collection or collimation optics were used
in the close-range configuration. In this geometry, we
estimate a collection efficiency of 4 × 10⁻⁷ of all emitted
signal photons.
A variety of explosives in a variety of morphologies
were studied. The explosives included 2,6-dinitrotoluene
(DNT), TNT, pentaerythritol tetranitrate (PETN), and
hexahydro-1,3,5-trinitro-1,3,5-triazine (RDX). DNT, as
received from Sigma-Aldrich, was in the form of small
granules roughly the size of salt crystals. Studies were
performed on macroscopic mounds (several milligrams)
Pulsed UV laser
Photodetector
Optical filter
TNT residueon sand
FIGURE 4. The four primary components of the experi-mental detection setup are shown: the pulsed UV laser, the high-rejection optical filters (which are normally attached directly to the photodetector and allow only signal photons to reach the detector while blocking the scattered laser pho-tons), the photomultiplier tube photodetector, and the sam-ple being tested (here it is sand covered with traces of TNT).

A NOVEL METHOD FOR REMOTELY DETECTING TRACE EXPLOSIVES
of these solid granules, in addition to a liquid form, which
was obtained by heating the granules to 80°C. With the
exception of the liquid DNT measurements, all other
measurements were performed at room temperature
under ambient atmospheric conditions. Military-grade
TNT was studied in a solid pellet form, as a trace coat-
ing on sand, and dropcast from a dilute acetone solution.
Military-grade PETN was studied in the form of a white
powder. RDX was studied both as a trace coating on sand
(8% by weight) and as the dominant component (~90%)
in the putty-like C4 plastic explosive.
Figure 5 displays the results of fluorescence detec-
tion measurements of DNT, TNT, C4 (RDX is the active
component), and PETN. Data were taken at a fluence
of 10 mJ/cm2/pulse (1-mJ pulses over 0.1-cm2 area).
Data points represent 6-pulse averages, with the excep-
tion of the background measurements on the bare silica
substrate (shown as the open squares in the top graph)
for which the data points are 60-pulse averages. All
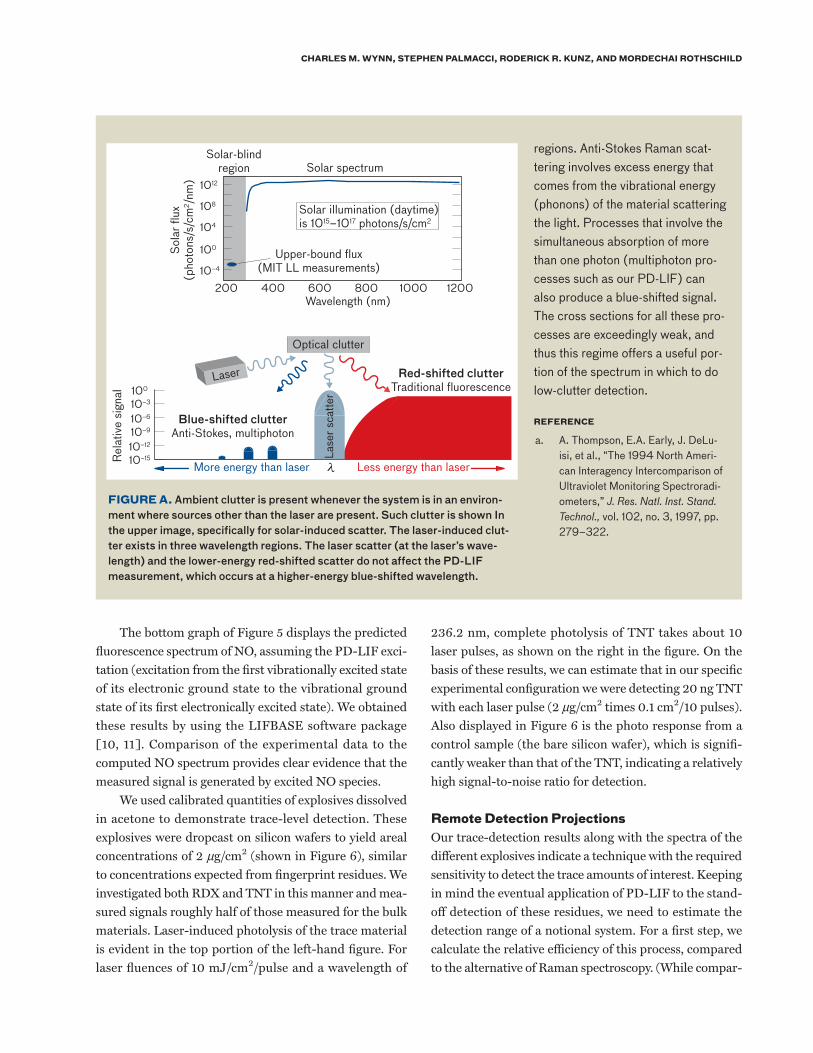
Detection of spurious radia-tion, or optical clutter, causes an increase in false-alarm rates. Potential sources of optical clut-ter can be either ambient or laser-induced radiation, as shown in Figure A.
Ambient Clutter. While solar radiation is a dominant source of clutter in the visible and near infra-red, and thermal radiation can be problematical in the infrared, the deep ultraviolet (UV) is quite clutter free. Below approximately 300 nm (the solar-blind region), the absorp-tion due to atmospheric ozone pre-vents almost any light from reaching the surface of the earth [a]. This
fact opens up the possibility of operation of a detection system that relies upon a very small num-ber of signal photons (perhaps as few as one) for detection. The PD-LIF detection system we are pursuing operates in the deep UV and thus aims to utilize just such single photons.
Laser-Induced Clutter. Laser-induced clutter can be sub-divided into three broad spectral categories: laser scatter, i.e., pho-tons at the laser wavelength; red-shifted clutter (photons with less energy and longer wavelengths than the laser); and blue-shifted clutter (photons with more energy
and shorter wavelengths than the laser). Generally, the scattered photons (at the laser wavelength) are the strongest source of clutter. Fluorescence processes (the domi-nant form of red-shifted clutter) can yield signals as strong as ~10% of the laser scatter, depending on the material and wavelengths chosen. Note that many materials fluoresce when irradiated with UV light (just visit your local roller rink). Photons that are created with more energy than the energy of incident photons are quite rare because they require the addition of excess energy. Thus blue-shifted clutter is much weaker than in either of the other two
Optical ClutterReduce the effects of clutter on false-alarm rates by taking measurements where spurious fluorescence isn’t.
explosives samples display the same multipeak struc-
ture with a maximum signal at the excitation wavelength
of 236.2 nm and a shoulder near 236.3 nm. They also
display a secondary peak at 236.9 nm, again with an
accompanying shoulder.
The similarity of these signatures implies that all
nitro-bearing explosives can be detected via this tech-
nique without the need to fine-tune the laser parameters
to each individual explosive type. The vapor pressures
for these compounds differ significantly—by over four
orders of magnitude at room temperature—while their
signal strengths are within one order of magnitude. These
measurements indicate that the observed signal is not
related to the ambient vapors of the materials, but rather
the condensed phase itself. This is an important point in
our consideration of solid-phase analysis: a technique
that relies upon detection of the ambient vapors of the
explosives will be severely limited due to their very low
vapor pressures [8, 9].
CHARLES M. WYNN, STEPHEN PALMACCI, RODERICK R. KUNz, AND MORDECHAI ROTHSCHILD
236.2 nm, complete photolysis of TNT takes about 10
laser pulses, as shown on the right in the figure. On the
basis of these results, we can estimate that in our specific
experimental configuration we were detecting 20 ng TNT
with each laser pulse (2 μg/cm2 times 0.1 cm2/10 pulses).
Also displayed in Figure 6 is the photo response from a
control sample (the bare silicon wafer), which is signifi-
cantly weaker than that of the TNT, indicating a relatively
high signal-to-noise ratio for detection.
Remote Detection ProjectionsOur trace-detection results along with the spectra of the
different explosives indicate a technique with the required
sensitivity to detect the trace amounts of interest. Keeping
in mind the eventual application of PD-LIF to the stand-
off detection of these residues, we need to estimate the
detection range of a notional system. For a first step, we
calculate the relative efficiency of this process, compared
to the alternative of Raman spectroscopy. (While compar-
regions. Anti-Stokes Raman scat-tering involves excess energy that comes from the vibrational energy (phonons) of the material scattering the light. Processes that involve the simultaneous absorption of more than one photon (multiphoton pro-cesses such as our PD-LIF) can also produce a blue-shifted signal. The cross sections for all these pro-cesses are exceedingly weak, and thus this regime offers a useful por-tion of the spectrum in which to do low-clutter detection.
REFERENCE
a. A. Thompson, E.A. Early, J. DeLu-isi, et al., “The 1994 North Ameri-can Interagency Intercomparison of Ultraviolet Monitoring Spectroradi-ometers,” J. Res. Natl. Inst. Stand. Technol., vol. 102, no. 3, 1997, pp. 279–322.
FIGURE A. Ambient clutter is present whenever the system is in an environ-ment where sources other than the laser are present. Such clutter is shown In the upper image, specifically for solar-induced scatter. The laser-induced clut-ter exists in three wavelength regions. The laser scatter (at the laser’s wave-length) and the lower-energy red-shifted scatter do not affect the PD-LIF measurement, which occurs at a higher-energy blue-shifted wavelength.
Solar spectrum
Solar illumination (daytime) is 1015–1017 photons/s/cm2
Sola
r flu
x(p
hoto
ns/s
/cm
2 /nm
)
100
10–4
108
104
1012
Wavelength (nm)200 1200800600 1000400
Solar-blindregion
Upper-bound flux(MIT LL measurements)
Rela
tive
signa
l
Optical clutter
100
10–15
10–910–6
10–12
10–3
Blue-shifted clutterAnti-Stokes, multiphoton
Lase
r sca
tter
More energy than laser Less energy than laserλ
Laser Red-shifted clutterTraditional fluorescence
The bottom graph of Figure 5 displays the predicted
fluorescence spectrum of NO, assuming the PD-LIF exci-
tation (excitation from the first vibrationally excited state
of its electronic ground state to the vibrational ground
state of its first electronically excited state). We obtained
these results by using the LIFBASE software package
[10, 11]. Comparison of the experimental data to the
computed NO spectrum provides clear evidence that the
measured signal is generated by excited NO species.
We used calibrated quantities of explosives dissolved
in acetone to demonstrate trace-level detection. These
explosives were dropcast on silicon wafers to yield areal
concentrations of 2 μg/cm2 (shown in Figure 6), similar
to concentrations expected from fingerprint residues. We
investigated both RDX and TNT in this manner and mea-
sured signals roughly half of those measured for the bulk
materials. Laser-induced photolysis of the trace material
is evident in the top portion of the left-hand figure. For
laser fluences of 10 mJ/cm2/pulse and a wavelength of

A NOVEL METHOD FOR REMOTELY DETECTING TRACE EXPLOSIVES
ison to LIBS is also possible, PD-LIF and Raman-based
detection have in principle similar low false-alarm rates.)
The Raman cross section for TNT has been reported as
2 × 10–31 cm2/sr/molecule for visible excitation and 10–28
cm2/sr/molecule for ultraviolet resonant excitation, and
therefore the angle-integrated values are 2.5 × 10⁻³⁰ cm2/
molecule and 10–27 cm2/molecule, respectively [12, 13].
The spontaneous Raman scattering process is linear in
fluence, and therefore the cross section is a constant. In
contrast, the PD-LIF is nonlinear in fluence because it is
a multiphoton process. A cross section will therefore be
fluence dependent. Furthermore, it will be an effective
parameter rather than a true molecular property.
By analogy to a linear process such as Raman scatter-
ing, the number of fluorescence photons collected in our
experimental setup, Nphoton, can be expressed as follows:
N Fnphoton eff= σ η ,
where F is the laser fluence (in photons per unit area), n is
the number of molecules being irradiated, σeff is the effec-
tive cross section of the overall PD-LIF process, and η is
the experimental collection efficiency. We have estimated
the PD-LIF cross section, σeff, on the basis of our dropcast
results at a fluence F = 10 mJ/cm2/pulse (1.25 × 10¹⁶ pho-
tons/cm2). At this fluence, we collect Nphoton ~10 photons/
pulse. We can estimate the number of irradiated mole-
cules, n, by using the areal density of the dropcast TNT
(2 μg/cm2), the laser spot size (0.1 cm2), and the molecu-
lar weight of TNT (227 g/mole).
Given that ~10 laser pulses were required to fully pho-
tolyze the film, and that the total number of molecules in
the film was 5 × 10¹⁴, we estimate that n = 5 × 10¹³ mol-
ecules/pulse were irradiated. Note that the average thick-
ness of the dropcast TNT is ~12 nm (the density of TNT is
1.65 g/cm3), similar to our measured photolysis rate per
pulse. However, we observed experimentally that 10 pulses
were required to photolyze the film, rather than one pulse,
as may be indicated by the average film thickness. These
results are reconciled by noting, as is evident from optical
images of the films, that the films are not uniform. Rather,
they consist of islands of different sizes and, presumably,
thicknesses. Using our collection efficiency of η = 4 × 10⁻⁷,
we calculate σeff = 4 × 10–23 cm2/molecule for TNT at
10 mJ/cm2/pulse fluence. This is a factor of 4 × 10⁴ higher
than that achievable with Raman scattering in the opti-
0.0
0.5
1
2
0
4
8
12
0
1.0
235
NOfluorescence
PETN (solid)
C4 (solid)
TNT (solid)
DNT (liquid)
236 237 238Pump laser wavelength (nm)
Sign
al (a
rbitr
ary u
nits)
Sign
al at
226
nm
(p
hoto
ns/p
ulse)
4
8
12
0
0
5
10
15
20
25
Sign
al at
226
nm
(p
hoto
ns/p
ulse)
Sign
al at
226
nm
(p
hoto
ns/p
ulse)
Sign
al at
226
nm
(p
hoto
ns/p
ulse)
FIGURE 5. The response of NO-based materials to pump laser wavelength is selective. The shifted peaks and shoul-ders show a marked response to the NO first excited state. The top graph also includes a background measurement of the response of the silica substrate without explosives (open squares). The bottom graph is the predicted fluorescence of NO, assuming excitation from its first vibrationally excited state. Note that the emission from these materials is actu-ally at the higher-energy blue-shifted 226 nm wavelength.

CHARLES M. WYNN, STEPHEN PALMACCI, RODERICK R. KUNz, AND MORDECHAI ROTHSCHILD
mal condition of UV excitation, and ~107 higher than that
of the more conventional visible/near-IR Raman scatter-
ing. Making the simplifying assumption that the number
of molecules probed via PD-LIF is fixed at n = 5 × 10¹³
molecules/pulse, we use our data at other fluences to esti-
mate the fluence dependence of σeff . This dependence is
compared to the Raman cross section, which remains fixed
with fluence, in Figure 7. As can be seen in the figure, PD-
LIF compares favorably with Raman scattering as a process
enabling standoff detection of TNT and other nitro-bearing
explosives. Using these estimates for the PD-LIF cross sec-
tion, we estimate that it will be feasible to achieve detection
of trace levels of explosives with a single pulse of eye-safe
UV illumination at distances of tens of meters.
Future WorkTo achieve these detection ranges (tens of meters) would
require ~30 cm optics and a laser capable of producing
at least 5 mJ pulses of light at 236.2 nm. While the laser
used in our laboratory measurements produces nearly
these pulse energies, it has several drawbacks. Its pulse
repetition rate is low (30 Hz), which makes rapid area
scanning impossible. It is also large and requires signifi-
cant input power. Moreover, it requires precise alignment
and as such is not robust enough for low-maintenance
field measurements. Finally, its bandwidth (0.03 nm) is
not well matched to the explosives signal peak (~0.5 nm;
see Figure 5).
John Zayhowski of Lincoln Laboratory’s Laser Tech-
nology and Applications Group has developed a design
for a solid-state laser that would meet all these specifi-
FIGURE 7. The TNT effective cross sections as a function of fluence for PD-LIF (squares) clearly outperform Raman-detection cross sections [14, 15], whose UV upper and infra-red lower bounds are denoted by dashed lines. Note that PD-LIF cross-section estimates assume that the number of particles probed per pulse was constant with fluence, and equal to the measured value at 10 mJ/cm2.
10 20 30Fluence (mJ/cm2)
Cro
ss se
ctio
n (c
m2 /m
olec
ule)
25
IR
UV
Raman
PD-LIF
155010–30
10–29
10–28
10–27
10–26
10–25
10–24
10–23
10–22
FIGURE 6. Dropcast TNT was analyzed to determine the trace-detection levels available with PD-LIF. On the left is a photo image of dropcast TNT on a silicon wafer with the laser spot (causing photolysis) labeled. On the right are time-series data displaying signal photons as a function of laser pulse (the top curve for TNT is offset for clarity from the bottom bare silicon).
00
5
10
TNT
Bare silicon wafer
10 20 30 40 50 60Pulse number
Sign
al a
t 226
nm
(arb
itrar
y un
its)
15
20
Laser ablation
1 cm

A NOVEL METHOD FOR REMOTELY DETECTING TRACE EXPLOSIVES
cal clutter, extensive studies are required to verify a low
false-alarm rate for a wide variety of substrates. Thus
our continued efforts are twofold: testing the new equip-
ment for standoff distance capabilities and evaluating
the specificity of the technique with other materials and
substrates to eliminate or at least significantly reduce the
false-alarm rate.
AcknowledgmentsWe thank John Zayhowski for his efforts in design-
ing the next-generation laser necessary to continue
this work in increasing the detection range. His
efforts stand out as a vital component for our future
research. This work was sponsored under the auspices
of the Lincoln Laboratory National Technology and
Industrial Base Program. n
cations. It would not only be more robust, smaller, and
lower power than the commercial system, but it would
also facilitate rapid area scanning and improve the sys-
tem’s signal-to-noise ratio (via a 0.5 nm laser bandwidth
matched to the explosives’ signal bandwidth). We have
identified the necessary crystal family and completed pre-
liminary fluorescence studies. These efforts should pro-
vide us with a stable high-power 236.2 nm laser source
capable of the desired high standoff distances. On the
basis of our examination of some nitrate-bearing materi-
als (fertilizer, soil, and manure), which showed no evi-
dence of a PD-LIF signal, we expect that there will be few
false alarms generated by other materials—i.e., we do not
expect nitrates to be a source of chemical clutter.
Although our initial work does not indicate the pres-
ence of significant sources of false alarms due to chemi-
CHARLES M. WYNN, STEPHEN PALMACCI, RODERICK R. KUNz, AND MORDECHAI ROTHSCHILD
REFERENCES
1. R. Kunz, J.D. Hybl, J.D. Pitts, M. Switkes, R. Herzig-Marx, F.L. Leibowitz, L. Williams, and D.R. Worsnop, private com-munication.
2. D.S. Moore, “Instrumentation for Trace Detection of High Explosives,” Rev. Sci. Instr., vol. 75, no. 8, 2004, pp. 2499–2512.
3. Kunz, private communication.4. Moore, “Instrumentation for Trace Detection.”5. T. Arusi-Parpar, D. Heflinger, and R. Lavi, “Photodissocia-
tion Followed by Laser-Induced Fluorescence at Atmo-spheric Pressure and 20° C: A Unique Scheme for Remote Detection of Explosives,” Appl. Opt., vol. 40, no. 36, 2001, pp. 6677–6681.
6. C.M. Wynn, S. Palmacci, R.R. Kunz, et al., “Experimental Demonstration of Remote Optical Detection of Trace Explo-sives,” Proc. SPIE, vol. 6954, 2008, 695407.
7. C.M. Wynn, S. Palmacci, R.R. Kunz, K. Clow, and M. Roth-schild, “Detection of Condensed-Phase Explosives via Laser-Induced Vaporization, Photodissociation and Resonant Excitation,” Appl. Opt., vol. 37, no. 31, 2008, pp. 5767-5776.
8. Wynn, “Experimental Demonstration.”9. Wynn, “Detection of Condensed-Phase Explosives.” 10. J. Luque and D.R. Crosley, “LIFBASE: Database and Spectral
Simulation Program,” SRI International Report MP 99-009 (1999).
11. J. Luque and D.R. Crosley, “Transition Probabilities and Electronic Transition Moments of the A 2Σ+–X 2Π and D 2Σ+–X 2Π Systems of Nitric Oxide,” J. Chem. Phys., vol. 111, no. 16, 1999, pp. 7405–7415.
12. L. Nagli and M. Gaft, “Raman Scattering Spectroscopy for Explosives Identification,” Proc. SPIE, vol. 6552, 2007, 65520Z.
13. L. Nagli, M. Gaft, Y. Fleger, and M. Rosenbluh, “Absolute Raman Cross-Section of Some Explosives: Trend to UV,” Opt. Mater., vol. 30, no. 11, 2008, pp. 1747–1754.
14. Nagli, “Raman Scattering Spectroscopy.”15. Nagli, “Absolute Raman Cross-Section.”
AbOUT THE AUTHORS
Charles M. Wynn is a technical staff member in the Submicrometer Technology Group, where he is working on laser-based trace detection techniques. He joined Lincoln Laboratory in 2000. He earned bachelor’s, master’s, and doctoral degrees in physics from the University of Connecti-cut, Carnegie Mellon University, and Clark University, respectively.
Stephen Palmacci is an assistant staff member in the Submicrometer Technology Group. He has worked for more than 35 years on laser-based research at Spectra Physics Laser Analytics division and Lin-coln Laboratory.
Roderick R. Kunz is a senior staff mem-ber in the Submicrometer Technology Group. His current focus is on the analysis and implementation of sensors for chemi-cal and explosives defense and threat signature phenomenology. He received his bachelor’s degree in chemistry from Rensselaer Polytechnic Institute and his doctoral degree in chemistry from the Uni-versity of North Carolina at Chapel Hill.
Mordechai Rothschild is the leader of the Submicrometer Technology Group. His interests are in standoff chemical sensing, microelectronics, optical lithography, and nanophotonics. He received a bachelor’s degree in physics from Bar-Ilan University in Israel and a doctoral degree in optics from the University of Rochester.