Embed Size (px)
Citation preview
A Novel Method for Visualization of Entire Coronary Arterial Tree
THOMAS WISCHGOLL,1 JOERG MEYER,2 BENJAMIN KAIMOVITZ,3 YORAM LANIR,3 and GHASSAN S. KASSAB4,5,6
1Department of Computer Science and Engineering, Wright State University, Dayton, OH, USA; 2Department of BiomedicalEngineering, University of California, Irvine, CA, USA; 3Department of Biomedical Engineering, Technion-Israel Institute ofTechnology, Haifa, Israel; 4Department of Biomedical Engineering, Indiana-Purdue University, Indianapolis, IN 46202, USA;5Department of Surgery, Indiana-Purdue University, Indianapolis, IN 46202, USA; and 6Department of Cellular and Integrative
Physiology, Indiana-Purdue University, Indianapolis, IN 46202, USA
(Received 6 April 2006; accepted 1 February 2007)
Abstract—The complexity of the coronary circulation espe-cially in the deep layers largely evades experimental investiga-tions. Hence, virtual/computational models depictingstructure-function relation of the entire coronary vasculatureincluding the deep layer are imperative. In order to interpretsuch anatomically based models, fast and efficient visualiza-tion algorithms are essential. The complexity of such models,which include vessels from the large proximal coronary arteriesand veins down to the capillary level (3 orders of magnitudedifference in diameter), is a challenging visualization problemsince the resulting geometrical representation consists ofmillions of vessel segments. In this study, a novel method forrendering the entire porcine coronary arterial tree down to thefirst segments of capillaries interactively is described whichemploys geometry reduction and occlusion culling techniques.Due to the tree-shaped nature of the vasculature, thesetechniques exploit the geometrical topology of the object toachieve a faster rendering speed while still handling the fullcomplexity of the data. We found a significant increase inperformance combined with a more accurate, gap-less repre-sentation of the vessel segments resulting in a more interactivevisualization and analysis tool for the entire coronary arterialtree. The proposed techniques can also be applied to similardata structures, such as neuronal trees, airway structures, bileducts, and other tree-like structures. The utility and futureapplications of the proposed algorithms are explored.
Keywords—Coronary vasculature, Geometry reduction,
Large-scale visualization, Occlusion culling, Tree-shaped
data set.
INTRODUCTION
To understand such a complex system as the coro-nary circulation, it is essential to employ anatomicallybased mathematical models that integrate the physicaland biological interactions. It is important for these
virtual models to include high detail at the microvas-culature (including capillary vessels) as well as on amacroscopic scale (epicardial vessels) in order tointegrate the entire coronary vasculature. A visualrepresentation of the anatomical model should includethe various parameters of the model. For example,diameters and lengths and their relative changesthroughout the vasculature should be visualized forevery vessel segment. The visual representation shouldenable a user to better analyze the parameters of thedata set compared to tabular data. In addition, furtherinformation should be accessible to the user byselecting a vessel segment and displaying information,such as vessel volume and surface area. The systemshould also allow the user to edit the individual vesselsegments and change their radii or location. Obvi-ously, representing the entire geometry of the vascu-lature results in a huge set of geometrical data. Ideally,the visualization should be interactive; i.e., the ren-dering algorithm has to output at least several framesper second (fps).
Rendering such a large-scale model is quite chal-lenging for currently available computing hardwaresince commodity graphics cards are presently not ableto display this amount of information interactively.For the complete coronary arterial model, a total of6 giga-byte (GB) of geometric information is neededto be transferred from main memory to the graphicscard, which presents a limit for interactive rendering.Furthermore, most desktop computers are not capableof handling this amount of data due to insufficientmain memory. Hence, the size of such a large-scaleanatomical model is prohibitive for rendering ondesktop computers without employing out-of-coretechniques.
The objective of this study is to develop a visuali-zation method for a view-dependent, interactive deci-mation of massive tree-shaped data sets. The proposed
Address correspondence to Ghassan S. Kassab, Department of
Biomedical Engineering, Indiana-Purdue University, Indianapolis,
IN, 46202, USA. Electronic mail: [email protected]
Annals of Biomedical Engineering (� 2007)
DOI: 10.1007/s10439-007-9278-x
� 2007 Biomedical Engineering Society
approach will combine a spatial data structure andocclusion queries to reduce the number of trianglesnecessary to render tree-shaped data sets that exceedthe memory present in the computer system. Thetopology of tree-shaped data sets is exploited in orderto reduce the complexity of the triangle mesh coher-ently. The proposed software system makes use ofrecent improvements in graphics hardware andemploys hardware occlusion queries that allow a fasterand more precise occlusion test as compared to soft-ware-based approaches. The techniques described inthis article can be easily applied to data extracted fromany tree-like structures.
METHODS
Anatomically Based Model
Recently, Kaimovitz et al.15 developed a three-dimensional (3-D) geometric model of the entire cor-onary arterial tree (right coronary artery, RCA; leftanterior descending artery, LAD; and left circumflex,LCx arterial tree) based on Kassab et al.’s coronarymorphometric data base.16 The model spans the entirecoronary arterial tree down to the capillary vessels in aprolate spheroid model of the heart and encompassesabout 10 million segments. The 3-D tree structure wasreconstructed initially in rectangular slab geometry bymeans of global geometrical optimization using aparallel Simulated Annealing (SA) algorithm. The SAoptimization was subject to a global boundary avoid-ance constraint and local constraints at bifurcationsprescribed by previously measured data on branchingasymmetry in the coronary arterial tree.38 Subse-quently, the reconstructed tree was mapped onto theprolate spheroidal geometry of the heart. The trans-formation was made through least squares minimiza-tion of the deformation in segment lengths as well astheir angular characteristics.
Rendering of Massive Tree-Like Structures
In the previous publication,15 vessel segments werevisualized using standard cylinders. Since consecutivevessel segments do not necessarily form 180 degreeangles, these result in visible gaps at the point oftransition. To avoid these gaps, the proposed systemrepresents vessel segments as conic cylinders withrotated ends, which are not necessarily orthogonal tothe cylindrical axis. In this way, a smooth transitionfrom one segment to the daughter segment(s) can beachieved, thus avoiding any gaps. The individual coniccylinders are pieced together using triangles that arefitted in such a way that an optimal, gap-less approx-imation is achieved. This results in an accurate visual
representation of the entire vascular structure asdefined by the data set.
Since several triangles are needed to represent asingle conic cylinder, rendering a vascular structurewhich consists of 10 million vessel segments requiresabout 220 million triangles to achieve a sufficientlyaccurate approximation. This in return results ingeometry data that amounts to several GB in sizewhich exceeds the main memory of common desktopcomputers. In addition, transferring this amount ofdata to the graphics hardware and processing thisinformation overwhelms both the bus system (usuallyadvanced graphics port, AGP, or PCI Express) as wellas the graphics hardware. Consequently, techniquesare needed that allow the system to handle data setsthat exceed the amount of main memory present in thecomputer as well as reduce the number of triangles togenerate the visualization.
Hence, the proposed software system deploys out-of-core techniques which store the entire geometrydata on the hard drive only. During the renderingprocess, only parts of the data are transferred to themain memory. Once these parts are processed, thesystem automatically removes these parts and loadsthe next ones for further processing. In this way, thegeometry data is loaded in a streaming fashion fromthe hard drive and then transferred to the graphicshardware for visualization.
In addition, the proposed system reduces the numberof triangles using view-dependent geometry reduction,backface-culling, and occlusion-based reduction. View-dependent geometry reduction automatically reducesthe amount of detail that is used for representing thevessel segments based on the distance to the viewer.Hence, the vessel segments that appear far away aredrawn with less detail (using a lower number of trian-gles per vessel segment) while the ones in the front areshown in full detail. Since usually only half of a coniccylinder is visible at a time, only the visible half needs tobe processed in order to generate the visualization.Accordingly, the number of triangles can be reducedsignificantly by removing those triangles of a coniccylinder that face away from the viewer.
Similarly, occlusion-based reduction removes thoseconic cylinders that represent vessel segments whichare obstructed by several other vessel segments andtherefore invisible from the current location of theviewer. Since these vessel segments are not visible, theycan be eliminated without changing the visualization.This reduces the number of triangles that need to betransferred to the graphics hardware. Note that allthese techniques for reducing the number of trianglesare view-dependent; i.e., whenever the location of theviewer changes these need to be recomputed to ensurethat only those triangles are removed that minimally
WISCHGOLL et al.
contribute to the current visualization. As a conse-quence, all computations required need to be imple-mented very efficiently. For example, better efficiencycan be achieved by grouping vessel segments that areclose together and then applying the geometry reduc-tion techniques to the entire group. This reduces thecomputation effort for visibility tests significantly.Grouping of vessel segments can be achieved forexample, by sub-dividing the bounding box of the en-tire vascular structure into equal sub-areas. A detaileddescription, including implementation details, can befound in the appendix.
RESULTS
Tree Rendering
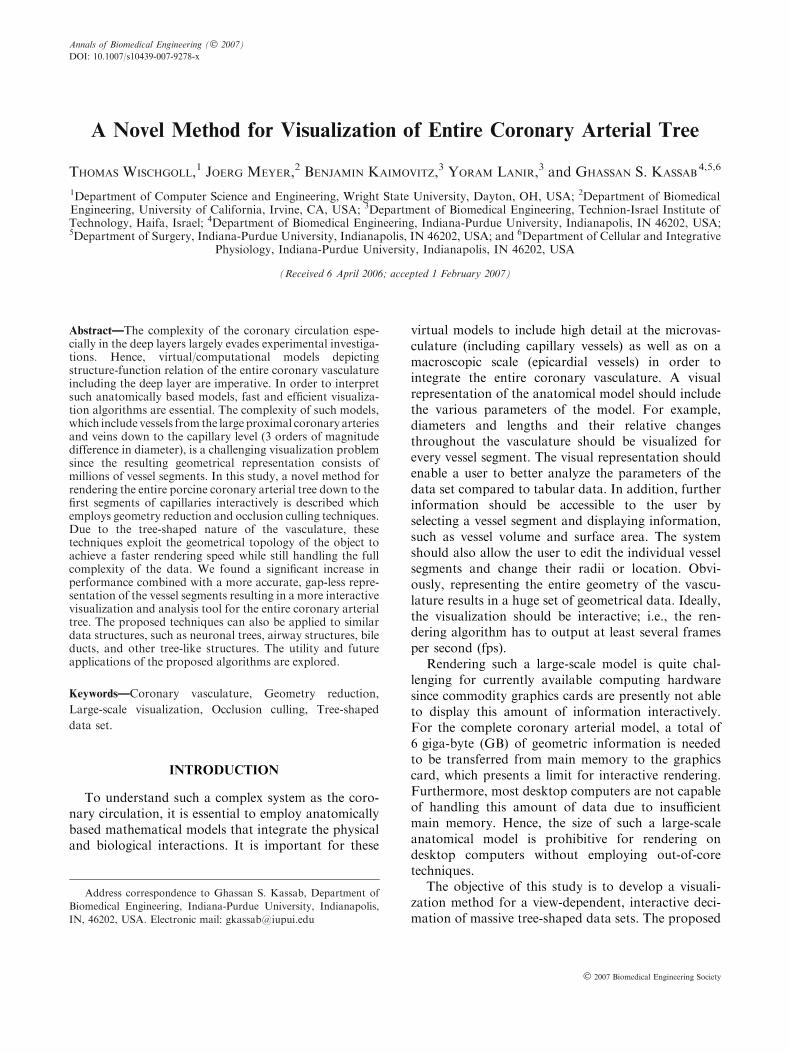
Figure 1 shows the complete vascular modelincluding all three major branches. The left imagedepicts an overview, while the right displays a close-upview of the marked region. Even after zooming into themodel, there is still an enormous amount of detailwhich underscores the complexity of the generatedmodel. The geometric model exceeds the main memoryof most desktop computers. In addition, the geometrydata results in slow performance due to the enormityof information that needs to be processed to compute asingle projected image. Without applying out-of-coremethods, only one branch of the vasculature, forexample the LCx as depicted in Fig. 2 (a), can bevisualized since it is significantly smaller in size(1.8 million vessel segments).
Geometry Reduction
The geometry reduction techniques applied to thedata significantly reduced the number of triangles. For
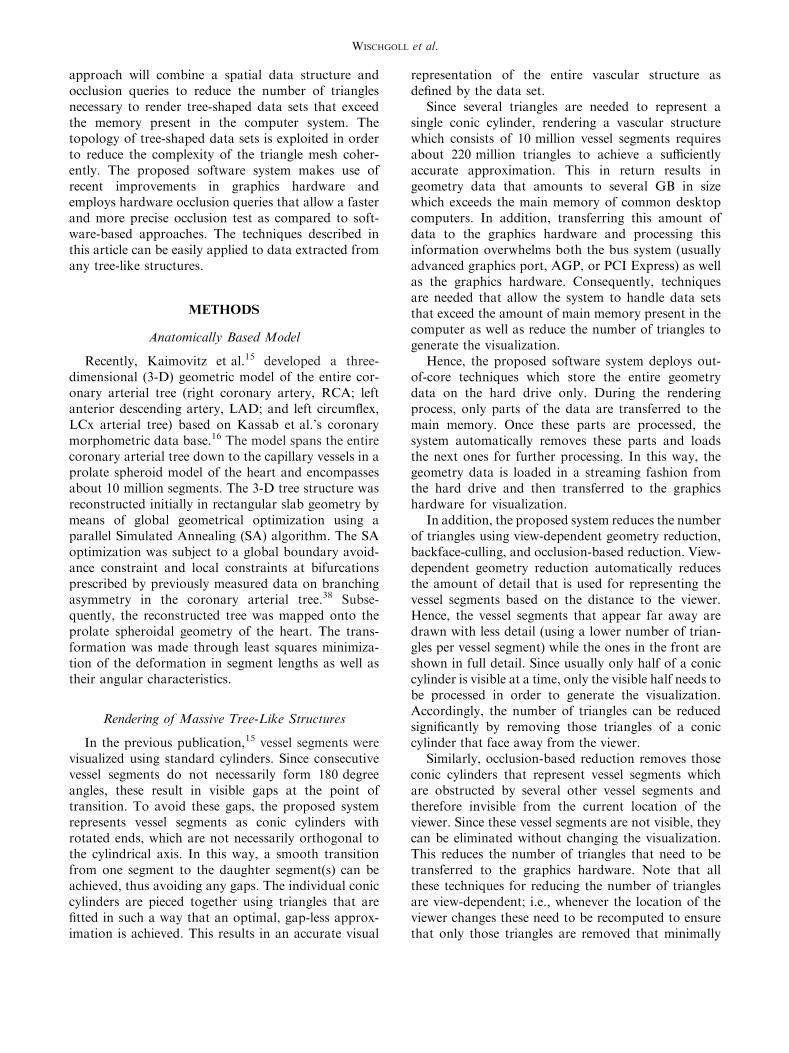
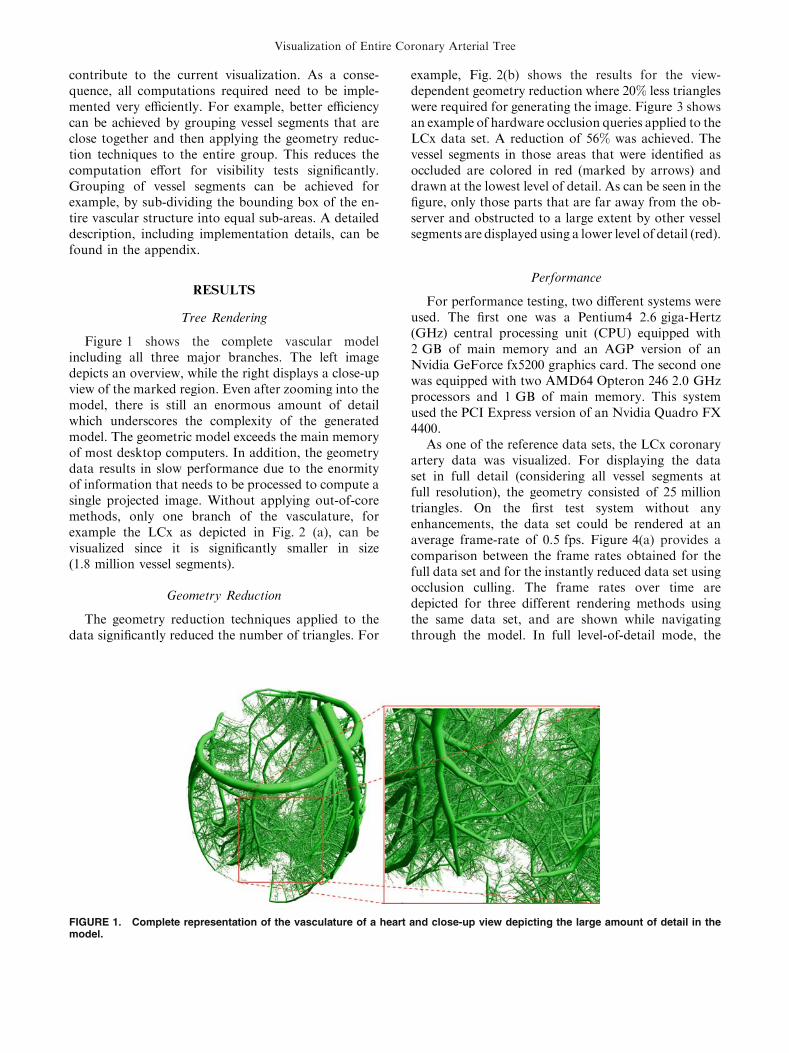
example, Fig. 2(b) shows the results for the view-dependent geometry reduction where 20% less triangleswere required for generating the image. Figure 3 showsan example of hardware occlusion queries applied to theLCx data set. A reduction of 56% was achieved. Thevessel segments in those areas that were identified asoccluded are colored in red (marked by arrows) anddrawn at the lowest level of detail. As can be seen in thefigure, only those parts that are far away from the ob-server and obstructed to a large extent by other vesselsegments are displayed using a lower level of detail (red).
Performance
For performance testing, two different systems wereused. The first one was a Pentium4 2.6 giga-Hertz(GHz) central processing unit (CPU) equipped with2 GB of main memory and an AGP version of anNvidia GeForce fx5200 graphics card. The second onewas equipped with two AMD64 Opteron 246 2.0 GHzprocessors and 1 GB of main memory. This systemused the PCI Express version of an Nvidia Quadro FX4400.
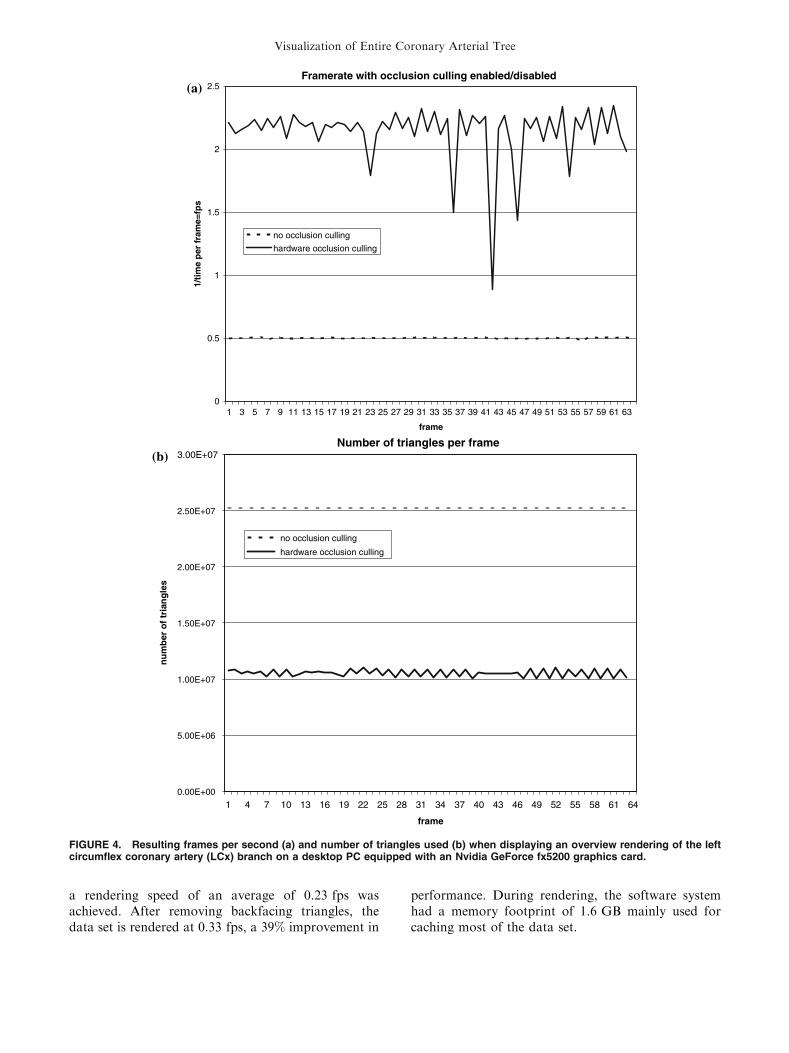
As one of the reference data sets, the LCx coronaryartery data was visualized. For displaying the dataset in full detail (considering all vessel segments atfull resolution), the geometry consisted of 25 milliontriangles. On the first test system without anyenhancements, the data set could be rendered at anaverage frame-rate of 0.5 fps. Figure 4(a) provides acomparison between the frame rates obtained for thefull data set and for the instantly reduced data set usingocclusion culling. The frame rates over time aredepicted for three different rendering methods usingthe same data set, and are shown while navigatingthrough the model. In full level-of-detail mode, the
FIGURE 1. Complete representation of the vasculature of a heart and close-up view depicting the large amount of detail in themodel.
Visualization of Entire Coronary Arterial Tree
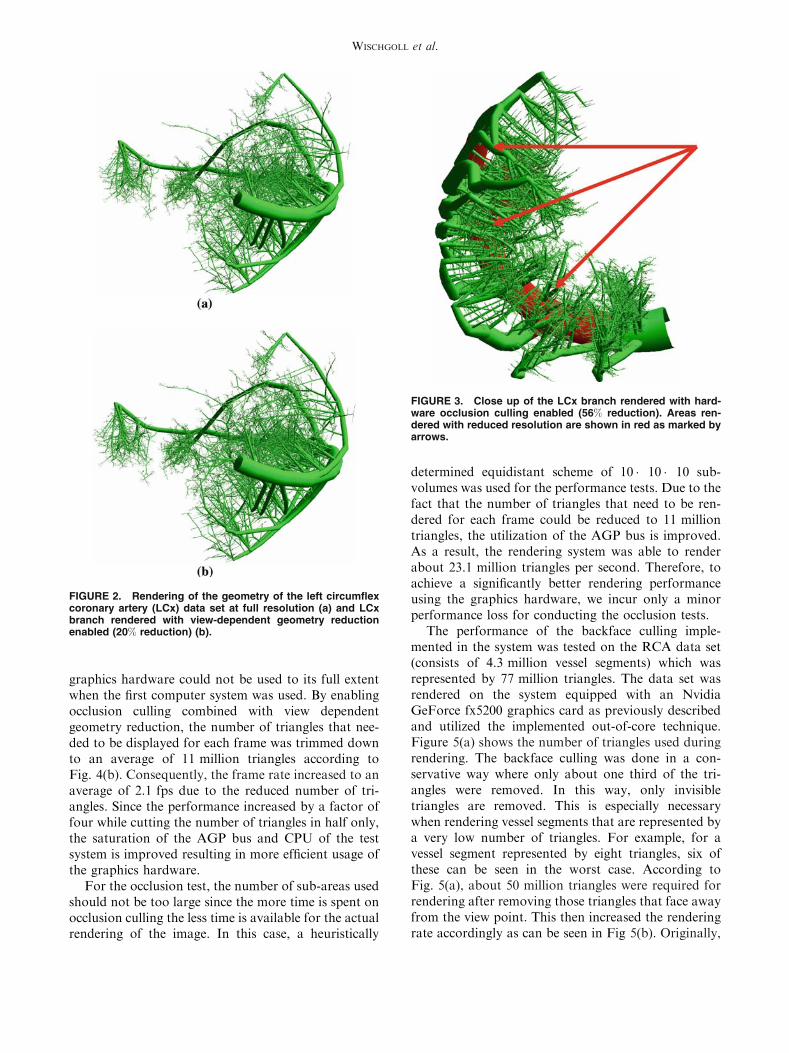
graphics hardware could not be used to its full extentwhen the first computer system was used. By enablingocclusion culling combined with view dependentgeometry reduction, the number of triangles that nee-ded to be displayed for each frame was trimmed downto an average of 11 million triangles according toFig. 4(b). Consequently, the frame rate increased to anaverage of 2.1 fps due to the reduced number of tri-angles. Since the performance increased by a factor offour while cutting the number of triangles in half only,the saturation of the AGP bus and CPU of the testsystem is improved resulting in more efficient usage ofthe graphics hardware.
For the occlusion test, the number of sub-areas usedshould not be too large since the more time is spent onocclusion culling the less time is available for the actualrendering of the image. In this case, a heuristically
determined equidistant scheme of 10� 10� 10 sub-volumes was used for the performance tests. Due to thefact that the number of triangles that need to be ren-dered for each frame could be reduced to 11 milliontriangles, the utilization of the AGP bus is improved.As a result, the rendering system was able to renderabout 23.1 million triangles per second. Therefore, toachieve a significantly better rendering performanceusing the graphics hardware, we incur only a minorperformance loss for conducting the occlusion tests.
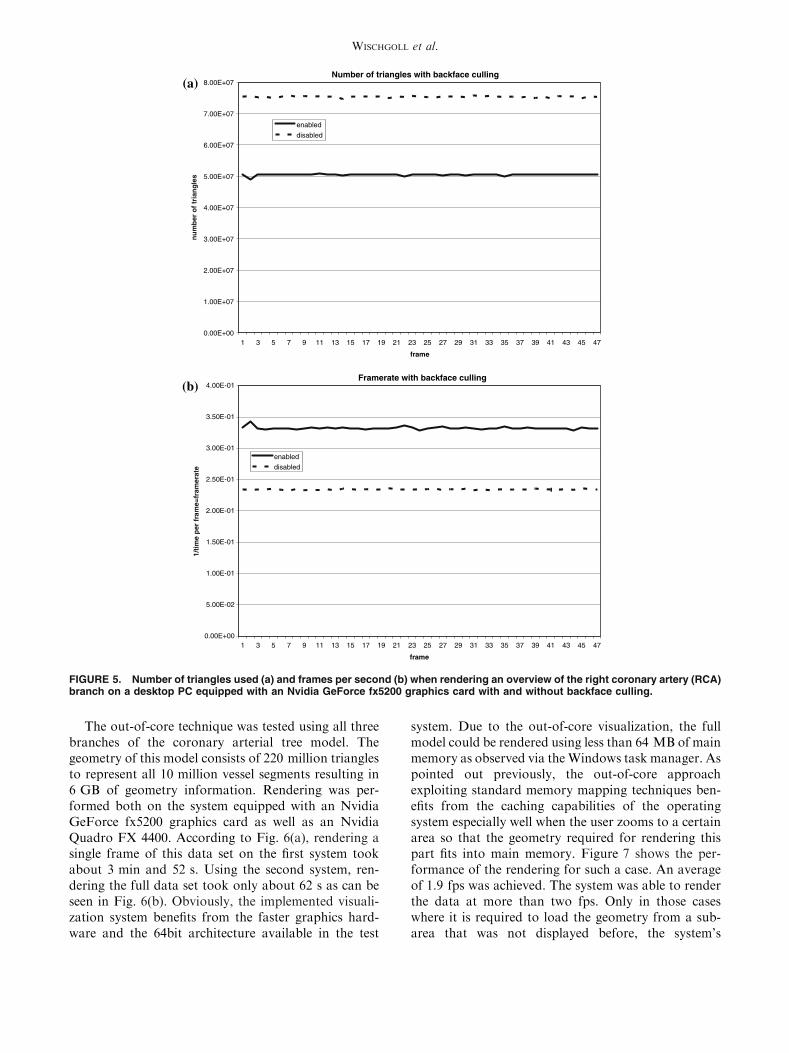
The performance of the backface culling imple-mented in the system was tested on the RCA data set(consists of 4.3 million vessel segments) which wasrepresented by 77 million triangles. The data set wasrendered on the system equipped with an NvidiaGeForce fx5200 graphics card as previously describedand utilized the implemented out-of-core technique.Figure 5(a) shows the number of triangles used duringrendering. The backface culling was done in a con-servative way where only about one third of the tri-angles were removed. In this way, only invisibletriangles are removed. This is especially necessarywhen rendering vessel segments that are represented bya very low number of triangles. For example, for avessel segment represented by eight triangles, six ofthese can be seen in the worst case. According toFig. 5(a), about 50 million triangles were required forrendering after removing those triangles that face awayfrom the view point. This then increased the renderingrate accordingly as can be seen in Fig 5(b). Originally,
FIGURE 3. Close up of the LCx branch rendered with hard-ware occlusion culling enabled (56% reduction). Areas ren-dered with reduced resolution are shown in red as marked byarrows.
FIGURE 2. Rendering of the geometry of the left circumflexcoronary artery (LCx) data set at full resolution (a) and LCxbranch rendered with view-dependent geometry reductionenabled (20% reduction) (b).
WISCHGOLL et al.
a rendering speed of an average of 0.23 fps wasachieved. After removing backfacing triangles, thedata set is rendered at 0.33 fps, a 39% improvement in
performance. During rendering, the software systemhad a memory footprint of 1.6 GB mainly used forcaching most of the data set.
Framerate with occlusion culling enabled/disabled
0
0.5
1
1.5
2
2.5
1 3 5 7 9 11 13 15 17 19 21 23 25 27 29 31 33 35 37 39 41 43 45 47 49 51 53 55 57 59 61 63
frame
spf=e
marfre
pe
mi t/1
no occlusion culling
hardware occlusion culling
Number of triangles per frame
0.00E+00
5.00E+06
1.00E+07
1.50E+07
2.00E+07
2.50E+07
3.00E+07
1 4 7 10 13 16 19 22 25 28 31 34 37 40 43 46 49 52 55 58 61 64
frame
selg
nairtf
ore
bm
un
no occlusion culling
hardware occlusion culling
(a)
(b)
FIGURE 4. Resulting frames per second (a) and number of triangles used (b) when displaying an overview rendering of the leftcircumflex coronary artery (LCx) branch on a desktop PC equipped with an Nvidia GeForce fx5200 graphics card.
Visualization of Entire Coronary Arterial Tree
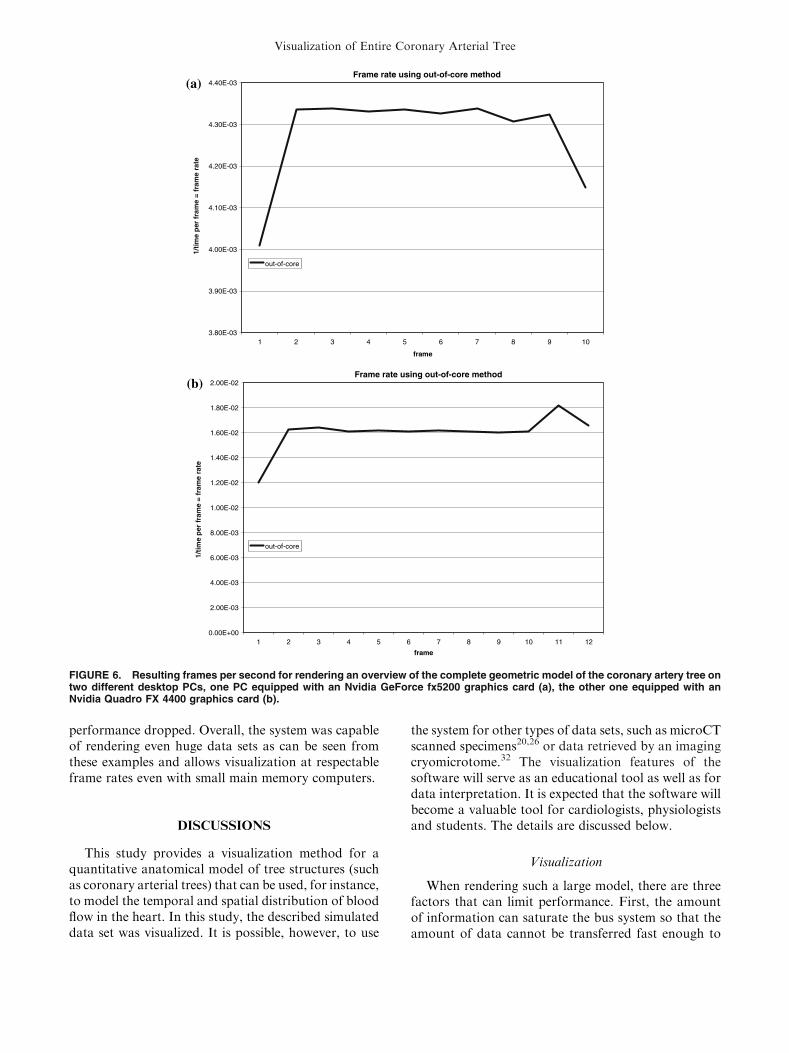
The out-of-core technique was tested using all threebranches of the coronary arterial tree model. Thegeometry of this model consists of 220 million trianglesto represent all 10 million vessel segments resulting in6 GB of geometry information. Rendering was per-formed both on the system equipped with an NvidiaGeForce fx5200 graphics card as well as an NvidiaQuadro FX 4400. According to Fig. 6(a), rendering asingle frame of this data set on the first system tookabout 3 min and 52 s. Using the second system, ren-dering the full data set took only about 62 s as can beseen in Fig. 6(b). Obviously, the implemented visuali-zation system benefits from the faster graphics hard-ware and the 64bit architecture available in the test
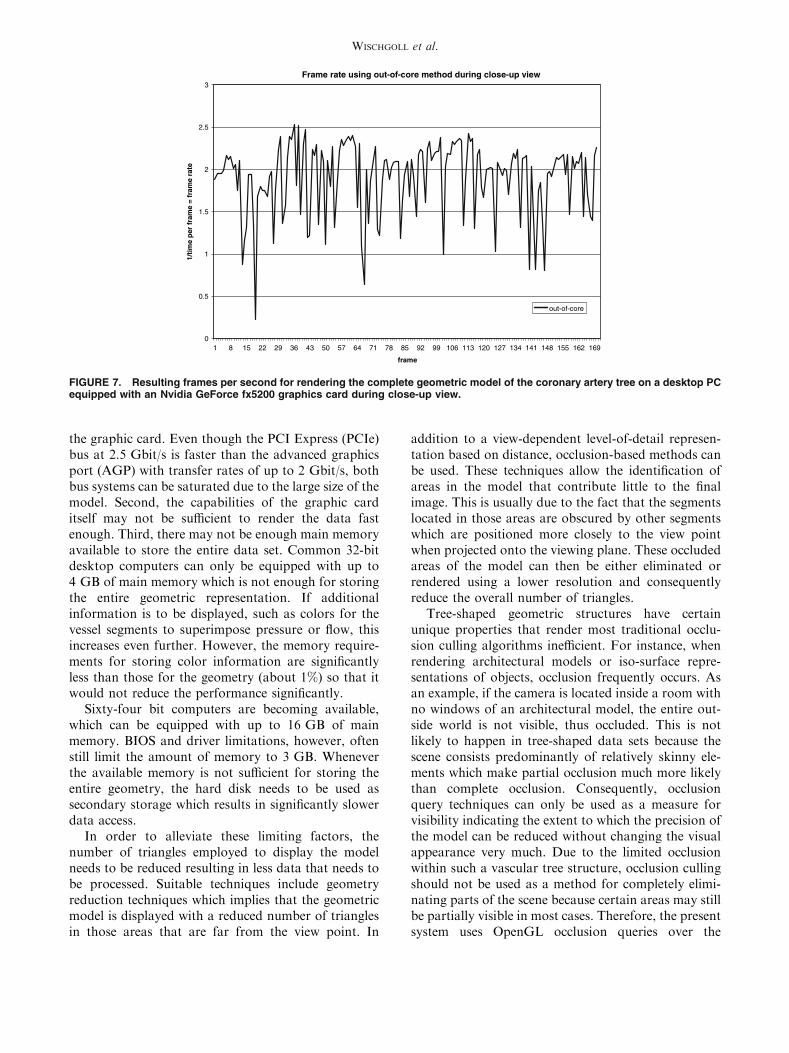
system. Due to the out-of-core visualization, the fullmodel could be rendered using less than 64 MB of mainmemory as observed via theWindows task manager. Aspointed out previously, the out-of-core approachexploiting standard memory mapping techniques ben-efits from the caching capabilities of the operatingsystem especially well when the user zooms to a certainarea so that the geometry required for rendering thispart fits into main memory. Figure 7 shows the per-formance of the rendering for such a case. An averageof 1.9 fps was achieved. The system was able to renderthe data at more than two fps. Only in those caseswhere it is required to load the geometry from a sub-area that was not displayed before, the system’s
Number of triangles with backface culling
0.00E+00
1.00E+07
2.00E+07
3.00E+07
4.00E+07
5.00E+07
6.00E+07
7.00E+07
8.00E+07
1 3 5 7 9 11 13 15 17 19 21 23 25 27 29 31 33 35 37 39 41 43 45 47
frame
selg
nairt fo re
bm
un
enabled
disabled
Framerate with backface culling
0.00E+00
5.00E-02
1.00E-01
1.50E-01
2.00E-01
2.50E-01
3.00E-01
3.50E-01
4.00E-01
1 3 5 7 9 11 13 15 17 19 21 23 25 27 29 31 33 35 37 39 41 43 45 47
frame
etaremarf=e
marf rep e
m it/1
enabled
disabled
(a)
(b)
FIGURE 5. Number of triangles used (a) and frames per second (b) when rendering an overview of the right coronary artery (RCA)branch on a desktop PC equipped with an Nvidia GeForce fx5200 graphics card with and without backface culling.
WISCHGOLL et al.
performance dropped. Overall, the system was capableof rendering even huge data sets as can be seen fromthese examples and allows visualization at respectableframe rates even with small main memory computers.
DISCUSSIONS
This study provides a visualization method for aquantitative anatomical model of tree structures (suchas coronary arterial trees) that can be used, for instance,to model the temporal and spatial distribution of bloodflow in the heart. In this study, the described simulateddata set was visualized. It is possible, however, to use
the system for other types of data sets, such as microCTscanned specimens20,26 or data retrieved by an imagingcryomicrotome.32 The visualization features of thesoftware will serve as an educational tool as well as fordata interpretation. It is expected that the software willbecome a valuable tool for cardiologists, physiologistsand students. The details are discussed below.
Visualization
When rendering such a large model, there are threefactors that can limit performance. First, the amountof information can saturate the bus system so that theamount of data cannot be transferred fast enough to
Frame rate using out-of-core method
3.80E-03
3.90E-03
4.00E-03
4.10E-03
4.20E-03
4.30E-03
4.40E-03
1 2 3 4 5 6 7 8 9 10
frame
etare
marf=
emarf
rep
em it/1
out-of-core
Frame rate using out-of-core method
0.00E+00
2.00E-03
4.00E-03
6.00E-03
8.00E-03
1.00E-02
1.20E-02
1.40E-02
1.60E-02
1.80E-02
2.00E-02
1 2 3 4 5 6 7 8 9 10 11 12
frame
etare
marf=
emarf
rep
em it/ 1
out-of-core
(a)
(b)
FIGURE 6. Resulting frames per second for rendering an overview of the complete geometric model of the coronary artery tree ontwo different desktop PCs, one PC equipped with an Nvidia GeForce fx5200 graphics card (a), the other one equipped with anNvidia Quadro FX 4400 graphics card (b).
Visualization of Entire Coronary Arterial Tree
the graphic card. Even though the PCI Express (PCIe)bus at 2.5 Gbit/s is faster than the advanced graphicsport (AGP) with transfer rates of up to 2 Gbit/s, bothbus systems can be saturated due to the large size of themodel. Second, the capabilities of the graphic carditself may not be sufficient to render the data fastenough. Third, there may not be enough main memoryavailable to store the entire data set. Common 32-bitdesktop computers can only be equipped with up to4 GB of main memory which is not enough for storingthe entire geometric representation. If additionalinformation is to be displayed, such as colors for thevessel segments to superimpose pressure or flow, thisincreases even further. However, the memory require-ments for storing color information are significantlyless than those for the geometry (about 1%) so that itwould not reduce the performance significantly.
Sixty-four bit computers are becoming available,which can be equipped with up to 16 GB of mainmemory. BIOS and driver limitations, however, oftenstill limit the amount of memory to 3 GB. Wheneverthe available memory is not sufficient for storing theentire geometry, the hard disk needs to be used assecondary storage which results in significantly slowerdata access.
In order to alleviate these limiting factors, thenumber of triangles employed to display the modelneeds to be reduced resulting in less data that needs tobe processed. Suitable techniques include geometryreduction techniques which implies that the geometricmodel is displayed with a reduced number of trianglesin those areas that are far from the view point. In
addition to a view-dependent level-of-detail represen-tation based on distance, occlusion-based methods canbe used. These techniques allow the identification ofareas in the model that contribute little to the finalimage. This is usually due to the fact that the segmentslocated in those areas are obscured by other segmentswhich are positioned more closely to the view pointwhen projected onto the viewing plane. These occludedareas of the model can then be either eliminated orrendered using a lower resolution and consequentlyreduce the overall number of triangles.
Tree-shaped geometric structures have certainunique properties that render most traditional occlu-sion culling algorithms inefficient. For instance, whenrendering architectural models or iso-surface repre-sentations of objects, occlusion frequently occurs. Asan example, if the camera is located inside a room withno windows of an architectural model, the entire out-side world is not visible, thus occluded. This is notlikely to happen in tree-shaped data sets because thescene consists predominantly of relatively skinny ele-ments which make partial occlusion much more likelythan complete occlusion. Consequently, occlusionquery techniques can only be used as a measure forvisibility indicating the extent to which the precision ofthe model can be reduced without changing the visualappearance very much. Due to the limited occlusionwithin such a vascular tree structure, occlusion cullingshould not be used as a method for completely elimi-nating parts of the scene because certain areas may stillbe partially visible in most cases. Therefore, the presentsystem uses OpenGL occlusion queries over the
Frame rate using out-of-core method during close-up view
0
0.5
1
1.5
2
2.5
3
1 8 15 22 29 36 43 50 57 64 71 78 85 92 99 106 113 120 127 134 141 148 155 162 169
frame
etar emar f = e
marf rep e
m it/1
out-of-core
FIGURE 7. Resulting frames per second for rendering the complete geometric model of the coronary artery tree on a desktop PCequipped with an Nvidia GeForce fx5200 graphics card during close-up view.
WISCHGOLL et al.
GL_HP-occlusion-test which allows the system todetermine the amount of occlusion.
Comparison with Other Studies
The resulting geometrical representation of thesimulated vascular tree consists of millions of vessels.Due to the tremendous complexity of this model, theimages shown in the original article15 were generatedusing the POVray ray tracer. Those only include ves-sels down to order five to prevent POVray from beingoverwhelmed by the complexity of the model. It tookabout two minutes to generate an image of the reducedvasculature using POVray. In this article, however, allvessels down to the capillaries are shown and less timeis needed for creating an image.
The proposed method is based on a real-time, view-dependent simplification of complex models. Severalpublications exist that employ similar methods. Pro-gressive meshes as introduced by Hoppe13 were de-signed to obtain increasingly coarser representations ofa mesh by applying edge collapse operations. Applyingthis method, a level-of-detail description of the modelis derived. In one of his later publications, Hoppe14
describes efficient data structures and algorithms forimplementing progressive meshes. Xia et al.35 definedthe notion of a merge tree that stores the edge collapseoperations in a hierarchical manner to create a con-tinuous-resolution representation of an object. A sim-ilar approach was proposed by El-Sana et al.5 where abinary view-dependence tree is created containinggeneral vertex-pair collapses. This tree can then beused to generate the required triangles for display atrun time. Andujar et al.1 used classical occlusion cull-ing algorithms and computed potentially visible sets(PVS) which consist of those polygons that are likely tobe visible. These sets are supersets of the sets of allvisible polygons for which the degree of visibility isdetermined to create view-dependent occlusion culling.Shaffer et al.31 developed a progressive mesh simplifi-cation algorithm which clusters the vertices using aBSP-tree resulting in an adaptive simplification of thepolygonal mesh. Pajarola23 introduced FastMeshwhich defines a hierarchy on half-edges that reducesthe storage cost in comparison to vertex hierarchies.El-Sana et al.6 combine a view-dependence tree withspatial sub-division techniques to avoid scanning ofactive nodes that do not contribute to the incrementalupdate of the selected level of detail.
Several algorithms for reducing the complexity of ascene using occlusion culling are available bothimplemented in software and in hardware.3 Greene10
developed an algorithm based on hierarchical tilingthat is able to determine whether a convex polygon isinside, outside, or intersecting an image hierarchy.
Bartz et al.2 render bounding volumes into a virtualocclusion buffer using OpenGL and read back theresults from the graphics hardware to determineocclusion. Since reading back from the OpenGL bufferis slow, an interleaving scheme is applied to speed upread-back. Zhang et al.39 describe hierarchical image-space occlusion maps for visibility culling. The cullingalgorithm uses an object-space bounding volumehierarchy and can be implemented using graphicshardware. Klosowski et al.17 propose a visibility cull-ing algorithm based on Prioritized Layered Projection(PLP) that can be implemented using graphics hard-ware. El-Sana et al.7 combine the PLP approach withview-dependency resulting in a view-dependent occlu-sion culling. Yoon et al.36 use a clustering hierarchyfor refining the underlying grid to obtain a level-of-detail representation for arbitrary triangle meshes inaddition to hardware occlusion culling. Recent effortsshow that current hardware improvements and theusage of a clustered hierarchy of progressive meshes canimprove rendering speed even further.37 However,most of the described methods are not suitable fordirectly reducing the complexity of a model of tree-likeanatomical structures, such as the coronary vasculartree.
Different techniques for visualizing vascular struc-tures can be found in the literature. Gerig et al.9 de-scribe how to derive a skeletal structure from avolumetric image based on hysteriosis thresholdingand binary thinning. Hahn et al.12 employ geometricalprimitives, such as truncated cones, to visualize vesselsinside the human liver. A similar approach has beentaken for the rendering method described in this arti-cle. The model is represented by conic cylinders aspreviously described. Masutani et al.19 used cylindersaligned to the vessel skeleton to visualize the vascula-ture. Different radii at branchings resulted in discon-tinuities when using this method. Felkel et al.8
reconstructed liver vessels from center line and radiusinformation to supply an augmented reality tool forsurgery. Puig et al.24 developed a system for exploringcerebral blood vessels using a symbolic model with afocus on geometric continuity and on realistic shading.Oeltze et al.21,22 use convolution surfaces to obtain asmoother representation of blood vessels extractedfrom CT or MR data.
Deussen et al.4 use points and lines to representcomplex systems of plants as approximation reducingthe overall number of triangles compared to their ori-ginal representation. Gumhold et al.11 use a splattingapproach based on ellipsoids for rendering scientificdata sets. The advantage of such a glyph-basedapproach is the potential of deploying the hardware forrendering. Reina et al.25 showed this when renderingmolecular visualizations of 500,000 particles at 10 fps.
Visualization of Entire Coronary Arterial Tree
In a comparative study, the present system wascompared to an implementation on a high-end visu-alization server: the Sun Fire V880z visualization ser-ver. This server is equipped with 16 GB of mainmemory allowing the system to store the entire geo-metric model in main memory. Despite the fact thatthis server is geared towards optimal rendering per-formance for large data sets, the overall performancewas slower compared to the second test system usingan Nvidia Quadro FX 4400. Generating a single pro-jected image took 90 s on the Sun server while thesecond test system using the present system completedthe task after 62 s.
Significance
Virtual models of normal hearts are needed as aphysiologic reference. Pathological states can then bestudied in relation to changes in model parameters thatalter coronary perfusion. With such computationalmodels, researchers can analyze the effects of differenttreatment options (medical and surgical), and ulti-mately find rational ways to prevent and treat coro-nary heart disease. Based on detailed anatomicallybased models, computational fluid dynamics simula-tions can yield accurate simulation of blood flow inhealth and disease. In order to visualize the presentanatomically based models that may include futurehemodynamic and physiological data, it is essential tohave efficient and fast visualization techniques. Thepresent study is the first step in that direction.
Conclusions and Future Work
A rendering system has been described whichexploits the tree-shaped topology to increase renderingperformance. Due to the nature of tree-shaped struc-tures, hierarchical meshes to obtain different levels ofdetail can be generated based on the topologicalstructure of the data; i.e., individual segments can beclustered as entities. Geometry reduction techniques aswell as occlusion culling enables the system to rendereach frame four times faster than the standard methodthat displays the full model directly without simplifi-cation methods. For the LCx data set, the number oftriangles can be reduced in such a way that the amountof geometric information is small enough to be trans-ferred to the graphics hardware and fast enough toutilize the full performance potential of the hardware.
Using out-of-core techniques, the full model can bedisplayed even on computer systems equipped withrelatively small amount of memory since only 64 MBare sufficient for the algorithm. With a high-end PCsystem, rendering can be even faster using out-of-coretechniques compared to workstations equipped with
much more main memory, such as the Sun Fire V880zvisualization server.
In the future, ray tracing or ray casting algorithmswill be applied to the data set to explore if there are anyperformance benefits from this approach. Additionally,GPU based methods that render the conic cylinderscompletely on the GPU might increase performance byreducing the amount of information that needs to bestored in memory and avoids data transfer on the bussystems. Using other types of geometry approximationsfor the tree segments in combination with hardwarebased approaches might yield even better performance,such as line primitives.33
ACKNOWLEDGMENTS
The authors would like to thank Falko Kuester, UCIrvine, for providing the high-end PC system equippedwith an Nvidia Quadro FX 4400. This work was sup-ported in part by the National Institute of Health—National Heart, Lung, and Blood Institute Grant 2 R01HL055554-06 (GSK), by the National Institute ofMental Health (NIMH) through a subcontract with theCenter for Neuroscience at the University of Califor-nia, Davis (5 P20 MH60975), by the National Part-nership for Advanced Computational Infrastructure(NPACI), Interaction Environments (IE) Thrust(10195430 00120410).
APPENDIX
Rendering of Massive Tree-Like Structures
In order to analyze large-scale tree-like structures,appropriate visualization methods are necessary.Whenever the geometry data of such a structure exceedthe amount of main memory of the computer, theapplication of several techniques to both be able tohandle the data set as well as improve performance arerequired. This Appendix provides details about thedata format and explains the different techniques thatwere applied to visualize the data on common desktopcomputers.
Visualizing Tree-Like Structures
The structure is given as a sequence of consecutivesegments where one segment can have multipledaughter vessels (mostly two as bifurcations) as suc-cessors, forming a tree-shaped structure with a highlyasymmetric branching pattern. Each segment in thetree is characterized by the coordinates and radii of itsproximal and distal nodes. This data format is similarto the one provided by commercial software packages,
WISCHGOLL et al.
such as Analyze.27,28,29 Since the radii of two consec-utive nodes are not necessarily equal, a conic cylinderis defined based on the data representing each segment.All conic cylinders together then define a representa-tion of the vasculature as prescribed by the model. Fora coronary arterial tree, there exist three major bran-ches in the data set representing the RCA, LAD andLCx arterial tree, respectively. Every branch includes acomplete set of linked vessel segments from the mac-rovasculature down to the first capillary bifurcation.
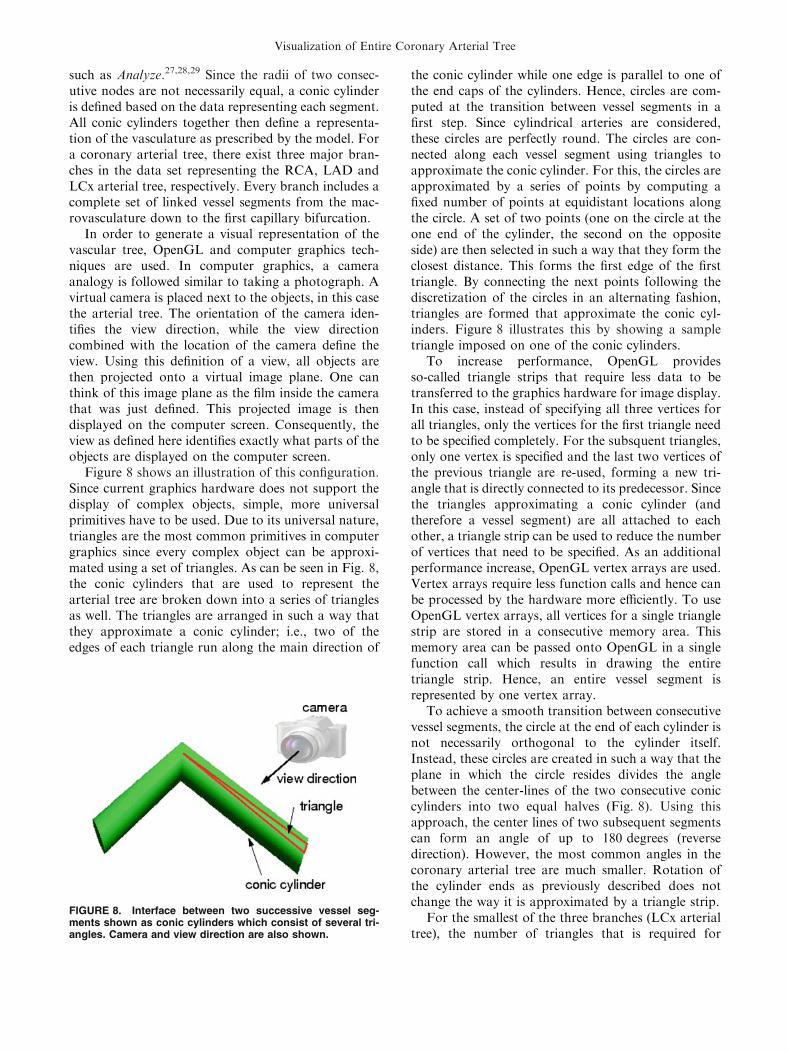
In order to generate a visual representation of thevascular tree, OpenGL and computer graphics tech-niques are used. In computer graphics, a cameraanalogy is followed similar to taking a photograph. Avirtual camera is placed next to the objects, in this casethe arterial tree. The orientation of the camera iden-tifies the view direction, while the view directioncombined with the location of the camera define theview. Using this definition of a view, all objects arethen projected onto a virtual image plane. One canthink of this image plane as the film inside the camerathat was just defined. This projected image is thendisplayed on the computer screen. Consequently, theview as defined here identifies exactly what parts of theobjects are displayed on the computer screen.
Figure 8 shows an illustration of this configuration.Since current graphics hardware does not support thedisplay of complex objects, simple, more universalprimitives have to be used. Due to its universal nature,triangles are the most common primitives in computergraphics since every complex object can be approxi-mated using a set of triangles. As can be seen in Fig. 8,the conic cylinders that are used to represent thearterial tree are broken down into a series of trianglesas well. The triangles are arranged in such a way thatthey approximate a conic cylinder; i.e., two of theedges of each triangle run along the main direction of
the conic cylinder while one edge is parallel to one ofthe end caps of the cylinders. Hence, circles are com-puted at the transition between vessel segments in afirst step. Since cylindrical arteries are considered,these circles are perfectly round. The circles are con-nected along each vessel segment using triangles toapproximate the conic cylinder. For this, the circles areapproximated by a series of points by computing afixed number of points at equidistant locations alongthe circle. A set of two points (one on the circle at theone end of the cylinder, the second on the oppositeside) are then selected in such a way that they form theclosest distance. This forms the first edge of the firsttriangle. By connecting the next points following thediscretization of the circles in an alternating fashion,triangles are formed that approximate the conic cyl-inders. Figure 8 illustrates this by showing a sampletriangle imposed on one of the conic cylinders.
To increase performance, OpenGL providesso-called triangle strips that require less data to betransferred to the graphics hardware for image display.In this case, instead of specifying all three vertices forall triangles, only the vertices for the first triangle needto be specified completely. For the subsquent triangles,only one vertex is specified and the last two vertices ofthe previous triangle are re-used, forming a new tri-angle that is directly connected to its predecessor. Sincethe triangles approximating a conic cylinder (andtherefore a vessel segment) are all attached to eachother, a triangle strip can be used to reduce the numberof vertices that need to be specified. As an additionalperformance increase, OpenGL vertex arrays are used.Vertex arrays require less function calls and hence canbe processed by the hardware more efficiently. To useOpenGL vertex arrays, all vertices for a single trianglestrip are stored in a consecutive memory area. Thismemory area can be passed onto OpenGL in a singlefunction call which results in drawing the entiretriangle strip. Hence, an entire vessel segment isrepresented by one vertex array.
To achieve a smooth transition between consecutivevessel segments, the circle at the end of each cylinder isnot necessarily orthogonal to the cylinder itself.Instead, these circles are created in such a way that theplane in which the circle resides divides the anglebetween the center-lines of the two consecutive coniccylinders into two equal halves (Fig. 8). Using thisapproach, the center lines of two subsequent segmentscan form an angle of up to 180 degrees (reversedirection). However, the most common angles in thecoronary arterial tree are much smaller. Rotation ofthe cylinder ends as previously described does notchange the way it is approximated by a triangle strip.
For the smallest of the three branches (LCx arterialtree), the number of triangles that is required for
FIGURE 8. Interface between two successive vessel seg-ments shown as conic cylinders which consist of several tri-angles. Camera and view direction are also shown.
Visualization of Entire Coronary Arterial Tree
visualization of all 1.8 million vessel segments is25 million triangles. The entire coronary tree consist-ing of 10 million vessel segments is represented by220 million triangles based on a discretization of eachconic cylinder using sixteen triangles. The conic cylin-der representing each segment is approximated by asingle triangle strip which is constructed as follows: thetwo ends of the conic cylinder are discretized using amaximum of eight points. These points are then con-nected with triangles. Using a point on each endalternately, this results in a triangle strip. At full res-olution, this triangle strip consists of 16 triangles ren-dered by 18 vertices. Due to the size and detail of thedata set, the geometry of the vascular structure re-quires representation of the coordinates of the verticesusing 32-bit floating-point numbers. Lower-precisionrepresentations result in truncated positions of thevertices and therefore can change the overall geometrysignificantly. For correct illumination of the geometry,normal vectors are included using another set of three32-bit floating point values. These normal vectors arerequired for computing the correct reflection of lighton top of the conic cylinders used as geometric repre-sentation of the vascular structure. The normal vectorsare computed for every vertex based on the originalgeometry (the conic cylinders). This yields significantlybetter results and achieves an additional depth cue andtherefore a more realistic image. In this way, a user ismuch better able to recognize the 3-D geometry in lesstime even from a projected 2-D image. Overall, forrepresenting 220 million triangles using vertex coordi-nates and normal vectors, about 6 GB of memory isrequired in order for the entire geometric representa-tion of the vascular structure to be stored. This entireinformation needs to be processed for every projectedimage that is used as visualization of the vascularstructure.
Geometry Reduction
In order to increase performance, a commonapproach is to reduce the amount of geometry infor-mation that needs to be processed for a single image.Usually, this is achieved by using a simpler represen-tation and/or removing parts of the data set that iseither invisible or only visible to a small extent. Com-pared to arbitrary triangle meshes, tree-shaped datasets have special topological features that can be takenadvantage of to speed up the visualization. First, theconnectivity between different segments can be used tosimplify the structure by skipping segments. Thisresults in a simpler representation of the data. Sec-ondly, the cylindrical shape of the segments can beused to identify backfacing triangles on a per-segmentbasis instead of determining this information for each
triangle which removes data invisible due to the pro-jection. Since the cylinders are rendered as single tri-angle strips, the connectivity information can also beexploited when rendering the model; e.g., for backfaceculling as described later. Different levels of detail canbe defined based on the precision at which a coniccylinder is drawn by reducing the number of points foreach delimiting circle of the cylinders.
In the current implementation, three levels of detailare used: a full resolution level where each conic cyl-inder is represented by 16 triangles, a reduced levelwith 8 triangles per cylinder, and a low level of detailthat skips every other segment and renders eachremaining cylinder with 8 triangles. Obviously, the lowlevel-of-detail mode should only be used in areas faraway from the view point and mostly occluded; i.e.,covered by a multitude of other vessel segments andtherefore almost invisible. However, since it is almostcompletely occluded, a user would need to rotate orzoom in order to inspect this part of the vasculature.Once such an area is rotated and therefore more visi-ble, the system would automatically increase the levelof detail. Similarly, cracks that occur at the transitionbetween different levels of detail are not noticeablebecause these transitions occur sufficiently far from theview point and only in at least partly occluded areas.
In order to decide the resolution for a particularsegment, one could determine the distance between thecurrent camera position and the segment itself ordetermine the number of pixels that would be projectedonto the screen to represent this segment. However,due to the enormous amount of segments, the com-putational effort is too costly which would slow downthe rendering speed to several seconds per frame evenfor the LCx data set. In fact, computing the distancesbetween all vessel segments and the camera would takelonger than computing the projected image for theentire data set without any reduction techniques.
To remedy the situation, a spatial data structure isused. It is essential to the overall performance of thesystem that a simple data structure is used which re-quires only minimal computation. Hence, a simplesubdivision scheme of the space covered by the data setis used. This space is equally divided in each dimensioninto sub-areas of the same size. Then, only the distancebetween the center of this sub-area and the cameraneeds to be calculated during the rendering process todetermine the level of detail for the whole sub-area.Based on a set of thresholds provided by the user, allsegments contained in each sub-area are rendered infull, reduced, or low level of detail, respectively. Thesethresholds describe the distance between the center ofthe sub-area and the camera at which the algorithmwill automatically switch to a lower geometric resolu-tion. Using this type of geometry reduction, the
WISCHGOLL et al.
number of triangles (e.g., the LCx coronary artery) canbe reduced from 25 million to about 20 million trian-gles without introducing noticeable artifacts.
Backface Culling
To reduce the number of triangles even further, alltriangles that are located at the backside of the coniccylinders facing away from the camera can be removedsince they are not visible. OpenGL is able to removethe backfacing triangles but then they still have to betransmitted to and processed by the graphics card. Inorder to avoid transmitting this amount of informa-tion, these triangles can be identified in software on theCPU. Of course, a particular vessel segment can bealigned at virtually any angle to the viewing directionwith respect to the first triangle within the trianglestrip. Therefore, the set of triangles facing backwardcan be different for each individual vessel segment.This implies that the computation has to be done foreach vessel segment individually. Consequently, thesecomputations have to be carried out in a very efficientway in order to avoid slowing down the renderingprocess. Again, the fact that the topology of a vesselsegment is known can be exploited. Each vessel seg-ment is represented by a conic cylinder. Consequently,usually one half of the cylinder is visible, while theother half is not. The triangles representing the invis-ible half can be identified using the normal vectorssince these are computed in such a way that they arealways pointing outwards with respect to the coniccylinder. One approach for identifying those triangleswith normals facing away from the view point is tocheck the normals of every triangle individually. Thiswould represent a computational burden and slowdown the rendering process. Since the vessel segmentsare rendered as triangle strips, both the visible and theinvisible halves are represented by two sets of consec-utive triangles. Thus, in order to identify the set ofback-facing triangles only, the transition from triangleswith normals facing towards the camera and thosepointing away from the camera has to be found whichis significantly less expensive computationally. Conse-quently, only the triangles facing the camera which arevisible triangles need to be drawn resulting in a sig-nificant reduction in the number of triangles that needto be sent to the graphics hardware.
Occlusion-Based Reduction
Another way of reducing the number of trianglesrequired for a geometric representation of the vascularstructure is to remove triangles that represent coniccylinders which are hidden behind a multitude of othervessel segments with respect to the current projection(referred to as occlusion). In a tree-shaped data set,
complete occlusion is not likely to occur since a singlesegment does not significantly obstruct the geometrylocated behind it. Many of the segments need to be co-located and packed very densely in a particular area toocclude other parts of the vascular tree. However,complete occlusion is not likely to occur. Thus, thoseparts of the tree which are detected as (partly) occludedare still displayed using the lowest level of detail.
The present software system employs occlusionqueries implemented in OpenGL 1.5.30 During such aquery, the OpenGL library keeps track of whether thespecified graphical primitives result in pixels actuallydrawn to the projected image. In contrast to theGL_HP-occlusion_test, which only returns a binarytrue or false result depending on whether pixels weredrawn or not, the occlusion queries defined in OpenGL1.5 allow the retrieval of the number of fragments(pixels) that contribute to the current projected imageduring the query. Assuming frame coherence (twoconsecutive projected images being similar), we can usethese queries to check for occlusion. By drawing abounding box of a sub-area, these queries allow thesoftware to determine how much of a specific sub-areais visible based on the previous projected image. Thesesub-areas are identical to the ones defined by the spa-tial data structure used for the previously describedgeometry reduction; i.e., an equidistant sub-divisioninto cubical areas. Based on a user-defined thresholddescribing the number of pixels that need to be visible,the present system can determine the level-of-detail tobe used for the vessel segments contained in this sub-area. The smaller the threshold the less vessels are re-quired to occlude a sub-area. Since the vessel segmentsare spread over the entire volume relatively evenly, amore sophisticated sub-division technique such asbinary-space-partitioning (BSP) trees or k-d trees,which sub-divide space recursively at arbitrary planesinstead of using a fixed scheme, would not result in asignificant improvement. Also, a simpler sub-divisionscheme allows for faster processing of the individualsub-elements during testing for occlusion.
For each element of the sub-division, a hardwareocclusion query is issued as described above to checkhow many fragments pass the depth test; i.e., con-tribute to the current projected image. This results inan estimate of how much of the specific sub-areacontributes to the current projected image. To avoidactual drawing of the bounding boxes, the color maskis set to zero in OpenGL. Similarly, the OpenGL depthbuffer is marked as read-only to prevent the boundingboxes from changing the depth values and thereforeoccluding each other.
Occlusion queries supported on GeForce 3 andsubsequent NVidia GPUs allow many queries to beperformed simultaneously. Therefore, all bounding
Visualization of Entire Coronary Arterial Tree
boxes that are needed for the occlusion queries aredrawn first. The result of each occlusion query is storedin the memory of the graphics hardware. To avoidstalling of the graphics pipeline, the result is read backonly once for all sub-areas after all occlusion queriesare finished. Each occlusion query returns the numberof fragments of the bounding box that would actuallypass the depth test and would have been drawn if thecolor mask would not have been set to zero. Conse-quently, an occlusion query provides a precise measureof how much of a certain sub-area is occluded. Basedon a user-specified threshold, the rendering system canthen decide whether to draw the vessel segments con-tained in that specific area at the full level or at a lowerlevel of detail.
Out-of-Core Rendering
Since the whole data set representing the completemodel of the arterial vascular tree does not fit into themain memory of regular desktop computers, an out-of-core method was implemented to support largerdata sets. This technique uses hard drives as mainstorage medium, while main memory is only used forcaching data. In this way, only the portion of the dataset which the algorithm is currently using needs to bepresent in main memory. The system automaticallyupdates this portion; i.e., the system loads anotherportion of the data set into main memory and removesanother whenever necessary. This enables rendering ofthe entire model of the vasculature on current com-modity hardware. In this approach, the geometry isdetermined in a pre-computational step. For each ofthe spatial sub-areas that are used during the render-ing, the triangles needed for displaying all of the vesselsegments contained in this specific sub-area are com-puted and then stored in a file. After that, the geometrydata can be removed from main memory. Using such astreaming technique reduces the memory footprintsignificantly. In our experiments the memory con-sumption of the software implementation was less than64 MB (as observed via the Windows task manager).
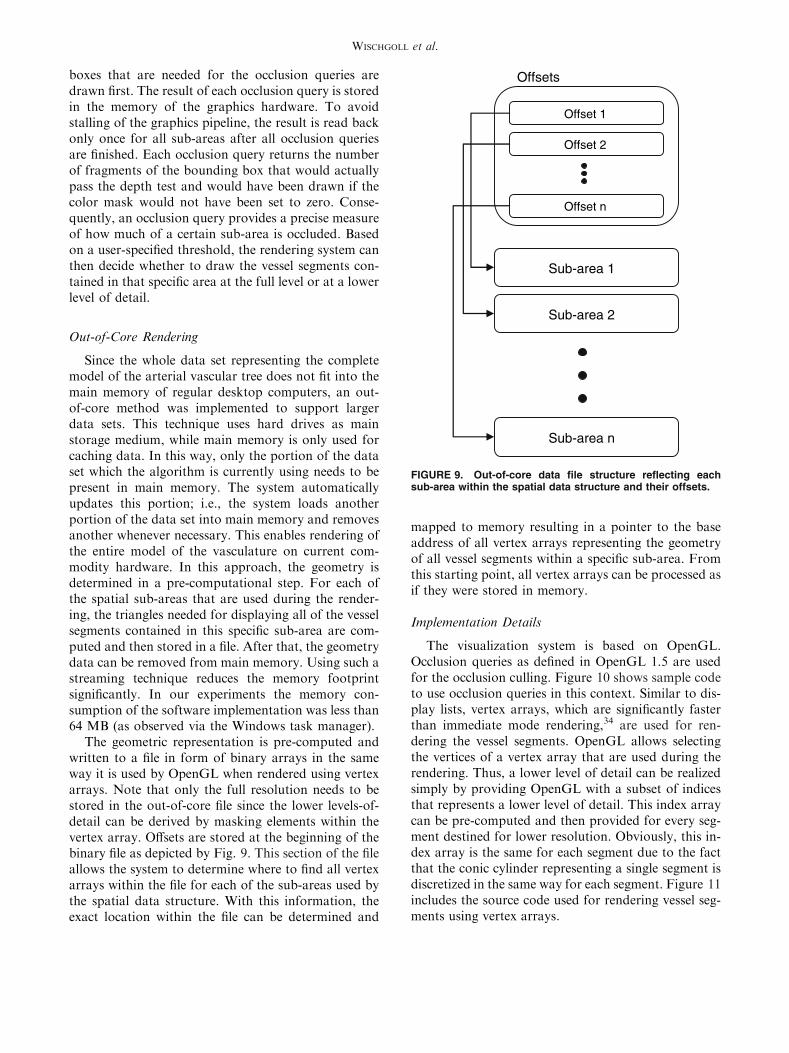
The geometric representation is pre-computed andwritten to a file in form of binary arrays in the sameway it is used by OpenGL when rendered using vertexarrays. Note that only the full resolution needs to bestored in the out-of-core file since the lower levels-of-detail can be derived by masking elements within thevertex array. Offsets are stored at the beginning of thebinary file as depicted by Fig. 9. This section of the fileallows the system to determine where to find all vertexarrays within the file for each of the sub-areas used bythe spatial data structure. With this information, theexact location within the file can be determined and
mapped to memory resulting in a pointer to the baseaddress of all vertex arrays representing the geometryof all vessel segments within a specific sub-area. Fromthis starting point, all vertex arrays can be processed asif they were stored in memory.
Implementation Details
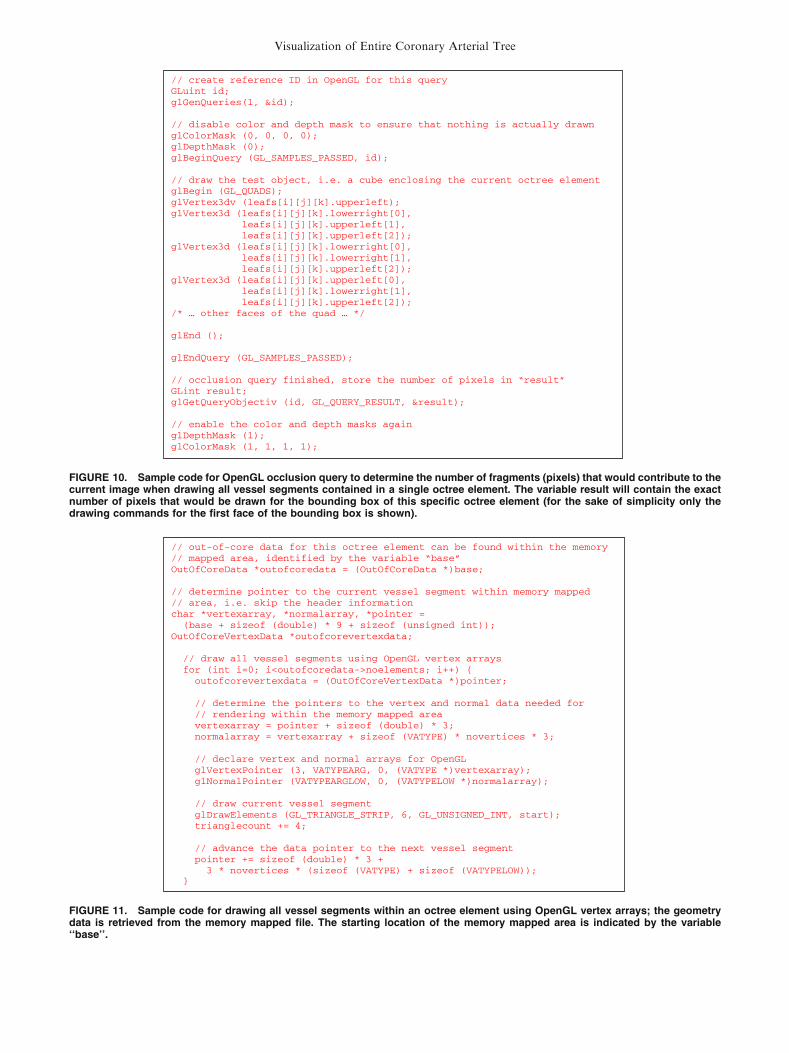
The visualization system is based on OpenGL.Occlusion queries as defined in OpenGL 1.5 are usedfor the occlusion culling. Figure 10 shows sample codeto use occlusion queries in this context. Similar to dis-play lists, vertex arrays, which are significantly fasterthan immediate mode rendering,34 are used for ren-dering the vessel segments. OpenGL allows selectingthe vertices of a vertex array that are used during therendering. Thus, a lower level of detail can be realizedsimply by providing OpenGL with a subset of indicesthat represents a lower level of detail. This index arraycan be pre-computed and then provided for every seg-ment destined for lower resolution. Obviously, this in-dex array is the same for each segment due to the factthat the conic cylinder representing a single segment isdiscretized in the same way for each segment. Figure 11includes the source code used for rendering vessel seg-ments using vertex arrays.
Sub-area 1
Sub-area 2
Sub-area n
Offset 1
Offsets
Offset 2
Offset n
FIGURE 9. Out-of-core data file structure reflecting eachsub-area within the spatial data structure and their offsets.
WISCHGOLL et al.
// create reference ID in OpenGL for this query GLuint id; glGenQueries(1, &id);
// disable color and depth mask to ensure that nothing is actually drawn glColorMask (0, 0, 0, 0); glDepthMask (0); glBeginQuery (GL_SAMPLES_PASSED, id);
// draw the test object, i.e. a cube enclosing the current octree element glBegin (GL_QUADS); glVertex3dv (leafs[i][j][k].upperleft); glVertex3d (leafs[i][j][k].lowerright[0], leafs[i][j][k].upperleft[1], leafs[i][j][k].upperleft[2]); glVertex3d (leafs[i][j][k].lowerright[0], leafs[i][j][k].lowerright[1], leafs[i][j][k].upperleft[2]); glVertex3d (leafs[i][j][k].upperleft[0], leafs[i][j][k].lowerright[1], leafs[i][j][k].upperleft[2]); /* … other faces of the quad … */
glEnd ();
glEndQuery (GL_SAMPLES_PASSED);
// occlusion query finished, store the number of pixels in “result” GLint result; glGetQueryObjectiv (id, GL_QUERY_RESULT, &result);
// enable the color and depth masks again glDepthMask (1); glColorMask (1, 1, 1, 1);
FIGURE 10. Sample code for OpenGL occlusion query to determine the number of fragments (pixels) that would contribute to thecurrent image when drawing all vessel segments contained in a single octree element. The variable result will contain the exactnumber of pixels that would be drawn for the bounding box of this specific octree element (for the sake of simplicity only thedrawing commands for the first face of the bounding box is shown).
// out-of-core data for this octree element can be found within the memory // mapped area, identified by the variable “base” OutOfCoreData *outofcoredata = (OutOfCoreData *)base;
// determine pointer to the current vessel segment within memory mapped // area, i.e. skip the header information char *vertexarray, *normalarray, *pointer = (base + sizeof (double) * 9 + sizeof (unsigned int)); OutOfCoreVertexData *outofcorevertexdata;
// draw all vessel segments using OpenGL vertex arrays for (int i=0; i<outofcoredata->noelements; i++) { outofcorevertexdata = (OutOfCoreVertexData *)pointer;
// determine the pointers to the vertex and normal data needed for // rendering within the memory mapped area vertexarray = pointer + sizeof (double) * 3; normalarray = vertexarray + sizeof (VATYPE) * novertices * 3;
// declare vertex and normal arrays for OpenGL glVertexPointer (3, VATYPEARG, 0, (VATYPE *)vertexarray); glNormalPointer (VATYPEARGLOW, 0, (VATYPELOW *)normalarray);
// draw current vessel segment glDrawElements (GL_TRIANGLE_STRIP, 6, GL_UNSIGNED_INT, start); trianglecount += 4;
// advance the data pointer to the next vessel segment pointer += sizeof (double) * 3 +
3 * novertices * (sizeof (VATYPE) + sizeof (VATYPELOW)); }
FIGURE 11. Sample code for drawing all vessel segments within an octree element using OpenGL vertex arrays; the geometrydata is retrieved from the memory mapped file. The starting location of the memory mapped area is indicated by the variable‘‘base’’.
Visualization of Entire Coronary Arterial Tree
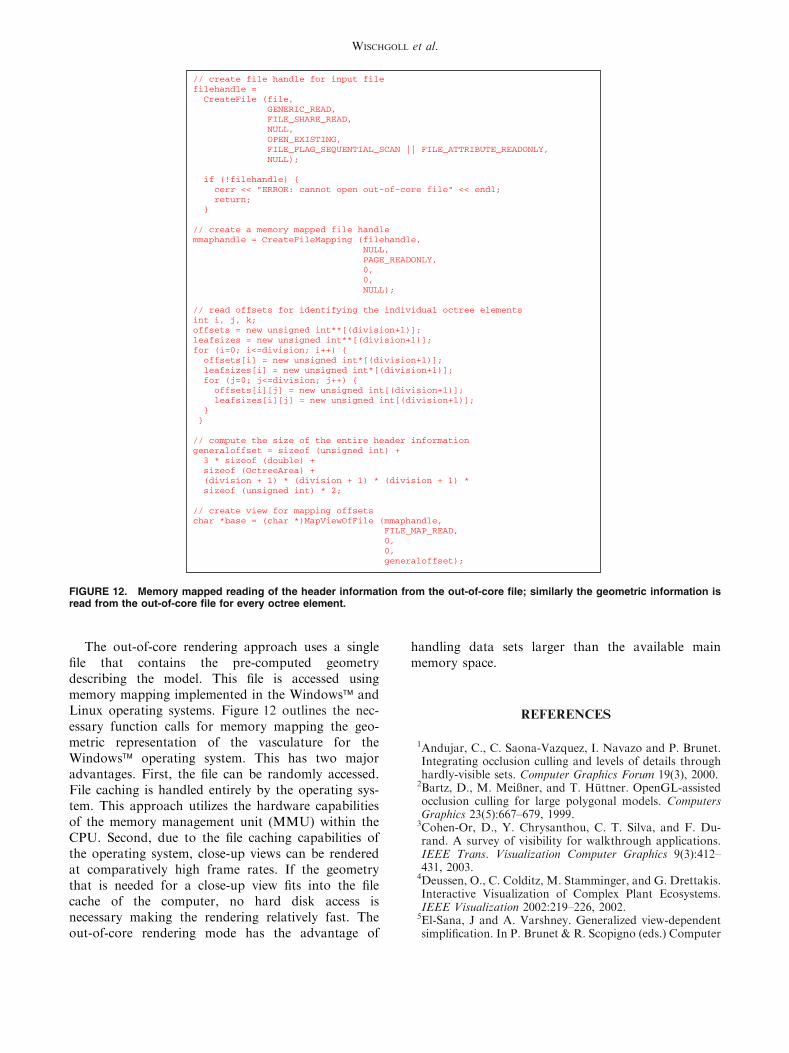
The out-of-core rendering approach uses a singlefile that contains the pre-computed geometrydescribing the model. This file is accessed usingmemory mapping implemented in the Windows� andLinux operating systems. Figure 12 outlines the nec-essary function calls for memory mapping the geo-metric representation of the vasculature for theWindows� operating system. This has two majoradvantages. First, the file can be randomly accessed.File caching is handled entirely by the operating sys-tem. This approach utilizes the hardware capabilitiesof the memory management unit (MMU) within theCPU. Second, due to the file caching capabilities ofthe operating system, close-up views can be renderedat comparatively high frame rates. If the geometrythat is needed for a close-up view fits into the filecache of the computer, no hard disk access isnecessary making the rendering relatively fast. Theout-of-core rendering mode has the advantage of
handling data sets larger than the available mainmemory space.
REFERENCES
1Andujar, C., C. Saona-Vazquez, I. Navazo and P. Brunet.Integrating occlusion culling and levels of details throughhardly-visible sets. Computer Graphics Forum 19(3), 2000.2Bartz, D., M. Meißner, and T. Huttner. OpenGL-assistedocclusion culling for large polygonal models. ComputersGraphics 23(5):667–679, 1999.3Cohen-Or, D., Y. Chrysanthou, C. T. Silva, and F. Du-rand. A survey of visibility for walkthrough applications.IEEE Trans. Visualization Computer Graphics 9(3):412–431, 2003.4Deussen, O., C. Colditz, M. Stamminger, and G. Drettakis.Interactive Visualization of Complex Plant Ecosystems.IEEE Visualization 2002:219–226, 2002.5El-Sana, J and A. Varshney. Generalized view-dependentsimplification. In P. Brunet & R. Scopigno (eds.) Computer
// create file handle for input file filehandle = CreateFile (file, GENERIC_READ, FILE_SHARE_READ, NULL, OPEN_EXISTING, FILE_FLAG_SEQUENTIAL_SCAN || FILE_ATTRIBUTE_READONLY, NULL);
if (!filehandle) { cerr << "ERROR: cannot open out-of-core file" << endl; return; }
// create a memory mapped file handle mmaphandle = CreateFileMapping (filehandle, NULL, PAGE_READONLY, 0, 0, NULL);
// read offsets for identifying the individual octree elements int i, j, k; offsets = new unsigned int**[(division+1)]; leafsizes = new unsigned int**[(division+1)]; for (i=0; i<=division; i++) { offsets[i] = new unsigned int*[(division+1)]; leafsizes[i] = new unsigned int*[(division+1)]; for (j=0; j<=division; j++) { offsets[i][j] = new unsigned int[(division+1)]; leafsizes[i][j] = new unsigned int[(division+1)]; } }
// compute the size of the entire header information generaloffset = sizeof (unsigned int) + 3 * sizeof (double) + sizeof (OctreeArea) + (division + 1) * (division + 1) * (division + 1) * sizeof (unsigned int) * 2;
// create view for mapping offsets char *base = (char *)MapViewOfFile (mmaphandle, FILE_MAP_READ, 0, 0, generaloffset);
FIGURE 12. Memory mapped reading of the header information from the out-of-core file; similarly the geometric information isread from the out-of-core file for every octree element.
WISCHGOLL et al.
Graphics Forum (Eurographics 99), Vol. 18(3). The Eu-rographics Association and Blackwell Publishers: 83–94,1999.6El-Sana J., Sokolovsky, C. T. Silva. 2001 Integratedocclusion culling with view-dependent rendering. IEEEVisualization 2001:371–378, 2001.7El-Sana, J. and E. Bachmat. Optimized view-dependentrendering for large polygonial datasets. IEEE Visualization2002:77–84, 2002: IEEE Computer Society.8Felkel, P, A. L. Fuhrmann, A. Kanitasar, and R. Wegen-kittel. Surface reconstruction of the branching vessels foraugmented reality aided surgery, BIOSIGNAL, Vol. 1,VUTIUM Press: 252–254, 2002.9Gerig, G., T. Koller, G. Szehely, C. Brechbuhler, O. Ku-bler. Symbolic description of 3-D structures applied tocerebral vessel tree obtained from MR angiography vol-ume data, Information Processing in Medical Imaging,Springer, LNCS: 94–111, 1993.
10Greene, N. Hierarchical polygon tiling with coveragemasks. ACM SIGGRAPH 1996:65–74, 1996.
11Gumhold, S. Splatting Illuminated Ellipsoids with DepthCorrection. In Proceedings of 8th International FallWorkshop on Vision, Modelling and Visualization 2003:245–252, 2003.
12Hahn, H. K., B. Preim, D. Selle, and H. O. Peitgen.Visualization and interaction techniques for the explora-tion of vascular structures. In IEEE Visualization 2001:395–402, 2001: IEEE, IEEE Computer Society Press.
13Hoppe, H. Progressive meshes. ACM SIGGRAPH1996:99–108, 1996.
14Hoppe, H. Efficient implementation of progressive meshes.Computers Graphics 22(1):27–36, 1998: ISSN 0097–8493.
15Kaimovitz, B., Y. Lanir, and G. S. Kassab. Large-Scale 3-D Geometric Reconstruction of the Porcine CoronaryArterial Vasculature Based on Detailed Anatomical Data.Ann. Biomed. Eng. 33(11):1517–1535, 2005.
16Kassab, G. S., C. A. Rider, N. J. Tang, and Y. C. Fung.Morphometry of pig coronary arterial trees. Am. J. Physiol.265(Heart Circ. Physiol. 34):H350–H365, 1993.
17Klosowski, J. T. and C. T. Silva. Efficient conservativevisibility culling using the prioritized-layered projectionalgorithm. IEEE Trans. Visualization Computer Graphics7(4):365–379, 2001.
18Linsen, L., B. J. Karis, E. G. McPherson, and B. Hamann.Tree Growth Visualization. J. WSCG 13:81–88, 2005.
19Masutani, Y., K. Masamune and T. Dohi. Region-grow-ing-based feature extraction algorithm for tree-like objects.Visualization in Biomedical Computing, Springer, LNCS:161–171, 1996.
20Nordsletten, D. A., S. Blackett, M. D. Bentley, E. L. Rit-man, and N. P. Smith. Structural Morphology of RenalVasculature. Am. J. Physiol. Heart Circ. Physiol.291:H296–H309, 2006.
21Oeltze, S., B. Preim. Visualization of Anatomic TreeStructures with Convolution Surfaces, IEEE/EurographicsSymposium on Visualization: 311–320, 2004.
22Oeltze, S. and B. Preim. Visualization of Vasculature withConvolution Surfaces: Method, Validation and Evaluation.IEEE Trans. Medical Imaging 24(4):540–548, 2005.
23Pajarola, R. FastMesh: efficient view-dependent meshing.In B. Werner (ed.) Proceedings of the ninth Pacific
Conference on Computer Graphics and Applications(PACIFIC GRAPHICS-01). IEEE Computer Society, LosAlamitos, CA, Oct. 16–18: 22–30, 2001.
24Puig, A., D. Tost, and I. Navazo. An interactive celebralblood vessel exploration system. IEEE Visualization97:443–446, 1997.
25Reina, G. and T. Ertl. Hardware-Accelerated Glyphs forMono- and Dipoles in Molecular Dynamics Visualization,Proceedings of EUROGRAPHICS – IEEE VGTC Sym-posium on Visualization 2005: 177–182, 2005.
26Ritman, E. L. Micro-computed tomography-current statusand developments. Annu. Rev. Biomed. Eng. 6:185–208,2004.
27Robb, R. A.. The Biomedical Imaging Resource at MayoClinic. Guest Editorial. IEEE Trans. Med. Imaging20(9):854–867, 2001.
28Robb, R. A. and C. Barillot. Interactive display andanalysis of 3-D medical images. IEEE Trans Med Imaging8(3):217–226, 1989.
29Robb, R. A., D. Hanson, R. A. Karwoski, A. G. Larson,E. L. Workman, and M. C. Stacy. ANALYZE: a com-prehensive, operator-interactive software package formultidimensional medical image display and analysis.Computerized Med Imaging Graphics 13:433–454, 1989.
30Segal, M. and K. Akeley. The OpenGL� Graphics System:A Specification (Version 2.0–October 22, 2004), http://www.opengl.org/documentation/specs/version2.0/glspec20.pdf.
31Shaffer, E. and M. Garland. Efficient Adaptive Simplifi-cation of Massive Meshes. In IEEE Visualization 2001:127–134, 2001.
32Spaan, J. A., R. ter Wee, J. W. van Teeffelen, G. Streekstra,M. Siebes, C. Kolyva, H. Vink, D. S. Fokkema, and E.VanBavel. Visualization of intramural coronary vascula-ture by an imaging cryomicrotome suggests compartmen-talization of myocardial perfusion areas. Med. Biol. Eng.Comput. 43(4):431–435, 2005.
33Stoll, C., S. Gumhold, and H. Seidel. Visualization withstylized line primitives. IEEE Visualization 2005:695–702,2005.
34Woo, M., J. Neider, and T. Davis. OpenGL ProgrammingGuide. Addison Wesley, 3rd edn, 2003.
35Xia, J., J. El-Sana, and A. Varshney. Adaptive real-timelevel-of-detail-based rendering for polygonial models.IEEE Trans. Visualization Computer Graphics 3(2):171–183, 1997.
36Yoon, S. E., B. Salomon, and D. Manocha. Interactiveview-dependent rendering with conservative occlusionculling in complex environments. IEEE Visualization 2003Proceedings: 163–170, 2003.
37Yoon, S. E., B. Salomon, R. Gayle, and D. Manocha.Quick-VDR: Interactive View-Dependent Rendering ofMassive Models. In IEEE Visualization 2004 Proceedings:131–138, 2004.
38Zamir, M. Nonsymmetrical bifurcations in arterialbranching. J. General Physiol. 72(6):837–845, 1978.
39Zhang, H., D. Manocha, T. Hudson, and K. E. Hoff III.Visibility culling using hierarchical occlusion maps. Com-puter Graphics 31 (Annual Conference Series): 77–88, 1997.
Visualization of Entire Coronary Arterial Tree