Embed Size (px)
Citation preview
A novel time efficient learning‑based approach for smart intrusion detection systemSugandh Seth* , Gurvinder Singh and Kuljit Kaur Chahal
IntroductionThe spread and susceptibility of cyberspace have necessitated its perpetual appraisal in terms of security. The world has witnessed enormous cyber-attacks such as data breaches that exposed millions of credit and debit card information to attackers, cyber warfare, corporate espionage, Internet of Things (IoT) attacks, social engineering attacks, crypto-jacking attacks, etc. All successful attacks exploited the prevalent vulnerabilities in the systems. Besides other security mechanisms like firewalls, secure information storage,
Abstract
Background: The ever increasing sophistication of intrusion approaches has led to the dire necessity for developing Intrusion Detection Systems with optimal efficacy. However, existing Intrusion Detection Systems have been developed using outdated attack datasets, with more focus on prediction accuracy and less on prediction latency. The smart Intrusion Detection System framework evolution looks forward to designing and deploying security systems that use various parameters for analyzing current and dynamic traffic trends and are highly time-efficient in predicting intrusions.
Aims: This paper proposes a novel approach for a time-efficient and smart Intrusion Detection System.
Method: Herein, we propose a Hybrid Feature Selection approach that aims to reduce the prediction latency without affecting attack prediction performance by lowering the model’s complexity. Light Gradient Boosting Machine (LightGBM), a fast gradient boosting framework, is used to build the model on the latest CIC-IDS 2018 dataset.
Results: The proposed feature selection reduces the prediction latency ranging from 44.52% to 2.25% and the model building time ranging from 52.68% to 17.94% in vari-ous algorithms on the CIC-IDS 2018 dataset. The proposed model with hybrid feature selection and LightGBM gives 97.73% accuracy, 96% sensitivity, 99.3% precision rate, and comparatively low prediction latency. The proposed model successfully achieved a raise of 1.5% in accuracy rate and 3% precision rate over the existing model. An in-depth analysis of network parameters is also performed, which gives a deep insight into the variation of network parameters during the benign and malicious sessions.
Keywords: Intrusion Detection System, Realistic, Responsive, Imbalanced Dataset, Machine Learning, Prediction latency, Time-Efficient, Hybrid Feature Selection, CIC-IDS-2018
Open Access
© The Author(s), 2021. Open Access This article is licensed under a Creative Commons Attribution 4.0 International License, which permits use, sharing, adaptation, distribution and reproduction in any medium or format, as long as you give appropriate credit to the original author(s) and the source, provide a link to the Creative Commons licence, and indicate if changes were made. The images or other third party material in this article are included in the article’s Creative Commons licence, unless indicated otherwise in a credit line to the mate-rial. If material is not included in the article’s Creative Commons licence and your intended use is not permitted by statutory regulation or exceeds the permitted use, you will need to obtain permission directly from the copyright holder. To view a copy of this licence, visit http:// creat iveco mmons. org/ licen ses/ by/4. 0/.
RESEARCH
Seth et al. J Big Data (2021) 8:111 https://doi.org/10.1186/s40537‑021‑00498‑8
*Correspondence: [email protected] Dept. of Computer Science and Engg., Guru Nanak Dev University, Amritsar, India

Page 2 of 28Seth et al. J Big Data (2021) 8:111
authentication, and authorization techniques, an Intrusion Detection System (IDS) is also strongly recommended [1].
Some Intrusion Detection Systems observe network activity and warn if there is any suspicious event, while others also perform actions after detecting threats. IDSs are broadly classified into two categories, anomaly, and misuse, based on their detection criterion [2]. An anomaly-based IDS detects network intrusions by scrutinizing system activities and categorizing them as either normal or malicious. Most IDSs operate on misuse detection techniques i.e. looking and alarming for ’known patterns’ of the detri-mental activity. Although accurate, this kind of IDS limits itself by looking up the list of recognized attacks. Its primary disadvantage is that it will not be effective for protection from any new attack whose signatures are not previously integrated. This leaves a major security gap in the system that can be easily exploited by an attacker to fool the IDS. There is a dire need to upgrade such an IDS frequently to detect new attack signatures and the already known ones.
Machine learning and deep learning are commonly used techniques to integrate an IDS with intelligence, allowing easy detection of all kinds of attacks, thus safeguarding the systems from all sorts of threats [3]. However, to build an efficient machine learning model for intrusion detection, selecting the right dataset is key. Various machine learn-ing techniques that exist today are applied to publicly available IDS datasets, namely, DARPA [4], KDD 99 [5], KOYOTO [6], and NSLKDD [7]. The major drawback of the designed systems using the above datasets is that these datasets are old and do not reflect modern-day traffic trends.
Furthermore, many researchers have proposed machine learning models for IDS, with most of them considering accuracy as the most critical metric for evaluating the pro-posed models. However, accuracy alone is insufficient to analyze a system’s performance because IDSs make predictions in real-time. Besides accuracy, evaluating an IDS on the time it may take to make a prediction (a.k.a. prediction latency) is also essential. How-ever, while increasing the prediction accuracy, most researchers have not measured its impact on prediction latency. Moreover, along with accuracy and prediction latency, a high-performing IDS should have a high true positive prediction rate. False-positive (misclassified as an attack) and false negative (misclassified as benign) cannot be treated equally. While false positives can result in additional system resources, false negatives can debilitate the entire system. Thus, along with accuracy, recall rate and prediction latency are very important for evaluating an IDS model’s performance.
This paper proposes a novel machine learning approach to implement a fast and pre-cise IDS using the latest CIC-IDS 2018 dataset to overcome the above research gaps. The major contributions of the paper are as follows.
• A realistic IDS that can effectively detect the majority of modern-day attacks.• A hybrid feature selection approach optimized for low prediction latency.• An IDS model using proposed Hybrid Feature Selection and the fast Light GBM
machine learning algorithm gives promising results with better accuracy, recall rate, and low prediction latency.
• Deep insight into the comparison between the network parameters observed during the benign and the malicious sessions.
Page 3 of 28Seth et al. J Big Data (2021) 8:111
The rest of the paper is organized as follows—section “Related work” reviews existing literature on intrusion detection using machine learning. Section “Research methodol-ogy” discusses the methodology for the research including an extensive description of data preparation steps. Section “Results and analysis” discusses the results. The paper concludes with a summary of the findings in Sect. “Conclusion”.
Related workMachine learning techniques [8] are widely used for building Intrusion Detection Sys-tems. In this context, classification refers to the process of using machine learning algorithms to identify normal versus malicious activity within a dataset, representing network traffic, for designing an anomaly-based IDS. Zhou et al. [9] proposed an intelli-gent Intrusion Detection System based on feature selection and ensemble classifier. They proposed the CFS-BA Ensemble method for multi-attack classification that uses cor-relation for feature selection, then the ensemble classifier based on c4.5, Random For-est (RF), and Forest by Penalizing Attributes (Forest PA) with Average of Probabilities (AOP) rule. They claimed that the classifier gives 99% accuracy for NSL KDD and CIC-IDS 2017 Dataset. The major drawback of the proposed system is that the author has not evaluated the proposed model in terms of time efficiency. Saleh et al. [10] suggested a hybrid Intrusion Detection System based on prioritized k-Nearest Neighbors (kNN) and optimized Support Vector Machines (SVM) classifiers on three intrusion detection data-sets: KDD Cup99, NSL-KDD, and koyotto 2006 + datasets. This hybrid Intrusion Detec-tion System uses the Naïve Bayes feature selection method for dimensionality reduction of the data set and an optimized SVM for outlier detection. A prioritized kNN classi-fier is then used for classification. The proposed method comprises 4 modules (i) Data pre-processing Module (DPM), (ii) Feature Selection Module (FSM), (iii) Outlier Rejec-tion Module (ORM), and (iv) Decision-Making Module (DMM). The model uses feature effect identification and mutual effect identification to select relevant features based on accuracy, and training, and testing time. The major drawback of the suggested model is that old datasets were used by the author for evaluating the performance of the given model, these datasets do not reflect modern traffic patterns. Further, there are better time-efficient machine learning algorithms than those presented by the author.
The majority of the intrusion detection datasets are skewed, so many researchers have proposed techniques to balance the dataset to enhance the detection rate. Kara-tas et al. [11] proposed a model that used SMOTE oversampling technique to balance the skewed classes in the CIC-IDS2018 dataset. The samples of the skewed classes are increased proportionately to the average sample size. Using this technique, they claim to have achieved an accuracy of 99% using RF, Decision Tree (DT), Adaboost, K Near-est Neighbor (KNN), Gradient Boosting (GB), and Linear Discriminant Analysis (LDA). Techniques such as the Genetic Algorithm (GA) are also widely used in intrusion detec-tion models. Though the author claims to have achieved 99% accuracy rate but, the sug-gested model is not evaluated for time-based metrics. Aslahi-Shahri et al. [12] proposed a model that used the Genetic Algorithm- Support Vector Machine (GA-SVM) feature selection method. A hybrid algorithm is used for feature selection. The GA divides the selected features into three priorities. These features are further used for classification. With this approach, the authors claim to have achieved a true positive value of 0.973 on

Page 4 of 28Seth et al. J Big Data (2021) 8:111
the KDD cup99 dataset. The proposed model is evaluated on the KDD cup99 dataset which fails to reflect the modern-day traffic patterns.
Many deep learning approaches are also proposed for building an efficient IDS. Lin et al. [13] proposed a dynamic anomaly detection system that used Long Short-Term Memory (LSTM) and Attention Mechanism techniques to train the neural network. They have used the latest CIC-IDS 2018 dataset. Though the proposed approach by the author achieved an accuracy rate of 96.2% but the model is not evaluated for time effi-ciency. Kanimozhi V, Prem Jacob [14] proposed an Artificial Neural Network model for detecting Botnet attacks using the CIC-IDS 2018 dataset. They claimed to have achieved an accuracy score of 99.97%. And an average area under ROC (Receiver Operator Char-acteristic) curve 0.999. Though the model achieved high accuracy score of 99.97% but it is only for botnet detection. Moreover, the model is not evaluated in terms of time efficiency. Ma et al. [15] proposed SCDNN, based on Spectral Clustering (SC) and Deep Neural Network (DNN) algorithms. The proposed method was evaluated using the KDD-Cup99 and NSL-KDD datasets and a sensor network. The authors claimed that their proposed approach outperforms Backpropagation Neural Network (BPNN), SVM, RF, and Bayes tree models in attack detection accuracy. The disadvantage of the SCDNN is that its weight parameters and DNN layer thresholds must be tuned, and the clus-ters’ k and parameters must be determined empirically rather than theoretically. Fur-thermore, the model is tested using outdated datasets, and the suggested model’s time efficiency is not measured. Ferrag et al. [16] compared several deep learning techniques. Performance of DNN, Recurrent Neural Network, Restricted Boltzmann Machine, Deep Belief Networks, Convolutional Neural Networks, Deep Boltzmann Machine, and Deep autoencoders was compared on the latest CIC-IDS 2018 dataset. The experiment was carried out on just 5% of the complete dataset. The imbalance concerns in the skewed dataset were not addressed using any approach. Furthermore, the deep learning models were only assessed for recall rate and accuracy. Additional metrics like precision rate and F-Measure were missing. Atefinia and Ahmadi [17] proposed a DNN comprising a feed-forward module, a restricted Boltzmann machine, and two Recurrent Neural Networks. The model was trained on the latest CIC-IDS 2018 dataset. No technique was used to balance the highly skewed CIC-IDS 2018 dataset. The results of the proposed approach on some of the attack categories in the CIC-IDS dataset were also missing. Vinayakumar et al. [18] proposed distributed deep learning model for attack detection in network-based intrusion detection system (NIDS) and host-based intrusion detection system (HIDS). The authors evaluated the efficacy of various machine learning algorithms and DNNs on various NIDS and HIDS datasets. A scalable hybrid intrusion detection framework called Scale-Hybrid-IDS-AlertNet (SHIA) was proposed by the author. The proposed framework is used to process a large amount of network-level and host-level events to identify various malicious characteristics and send appropriate alerts to the network administrator. In the given approach the highly skewed CIC-IDS 2018 dataset was not balanced using any method. The findings of the suggested method on several of the attack categories were also missing.
Advance learning algorithms such as Particle Swarm Optimization (PSO) and Extreme Learning are also used by some of the authors to enhance the efficiency of the Intrusion Detection Systems. Roshan et al. [19] proposed adaptive and online network intrusion
Page 5 of 28Seth et al. J Big Data (2021) 8:111
detection systems using Clustering and Extreme Machine Learning. The proposed Intru-sion Detection System consists of three parts, the Clustering Manager, the Decision-Maker, and the Update Manager. The Clustering Manager is used to cluster the training data, and the Decision-Maker is used to evaluate the clustering decisions and provide a correction proposal to the update manager. The suggested system is tested on the NSL-KDD dataset, which is now obsolete. Ali et al. [20] proposed PSO-FLN, a fast learning model (FLN) based PSO. The performance of the proposed model is evaluated using the KDD99 dataset. The author claimed that the proposed approach outperformed various learning approaches. The suggested approach was unable to detect all forms of attacks and the model’s time efficiency was also not assessed.. Aburomman and Ibne Reaz [21] proposed the Support Vector machine—K Nearest Neighbor—particle swarm optimi-zation (SVM-KNN-PSO) ensemble method for intrusion detection. They proposed an ensemble-based approach using experts. Each expert consists of five binary classifiers. The expert’s opinion is considered for every class. The voting is repeated for every obser-vation for each classifier in the expert. Weighted majority voting is used to combine the results from various experts. The suggested model is tested using the KDD99 dataset, which does not reflect the current traffic trends.
Jin et al. [22] proposed a real-time intrusion detection system based on a parallel intru-sion detection mechanism and LightGBM. The proposed model uses two approaches to achieve time efficiency without compromising the attack detection accuracy. Firstly, a light gradient boosting machine (LightGBM) is used as the intrusion detection algo-rithm. Secondly, parallel intrusion detection is used to effectively analyze traffic data. Swift IDS is based on parallel intrusion detection algorithms that have communication and coordination overheads. Moreover, the proposed model is stable with a network speed of up to 1.26 Gbps.
The above research analysis is summarized in Table 1.As listed in the above table, the majority of the research in this field is on old datasets
that do not reflect modern-day attacks. Many researchers have considered accuracy as the most important metric to evaluate the performance of IDS, whereas sensitivity is a better metric as the impact of false positives and false negatives on IDS varies signifi-cantly [23]. The majority of the previous research in this field has not evaluated the pre-diction time of classifying a request as benign or malicious. Delays in the classification process can significantly affect the system’s performance and hamper the user experi-ence. To overcome the above shortcomings in this field’s previous research, we propose a machine learning model that can detect modern-day attacks with a high attack detection rate and a low prediction latency.
Research methodologyThe study follows the standard procedure in machine learning: (1) data collec-tion, (2) data preparation, and (3) training a model on the data and evaluating model performance.
Data collection
CIC-IDS 2018 dataset was generated by Communications Security Establishment (CSE) & the Canadian Institute for Cybersecurity (CIC). The KDD CUP 99 and NSL-KDD

Page 6 of 28Seth et al. J Big Data (2021) 8:111
Tabl
e 1
Surv
ey o
f var
ious
Intr
usio
n D
etec
tion
Syst
em a
ppro
ache
s
S.
noTi
tleO
bjec
tive
Met
hod
Year
& R
ef.
Dat
aset
use
dA
dvan
tage
sD
raw
back
s
1A
hyb
rid m
etho
d co
nsis
ting
of G
A a
nd S
VM fo
r Int
ru-
sion
Det
ectio
n Sy
stem
. N
eura
l Com
putin
g an
d A
pplic
atio
ns
To b
uild
an
Intr
usio
n D
etec
-tio
n Sy
stem
usi
ng G
A a
nd
SVM
tech
niqu
es a
imin
g to
en
hanc
e th
e eff
ectiv
enes
s of
the
mea
sure
s in
det
ect-
ing
intr
usio
ns
A h
ybrid
met
hod
com
pris
-in
g of
sup
port
vec
tor
mac
hine
and
gen
etic
al
gorit
hm (G
A)
2016
[12]
KDD
cup
99Th
e hy
brid
alg
orith
m is
su
cces
sful
ly a
ble
to re
duce
th
e nu
mbe
r of f
eatu
res
from
45
to ju
st 1
0fe
atur
es w
ith a
dec
ent t
rue-
posi
tive
valu
e of
0.9
73 a
nd
0.01
7 fa
lse-
posi
tive
valu
e
The
prop
osed
mod
el is
eva
lu-
ated
on
the
KDD
cup
99
data
set w
hich
fails
to re
flect
th
e m
oder
n-da
y tr
affic
tren
ds
2A
nov
el S
VM-k
NN
-PSO
en
sem
ble
met
hod
for
Intr
usio
n D
etec
tion
Syst
em. A
pplie
d So
ft
Com
putin
g
To b
uild
an
optim
al
ense
mbl
e co
nfigu
ratio
n fo
r det
ectin
g in
trus
ions
in
an
Intr
usio
n D
etec
tion
Syst
em
(SVM
-KN
N-P
SO) e
nsem
ble
base
d on
Sup
port
Vec
tor
Mac
hine
(SVM
), K
Nea
rest
N
eigh
bor (
KNN
), an
d Pa
rti-
cle
swar
m o
ptim
izat
ion
for
dete
ctin
g in
trus
ions
2016
[21]
KDD
99Th
e au
thor
pro
pose
s a
nove
l PS
O b
ased
ens
embl
e en
surin
g be
tter
resu
lts
in c
ompa
rison
to th
e w
eigh
ted
maj
ority
alg
o-rit
hm (W
MA
)
The
prop
osed
mod
el is
eva
lu-
ated
on
the
KDD
99 d
atas
et
whi
ch fa
ils to
refle
ct th
e m
oder
n-da
y tr
affic
tren
ds
3A
hyb
rid In
trus
ion
Det
ec-
tion
Syst
em (H
IDS)
bas
ed
on p
riorit
ized
k-n
eare
st
neig
hbor
s an
d op
timiz
ed
SVM
cla
ssifi
ers
To d
esig
n a
Hyb
rid ID
S (H
IDS)
that
can
be
suc-
cess
fully
dep
loye
d in
the
real
wor
ld a
nd re
solv
e m
ulti-
clas
s cl
assi
ficat
ion
prob
lem
Hyb
rid in
trus
ion
dete
ctio
n sy
stem
bas
ed o
n pr
ior-
itize
d k-
Nea
rest
Nei
ghbo
rs
and
optim
ized
SVM
cl
assi
fiers
2017
[10]
KDD
Cup
99, N
SL-K
DD
, and
ko
yott
o 20
06+
Th
e pr
opos
ed m
odel
aim
s at
min
imiz
ing
trai
ning
and
te
stin
g an
d m
axim
izin
g th
e in
trus
ion
dete
ctio
n ra
te
Old
dat
aset
s ar
e us
ed fo
r ev
alua
ting
the
perf
orm
ance
of
the
mod
el. T
hese
dat
aset
s do
not
refle
ct m
oder
n tr
affic
tren
ds. T
here
are
bet
ter
time-
effici
ent m
achi
ne
lear
ning
alg
orith
ms
than
th
ose
pres
ente
d by
the
auth
or
4A
dapt
ive
and
onlin
e ne
t-w
ork
Intr
usio
n D
etec
tion
Syst
em u
sing
Clu
ster
ing
and
Extr
eme
Lear
ning
M
achi
nes
To b
uild
a s
yste
m c
apab
le
of d
etec
ting
know
n an
d no
vel a
ttac
ks a
nd b
eing
up
date
d as
per
the
new
da
ta tr
ends
in a
cos
t-eff
ectiv
e w
ay
An
adap
tive
fram
ewor
k fo
r int
rusi
on d
etec
tion
syst
ems
base
d on
Ext
rem
e Le
arni
ng M
achi
nes
2018
[19]
NSL
-KD
DTh
e m
etho
d pr
ovid
es fa
st
lear
ning
and
real
-tim
e de
tect
ion
capa
bilit
ies
The
prop
osed
fram
ewor
k is
ev
alua
ted
on th
e ou
tdat
ed
NSL
-KD
D d
atas
et
5A
New
Intr
usio
n D
etec
tion
Syst
em B
ased
on
Fast
Lea
rnin
g N
etw
ork
and
Part
icle
Sw
arm
Opt
imiz
a-tio
n
To b
uild
a le
arni
ng m
echa
-ni
sm b
ased
on
two
fact
ors:
the
data
set
’s na
ture
and
th
e ty
pe o
f eva
luat
ion
mea
sure
s th
at w
ill b
e us
ed
to a
sses
s th
e le
arni
ng
mec
hani
sm o
r alg
orith
m
Prop
osed
PSO
-FLN
, a
fast
-lear
ning
mod
el (F
LN)
base
d on
par
ticle
sw
arm
op
timiz
atio
n (P
SO).
The
perf
orm
ance
of t
he p
ro-
pose
d m
odel
is e
valu
ated
us
ing
the
KDD
99 d
atas
et
2018
[20]
KDD
99Th
e pr
opos
ed m
etho
d PS
O-
FLN
out
perf
orm
ed m
any
othe
r lea
rnin
g m
odel
s
The
prop
osed
mod
el c
ould
no
t effe
ctiv
ely
dete
ct a
ll at
tack
type
s. Th
e tim
e effi
cien
cy o
f the
pro
pose
d m
odel
was
not
eva
luat
ed
Page 7 of 28Seth et al. J Big Data (2021) 8:111
Tabl
e 1
(con
tinue
d)
S.
noTi
tleO
bjec
tive
Met
hod
Year
& R
ef.
Dat
aset
use
dA
dvan
tage
sD
raw
back
s
6D
eep
Lear
ning
App
roac
h fo
r Int
el-
ligen
t Int
rusi
on D
etec
tion
Syst
em
To d
evel
op a
flex
ible
an
d eff
ectiv
e In
trus
ion
Det
ectio
n Sy
stem
(ID
S)
capa
ble
of d
etec
ting
and
clas
sify
ing
unan
ticip
ated
an
d un
pred
icta
ble
cybe
r-at
tack
s
Dis
trib
uted
dee
p le
arni
ng
mod
el w
ith D
eep
Neu
ral
Net
wor
k is
pro
pose
d fo
r de
tect
ing
intr
usio
ns
2019
[18]
KDD
Cup9
9, N
SL-K
DD
, U
NSW
-NB1
5, K
yoto
, WSN
-D
S, a
nd C
ICID
S 20
17
The
prop
osed
dee
p le
arni
ng
mod
el is
trai
ned
on b
oth
Net
wor
k-Ba
sed
Intr
usio
n D
etec
tion
Syst
em (N
IDS)
da
tase
ts a
nd H
ost-
Base
d In
trus
ion
Det
ectio
n sy
stem
H
IDS
data
sets
. The
nat
ural
la
ngua
ge p
roce
ssin
g (N
LP)
tech
niqu
e is
use
d on
hos
t-le
vel e
vent
s fo
r det
ectin
g in
trus
ions
Det
aile
d in
form
atio
n on
the
stru
ctur
e an
d ch
arac
teris
tics
of th
e m
alw
are
is m
issi
ng
in th
e pr
opos
ed m
odel
. The
pr
opos
ed m
odel
was
not
tr
aine
d on
the
benc
hmar
k da
tase
ts a
nd p
redi
ctio
n tim
e w
as n
ot e
valu
ated
7D
ynam
ic N
etw
ork
Ano
mal
y D
etec
tion
Syst
em b
y U
sing
D
eep
Lear
ning
Tec
hniq
ues.
Clo
ud C
ompu
ting
To b
uild
a d
eep
neur
al n
et-
wor
k fo
r enh
ance
d at
tack
de
tect
ion
in a
n In
trus
ion
Det
ectio
n Sy
stem
Dee
p ne
ural
net
wor
k ba
sed
on L
ong
Shor
t-Ter
m M
em-
ory
(LST
M) a
nd A
tten
tion
Mec
hani
sm (A
M)
2019
[13]
CSE
-CIC
-IDS2
018
LSTM
with
Att
entio
n M
echa
-ni
sm is
use
d to
bui
ld th
e ne
ural
net
wor
k m
odel
th
at a
ddre
sses
the
time-
corr
elat
ed n
etw
ork
traffi
c cl
assi
ficat
ion
issu
es
The
time
effici
ency
met
ric
for t
he p
ropo
sed
mod
el is
m
issi
ng
8A
rtifi
cial
Inte
llige
nce-
base
d N
etw
ork
Intr
usio
n D
etec
-tio
n w
ith h
yper
-par
amet
er
optim
izat
ion
tuni
ng o
n th
e re
alis
tic c
yber
dat
aset
CSE
-C
IC-ID
S201
8 us
ing
clou
d co
mpu
ting
To b
uild
a m
odel
that
can
eff
ectiv
ely
dete
ct a
bot
net
atta
ck
Neu
ral n
etw
ork-
base
d m
odel
for C
lass
ifica
tion
of a
bot
net a
ttac
k
2019
[14]
CSE
-CIC
-IDS2
018
The
prop
osed
sys
tem
ba
sed
on A
rtifi
cial
Neu
ral
Net
wor
k ca
n be
app
lied
to
conv
entio
nal n
etw
ork
traf
-fic
ana
lysi
s, cy
ber-
phys
ical
sy
stem
traffi
c an
alys
is, a
nd
real
-tim
e ne
twor
k tr
affic
data
ana
lysi
s
The
prop
osed
mod
el is
onl
y fo
r Bot
net d
etec
tion.
Tim
e effi
cien
cy e
valu
atio
n of
the
prop
osed
mod
el is
mis
sing
9Bu
ildin
g an
effi
cien
t Int
ru-
sion
Det
ectio
n Sy
stem
ba
sed
on fe
atur
e se
lect
ion
and
ense
mbl
e cl
assi
fier
To b
uild
effi
cien
t and
acc
u-ra
te in
trus
ion
dete
ctio
n th
at c
ombi
nes
the
bene
fits
of fe
atur
e se
lect
ion
and
ense
mbl
e cl
assi
fier
Corr
elat
ion
is u
sed
for
feat
ure
sele
ctio
n, th
en
the
ense
mbl
e cl
assi
fier
base
d on
c4.
5, R
ando
m
Fore
st (R
F), a
nd F
ores
t by
Pen
aliz
ing
Att
ribut
es
(For
est P
A) w
ith A
vera
ge o
f Pr
obab
ilitie
s (A
OP)
rule
2020
[9]
NSL
KD
D a
nd C
IC-ID
S 20
17Th
e pr
opos
ed m
etho
d co
mbi
nes
the
bene
fits
of fe
atur
e se
lect
ion
and
ense
mbl
e cl
assi
fier f
or
build
ing
an e
ffici
ent a
nd
accu
rate
IDS
The
mod
el is
not
eva
luat
ed in
te
rms
of ti
me
effici
ency
Page 8 of 28Seth et al. J Big Data (2021) 8:111
Tabl
e 1
(con
tinue
d)
S.
noTi
tleO
bjec
tive
Met
hod
Year
& R
ef.
Dat
aset
use
dA
dvan
tage
sD
raw
back
s
10In
crea
sing
the
Perf
orm
ance
of
Mac
hine
Lea
rnin
g-Ba
sed
IDSs
on
an Im
bala
nced
an
d U
p-to
-Dat
e D
atas
et
To b
uild
a re
alis
tic ID
S, u
sing
an
up-
to-d
ate
secu
rity
data
set
SMO
TE o
vers
ampl
ing
tech
-ni
que
is u
sed
to b
alan
ce
the
skew
ed d
atas
et. S
ix
mac
hine
lear
ning
-bas
ed
IDSs
are
pro
pose
d us
ing
K N
eare
st N
eigh
bor,
Rand
om F
ores
t, G
radi
-en
t Boo
stin
g, A
dabo
ost,
Dec
isio
n Tr
ee, a
nd L
inea
r D
iscr
imin
ant A
naly
sis
2020
[11]
CSE
-CIC
-IDS2
018
The
auth
or a
ims
at b
alan
c-in
g th
e sk
ewed
CIC
-IDS
2018
dat
aset
by
usin
g a
synt
hetic
dat
a ge
nera
-tio
n te
chni
que:
Syn
thet
ic
Min
ority
Ove
rsam
plin
g Te
chni
que
(SM
OTE
) for
a
bett
er a
ttac
k de
tect
ion
rate
The
prop
osed
mod
el is
not
ev
alua
ted
for t
ime-
base
d m
etric
s
11A
Hyb
rid S
pect
ral C
lust
erin
g an
d D
eep
Neu
ral N
etw
ork
Ense
mbl
e A
lgor
ithm
for
Intr
usio
n D
etec
tion
in S
en-
sor N
etw
orks
To b
uild
an
Intr
usio
n D
etec
-tio
n Sy
stem
for S
enso
r N
etw
orks
SCD
NN
mod
el b
ased
on
spec
tral
clu
ster
ing
(SC
) an
d de
ep n
eura
l net
wor
k (D
NN
) alg
orith
ms
2020
[15]
KDD
-Cup
99 a
nd N
SL-K
DD
da
tase
ts a
nd a
sen
sor
netw
ork
The
prop
osed
app
roac
h ca
n effi
cien
tly c
ateg
oriz
e sp
arse
att
ack
scen
ario
s an
d in
crea
se d
etec
tion
accu
racy
in re
al-w
orld
se
curit
y sy
stem
s
The
SCD
NN
’s dr
awba
ck is
th
at it
s w
eigh
t par
amet
ers
and
DN
N la
yer t
hres
hold
s m
ust b
e op
timiz
ed, a
nd th
e cl
uste
rs’ k
and
σ p
aram
eter
s m
ust b
e ca
lcul
ated
em
piri-
cally
rath
er th
an th
roug
h m
athe
mat
ical
theo
ry.
Furt
her,
the
mod
el is
eva
lu-
ated
on
old
data
sets
and
the
time
effici
ency
met
ric fo
r th
e pr
opos
ed m
odel
is a
lso
mis
sing
12D
eep
lear
ning
for c
yber
se-
curit
y in
trus
ion
dete
ctio
n:
App
roac
hes,
data
sets
, and
co
mpa
rativ
e st
udy
To a
naly
ze d
eep
lear
ning
ap
proa
ches
for i
ntru
sion
de
tect
ion
Seve
ral d
eep
lear
ning
te
chni
ques
: Rec
urre
nt
Neu
ral N
etw
ork,
Res
tric
ted
Boltz
man
n M
achi
ne, D
eep
Belie
f Net
wor
ks, C
onvo
-lu
tiona
l Neu
ral N
etw
orks
, D
eep
Boltz
man
n M
achi
ne,
and
Dee
p A
utoe
ncod
ers
wer
e ev
alua
ted
for d
etec
t-in
g in
trus
ions
2020
[16]
CSE
-CIC
-IDS2
018
data
set
and
the
Bot-
IoT
data
set
35 w
ell-k
now
n cy
ber
data
sets
are
des
crib
ed
in th
e st
udy.
Fur
ther
pe
rfor
man
ce o
f sev
en
deep
lear
ning
app
roac
hes
is a
naly
zed
on tw
o la
test
da
tase
ts
The
expe
rimen
t was
per
-fo
rmed
onl
y on
5%
of t
he
entir
e da
tase
t. N
o te
chni
que
was
use
d to
add
ress
the
imba
lanc
e is
sues
in th
e sk
ewed
dat
aset
. Mor
eove
r, th
e de
ep le
arni
ng m
odel
s w
ere
eval
uate
d ju
st fo
r at
tack
det
ectio
n ra
te a
nd
accu
racy
. Whe
reas
oth
er
eval
uatio
n m
etric
s su
ch a
s Pr
ecis
ion
rate
, F-M
easu
re
wer
e m
issi
ng
Page 9 of 28Seth et al. J Big Data (2021) 8:111
Tabl
e 1
(con
tinue
d)
S.
noTi
tleO
bjec
tive
Met
hod
Year
& R
ef.
Dat
aset
use
dA
dvan
tage
sD
raw
back
s
13Sw
iftID
S: R
eal-t
ime
Intr
u-si
on D
etec
tion
Syst
em
base
d on
Lig
htG
BM a
nd
para
llel i
ntru
sion
det
ectio
n m
echa
nism
To d
evel
op a
n ID
S th
at is
ca
pabl
e of
pro
cess
ing
larg
e am
ount
s of
traffi
c da
ta o
n hi
gh-s
peed
ne
twor
ks p
rom
ptly
whi
le
mai
ntai
ning
a h
igh
leve
l of
dete
ctio
n pe
rfor
man
ce
Swift
intr
usio
n de
tect
ion
mod
el is
pro
pose
d ba
sed
on li
ght g
radi
ent b
oost
ing
mac
hine
(Lig
htG
BM) a
nd
para
llel i
ntru
sion
det
ectio
n te
chni
ques
2020
[22]
KDD
99, N
SL-K
DD
, and
C
ICID
S201
7A
par
alle
l int
rusi
on d
etec
tion
mec
hani
sm is
pro
pose
d to
sp
eed
up th
e ex
ecut
ion
of
intr
usio
n de
tect
ion
cycl
es
Swift
IDS
is b
ased
on
para
llel
intr
usio
n de
tect
ion
tech
-ni
ques
whi
ch a
re s
ubje
cted
to
com
mun
icat
ion
and
coor
dina
tion
over
head
s. M
oreo
ver,
the
prop
osed
m
odel
is s
tabl
e w
ith a
net
-w
ork
spee
d up
to 1
.26G
bps
14N
etw
ork
intr
usio
n de
tect
ion
usin
g M
ulti-
Arc
hite
ctur
al
Mod
ular
Dee
p N
eura
l N
etw
ork
To b
uild
an
Intr
usio
n D
etec
-tio
n Sy
stem
with
a lo
w
fals
e-po
sitiv
e ra
te
Dee
p N
eura
l Net
wor
k co
mpr
isin
g a
feed
-forw
ard
mod
ule,
a re
stric
ted
Boltz
-m
ann
mac
hine
, and
two
Recu
rren
t Neu
ral N
etw
orks
2021
[17]
CIC
-IDS
2018
The
mod
el is
bui
lt us
ing
the
late
st C
IC-ID
S 20
18 d
atas
etN
o te
chni
que
was
use
d to
ba
lanc
e th
e hi
ghly
ske
wed
C
IC-ID
S 20
18 d
atas
et. T
he
resu
lts o
f the
pro
pose
d ap
proa
ch o
n so
me
of th
e at
tack
cat
egor
ies
in th
e C
IC-ID
S da
tase
t wer
e al
so
mis
sing
Page 10 of 28Seth et al. J Big Data (2021) 8:111
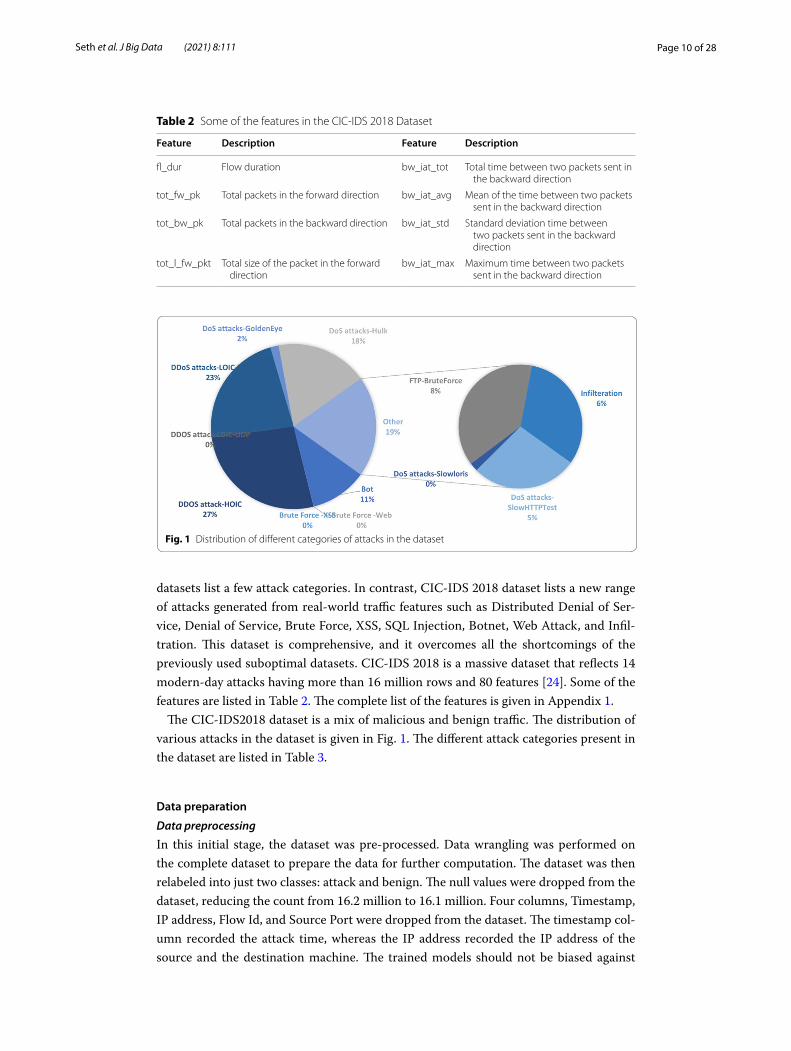
datasets list a few attack categories. In contrast, CIC-IDS 2018 dataset lists a new range of attacks generated from real-world traffic features such as Distributed Denial of Ser-vice, Denial of Service, Brute Force, XSS, SQL Injection, Botnet, Web Attack, and Infil-tration. This dataset is comprehensive, and it overcomes all the shortcomings of the previously used suboptimal datasets. CIC-IDS 2018 is a massive dataset that reflects 14 modern-day attacks having more than 16 million rows and 80 features [24]. Some of the features are listed in Table 2. The complete list of the features is given in Appendix 1.
The CIC-IDS2018 dataset is a mix of malicious and benign traffic. The distribution of various attacks in the dataset is given in Fig. 1. The different attack categories present in the dataset are listed in Table 3.
Data preparation
Data preprocessing
In this initial stage, the dataset was pre-processed. Data wrangling was performed on the complete dataset to prepare the data for further computation. The dataset was then relabeled into just two classes: attack and benign. The null values were dropped from the dataset, reducing the count from 16.2 million to 16.1 million. Four columns, Timestamp, IP address, Flow Id, and Source Port were dropped from the dataset. The timestamp col-umn recorded the attack time, whereas the IP address recorded the IP address of the source and the destination machine. The trained models should not be biased against
Table 2 Some of the features in the CIC-IDS 2018 Dataset
Feature Description Feature Description
fl_dur Flow duration bw_iat_tot Total time between two packets sent in the backward direction
tot_fw_pk Total packets in the forward direction bw_iat_avg Mean of the time between two packets sent in the backward direction
tot_bw_pk Total packets in the backward direction bw_iat_std Standard deviation time between two packets sent in the backward direction
tot_l_fw_pkt Total size of the packet in the forward direction
bw_iat_max Maximum time between two packets sent in the backward direction
Fig. 1 Distribution of different categories of attacks in the dataset

Page 11 of 28Seth et al. J Big Data (2021) 8:111
the IP address or time of the attack, so both the columns are dropped. The Source port column that had the port no of the source machine from where the attack is originated is also dropped.
As CIC-IDS 2018 dataset was highly skewed with 2,746,934 attacks and 13,390,235 benign samples. Normal traffic data in the dataset is under-sampled to balance the data-set that decreases the imbalance to an acceptable level, as given in Table 4. Further, the outliers of the dataset are removed using the Isolation Forest technique using 0.1 con-tamination. After outlier removal, the dataset is reduced to 5.5 million samples.
Feature selection and dimensionality reduction
The basic and the most important step to build a machine learning model is feature selection. The main objective of feature selection is to select relevant features that can contribute to make the right prediction [9]. Feature selection and reduction of the unde-sired features in a dataset is one of the most important factors that affect the efficiency of a classifier [25]. Unnecessary features in a model can not only decrease the accuracy but can also increase the prediction time. Therefore, feature selection is a vital step while designing a machine learning model as the dropping of important features as well as the inclusion of unnecessary features can affect the system’s performance.
There are numerous methods and techniques to minimize the data size [26]. Fea-ture selection can be mainly classified into filter method, wrapper method, embed-ded method. Filter methods use statistical tests like Fisher Score, Correlation, ANOVA (Analysis of Variance). The wrapper method is based on the performance of the model on the dataset. The wrapper method includes Forward Selection, Backward Elimination, and Exhaustive Feature Selection techniques. The embedded approach combines the Fil-ter and the Wrapper method by performing feature selection and classification simulta-neously. Besides the various feature selection techniques, dimensionality reduction can
Table 3 The attacks in the dataset are broadly classified into 5 categories
Attack Description
Brute Force attack Brute Force is an exhaustive attack in which the hacker tries all the possible combina-tions to break into a system
Denial of Service (DoS) DoS is one of the most common attacks in the cyber world. It is a cyber-attack in which the perpetrator launches an attack to make the victim machine or a resource unavail-able to the users by flooding the target with massive traffic
Distributed Denial of Service ( DDoS)
DDoS is similar to DoS, and it disrupts the service of the victim machine by sending massive fake traffic to multiple devices on the network
Infiltration Attacks In this attack, the attacker successfully compromises the victim’s machine by exploiting the existing system’s vulnerabilities
SQL Injection Attacks The attacker uses SQL Injection attacks to retrieve unauthorized access to sensitive data by using SQL queries
Table 4 Attack and benign samples before and after data preprocessing
Before preprocessing After preprocessing
Attack 2,746,934 2,674,783
Benign 13,390,235 2,851,191
Page 12 of 28Seth et al. J Big Data (2021) 8:111
be used for high dimensional datasets for reducing the number of inputs to the model. In this section, we propose a novel hybrid approach using Random Forest and Princi-pal Component Analysis (PCA) to minimize the data set size while retaining important information.
Minimizing prediction latency using Hybrid Feature selection with Random Forests and PCA
An Artificial Intelligence(AI) model is useful only if it can be readily deployed in the real world. Predictions can be made both online and offline depending upon the appli-cation’s context where the AI model is used. In synchronous online real-time predic-tions where the sequence of further steps depends on the model’s prediction, time is also a very important parameter as prediction latency can significantly hamper the overall performance of the system. Prediction latency can be reduced at two levels: the model level and the serving level. At the model level, the latency can be decreased by reducing the number of input features or lowering the model’s complexity. At the serving level, the prediction lag can be reduced by caching the predictions. As intrusion detection requires forecasts in real-time, the proposed method aims at reducing the prediction lag at the model level. The number of features selected has a considerable impact on the execution time [27]. So, to reduce the prediction lag, hybrid feature selection is pro-posed that decreases the no of input features while retaining the important information.
In this hybrid approach, first features are selected using Random Forests, and then dimensionality reduction is applied using PCA. The proposed method uses Random Forest for feature selection in the first step as Random Forest gives the highest accuracy as given in Table 9 followed by dimensionality reduction using PCA as PCA gave the least prediction latency. Feature selection for dimensionality reduction is applied to get better results by removing irrelevant features and redundant information [23]. The pro-posed hybrid approach is faster in comparison to both Random Forests and PCA used individually. The approach follows the steps below.
1. Select the relevant features using Random Forests.2. Compute principal components for the selected features in step 1 using PCA.3. Select the topmost significant principal components for further training the model.
Feature selection using Random Forests
Many feature selection techniques are available but our proposed method using Random Forest as a part of the hybrid feature selection process due to the high accuracy obtained using this technique as listed in Table 9. Random Forests technique uses a collection of decision tree classifiers. Each tree in the forest is built by training it on a bootstrapped sample from the original dataset. The split attribute in the individual trees is purely ran-dom and divides the dataset further into two classes based on impurity. Gini index or Information gain/entropy are used as impurity measures to split the data. While train-ing the tree, it can be calculated how much each feature in the dataset affected the tree’s impurity. Feature importance is calculated based on the aggregate impurity measure of each feature in a tree in the forest.
Page 13 of 28Seth et al. J Big Data (2021) 8:111
By using this method on the dataset, 37 most important features were extracted. These features are listed in Table 5.
Dimensionality Reduction using Principal Component Analysis (PCA)
To solve the problem of high dimensional datasets, the dimensionality reduction technique [28] is used. PCA technique is used to compress the massive dataset fea-tures into a smaller subspace maintaining all the valuable information. PCA intends to discover the direction of max variance in high-dimensional information, and it reduces it into another subspace with equivalent or fewer measurements than the first one. Supposing that x is an eigenvector of the covariance matrix of PCA, the feature extraction result, for x, of an arbitrary sample vector a is
where x = [x1...xN ]T , a = [a1...aN ]T and N is the dimensionality of sample vectors [29].Steps for using PCA for dimensionality reduction are as follows:
1. Scaling The Continous Values
It’s essential to scale the continuous variables before calculating PCA as the method is quite sensitive to variance of values in different variables.
2. Calculate The Covariance Matrix The covariance matrix is calculated to identify any relationship between the variables3. Calculate The Eigenvalues And Eigen Vectors To Find The Principal Components Eigenvalues and eigenvectors are computed from the covariance matrix to calculate
the given information’s principal components.4. Feature Vector Based on the eigenvalues and eigenvectors calculated in step 4, the most significant
principal components are selected for further processing.PCA is applied on the dataset with 37 features selected after using the Random
Forests approach. In this hybrid approach, 99.9% explained variance was given by 24
(1)z = aTx =
∑N
i=1aixi
Table 5 Selected features using Random Forests feature selection in the CIC-IDS 2018 Dataset
Selected features
Dst Port’ ’Flow IAT Max’ ’Fwd Pkts/s’ ’Init Bwd Win Byts’
’Flow Duration’ ’Flow IAT Min’ ’Bwd Pkts/s’ ’Fwd Seg Size Min’
’Tot Bwd Pkts’ ’Fwd IAT Tot’ ’Pkt Len Max’ ’Idle Mean’
’TotLen Fwd Pkts’ ’Fwd IAT Mean’ ’Pkt Len Mean’ ’Idle Max
’TotLen Bwd Pkts’ ’Fwd IAT Std’ ’RST Flag Cnt’ ’Flow Pkts/s’
’Fwd Pkt Len Max’ ’Fwd IAT Max’ ’ACK Flag Cnt’ ’Flow IAT Mean’
’Fwd Pkt Len Mean’ ’Fwd IAT Min’ ’Pkt Size Avg’ ’Fwd Header Len’
’Bwd Pkt Len Max’ ’Bwd IAT Std’ ’Fwd Seg Size Avg’ ’Bwd Header Len’
’Flow Byts/s’ ’Bwd IAT Max’ ’Subflow Fwd Byts’ ’Init Fwd Win Byts’
’Subflow Bwd Pkts’

Page 14 of 28Seth et al. J Big Data (2021) 8:111
individual principal components. Whereas, when only PCA was applied to the entire CIC-IDS 2018 dataset, 40 significant principal components gave 99% variance.
Thus, the number of principal components dropped from 40 principal components to 24 principal components. This hybrid approach reduces the number of principal com-ponents by 40% in comparison to using just PCA. In comparison to Random Forests feature selection, the input to the model is reduced from 37 features to 24 principal com-ponents, giving a decrease of 36.35%.
Training the classifier
For AI-based IDS to detect abnormal traffic trends, the system can be trained using machine learning algorithms. The literature offers various machine learning approaches. In this paper, five machine learning algorithms, namely, Random Forests, Extra Trees, XGBoost, KNN, Histogram Gradient Boosting, KNN, and LightGBM, are compared for Accuracy, Recall, Sensitivity, Specificity, F-Measure, model Building Time, and the Prediction Latency. The following paragraphs briefly discuss the machine learning algorithms.
Random Forest
Random Forests(RF) was propounded by Breiman [30]. RF is an ensemble of decision tree classifiers where each tree contributes its vote to predict the result. Random forests are an effective tool in prediction. Random Forests do not overfit the data as per the law of large numbers. Random forest is built by combining the results of decision trees in the forest. Each decision tree is trained on a randomly selected column of a bootstrapped subset of the original dataset. The model is then cross-validated using the out-of-bag samples.
Extra trees
Extra trees are Extremely Randomized Trees that use ensemble techniques to aggre-gate numerous decor-related trees in the forest for the final output [31]. It is different from other tree-based ensembles as the cut points for splitting the nodes are selected absolutely randomly, and trees are not grown on a bootstrapped sample instead on the complete learning sample. Extra trees are computationally more efficient than Random Forest.
XGB classifier
XGB is Extreme Gradient Boosting, basically, a tree-based ensemble that uses Gradi-ent Boosting for enhancing speed and performance. XGB optimizes the Gradient Boost-ing by Tree Pruning, Regularization, Parallel Processing, and handling missing values to avoid overfitting. It uses parallel tree learning based on a Sparsity-Aware algorithm and a Cache-Aware block structure for tree learning. It supports Gradient Boosting, Stochas-tic Gradient Boosting, and Regularized Gradient Boosting with L1 and L2 regulariza-tion. XGB computes much faster with lesser resources, 10× faster than the scikit library [32].

Page 15 of 28Seth et al. J Big Data (2021) 8:111
LightGBM
LightGBM is a boosting framework proposed by Microsoft in 2017. This framework fea-tures improved performance, speed, and power than Xgboost. Under the hood, Micro-soft’s new model is a collection of multiple Decision Trees. Its method to calculate the variation gain is different from other Gradient Boosting Decision tree models. LightG-BM’s method occurs under strong and weak learners (big and small gradients, gi). For arranging the training instances, the absolute value of their gradients is used, organized in descending order. LightGBM uses Gradient-based One-Side Sampling (GOSS) and Exclusive Feature Bundling (EFB) for faster processing and is 20 times faster in compari-son to Gradient Boosting Decision tree with the same Accuracy [33].
Histogram based gradient boosting
Gradient Boosting is an ensemble of decision trees but is slow for training the models. But the training process of the trees can be significantly enhanced by binning the con-tinuous input variables. Gradient boosting that uses the binning technique to speed up the model training are histogram-based Gradient Boosting ensembles. It is inspired by LightGBM by Microsoft and is currently available in the scikit library.
k‑ nearest neighbor (KNN)
kNN [10] is a supervised machine learning algorithm. A class in the kNN classifier is predicted based on the most frequent classes among the k neighbors. The k nearest neighbors are selected based on the distance between the data point and the original samples in the dataset. Euclidean, Manhattan, or Minkowski functions may be used for calculating the distance between points as given in the equations below.
N is the dataset’s size, p is an integer with positive values, and xp and yp are the data coordinates.
Evaluation metrics
The proposed system’s performance is evaluated using metrics: Accuracy, Precision, Recall, F- Measure, model Training Time, and Prediction Latency. These metrics are cal-culated with the following Eqs. (5, 6, 7, 8, 9) using different negative and positive cases as TP—True positive, TN—True Negative, FP—False Positive, N—alse Negative.
Accuracy is the percentage of samples correctly predicted as benign and attack.
(2)Euclidean =
√
∑N
p=1
(
xp − yp)2
(3)Manhattan =
∑N
p=1
∣
∣xp − yp∣
∣
(4)Minkowski =
(
∑N
p=1
(∣
∣xp − yp∣
∣
)k)
1k

Page 16 of 28Seth et al. J Big Data (2021) 8:111
Sensitivity is the percentage of samples correctly classified as attacks out of all the attack samples.
Specificity is the percentage of samples correctly classified as benign out of all the benign samples.
Precision is the percentage of correctly classified samples of attacks out of all the sam-ples classified as attacks.
F-Measure is the harmonic mean of both precision and recall.
Security managers tend to eliminate false negatives in a system for greater security and improved results, even if false positives are increased [23]. False positives result in the use of additional resources, whereas false negatives can debilitate the entire system. Prediction latency for classification is also of paramount importance in real-time Intru-sion Detection systems as delay in classification can greatly hamper the user experience. Thus, for building an efficient IDS, it is essential to strike the right balance of attack pre-diction efficiency and prediction latency.
Model building time and prediction latency are calculated for all the models. The time is calculated by finding the difference between the start and the end time on the server while training and testing the classifier in each fold during tenfold cross-validation. The time is calculated for the training and testing of 552,345 samples in each fold.
Prediction performance and the prediction latency of the trained models using differ-ent feature selection techniques and machine learning algorithms are compared in Sect. “Result and analysis”.
Experimental setup
All the experiments are conducted on the latest CIC-IDS 2018 dataset. k-fold Cross-Val-idation with the value of k as 10 was used to reduce the uncertainty of the findings due to the random generation of training and testing samples. Each fold was further divided
(5)Accuracy =TP + TN
TP + FN + TN + FP
(6)Senstivity =TP
TP + FN
(7)Specificity =TN
TN + FP
(8)Percision =TP
TP + FP
(9)F −Measure = 2 ∗Precision ∗ Senstivity
Precision+ Senstivity
Prediction latency = Average time taken to predict the class for test set in each fold.
Training time = Average time taken to train the model per fold.
Page 17 of 28Seth et al. J Big Data (2021) 8:111
into training and testing samples. The proposed system was implemented using the Scikit Library in Python. All the experiments are performed on the cloud using AWS. The cloud instance configuration used for the experimentation is 32 vcpu(Virtual CPU) and 256 GB RAM. Complete experiment environment details are given in Table 6.
Results and analysisDescriptive analysis of CIC‑IDS 2018 dataset
In this section an in-depth analysis of features of the dataset was performed. This paper lists a comparison of 10 features. This analysis has given a deep insight into how mali-cious and benign traffic varies in various network attacks.
Feature analysis
a) Destination port The destination port is the port no of the target machine. Figure 2 exhibits the port numbers used during various attacks. It is observed that port 80 is the most attacked port as approximately 65% of attacks were made on this port. 98% of BOT attacks were on port 8080. 75% of Brute Force attacks were performed on port 80, 20% on port 500, and remaining on various other ports. 97% of the Brute Force XSS sessions were performed on Port 80. All DoS, DDoS, FTP Bruteforce, and
Table 6 Experiment environment configuration
Hardware Properties
VCPU 32
Platform Amazon Linux(Version 31.0)
Memory 256 GB
Internal storage 24* 1980 GB
Network performance 25 GIGABIT
Fig. 2 Ports used during various attacks

Page 18 of 28Seth et al. J Big Data (2021) 8:111
SQL Injection attacks were performed on port no 80. All SSH Brute Force attacks used port no 22. Infiltration attacks were performed using various ports. The top 10 ports used during the infiltration attacks are listed in Fig. 3. Maximum infiltration attacks were performed on port no 53.
b) Table 7 describes salient features identified in the CIC-IDS 2018 dataset, where Q1-First quartile- the lowest 25% of the values, Q2-Second quartile- values between 25.1% and 50%(median), Q3-Third quartile: values between 51 and 75% (above the median), Q4-The top 25% of values
Key analytical outcomes of feature analysis based on CIC-IDS 2018 dataset are as follows:
1) 65% of attackers used port no 80 to perform the attack2) Benign sessions have a higher rate of flow Bytes/s in comparison to malicious ses-
sions.3) 50% of attack sessions in the dataset had 0 flow bytes/s4) 50% of the malicious sessions had empty packets sent to the server5) In 50% of the malicious sessions, no packet was sent back from the server to the
attacker6) The average number of packets in a sub-flow in the forward and backward direction
is zero7) The number of bytes sent in the initial window in the forward direction on average is
higher in attack sessions in comparison to benign sessions
Results justifying reduced prediction latency using hybrid feature selection technique
In addition to improving optimization metrics, reducing the models’ prediction latency is particularly necessary for machine learning models to be deployed in the real-time environment. The previous research done in this field is based on just optimizing met-rics, whereas reducing the prediction latency in real-time is missing [34]. This paper pro-poses a hybrid feature selection technique using Random Forests and PCA that lowers the prediction latency of different machine learning algorithms. In this approach, first, essential features are calculated using Random Forests feature selection. Then, Principal
Fig. 3 Ports used in Infiltration attacks
Page 19 of 28Seth et al. J Big Data (2021) 8:111
Tabl
e 7
Ana
lysi
s of
sal
ient
Fea
ture
s in
CIC
-IDS
2018
Dat
aset
Des
crip
tion
Beni
gnA
ttac
k
Q1
Q2
Q3
Q4
Q1
Q2
Q3
Q4
Tota
l Bac
kwar
d Pa
cket
s (P
acke
ts s
ent i
n th
e ba
ckw
ard
dire
ctio
n)1.
01.
05.
012
3118
.00.
00.
04.
018
818.
0
Tota
l Len
gth
Forw
ard
Pack
ets
(Tot
al s
ize
of p
acke
ts in
For
war
d di
rect
ion
30.0
52.0
865.
014
4391
,846
.00.
00.
020
.099
0812
8.0
Flow
Byt
es/
Sec
(Num
ber o
f byt
es tr
ansf
erre
d pe
r sec
ond)
10.7
066
1158
.628
710
2761
.721
218
0664
2857
.142
0.0
0.0
696.
3013
414
2740
0000
0.0
Bwd
Pkts
(Num
ber O
f Bac
kwar
d Pa
cket
s/Se
c)0.
1722
4.43
961
896.
0573
2000
000.
00.
00.
035
1.06
1962
3999
9997
2000
000.
0
Pack
et S
ize
Avg
(Ave
rage
siz
e of
the
pack
et)
12.8
7579
.015
3.5
1747
8.40
760.
00.
065
.014
56.4
3478
3
Forw
ard
Segm
ent S
ize
Avg
(Ave
rage
siz
e ob
serv
ed in
the
forw
ard
dire
ctio
n)10
.333
340
.075
.166
616
529.
3138
40.
00.
06.
6666
6666
714
56.3
5555
6
Subfl
ow F
orw
ard
Byte
s (A
vera
ge n
umbe
r of b
ytes
in a
sub
flow
in fo
rwar
d di
rect
ion)
30.0
52.0
865.
014
4391
846.
00.
00.
020
.099
0812
8.0
Subfl
ow B
wd
Pkts
(Ave
rage
num
ber o
f pac
kets
in a
sub
flow
in b
ackw
ard
dire
ctio
n)1.
01.
05.
012
3118
.00.
00.
04.
018
818.
0
Init
Fwd
Win
Byt
es(N
umbe
r of b
ytes
sen
t in
initi
al w
indo
w in
the
forw
ard
dire
ctio
n)1.
026
0.0
8192
.065
535.
010
24.0
8192
.032
738.
065
535.
0
Page 20 of 28Seth et al. J Big Data (2021) 8:111
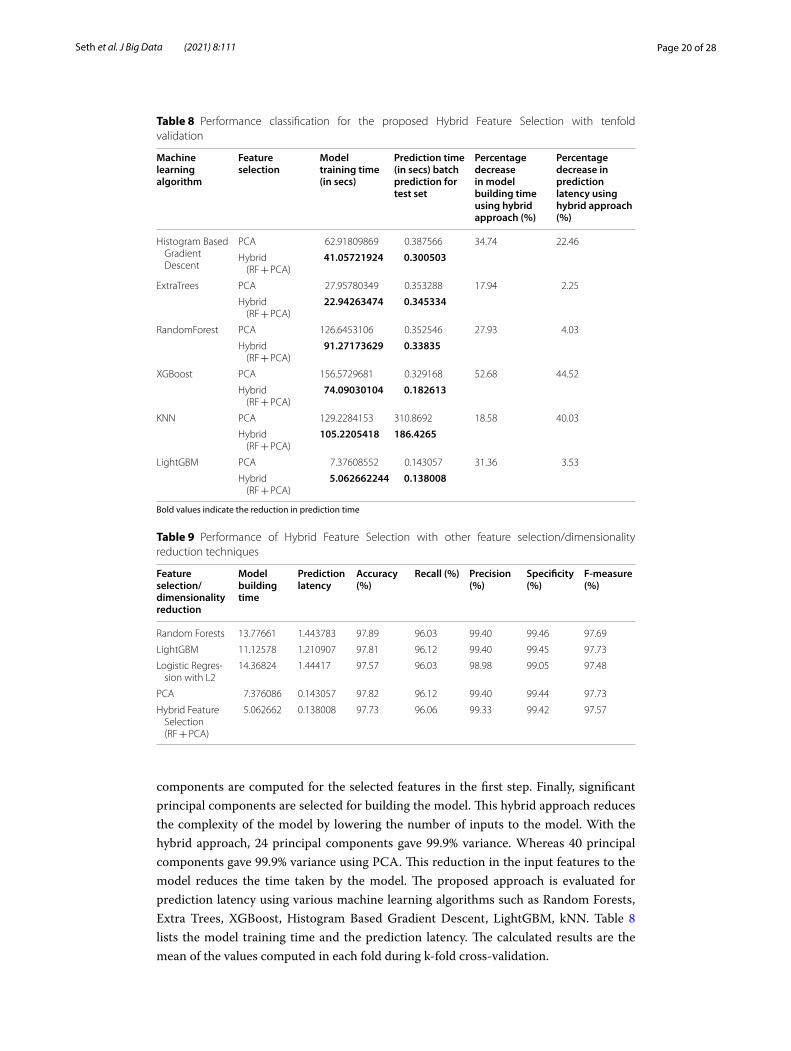
components are computed for the selected features in the first step. Finally, significant principal components are selected for building the model. This hybrid approach reduces the complexity of the model by lowering the number of inputs to the model. With the hybrid approach, 24 principal components gave 99.9% variance. Whereas 40 principal components gave 99.9% variance using PCA. This reduction in the input features to the model reduces the time taken by the model. The proposed approach is evaluated for prediction latency using various machine learning algorithms such as Random Forests, Extra Trees, XGBoost, Histogram Based Gradient Descent, LightGBM, kNN. Table 8 lists the model training time and the prediction latency. The calculated results are the mean of the values computed in each fold during k-fold cross-validation.
Table 8 Performance classification for the proposed Hybrid Feature Selection with tenfold validation
Bold values indicate the reduction in prediction time
Machine learning algorithm
Feature selection
Model training time (in secs)
Prediction time (in secs) batch prediction for test set
Percentage decrease in model building time using hybrid approach (%)
Percentage decrease in prediction latency using hybrid approach (%)
Histogram Based Gradient Descent
PCA 62.91809869 0.387566 34.74 22.46
Hybrid (RF + PCA)
41.05721924 0.300503
ExtraTrees PCA 27.95780349 0.353288 17.94 2.25
Hybrid (RF + PCA)
22.94263474 0.345334
RandomForest PCA 126.6453106 0.352546 27.93 4.03
Hybrid (RF + PCA)
91.27173629 0.33835
XGBoost PCA 156.5729681 0.329168 52.68 44.52
Hybrid (RF + PCA)
74.09030104 0.182613
KNN PCA 129.2284153 310.8692 18.58 40.03
Hybrid (RF + PCA)
105.2205418 186.4265
LightGBM PCA 7.37608552 0.143057 31.36 3.53
Hybrid (RF + PCA)
5.062662244 0.138008
Table 9 Performance of Hybrid Feature Selection with other feature selection/dimensionality reduction techniques
Feature selection/dimensionality reduction
Model building time
Prediction latency
Accuracy (%)
Recall (%) Precision (%)
Specificity (%)
F‑measure (%)
Random Forests 13.77661 1.443783 97.89 96.03 99.40 99.46 97.69
LightGBM 11.12578 1.210907 97.81 96.12 99.40 99.45 97.73
Logistic Regres-sion with L2
14.36824 1.44417 97.57 96.03 98.98 99.05 97.48
PCA 7.376086 0.143057 97.82 96.12 99.40 99.44 97.73
Hybrid Feature Selection (RF + PCA)
5.062662 0.138008 97.73 96.06 99.33 99.42 97.57

Page 21 of 28Seth et al. J Big Data (2021) 8:111
From the results in Table 8, LightGBM is the fastest model with a prediction time of 1.38008 s using the proposed hybrid feature selection approach. As shown in Table 8, the proposed Hybrid Feature selection is more rapid than models using just PCA. The bold values indicate the reduction in model training time and prediction time using the proposed approach. The prediction latency is decreased from 44.52% to 2.25%, and the model building time from 52.68% to 17.94% in various algorithms using the proposed hybrid approach.
Analysis of the results in comparison to other feature selection methods
To further evaluate our proposed approach, it is compared with well-known feature selection methods, namely (Random Forests, Logistic Regression using regularization, LightGBM, and PCA by experimenting on the CIC-IDS 2018 dataset. These methods were selected due to their popular utilization in the domain. We evaluate the results using six metrics: Prediction Latency, Accuracy, Recall, Precision, Specificity, and F-Measure. Table 9 shows the performance of our proposed hybrid feature selection approach with other feature selection methods.
As evident from the above table, the hybrid feature selection outperforms other feature selection techniques with the least prediction latency and prediction performance as good as the other techniques. While observing Prediction Latency and model Building Time, the worst feature selection method in this context is the Logistics Regression with L2.
Analysis of the proposed model with the other machine learning algorithms.
To evaluate our proposed model’s performance, experiments were conducted using dif-ferent machine learning algorithms, namely, Random Forests, Extra Trees, XGBoost, Histogram Gradient Boosting and kNN, and LightGBM on CIC-IDS 2018 dataset. It is observed that dimensionality reduction techniques are faster in comparison to the other feature selection methods as shown in Table 9. All the machine learning algorithms are compared using PCA and the proposed Hybrid Feature selection method. Table 10 pre-sents the attack detection performance comparing the prediction latency and optimizing metrics and for various machine learning algorithms.
Table 10 Comparison of the Proposed model with other machine learning algorithms
Feature selection
Prediction latency
Accuracy (%)
Recall (%) Precision (%)
Specificity (%)
F‑measure (%)
Histogram Gra-dient Boosting
PCA 0.387566 97.64 96.19 98.93 99.02 97.54
Hybrid 0.300503 97.80 96.04 99.36 99.43 97.67
ExtraTrees PCA 0.353288 92.81 93.77 91.72 91.89 92.74
Hybrid 0.345334 91.98 93.24 90.26 90.85 91.72
RandomForest PCA 0.352546 97.65 95.99 99.16 99.2 97.55
Hybrid 0.33835 97.34 95.67 98.74 98.88 97.18
XGBoost PCA 0.329168 97.50 95.61 99.24 99.30 97.39
Hybrid 0.182613 96.97 94.79 98.82 98.96 96.77
KNN PCA 310.8692 97.47 96.30 98.49 98.59 97.38
Hybrid 186.4265 97.68 96.16 98.96 99.0 97.54
Light GBM + Hybrid feature selec-tion
PCA 0.143057 97.82 96.12 99.40 99.44 97.73
hybrid 0.138008 97.72 96.06 99.33 99.42 97.57
Page 22 of 28Seth et al. J Big Data (2021) 8:111
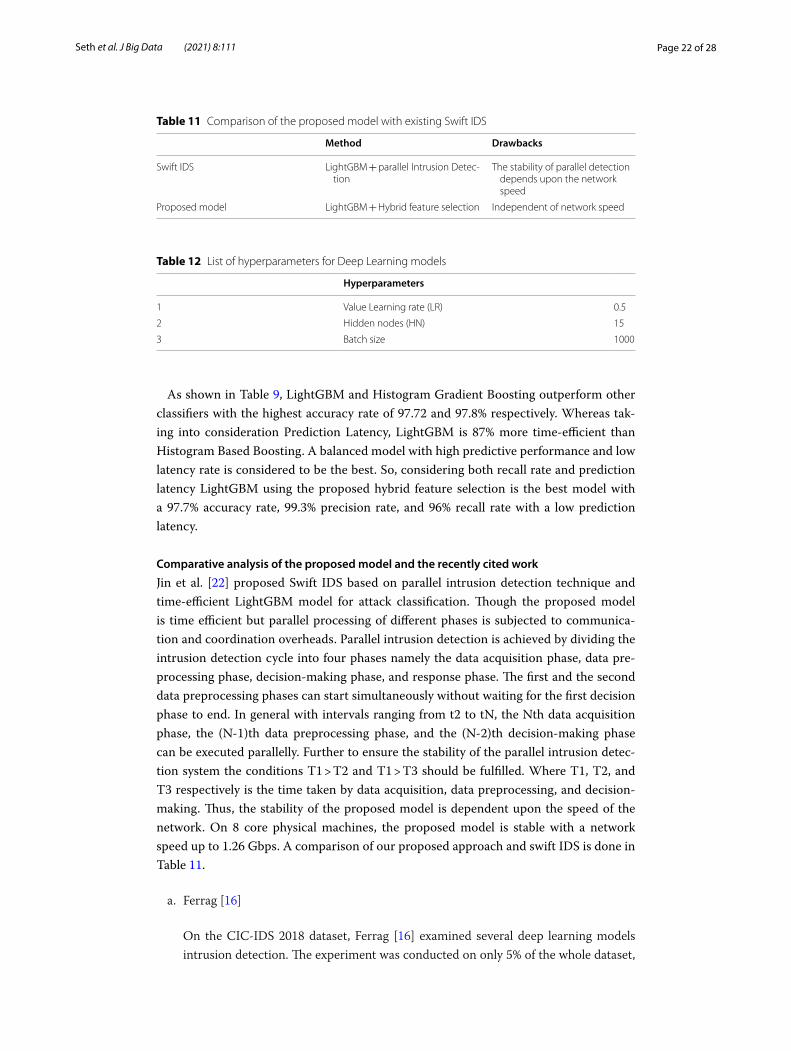
As shown in Table 9, LightGBM and Histogram Gradient Boosting outperform other classifiers with the highest accuracy rate of 97.72 and 97.8% respectively. Whereas tak-ing into consideration Prediction Latency, LightGBM is 87% more time-efficient than Histogram Based Boosting. A balanced model with high predictive performance and low latency rate is considered to be the best. So, considering both recall rate and prediction latency LightGBM using the proposed hybrid feature selection is the best model with a 97.7% accuracy rate, 99.3% precision rate, and 96% recall rate with a low prediction latency.
Comparative analysis of the proposed model and the recently cited work
Jin et al. [22] proposed Swift IDS based on parallel intrusion detection technique and time-efficient LightGBM model for attack classification. Though the proposed model is time efficient but parallel processing of different phases is subjected to communica-tion and coordination overheads. Parallel intrusion detection is achieved by dividing the intrusion detection cycle into four phases namely the data acquisition phase, data pre-processing phase, decision-making phase, and response phase. The first and the second data preprocessing phases can start simultaneously without waiting for the first decision phase to end. In general with intervals ranging from t2 to tN, the Nth data acquisition phase, the (N-1)th data preprocessing phase, and the (N-2)th decision-making phase can be executed parallelly. Further to ensure the stability of the parallel intrusion detec-tion system the conditions T1 > T2 and T1 > T3 should be fulfilled. Where T1, T2, and T3 respectively is the time taken by data acquisition, data preprocessing, and decision-making. Thus, the stability of the proposed model is dependent upon the speed of the network. On 8 core physical machines, the proposed model is stable with a network speed up to 1.26 Gbps. A comparison of our proposed approach and swift IDS is done in Table 11.
a. Ferrag [16]
On the CIC-IDS 2018 dataset, Ferrag [16] examined several deep learning models intrusion detection. The experiment was conducted on only 5% of the whole dataset,
Table 11 Comparison of the proposed model with existing Swift IDS
Method Drawbacks
Swift IDS LightGBM + parallel Intrusion Detec-tion
The stability of parallel detection depends upon the network speed
Proposed model LightGBM + Hybrid feature selection Independent of network speed
Table 12 List of hyperparameters for Deep Learning models
Hyperparameters
1 Value Learning rate (LR) 0.5
2 Hidden nodes (HN) 15
3 Batch size 1000
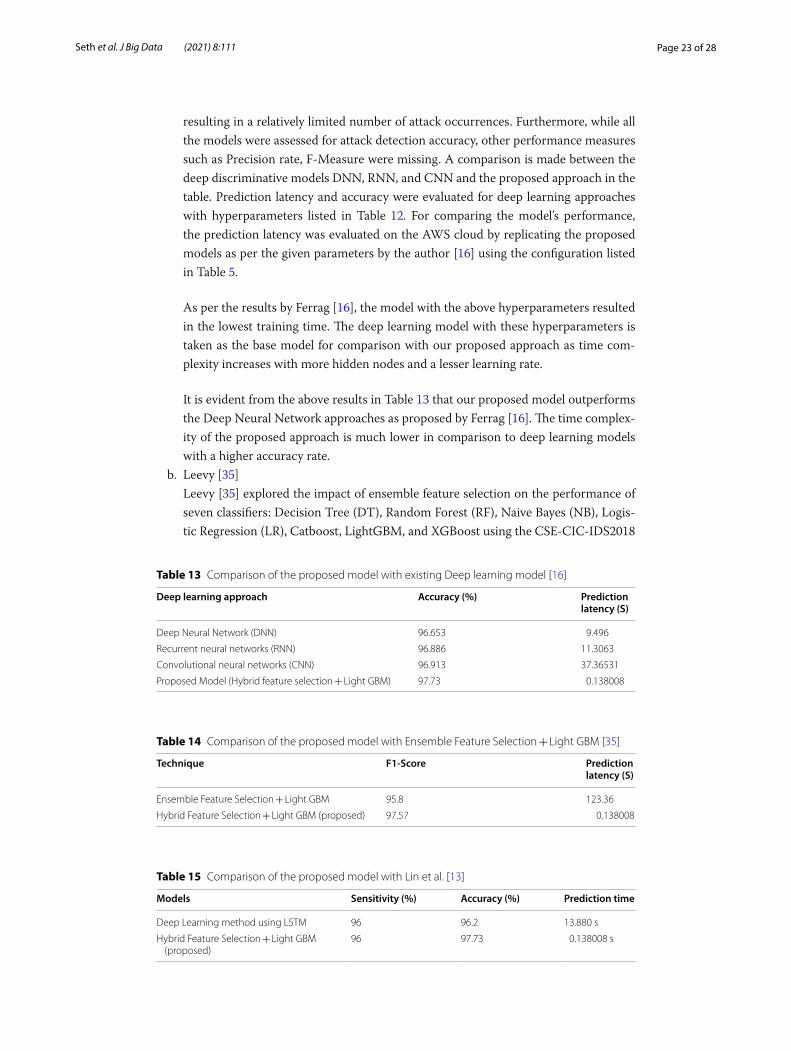
Page 23 of 28Seth et al. J Big Data (2021) 8:111
resulting in a relatively limited number of attack occurrences. Furthermore, while all the models were assessed for attack detection accuracy, other performance measures such as Precision rate, F-Measure were missing. A comparison is made between the deep discriminative models DNN, RNN, and CNN and the proposed approach in the table. Prediction latency and accuracy were evaluated for deep learning approaches with hyperparameters listed in Table 12. For comparing the model’s performance, the prediction latency was evaluated on the AWS cloud by replicating the proposed models as per the given parameters by the author [16] using the configuration listed in Table 5.
As per the results by Ferrag [16], the model with the above hyperparameters resulted in the lowest training time. The deep learning model with these hyperparameters is taken as the base model for comparison with our proposed approach as time com-plexity increases with more hidden nodes and a lesser learning rate.
It is evident from the above results in Table 13 that our proposed model outperforms the Deep Neural Network approaches as proposed by Ferrag [16]. The time complex-ity of the proposed approach is much lower in comparison to deep learning models with a higher accuracy rate.
b. Leevy [35] Leevy [35] explored the impact of ensemble feature selection on the performance of
seven classifiers: Decision Tree (DT), Random Forest (RF), Naive Bayes (NB), Logis-tic Regression (LR), Catboost, LightGBM, and XGBoost using the CSE-CIC-IDS2018
Table 13 Comparison of the proposed model with existing Deep learning model [16]
Deep learning approach Accuracy (%) Prediction latency (S)
Deep Neural Network (DNN) 96.653 9.496
Recurrent neural networks (RNN) 96.886 11.3063
Convolutional neural networks (CNN) 96.913 37.36531
Proposed Model (Hybrid feature selection + Light GBM) 97.73 0.138008
Table 14 Comparison of the proposed model with Ensemble Feature Selection + Light GBM [35]
Technique F1‑Score Prediction latency (S)
Ensemble Feature Selection + Light GBM 95.8 123.36
Hybrid Feature Selection + Light GBM (proposed) 97.57 0.138008
Table 15 Comparison of the proposed model with Lin et al. [13]
Models Sensitivity (%) Accuracy (%) Prediction time
Deep Learning method using LSTM 96 96.2 13.880 s
Hybrid Feature Selection + Light GBM (proposed)
96 97.73 0.138008 s
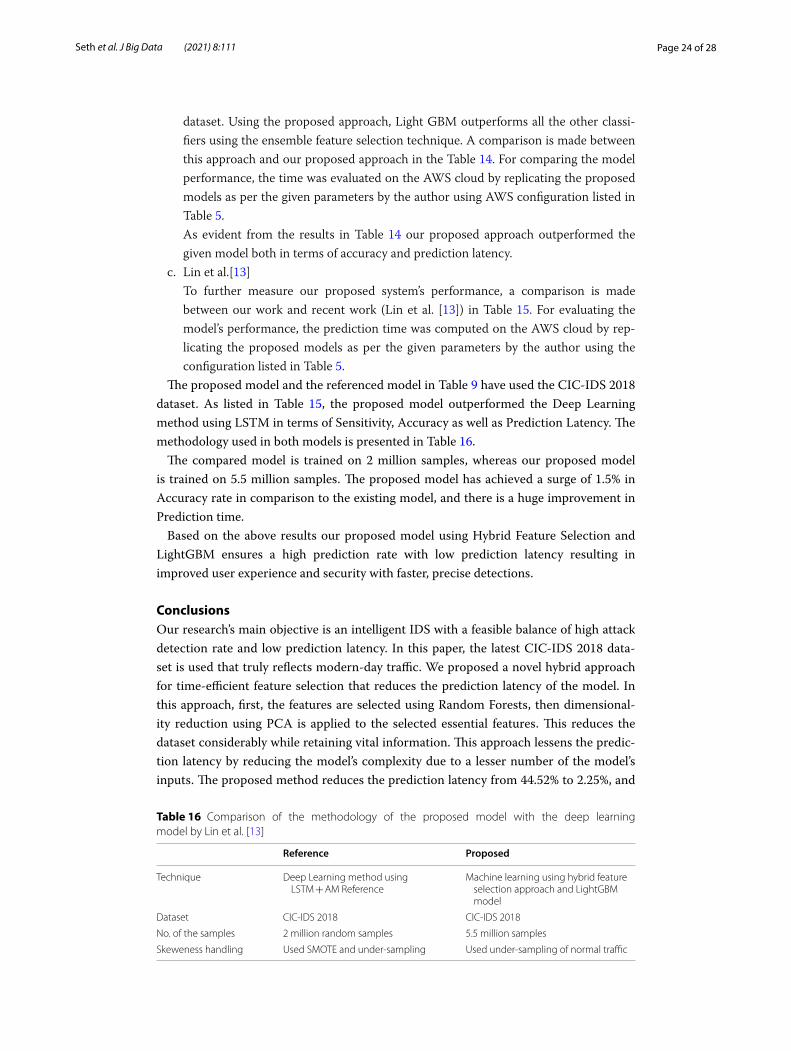
Page 24 of 28Seth et al. J Big Data (2021) 8:111
dataset. Using the proposed approach, Light GBM outperforms all the other classi-fiers using the ensemble feature selection technique. A comparison is made between this approach and our proposed approach in the Table 14. For comparing the model performance, the time was evaluated on the AWS cloud by replicating the proposed models as per the given parameters by the author using AWS configuration listed in Table 5.
As evident from the results in Table 14 our proposed approach outperformed the given model both in terms of accuracy and prediction latency.
c. Lin et al.[13] To further measure our proposed system’s performance, a comparison is made
between our work and recent work (Lin et al. [13]) in Table 15. For evaluating the model’s performance, the prediction time was computed on the AWS cloud by rep-licating the proposed models as per the given parameters by the author using the configuration listed in Table 5.
The proposed model and the referenced model in Table 9 have used the CIC-IDS 2018 dataset. As listed in Table 15, the proposed model outperformed the Deep Learning method using LSTM in terms of Sensitivity, Accuracy as well as Prediction Latency. The methodology used in both models is presented in Table 16.
The compared model is trained on 2 million samples, whereas our proposed model is trained on 5.5 million samples. The proposed model has achieved a surge of 1.5% in Accuracy rate in comparison to the existing model, and there is a huge improvement in Prediction time.
Based on the above results our proposed model using Hybrid Feature Selection and LightGBM ensures a high prediction rate with low prediction latency resulting in improved user experience and security with faster, precise detections.
ConclusionsOur research’s main objective is an intelligent IDS with a feasible balance of high attack detection rate and low prediction latency. In this paper, the latest CIC-IDS 2018 data-set is used that truly reflects modern-day traffic. We proposed a novel hybrid approach for time-efficient feature selection that reduces the prediction latency of the model. In this approach, first, the features are selected using Random Forests, then dimensional-ity reduction using PCA is applied to the selected essential features. This reduces the dataset considerably while retaining vital information. This approach lessens the predic-tion latency by reducing the model’s complexity due to a lesser number of the model’s inputs. The proposed method reduces the prediction latency from 44.52% to 2.25%, and
Table 16 Comparison of the methodology of the proposed model with the deep learning model by Lin et al. [13]
Reference Proposed
Technique Deep Learning method using LSTM + AM Reference
Machine learning using hybrid feature selection approach and LightGBM model
Dataset CIC-IDS 2018 CIC-IDS 2018
No. of the samples 2 million random samples 5.5 million samples
Skeweness handling Used SMOTE and under-sampling Used under-sampling of normal traffic
Page 25 of 28Seth et al. J Big Data (2021) 8:111
the model building time from 52.68% to 17.94% in various algorithms on the CIC-IDS 2018 dataset. Further, LightGBM, a fast gradient boosting framework, is used for attack classification. The resulting model is more accurate with a better attack detection rate, lower lag. It has a 97.73% accuracy rate, and it outperforms the results obtained in previ-ous research in this field. In addition to having a high accuracy rate, the proposed model offers low prediction latency. Besides this, an in-depth analysis of the network param-eters of benign and malicious sessions on the CIC-IDS 2018 dataset was made. Key find-ings of the analysis were (1) 65% of attackers used port no 80 to perform the attack. (2) Benign sessions have a higher flow duration compared to malicious sessions. (3) 50% of attack sessions in the dataset had 0 flow bytes/s (4) 50% of the malicious sessions had empty packets sent to the server. (5) In 50% of the hostile sessions, no packet was sent back from the server to the attacker.
In our future work, we plan to work on a multiclassification dataset to classify indi-vidual attacks correctly.
Appendix 1See Table 17.
Table 17 List of features in the CIC-IDS 2018 Dataset
Feature Description Feature Description
fl_dur Flow duration bw_iat_tot Total time between two packets sent in the backward direction
tot_fw_pk Total packets in the forward direction bw_iat_avg Mean time between two packets sent in the backward direction
tot_bw_pk Total packets in the backward direc-tion
bw_iat_std Standard deviation time between two packets sent in the backward direction
tot_l_fw_pkt Total size of packet in forward direc-tion
bw_iat_max Maximum time between two packets sent in the backward direction
fw_pkt_l_max Maximum size of packet in forward direction
idl_max Maximum time a flow was idle before becoming active
fw_pkt_l_min Minimum size of packet in forward direction
bw_iat_min Minimum time between two packets sent in the backward direction
fw_pkt_l_avg Average size of packet in forward direction
fw_psh_flag Number of times the PSH flag was set in packets travelling in the forward direction (0 for UDP)
fw_pkt_l_std Standard deviation size of packet in forward direction
bw_psh_flag Number of times the PSH flag was set in packets travelling in the backward direction (0 for UDP)
Bw_pkt_l_max Maximum size of packet in backward direction
fw_urg_flag Number of times the URG flag was set in packets travelling in the forward direction (0 for UDP)
Bw_pkt_l_min Minimum size of packet in backward direction
bw_urg_flag Number of times the URG flag was set in packets travelling in the backward direction (0 for UDP)
Bw_pkt_l_avg Mean size of packet in backward direction
fw_hdr_len Total bytes used for headers in the forward direction
Bw_pkt_l_std Standard deviation size of packet in backward direction
bw_hdr_len Total bytes used for headers in the forward direction
fl_byt_s flow byte rate that is number of packets transferred per second
fw_pkt_s Number of forward packets per second
Page 26 of 28Seth et al. J Big Data (2021) 8:111
AbbreviationsLightGBM: Light Gradient Boosting Machine; IDS: Intrusion Detection System; RF: Random Forest; Forest PA: For-est by Penalizing Attributes; AOP: Average of Probabilities; DT: Decision Tree; kNN: K Nearest Neighbor; GB: Gradient Boosting; LDA: Linear Discriminant Analysis; SMOTE: Synthetic Minority Oversampling Technique; GA-SVM: Genetic
Table 17 (continued)
Feature Description Feature Description
fl_pkt_s flow packets rate that is number of packets transferred per second
bw_pkt_s Number of backward packets per second
fl_iat_avg Average time between two flows pkt_len_min Minimum length of a flow
fl_iat_std Standard deviation time two flows pkt_len_max Maximum length of a flow
fl_iat_max Maximum time between two flows pkt_len_avg Mean length of a flow
fl_iat_min Minimum time between two flows pkt_len_std Standard deviation length of a flow
fw_iat_tot Total time between two packets sent in the forward direction
pkt_len_va Minimum inter-arrival time of packet
fw_iat_avg Mean time between two packets sent in the forward direction
fin_cnt Number of packets with FIN
fw_iat_std Standard deviation time between two packets sent in the forward direction
syn_cnt Number of packets with SYN
fw_iat_max Maximum time between two pack-ets sent in the forward direction
rst_cnt Number of packets with RST
fw_iat_min Minimum time between two pack-ets sent in the forward direction
pst_cnt Number of packets with PUSH
down_up_ratio Download and upload ratio ack_cnt Number of packets with ACK
pkt_size_avg Average size of packet urg_cnt Number of packets with URG
fw_seg_avg Average size observed in the forward direction
cwe_cnt Number of packets with CWE
bw_seg_avg Average size observed in the back-ward direction
ece_cnt Number of packets with ECE
fw_byt_blk_avg Average number of bytes bulk rate in the forward direction
subfl_fw_byt The average number of bytes in a sub flow in the forward direction
fw_pkt_blk_avg Average number of packets bulk rate in the forward direction
subfl_bw_pkt The average number of packets in a sub flow in the backward direction
fw_blk_rate_avg Average number of bulk rates in the forward direction
subfl_bw_byt The average number of bytes in a sub flow in the backward direction
bw_byt_blk_avg Average number of bytes bulk rate in the backward direction
fw_win_byt Number of bytes sent in initial window in the forward direction
bw_pkt_blk_avg Average number of packets bulk rate in the backward direction
bw_win_byt # of bytes sent in initial window in the backward direction
bw_blk_rate_avg Average number of bulk rate in the backward direction
Fw_act_pkt # of packets with at least 1 byte of TCP data payload in the forward direction
subfl_fw_pk The average number of packets in a sub flow in the forward direction
fw_seg_min Minimum segment size observed in the forward direction
tot_l_fw_pkt Total size of packet in forward direc-tion
atv_avg Mean time a flow was active before becoming idle
fw_pkt_l_max Maximum size of packet in forward direction
atv_std Standard deviation time a flow was active before becoming idle
atv_max Maximum time a flow was active before becoming idle
idl_min Minimum time a flow was idle before becoming active
atv_min Minimum time a flow was active before becoming idle
fl_dur Flow duration
idl_avg Mean time a flow was idle before becoming active
tot_fw_pk Total packets in the forward direction
idl_std Standard deviation time a flow was idle before becoming active
tot_bw_pk Total packets in the backward direc-tion
Page 27 of 28Seth et al. J Big Data (2021) 8:111
Algorithm- Support Vector Machine; PSO: Particle Swarm optimization; LSTM: Long Short-Term Memory; ROC: Receiver Operator Characteristic; ANOVA: Analysis of Variance; PCA: Principal Component Analysis; GOSS: Gradient-based One-Side Sampling; DNN: Deep Neural Network; RNN: Reccurent Neural network; CNN: Convulational Neural Network; BPNN: Backpropagation Neural Network; SC: Spectral Clustering.
AcknowledgementsNot applicable.
Authors’ contributionsSS did the experimentation. GS analyzed and interpreted the data. KKC was a major contributor in writing the manu-script. All authors read and approved the final manuscript.
FundingNot applicable.
Availability of data and materialsThe dataset analyzed during the current study is available at https:// www. unb. ca/ cic/ datas ets/ ids- 2018. html.
Declarations
Ethics approval and consent to participate.Not applicable.
Consent for publicationNot applicable.
Competing interestsThe authors declare that they have no competing interests.
Received: 25 January 2021 Accepted: 5 August 2021
References 1. Ahmadian Ramaki A, Rasoolzadegan A, Javan JA. A systematic review on intrusion detection based on the Hidden
Markov Model. Stat Anal Data Mining ASA Data Sci J. 2018;11(3):111–34. 2. Joldzic O, Djuric Z, Vuletic P. A transparent and scalable anomaly-based DoS detection method. Comput Netw.
2016;104:27–42. https:// doi. org/ 10. 1016/j. comnet. 2016. 05. 004. 3. Kaja N, Shaout A, Ma D. An intelligent intrusion detection system. Appl Intell Volume. 2019;49:3235–47. https:// doi.
org/ 10. 1007/ s10489- 019- 01436-1. 4. Thomas C, Sharma V, Balakrishnan N. Usefulness of DARPA dataset for intrusion detection system evaluation. Pro-
ceedings Volume 6973, Data Mining, Intrusion Detection, Information Assurance, and Data Networks Security. 2008. https:// doi. org/ 10. 1117/ 12. 777341
5. Siddique K, Akhtar Z, Aslam Khan F, Kim Y. KDD Cup 99 data sets: a perspective on the role of data sets in network intrusion detection research. Computer. 2019;52(2):41–51. https:// doi. org/ 10. 1109/ mc. 2018. 28887 64.
6. Song J, Takakura H, Okabe Y, Eto M, Inoue D, Nakao K. Statistical analysis of honeypot data and building of Kyoto 2006+ dataset for NIDS evaluation. Proc First Workshop Building Anal Datasets Gathering Exp Returns Secur. 2011;2011:29–36. https:// doi. org/ 10. 1145/ 19786 72. 19786 76.
7. Ingre B, Yadav A. Performance analysis of NSL-KDD dataset using ANN. 2015 International Conference on Signal Processing and Communication Engineering Systems. 2015. https:// doi. org/ 10. 1109/ spaces. 2015. 70582 23
8. Ridwan MA, Radzi NAM, Abdullah F, Jalil YE. Applications of machine learning in networking: a survey of current issues and future challenges. IEEE Access. 2021;9:52523–56. https:// doi. org/ 10. 1109/ ACCESS. 2021. 30692 10.
9. Zhou Y, Cheng G, Jiang S, Dai M. Building an efficient intrusion detection system based on feature selection and ensemble classifier. Comput Netw Volume. 2020. https:// doi. org/ 10. 1016/j. comnet. 2020. 107247.
10. Saleh AI, Talaat FM, Labib LM. A hybrid intrusion detection system (HIDS) based on prioritized k-nearest neigh-bors and optimized SVM classifiers. Artif Intell Rev. 2017;51:403–43. https:// doi. org/ 10. 1007/ s10462- 017- 9567-1.
11. Karatas G, Demir O, Sahingoz OK. Increasing the performance of machine learning-based IDSs on an imbal-anced and up-to-date dataset. IEEE Access. 2020;8:32150–62. https:// doi. org/ 10. 1109/ access. 2020. 29732 19.
12. Aslahi-Shahri B, Rahmani R, Chizari M, Maralani A, Eslami M, Golkar M, et al. A hybrid method consisting of GA and SVM for intrusion detection system. Neural Comput Appl. 2015;27(6):1669–76.
13. Lin P, Ye K, Xu C-Z. Dynamic network anomaly detection system by using deep learning techniques. Cloud Comput CLOUD 2019. 2019. https:// doi. org/ 10. 1007/ 978-3- 030- 23502-4_ 12.
14. Kanimozhi V, Prem Jacob T. Artificial Intelligence based Network Intrusion Detection with hyper-parameter optimization tuning on the realistic cyber dataset CSE-CIC-IDS2018 using cloud computing. ICT Express. 2019;5(3):211–4. https:// doi. org/ 10. 1016/j. icte. 2019. 03. 003.
15. Ma T, Wang F, Cheng J, Yu Y, Chen X. A hybrid spectral clustering and deep neural network ensemble algorithm for intrusion detection in sensor networks. Sensors. 2016;16(10):1701. https:// doi. org/ 10. 3390/ s1610 1701.
16. Ferrag MA, Maglaras L, Moschoyiannis S, Janicke H. Deep learning for cyber security intrusion detection: approaches, datasets, and comparative study. J Inform Security Appl. 2020;50:102419. https:// doi. org/ 10. 1016/j. jisa. 2019. 102419.
Page 28 of 28Seth et al. J Big Data (2021) 8:111
17. Atefinia R, Ahmadi M. Network intrusion detection using multi-architectural modular deep neural network. J Supercomput. 2020. https:// doi. org/ 10. 1007/ s11227- 020- 03410-y.
18. Vinayakumar R, Alazab M, Soman KP, Poornachandran P, Al-Nemrat A, Venkatraman S. Deep learning approach for intelligent intrusion detection system. IEEE Access. 2019;7:41525–50. https:// doi. org/ 10. 1109/ access. 2019. 28953 34.
19. Roshan S, Miche Y, Akusok A, Lendasse A. Adaptive and online network intrusion detection system using clustering and Extreme Learning Machines. J Franklin Inst. 2018;355(4):1752–79. https:// doi. org/ 10. 1016/j. jfran klin. 2017. 06. 006.
20. Ali MH, al Mohammed, B. A. D., Ismail, A., & Zolkipli, M. F. . A new intrusion detection system based on fast learn-ing network and particle swarm optimization. IEEE Access. 2018;6:20255–61. https:// doi. org/ 10. 1109/ access. 2018. 28200 92.
21. Aburomman A, Ibne RM. A novel SVM-kNN-PSO ensemble method for intrusion detection system. Appl Soft Comput. 2016;38:360–72.
22. Jin D, Lu Y, Qin J, Cheng Z, Mao Z. SwiftIDS: Real-time intrusion detection system based on LightGBM and parallel intrusion detection mechanism. Comput Security. 2020;97:101984. https:// doi. org/ 10. 1016/j. cose. 2020. 101984.
23. Liao H-J, Richard Lin C-H, Lin Y-C, Tung K-Y. Intrusion detection system: a comprehensive review. J Netw Comput Appl. 2013;36(1):16–24. https:// doi. org/ 10. 1016/j. jnca. 2012. 09. 004.
24. Thakkar A, Lohiya R. A review of the advancement in intrusion detection datasets. Procedia Comput Sci Volume. 2020;167:636–45. https:// doi. org/ 10. 1016/j. procs. 2020. 03. 330.
25. Aljawarneh S, Aldwairi M, Yassein M. Anomaly-based intrusion detection system through feature selection analysis and building hybrid efficient model. J Comput Sci. 2018;25:152–60.
26. Varma RKP, Kumari VV, Kumar SS. A survey of feature selection techniques in intrusion detection system: a soft computing perspective. Progress Comput Anal Netw. 2018. https:// doi. org/ 10. 1007/ 978- 981- 10- 7871-2_ 75.
27. Stiawan D, Idris MY, Bamhdi AM, Budiarto R. CIC-IDS-2017 dataset feature analysis with information gain for anomaly detection. IEEE Access. 2020;8:132911–21. https:// doi. org/ 10. 1109/ access. 2020. 30098 43.
28. Partridge M, Calvo R. Fast dimensionality reduction and simple PCA. Intell Data Anal. 1998;2(1–4):203–14. https:// doi. org/ 10. 1016/ s1088- 467x(98) 00024-9.
29. Song F, Guo Z, Mei D. Feature selection using principal component analysis. 2010 Int Conf Syst Sci Eng Design Manufacturing Inform. 2010. https:// doi. org/ 10. 1109/ icsem. 2010. 14.
30. Breiman L. Random forests. Mach Learn. 2001;45:5–32. https:// doi. org/ 10. 1023/A: 10109 33404 324. 31. Geurts P, Ernst D, Wehenkel L. Extremely randomized trees. Mach Learn. 2006;63:3–42. https:// doi. org/ 10. 1007/
s10994- 006- 6226-1. 32. Chen T, Guestrin C. XGBoost: A Scalable Tree Boosting System. Proceedings of the 22nd ACM SIGKDD International
Conference on Knowledge Discovery and Data Mining. p. 785–794. https:// doi. org/ 10. 1145/ 29396 72. 29397 85. 33. Ke G, Meng Q, Finely T, Wang T, Chen W, Ma W, Ye Q, Liu T-Y. LightGBM: A highly efficient gradient boosting decision
tree. advances in neural information processing systems 30 (NIP 2017); 2017. 34. Leevy JL, Khoshgoftaar TM. A survey and analysis of intrusion detection models based on CSE-CIC-IDS2018 Big Data.
J Big Data. 2020. https:// doi. org/ 10. 1186/ s40537- 020- 00382-x. 35. Leevy JL, Hancock J, Zuech R, Khoshgoftaar TM. Detecting cybersecurity attacks across different network features
and learners. J Big Data. 2021. https:// doi. org/ 10. 1186/ s40537- 021- 00426-w.
Publisher’s NoteSpringer Nature remains neutral with regard to jurisdictional claims in published maps and institutional affiliations.